
Abstract
The choice of blowing agent is very important in foaming processes. In an earlier work the use of molecular dynamics simulations for the estimation of the diffusion coefficients of different blowing agents was discussed at elevated temperatures above the melting point. Therein it was shown that these simulations can give valuable information on blowing agent diffusion in polypropylene. The aim of the recent work is to expand this discussion to the simulation of different influences like pressure, blowing agent mixtures and blowing agents with higher molecular weight at temperatures above the melting point of PP. First a pressure range applied on the combined system of polymer and blowing agent, reasonable for the foam processing is discussed and their influence on the diffusion coefficients for CO2 in polypropylene is evaluated via MD simulations. The next step is the investigation of the influence of mixing a blowing agent with a co-blowing agent. The last part is the presentation of diffusion coefficients for different organic solvents, namely 2-propanol, acetone, ethyl acetate and butyl acetate which could be used as potential co-blowing agents. For both, the change in pressure and the mixing of blowing agents for the systems in question only small influences on the diffusion coefficients was discovered. The results of the diffusion coefficients for the different organic solvents are compared to each other and with former results, considered different molecular structure, size and polarities and are found to be reasonable.
Keywords
Introduction
Modeling of the foaming process is an important field of modern research. 1 Therein, the development of a process model that can describe the melt flow in an extrusion die concerning the foam process, requires, amongst others, the knowledge of the diffusion coefficients for the different blowing agents.2,3 The diffusion coefficient for a blowing agent is often difficult to measure experimentally, especially in the range of elevated temperatures which are used in the foam process. Here molecular dynamics simulations (MD) can be of assistance, since these enable the determination of diffusion coefficients on a computer aided level as well as many other parameters. MD simulations are a widely used atomistic simulation method, based on solving the well-known equations of motion and are often used to determine diffusion coefficients.4–11 Han and Boyd investigated the diffusion of methane in atactic polypropylene and compared those results to earlier studies of the diffusion of methane in polyethylene and polyisobutylene. 4 The diffusion of He, Ar and CO2 in atactic polypropylene was studied by Cuthbert et al., with a focus on the system size and its influences on the diffusion coefficents. 5 Meunier carried out MD simulations to determine the diffusion coefficients of Ar, O2, N2, CO2 and CH4 in cis-1,4-polybutadiene in a temperature range of 250 – 400 K using a full atomistic potential and found its results in good agreement with experimental data. 6 Dutta and Bhatia focused on the estimation of the temperature dependence of the self-, corrected- and transport-diffusivities of CO2, CH4 and N2 in polyethylene via MD simulation. 7 Moreover, they investigated the polymer morphology via the intermolecular distribution function, free volume and pore size distribution. While the studies presented so far have mainly focused on the study of relatively small diffusing molecules, due to computational limitations, more recently the diffusive behavior of larger molecules has also been investigated by MD simulations. Fullerene in polyimides melts were investigated by Voglin et al., 8 who found different diffusion regimes ranging from ballistic, subdiffusive and normal diffusive. Another example is the work by Sun et al. who examined the diffusion of organic flavor molecules like D-limonene, myrcene and others in low density polyethylene. 9 Further recent studies focused on the leaching of molecules from packages for food contact materials. The focus in those studies were on the migration of bisphenol A from polycarbonate into food simulants 10 and the diffusion of dibutyl amine in poly(phenylene ether). 11 Chen et al. investigated the diffusion mechanism of nanofillers with different geometries by the use of molecular dynamics. 12 Kawada et al. used machine learning approaches to accelerate their simulations and used it to investigated water diffusion in a variety of different polymers. 13 In the field of fuel cells molecular dynamics is used to describe transport mechanisms in exchange membranes. For example, Kim et al. studied the hydroxide ion transport trough polymer films. 14 Some recent work concerns with the systematic study of alcohols as co-blowing agents with CO2 in polystyrene foams.15,16 Therein in the effect of blowing agents mixtures of CO2 combined with alcohols of different carbon chain length on the foaming of PS is studied. Among others they use MD to describe interaction energies between the molecules and dissipative particle dynamics (DPD) for the estimation of diffusion coefficients. 15 Diffusion coefficients are estimated for one temperature beneath the melting point. They found an increase in the diffusion coefficient with increasing number of carbons in the alcohols. 15 Further studies were concerned with the combination of CO2, alcohols as co-blowing agents and the addition of CO2-philic additives to optimize the foaming of polystyrene foams, again using MD and DPD to estimate interaction energies and diffusion coefficients respectively. 16 Gao et al. investigated the influence of different blowing agent combinations with CO2 and alcohols as also acetone on foaming of PP for a single temperature beneath the melting point. 17 This extract of examples shows how wide the distribution of applications is for the determination of diffusion coefficients in polymers via MD simulations.
In our previous work we applied full atomistic MD simulations to determine the diffusion coefficients for the blowing and co-blowing agents N2, CO2 and ethanol in polypropylene (PP) for different elevated temperatures above the melting point of PP. 18 The results for N2 and CO2 were compared with experimental values, while to the best of our knowledge no such experimental values for ethanol were available in the literature. The results for N2 and CO2 were found to be in good agreement with the literature values. For ethanol, as the diffusing species, the results could only be compared relatively to the other two diffusing species, mainly concerning the size difference between them. In this comparison it was found that as it would be expected the diffusion coefficient for ethanol was smaller than for the other two which is due to its bigger molecular size. In this regard the result for the ethanol molecule were judged to be reasonable. Thus, it could be shown that the determination of diffusion coefficients by means of MD simulations can reduce the experimental effort for the foam modelling.
N2 and CO2 were selected for the investigation of their diffusive behavior, because these two are, in contrast to blowing agents like chlorofluorocarbons, safe and environmentally friendly alternative blowing agents. However, since they have a lower solubility in polymers, cell defects may occur.19,20 One way to overcome this problem is by using co-blowing agents such as ethanol or 2-propanol.21–23 This is the reason why ethanol was chosen, due to its moderate molecular size, compared to 2-propanol which accounts for the high computational effort that correspond with the size of the molecules simulated.
For all these three compounds, the diffusion coefficients were determined at temperatures of 453 K, 473 K and 493 K which represent relevant processing temperatures of foam extrusion. However, all these simulations were done at pressures of 1 bar. Furthermore, solely the pure blowing agents respectively the co-blowing agent were investigated and there was no examination of the mixture of these. At this point the current work attaches and starts with the evaluation of the influence that different pressures and the mixing of blowing agents and co-blowing agents have on the diffusion coefficient in the PP melt. The pressure influence is investigated, by simulations for CO2 in PP for a pressure range of 50 to 200 bar. Mixing different diffusing species in the system is a relevant question since strong attractive or repulsive interactions of the molecules could lead to a decrease or increase in the diffusion coefficient and would have to be considered in the foam modelling. Furthermore diffusion coefficients are introduced for molecules with higher molecular weight than ethanol. These are acetone, 2-propanol, ethyl acetate and butyl acetate. Since to the best of our knowledge there are no experimental results of the diffusion coefficients for these molecules in PP, the results are judged relative to each other, concerning the size of the molecule, but also their polarities. All results are obtained by fully atomistic MD simulations.
Methodology
Computational details
All calculations in this work were carried out with the BIOVIA Materials Studio® software. In Figure 1 a flow chart is given to summarize the computational details. Flow chart to summarize the computational details.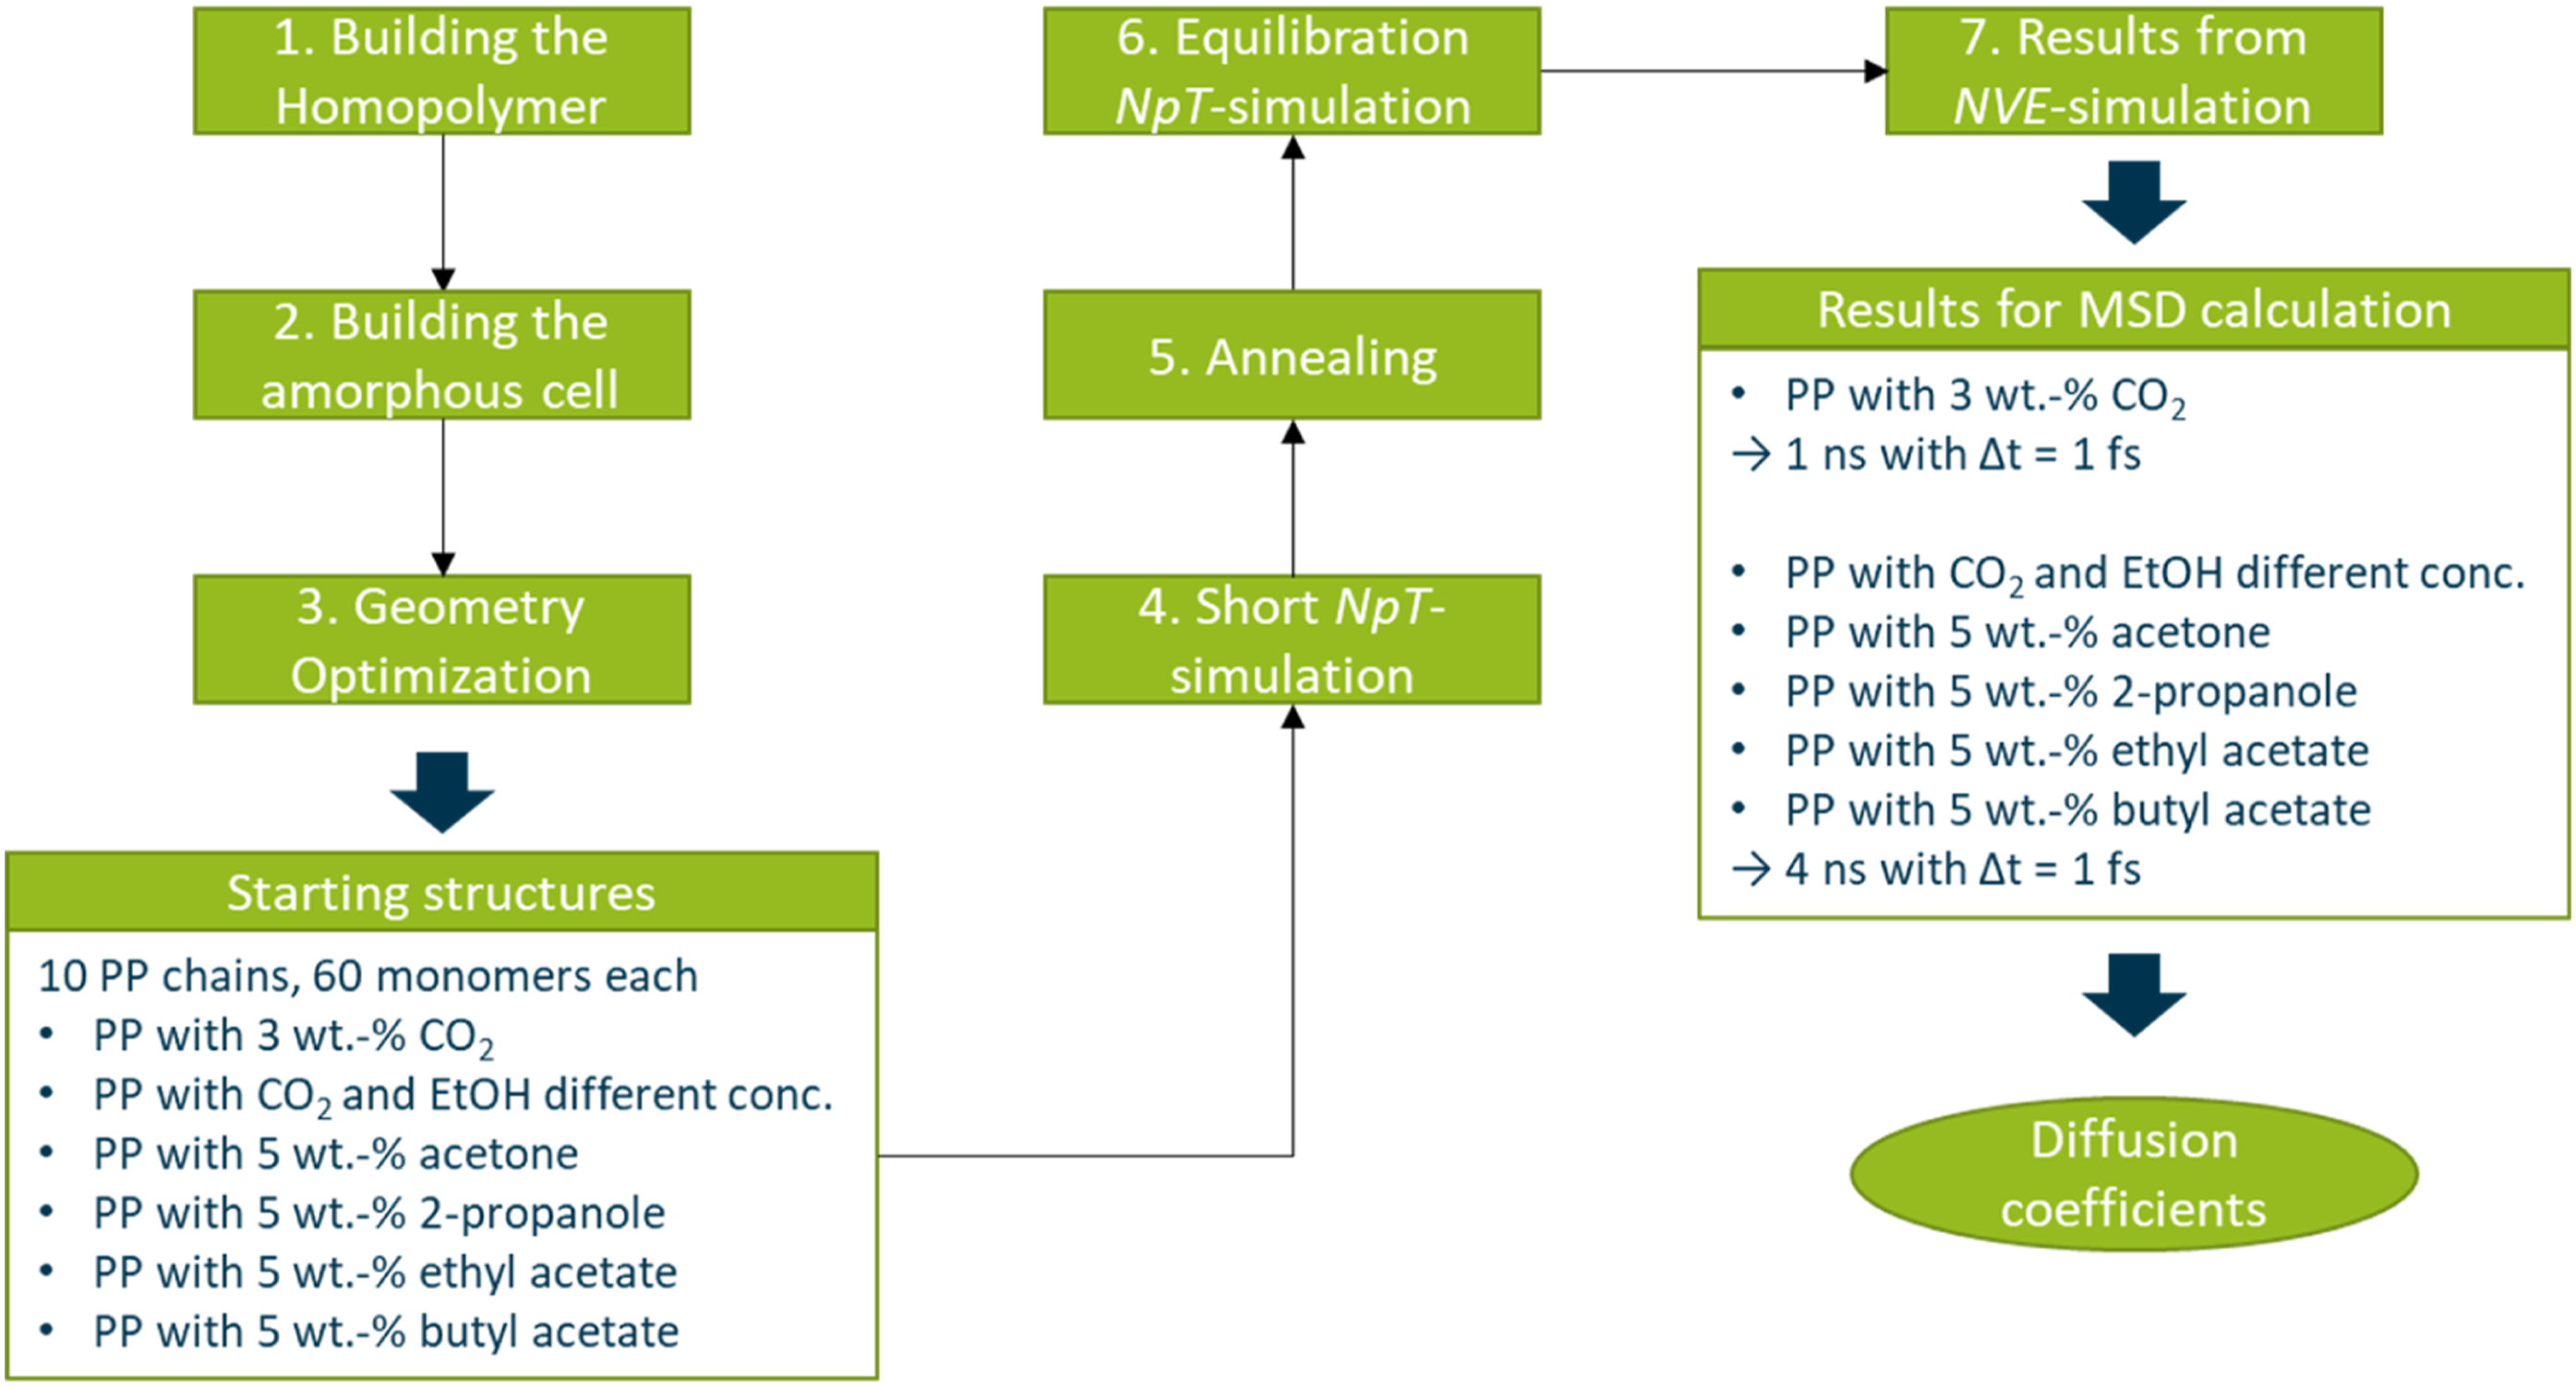
The first step was to build the homopolymer chain of PP which was done the same way for all simulations presented in this work. Therefore, an isotactic PP chain was built out of 60 propene monomers. This polymer chain was geometry optimized using the SMART algorithm and afterwards 10 of those chains with different conformations were placed in a cubic box together with the blowing agent which was about to be investigated. To generate the described cubic box, representing the amorphous polymer, the Amorphous Cell Builder tool in Materials Studio® was used which is based on the self-avoiding random-walk method of Theodorou and Suter 24 and on the Meirovitch 25 scanning method. Due to the computational effort only the amorphous part of the polymer system can be represented, but since the simulations are all carried out at temperatures above the melting point, the polymer can be assumed to be in a rubbery or liquid state of matter which means that the polymer can be seen as completely amorphous. In this way at least four, but in most cases five and up to 10 amorphous starting structures for each polymer/penetrant combination in question were generated, with about 5 wt.-% of the penetrant molecule in the polymer system. The only exception is the pressure evaluation were only an amount of 3 wt.-% of CO2 was used. This means that the cubic cells contain 10 polymer chains and in the case of the pressure consideration for CO2 there were 18 CO2 molecules in the box. For the investigation on the influence of different mixture ratios of ethanol and CO2 the structures for the systems containing only one of the penetrants contained 30 CO2 and 29 ethanol molecules, respectively. For the different mixture rates the amount of ethanol and CO2 was adjusted, accordingly. In the case of the examination of the diffusion coefficients of acetone, 2-propanol, ethyl acetate and butyl acetate 25, 22, 15 and 12 of the respective penetrant molecules were placed into the simulation box. The edge lengths of the cubic boxes are around 35 – 36 Å. Periodic boundary conditions were used for all simulations to overcome surface effects which might occur for such small systems used in MD simulations. 26 The long-range nonbond electrostatic and van der Waals interactions were treated by charge groups in all simulations with the cut off radius varying between 9.5 Å and 15.5 Å. Moreover, all simulations were carried out using the COMPASS27,28 force field, more precisely the COMPASS III force field was used. After the starting structures are generated, they have to be equilibrated and for this purpose the structures are subjected to several equilibrations steps which are explained in more detail in the following. The first step is a geometry optimization of the starting structures, for which the SMART algorithm is applied. This geometry optimization is followed by a short NpT (constant number of particles N, pressure p and temperature T) MD simulation, with a time step of 0.1 fs, an overall simulation time of at least 1 ps, a temperature of 298 K and a pressure of 1 bar. This procedure is necessary to account for possible close contacts which might result from the random packing and weren’t overcome by the first geometry optimization. Since such close contacts might lead to unrealistic high energies which again lead to a termination of the simulation. After this short NpT simulation it follows an annealing procedure which is achieved by repeated heating and cooling of the system over a certain amount of time and so the system can faster reach the state of equilibrium. The annealing procedure consist of at least five cycles of heating and cooling starting with a temperature of 250 K and heating up to 500 K. These cycles are executed within 50 ps while a NpT ensemble is applied. For the final equilibration step a 500 ps MD simulation is executed with a NpT ensemble, the respective temperature (453 K, 473 K and 493 K), a pressure of 1 bar and a time step of 1 fs.
For the production runs which were used to determine the diffusion coefficients, in all cases a NVE ensemble (constant number of particles N, volume V, energy E) and a time step of 1 fs was applied. For the simulations with different applied pressures on a system with CO2 in PP a total simulation time of 1 ns was chosen, since the CO2 molecule is relatively small and so a higher diffusion coefficient can be assumed which allows for a shorter simulation time than for the other systems with bigger penetrant molecules. For every other simulation presented in this work the simulation time of the production runs were set to 4 ns, to account for the bigger size of the diffusing molecules. These simulations generate trajectories for all atoms in the system containing the position and momentum for every time step simulated. The mean squared displacement which is used to determine the diffusion coefficient are generated from the first half of the production runs. This is the first 500 ps for different pressures on a system with CO2 in PP and respectively 2000 ps for the remaining systems.
Calculating diffusion coefficients
For more information about the diffusion process of molecules in rubbery or glassy polymers refer to the literature.29–34 The diffusion process is highly influenced by the size of the diffusing molecule and the temperature. 33 So, one might assume that for the molecules investigated in this work the diffusion coefficients should decrease in order of increasing molecular size. Furthermore, an increase in temperature leads to faster diffusion of the penetrant through the polymer.4,35,36
The diffusion coefficient of a penetrant molecule in a glassy or rubbery polymer can be estimated from the slope of the mean squared displacement (MSD) plotted against time by the Einstein relation,
37
where the MSD is given as follows


As can be seen from equation (2) the diffusion coefficient can only be calculated from the slope of the MSD in cases of long time periods (t → ∞). In literature a sufficient long time period is assumed at about 1 – 2 ns if the diffusion coefficients are higher than 10−6 cm2/s.6,36 The MSD was plotted to estimate the diffusion coefficients. The MSD were obtained from the trajectories which were produced in the different production simulations mentioned in the above section. For more details refer to our earlier work. 18
Results and discussion
Consider eventual pressure influences of CO2 diffusion in PP
Since pressure is of great importance in the foaming process, it should be checked if the calculated diffusion coefficients are independent of a pressure change which is applied on the simulation box. For checking the pressure independence of the estimated diffusion coefficient calculations were executed under application of different pressures on a PP system with approximately 3 wt.-% CO2 and a constant temperature of 433 K. A pressure range from 50 to 200 bar was investigated and for every diffusion coefficient five different starting structures were used. The pressure was directly applied on the simulation cell which consist of the polymer melt and the CO2. Therefore, only changes in the pressure on the already with blowing agent loaded saturated melt are considered. CO2 was chosen as the penetrant, due to it’s outstanding importance as the main blowing agent to be investigated. The results for the diffusion coefficients are shown in Figure 2 Diffusion coefficient of 3 wt.-% CO2 in PP for four different pressures set in a range of 50 to 200 bar directly applied to the simulation box, all calculated at a temperature of 433 K and using a NpT-ensemble.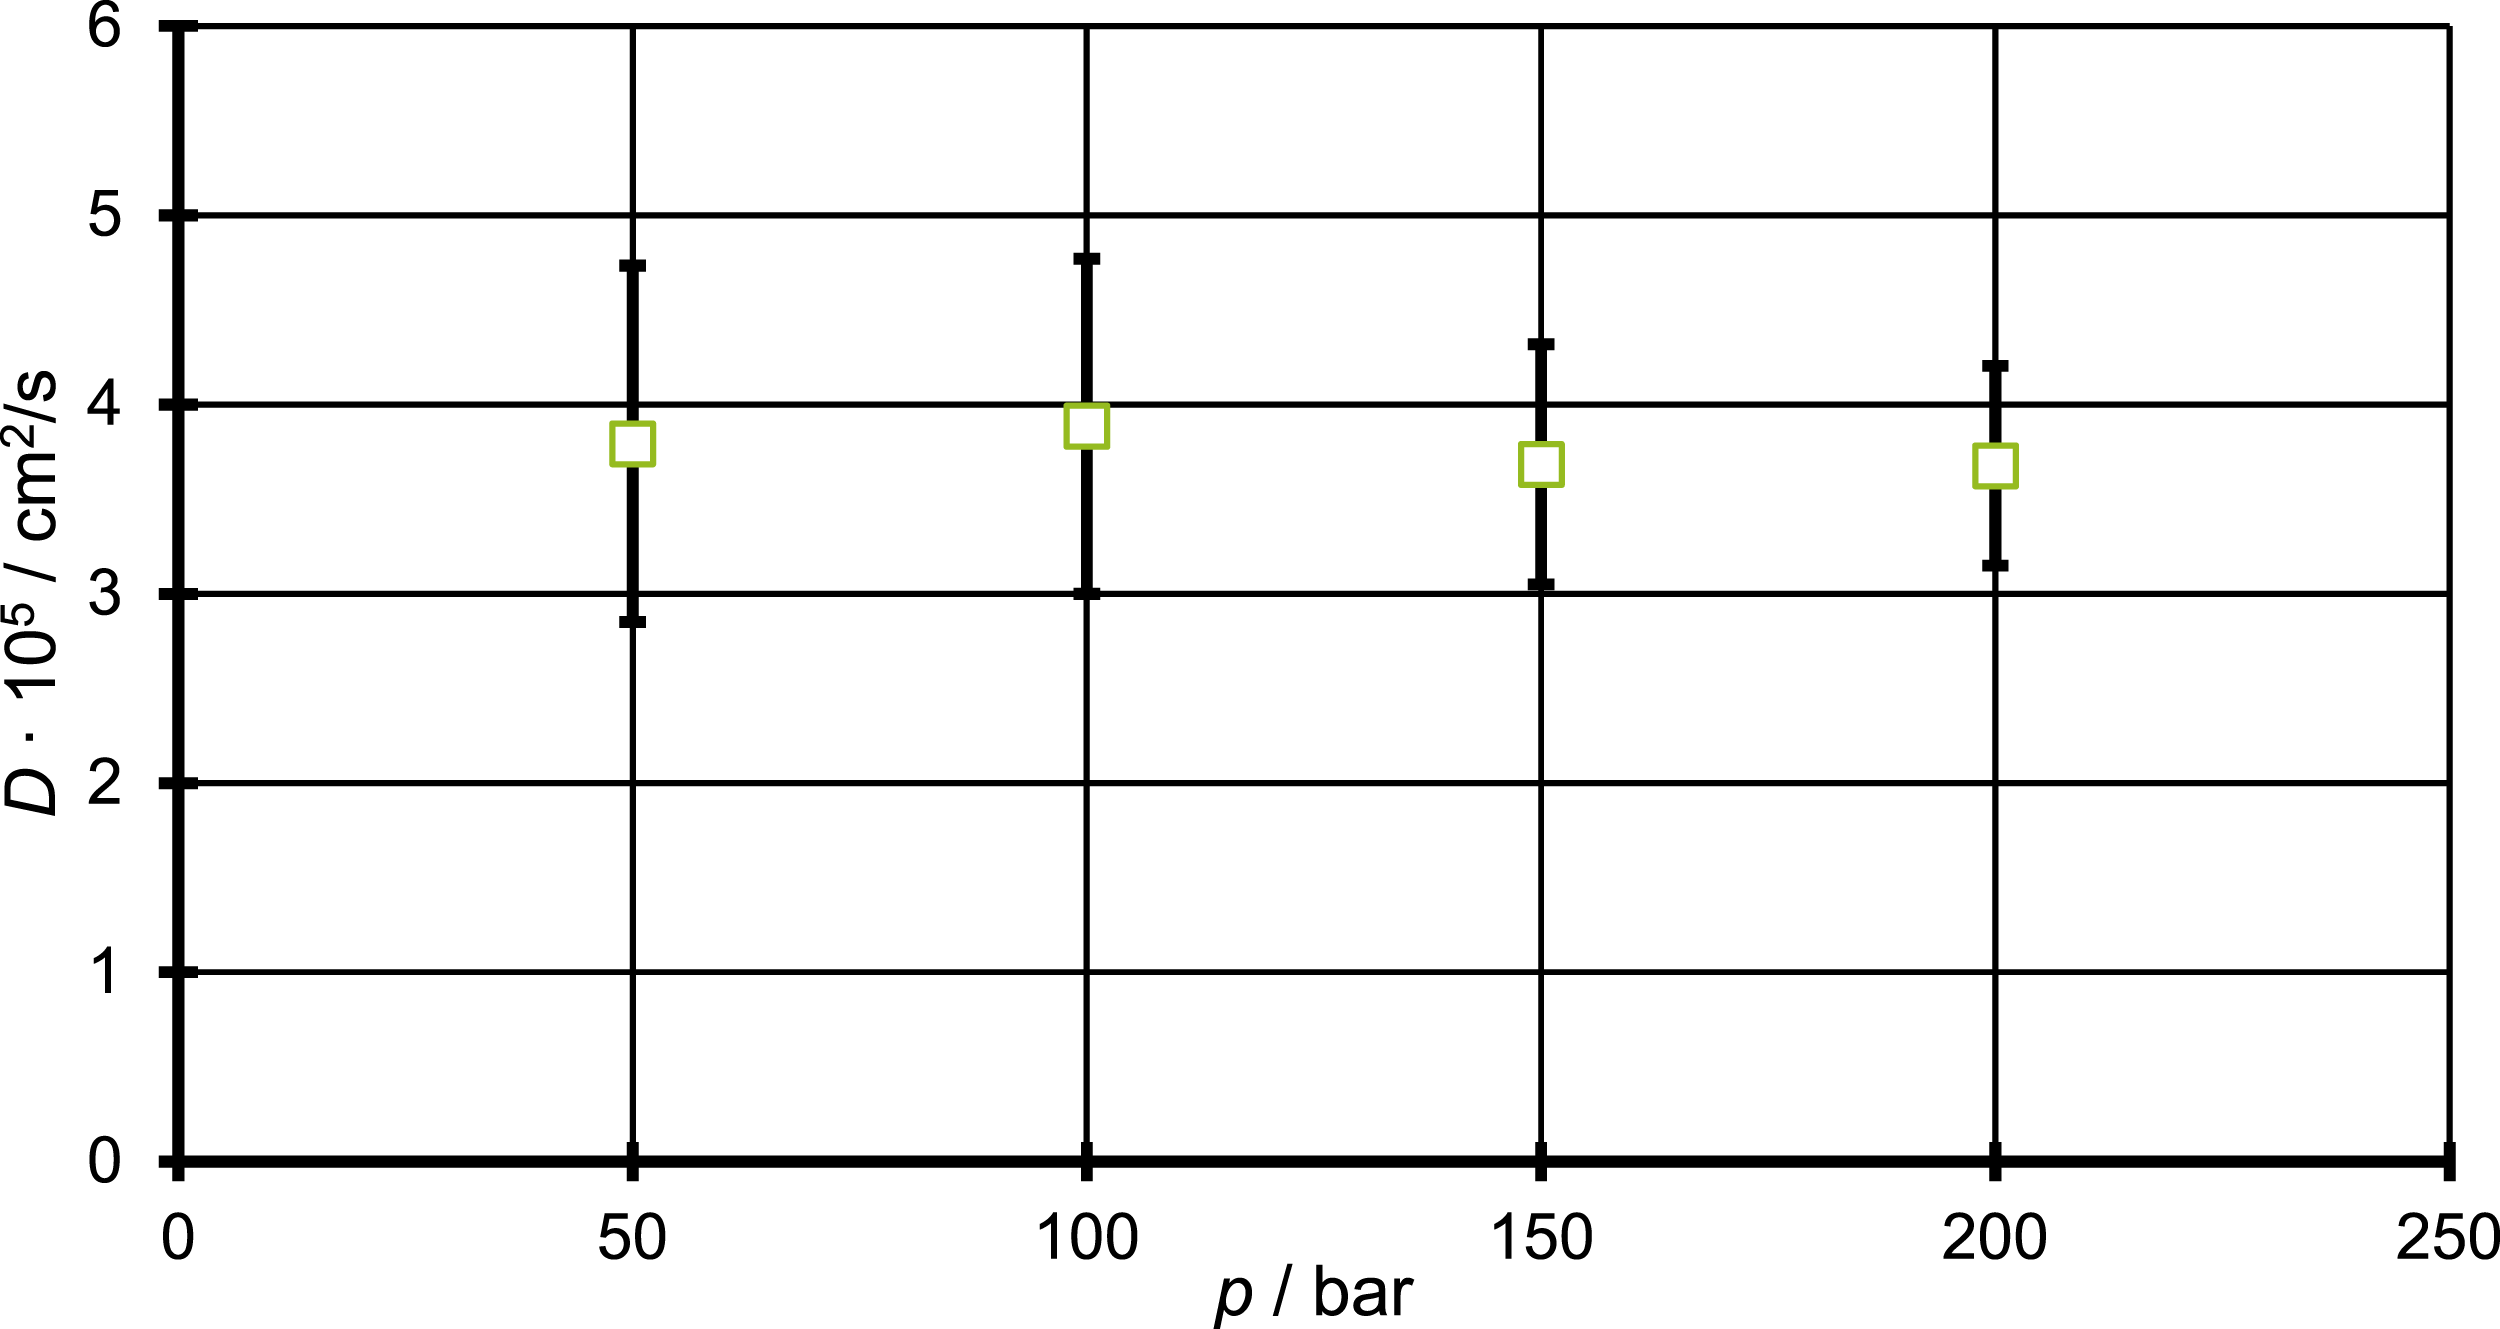
As can be seen from Figure 2 only slight deviations can be observed between the diffusion coefficient of CO2 in PP and the increasing pressure, as the diffusion coefficient values are in the range of 4 × 105 cm2/s and show just small deviations around this value, compared to their standard deviation. The experimental value found by Durrill and Griskey 38 is given with 4.25 × 105 cm2/s at a temperature of 461 K. Comparison between this experimental and the simulated result show good agreement, especially when the temperature of measurement and simulation are compared. Since the experimental value was measured at a nearly 30 K higher temperature one would assume an increased diffusion coefficient. This way it was assured that the methods of choice show no eventual pressure effects which would have to be addressed in further calculations. Furthermore, these results agree with other studies in this field. Sato et al. state in their paper that they neglected the pressure dependence of the diffusion coefficient, due to the fact of non-dependence of such transport properties in liquids. 39 Since a higher pressure might lead to an reduction of the free volume, one might assume it also leads to a decreased diffusion coefficient. In a recent work Wang et al. 40 described the pressure dependence of the specific volume for an isotactic PP. Their results show a principal pressure dependence of the specific volume, but the change is relative moderate in the pressure range relevant for our simulations. For a pressure increase from 50 bar to 1000 bar the specific volume of the PP measured, revealed a change of around 0.1 cm3/g in the free volume. 40 In two other recent works the diffusion coefficient for CO2 in poly(butylene adipate-co-terephthalate) and polystyrene were measured and a pressure dependence was found.41,42 This discrepancy can be explained by the method of measurement. The diffusion coefficient was measured by applying an external blowing agent pressure on the melt, while in our simulation the pressure was applied on the system of the polymer loaded with the CO2. So, for a correct comparison the simulation of a system consisting of a polymer and a CO2 phase wherein the CO2 is applied with a pressure onto to the polymer melt would be necessary and of great interest.
Influence of mixing blowing and co-blowing agent on their diffusion coefficient by the example of ethanol and CO2 in PP
Furthermore, the influence on the diffusion coefficient by combining the blowing agent and the co-blowing agent in a polymer matrix was investigated. Such influences could be the result of similar polarities or solubilities and intermolecular interactions between the two species, like hydrogen-bonding or van der Waals interactions. Moreover, repulsive effects between the two permeants could lead to an influence on the diffusion coefficient too. Intermolecular interactions like those named before might lead to an acceleration or deceleration of the diffusing species and so induce a change in the diffusion coefficient. Elucidating and predicting such influences on the diffusion coefficient is of great importance for the modeling of foaming, as it enables the consideration of the influence of different co-blowing agent concentrations on the foaming process to be modeled. As a start the combination of ethanol and CO2 was chosen, since due to our earlier work for these two molecules there is data available for comparsion.
18
Furthermore, this combination is predestined for such an investigation, since ethanol is the co-blowing agent with the lowest molecular weight of question in this work and thus assures for moderate computational effort. To investigate the effect of mixing ethanol and CO2 in PP different simulation cells are produced which contain different amounts of both molecules. For pure systems, containing only one of the two species the simulations cells are build such that they contain 10 PP chains and 5 wt.-% of CO2 and ethanol, respectively. Afterwards the amount of ethanol molecules in the system of pure CO2 is increased, while the amount of CO2 is decreased such that the systems contain 25% ethanol molecules. This was done for two further combinations, namely 50% and 75% ethanol. For these systems molecular dynamics simulations at 453 K were carried out as described before and the diffusion coefficient was determined. Figure 3 shows the diffusion coefficient for CO2 (squares) and for ethanol (diamonds) in respect to the different amounts of ethanol in the system, starting from zero ethanol and end with a system of only ethanol in PP. Diffusion coefficient of CO2 in PP with different amounts of EtOH, evaluating possible influences of the mixing of blowing agent and co-blowing agent on the diffusion coefficient.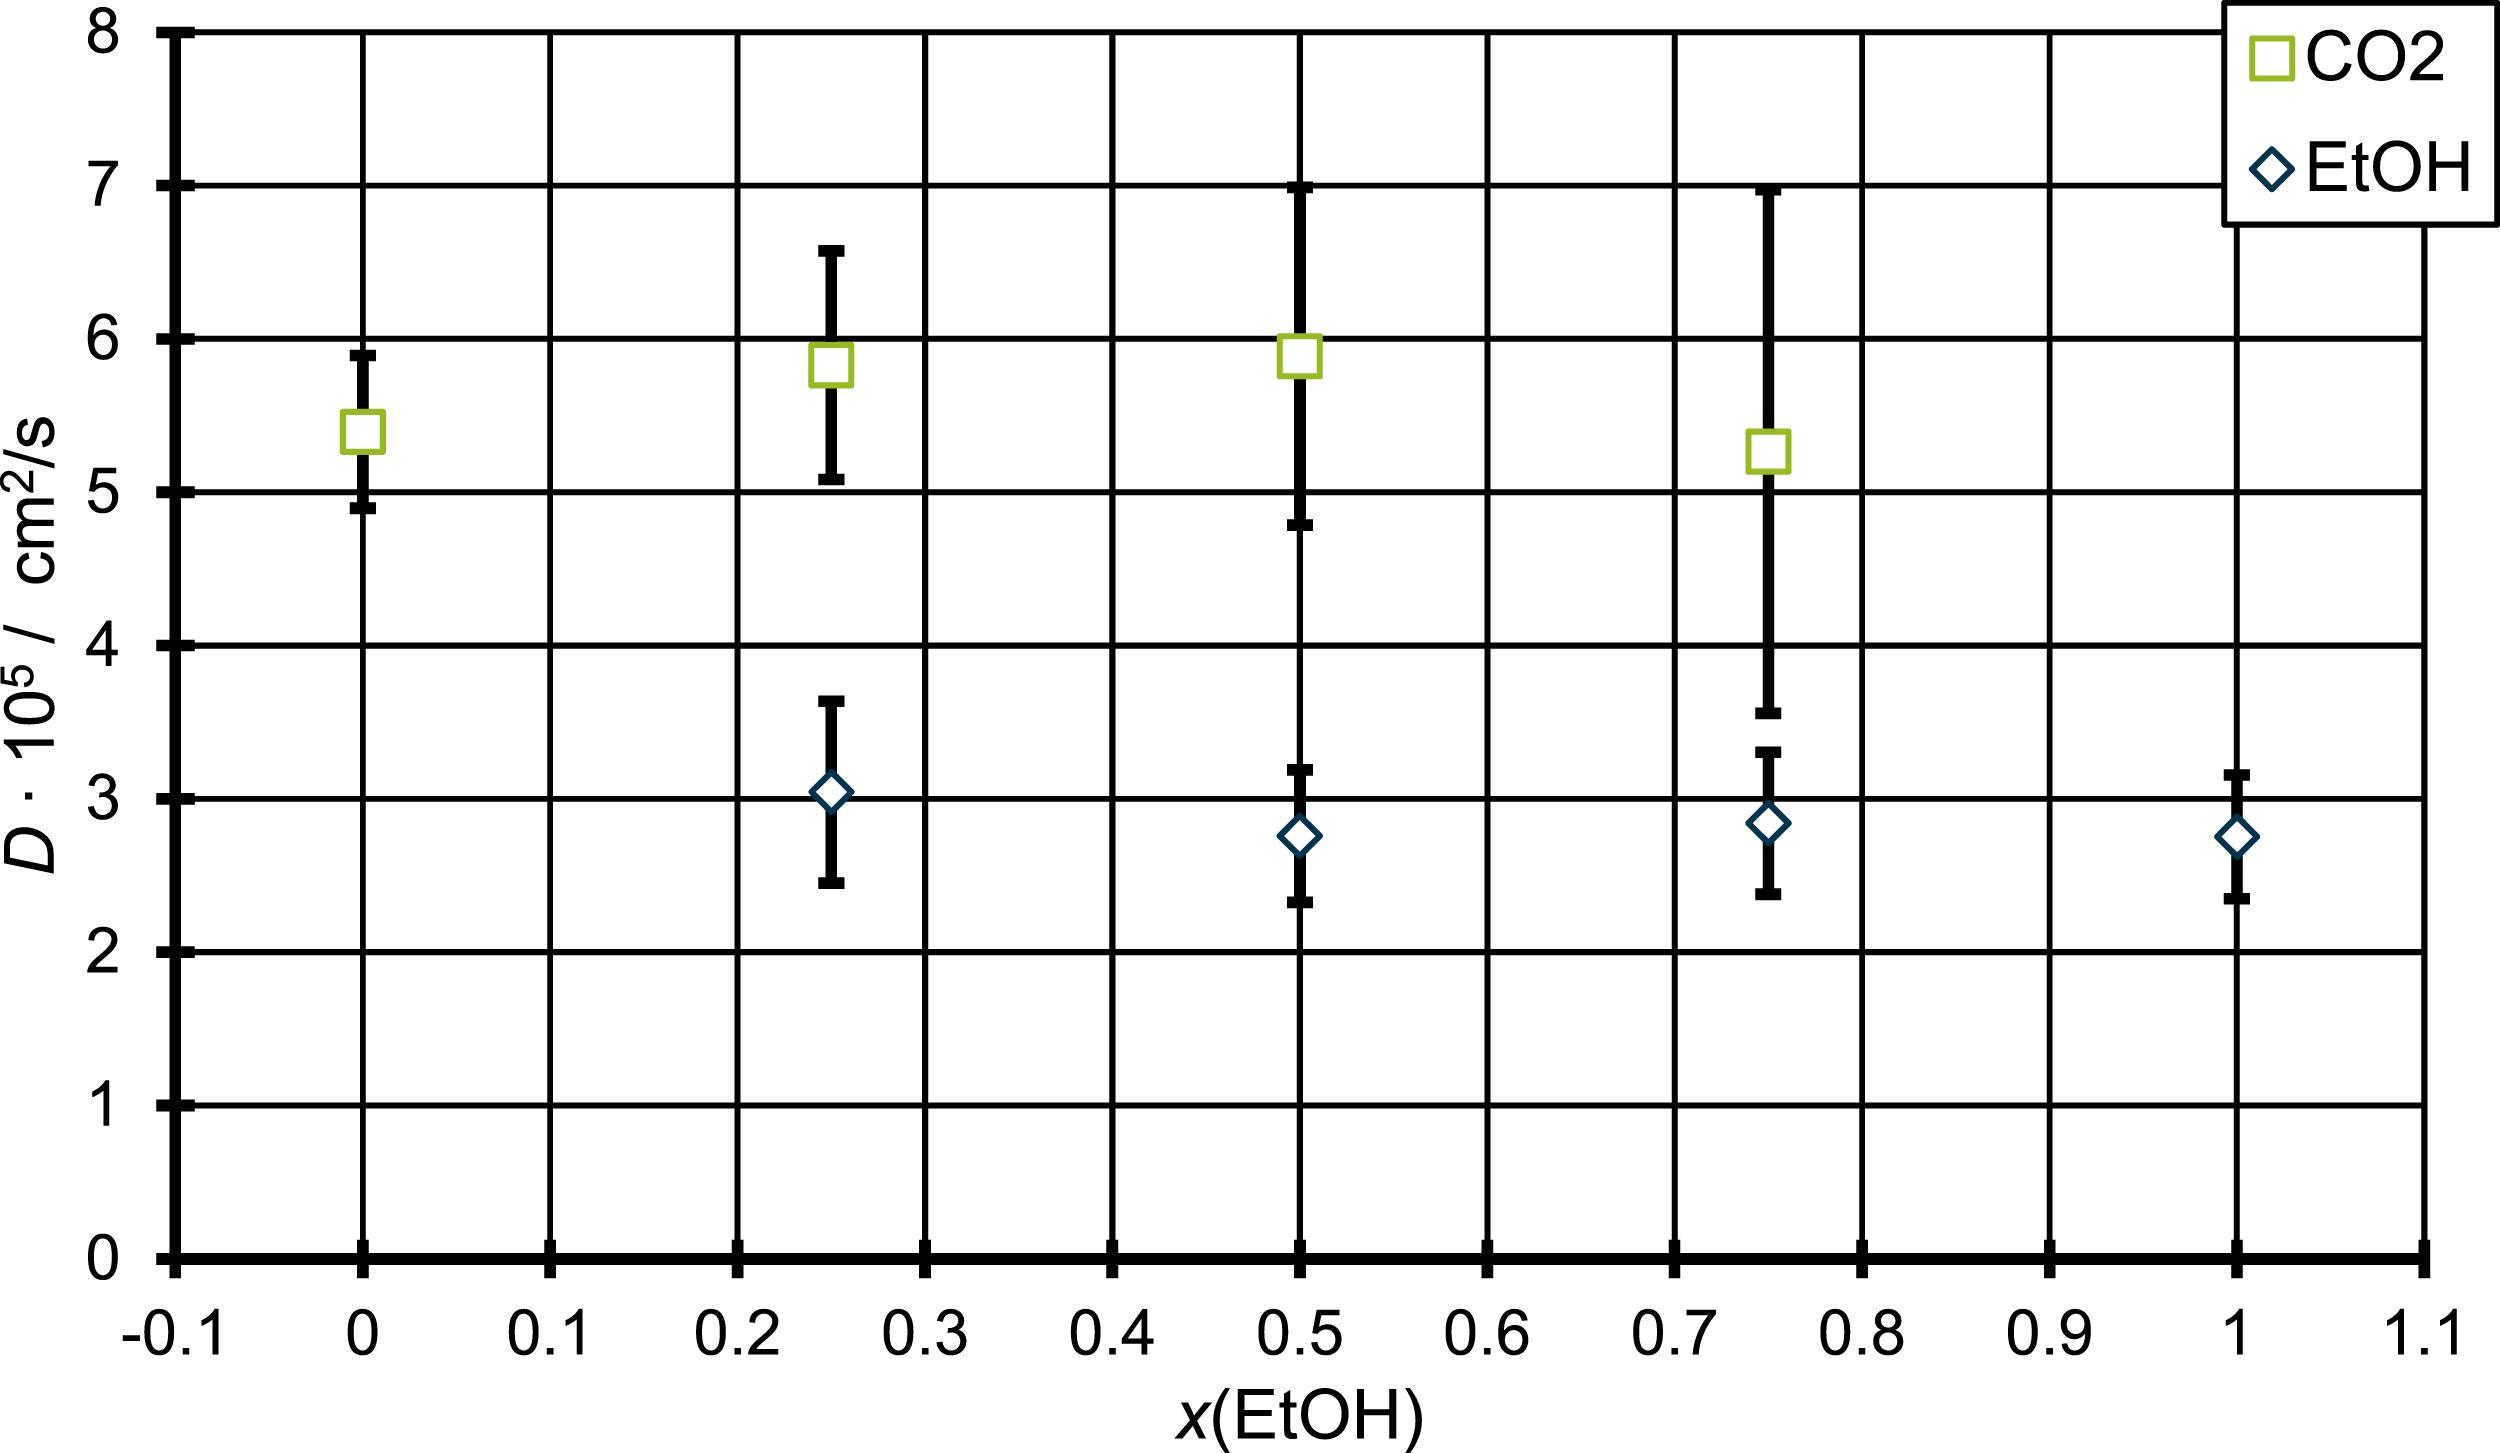
As can be seen from Figure 3 there are only small changes in the diffusion coefficient for systems with different amount of mixing between CO2 and ethanol. The diffusion coefficients of ethanol all vary around a value of 3 × 10⁻⁵ cm2/s and the fluctuations lies within the standard error. For the diffusion coefficient of CO2, there are small variations for the value with only CO2 and with the highest amount of EtOH, although here the standard error is higher than in the case of ethanol as the diffusing molecule. Especially the value of the CO2 diffusion coefficient for the highest amount of ethanol in the mixture shows a high standard error. This high error in comparison to the other diffusion coefficients of CO2 might be explained by the smaller amount of actual CO2 molecules in the system. Since the diffusion coefficient is calculated by averaging over all molecules in question, a higher number of molecules leads to a higher statistical accuracy. 26 Thus, a smaller total number of CO2 molecules might explain the high standard error. So, the high standard error might explain the deviation from the other values. The deviation between the value of pure CO2 and those for the mixtures with ethanol agrees well with the findings in literature.15–17 Here for the case of polystyrene15,16 and polypropylene 17 an increase of the diffusion coefficient for CO2 was found when it is combined with different alcohols, while this increase becomes even stronger with rising number of carbon atoms in the alcohol. Nevertheless, the change is small, especially for the combination of CO2/ethanol. Therefore, this increase in the diffusion coefficient found here from the pure CO2 to the first mixture correspond well to the results described in the cited literature. The diffusion coefficient of only CO2 in PP found by Gao et al. 17 at 418 K is 3.55 × 10⁻⁵ cm2/s which is way below the 5.39 × 10⁻⁵ cm2/s found in this work. This difference is clearly explained by the temperature differences since the simulations by Gao et al. were performed at temperatures below the melting point while our simulations are performed above. Furthermore, Qiang et al. 15 found an increase of the alcohols diffusion coefficient when combined with the CO2. This result was not reproduced by our simulations but might be explained by the different simulation conditions e.g., the different polymer, temperature, and concentrations as also the difference in the simulation method. In general, the results show the increase in diffusion for CO2 when combined with ethanol, but also shows no increase in the diffusion coefficient with increasing ethanol concentration. This result indicates that only small amounts of ethanol are necessary to influence the polymer/blowing agent mixture.
Diffusion coefficient of high molecular weight permeants in PP
In our earlier work
18
we investigated the use of MD simulations for the estimation of diffusion coefficients for ethanol as a blowing agent in PP, because there were no such experimental values available in literature. The obtained values were compared relative to simulations for CO2 and N2 by taking the different molecular sizes into account and were found to be reasonable. Ethanol over 2-propanol was chosen due to its relatively smaller size and with that the resulting moderate computational effort. In this chapter values will be presented for even bigger diffusing molecules as are listed in Figure 4. Since there are no experimental literature values available, the results are judged in comparison to earlier simulation results and literature values for the diffusion coefficients of molecules like N2 and CO2 in PP. The quality of the results can then be assessed based on expectations regarding the change in diffusion coefficient with molecule size or molecular weight, but also the polarity of the diffusing molecules. Molecular structures of the diffusing species in question in this chapter starting with ethanol, acetone, 2-propanol, ethyl acetate and butyl acetate. The structures are presented in order of increasing molecular weight.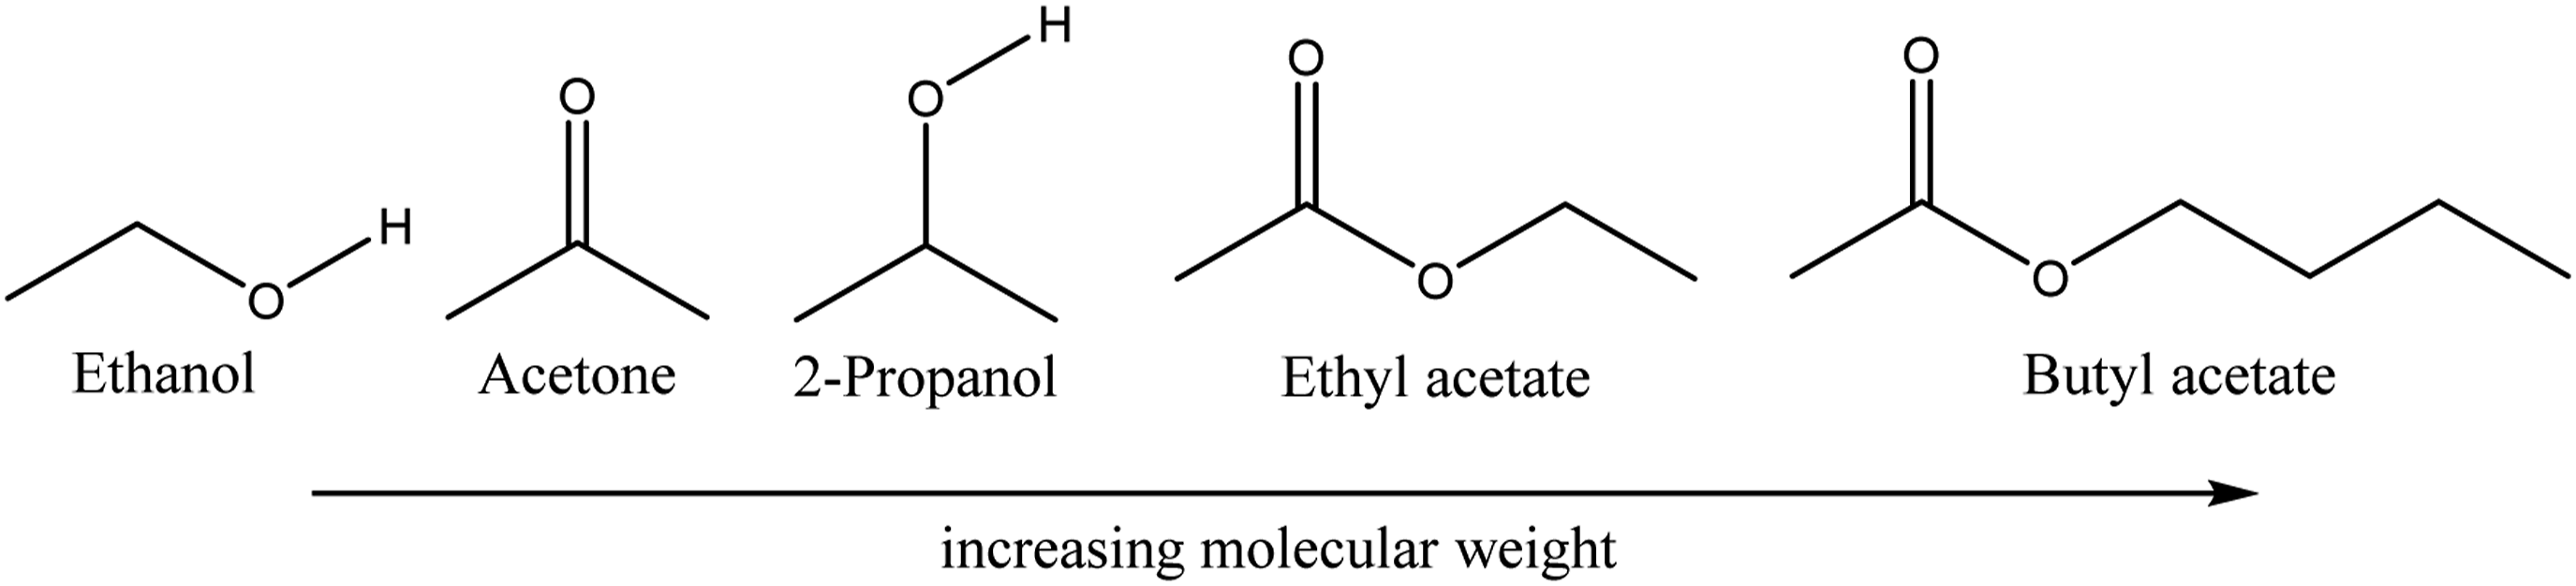
In Figure 4 the molecules which are investigated in this chapter are shown in order of increasing molecular weight, since one would assume a decreasing diffusion coefficient with increasing molecular weight. In this work acetone, 2-propanol, ethyl acetate and butyl acetate are investigated.
Results of the diffusion coefficient calculated in this work and their corresponding standard deviation. The molecules are listed in order of increasing molecular weight M which is given in the second column in units of g/mol. The values of the diffusion coefficients are all given in units of cm2/s 105.
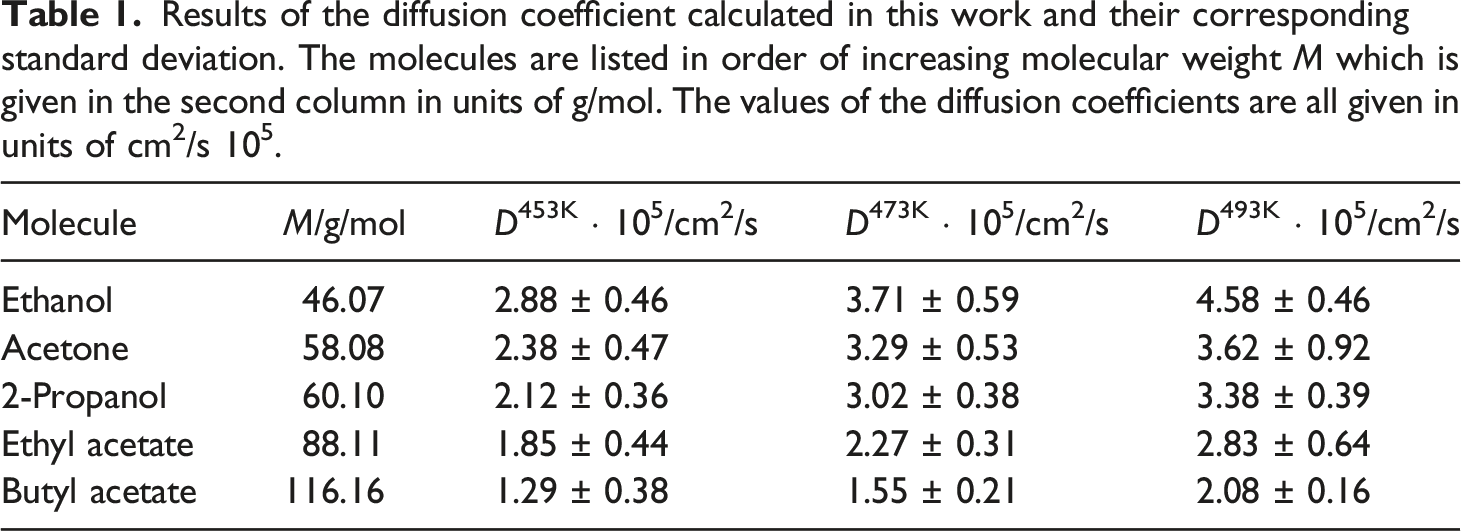
As can be seen in Table 1, the diffusion coefficients increase with increasing temperature, as it is to be expected. For an easier comparison and understanding of this matter, Figure 5 shows the plot of the diffusion coefficients against the corresponding molecular weight of the diffusing molecules in question. Diffusion coefficient for the molecules from Figure 4 against the corresponding molecular weight.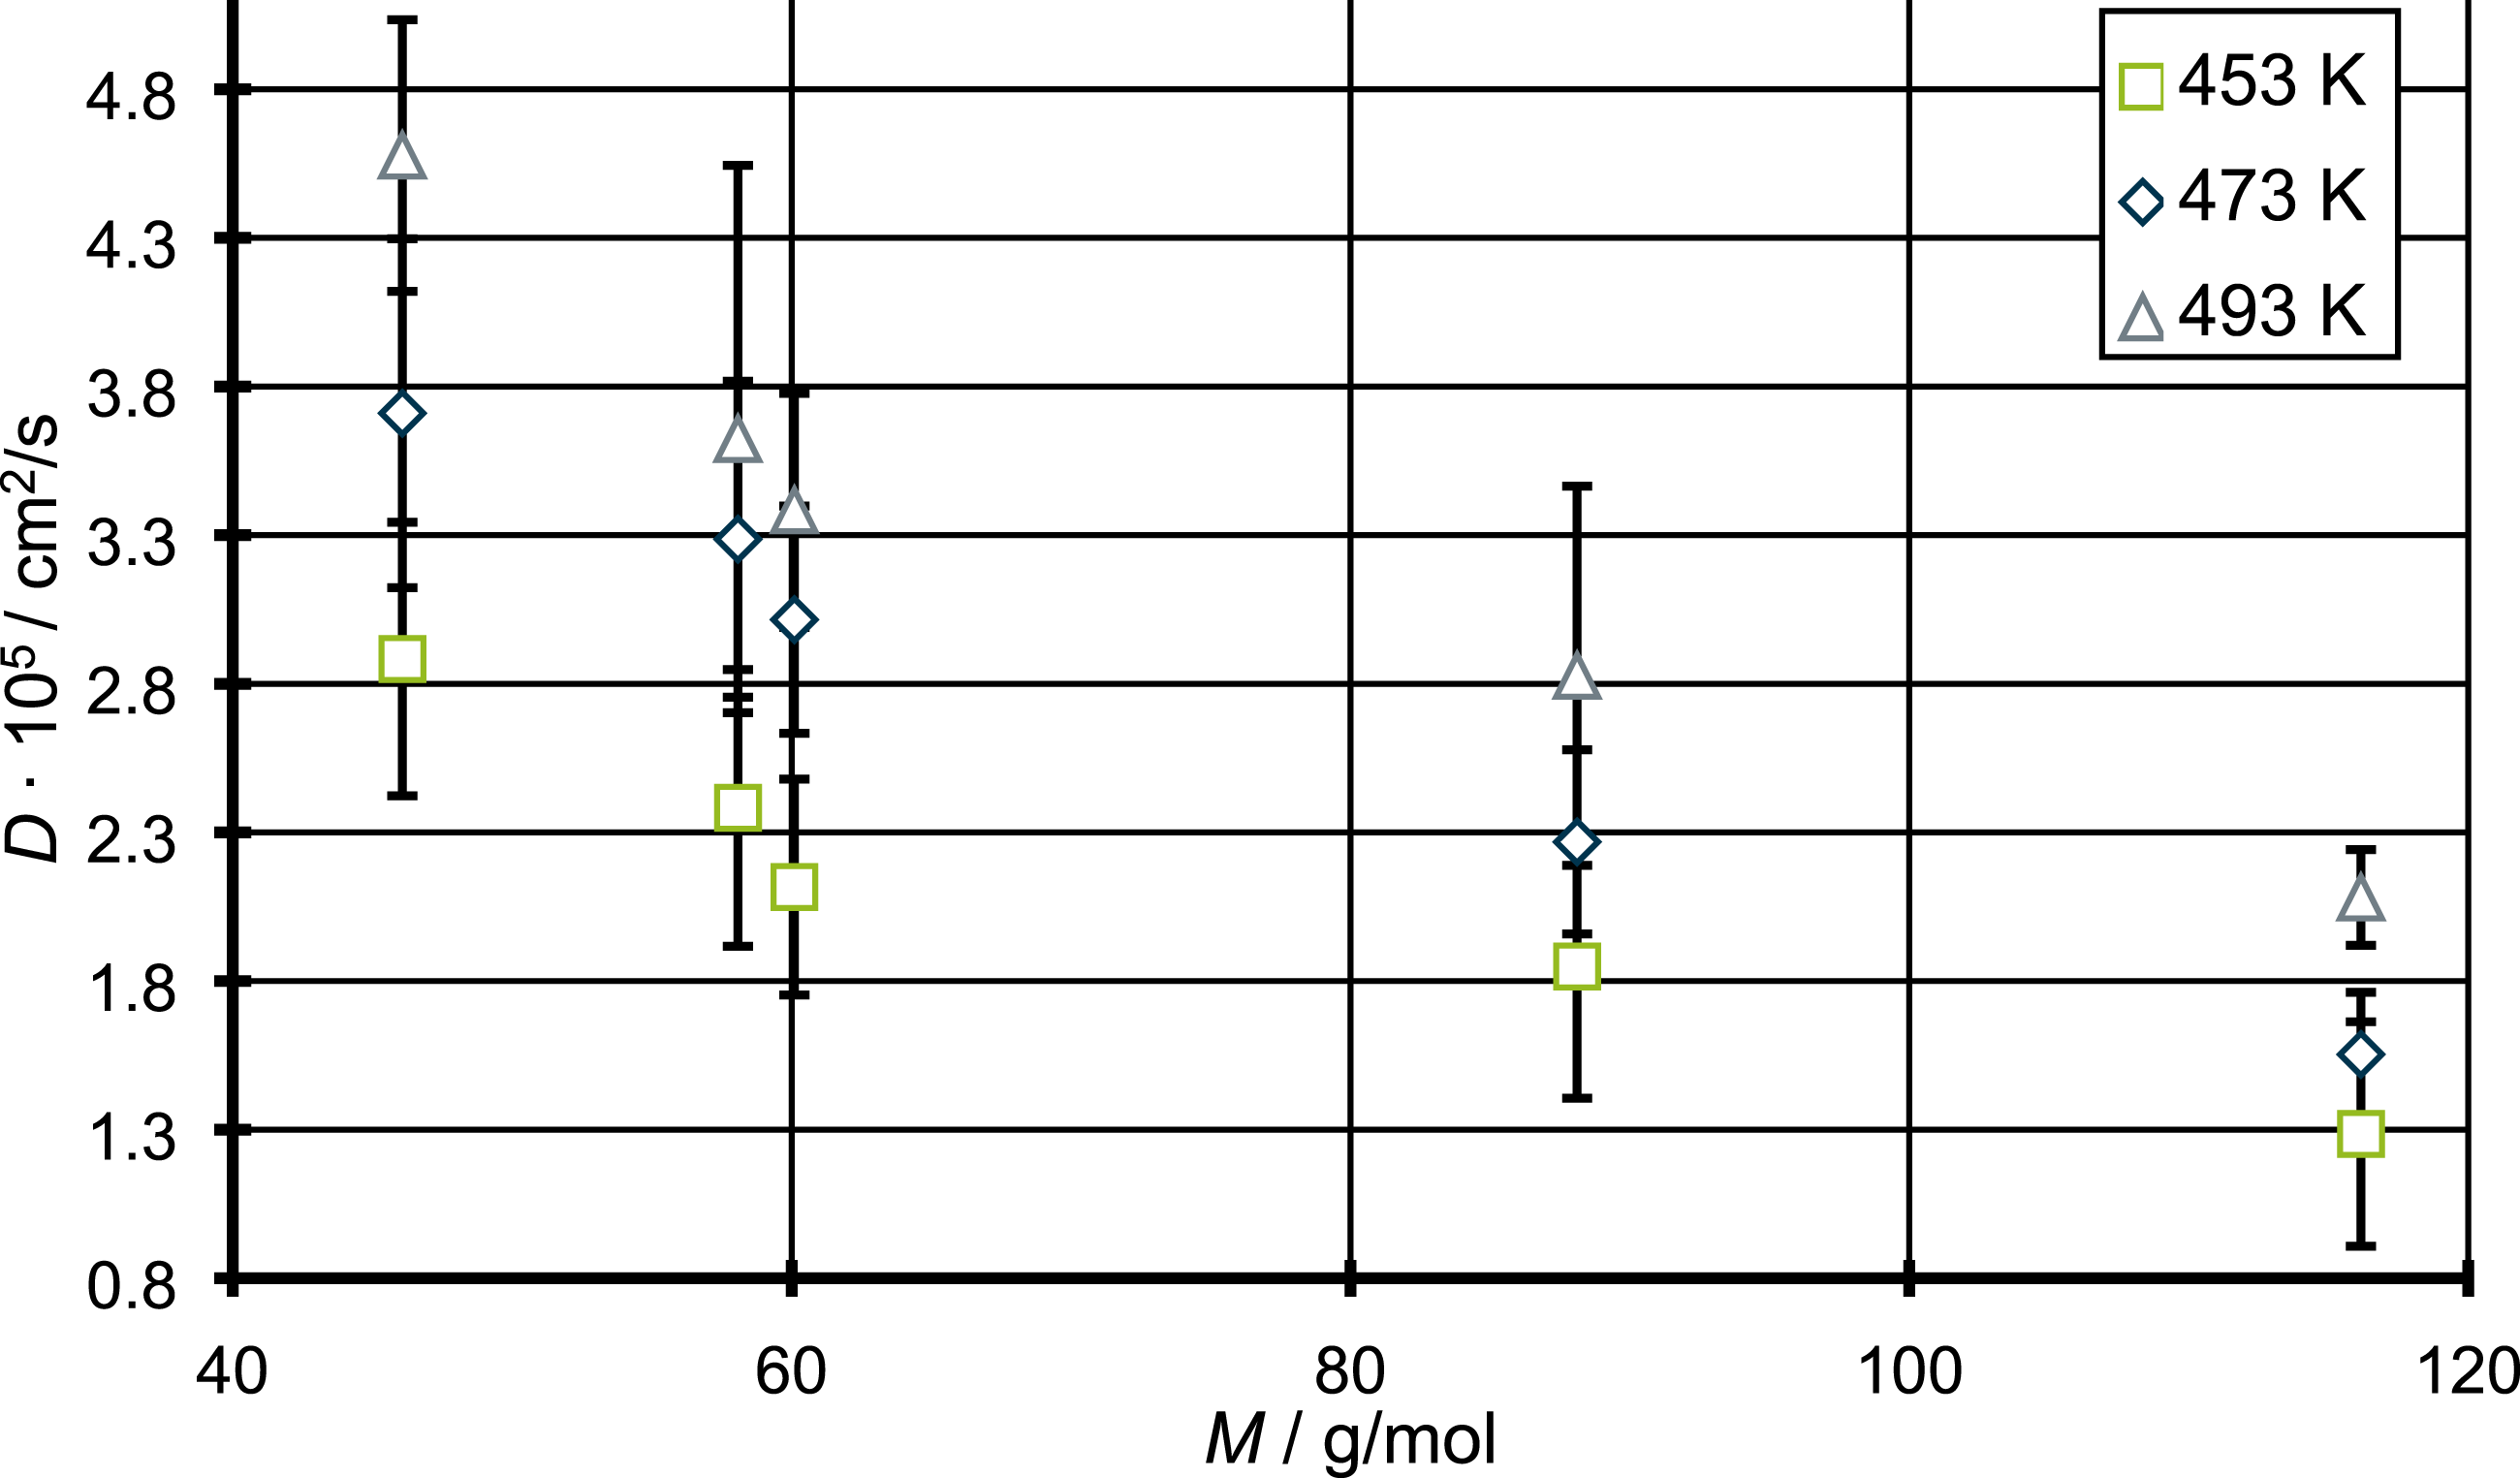
There is a quite similar relationship between the diffusion coefficient and the molecular weight of the corresponding penetrant for all three temperatures. Although the diffusion coefficient decreases with increasing molecular weight one can see that the relation is not fully linear. This means that the change of the diffusion coefficient might not completely be explained solely by the molecular weight of the diffusing species, but rather a mix of different influences. Furthermore, one can see a slight deviation from the overall trend in the relation between diffusion coefficient and molecular weight for the highest temperature of 493 K, concerning in particular the diffusion coefficients of ethanol and 2-propanol. So, a first discussion will focus on possible reasons influencing the diffusion coefficients besides the molecular weight and considering these recognitions the changes in the overall trends by a temperature of 493 K will be discussed. The first deviation from strict linear behavior can be seen when the change of diffusion coefficients between acetone and 2-propanol is compared. Between those two the difference in molecular weight amounts to only 2.02 g/mol. Compared relative to this small change in molecular weight the change in the diffusion coefficients appears to be high. However, with increasing temperature the differences between acetone and 2-propanol become smaller. From the described deviations the question arises which other influences except the molecular weight are responsible for the observed diffusion coefficients. So, it should be checked for other explanations because one wouldn’t expect the molecular weight as the only factor on the differences in the diffusion of the penetrants in question. Another impact factor might be the molecular size respectively the occupied volume of the penetrant. This is especially interesting because the observed difference can be seen between the alcohol (2-propanol) and the ketone (acetone), so one could assume that the alcohol group has a higher steric hindrance than the carbonyl group and therefore slow down the diffusion. Therefor the occupied volume Vocc of each penetrant molecule in Figure 4 is determined. Therefore, the van der Waals radius is used providing the occupied volume, while the surfaces can be calculated with the corresponding Atom Volumes & Surfaces Tool in Materials Studio®. The results are shown in Figure 6. van der Waals surfaces and the corresponding values for the occupied volume Vocc in Å3 for the different molecules which are investigated in this chapter.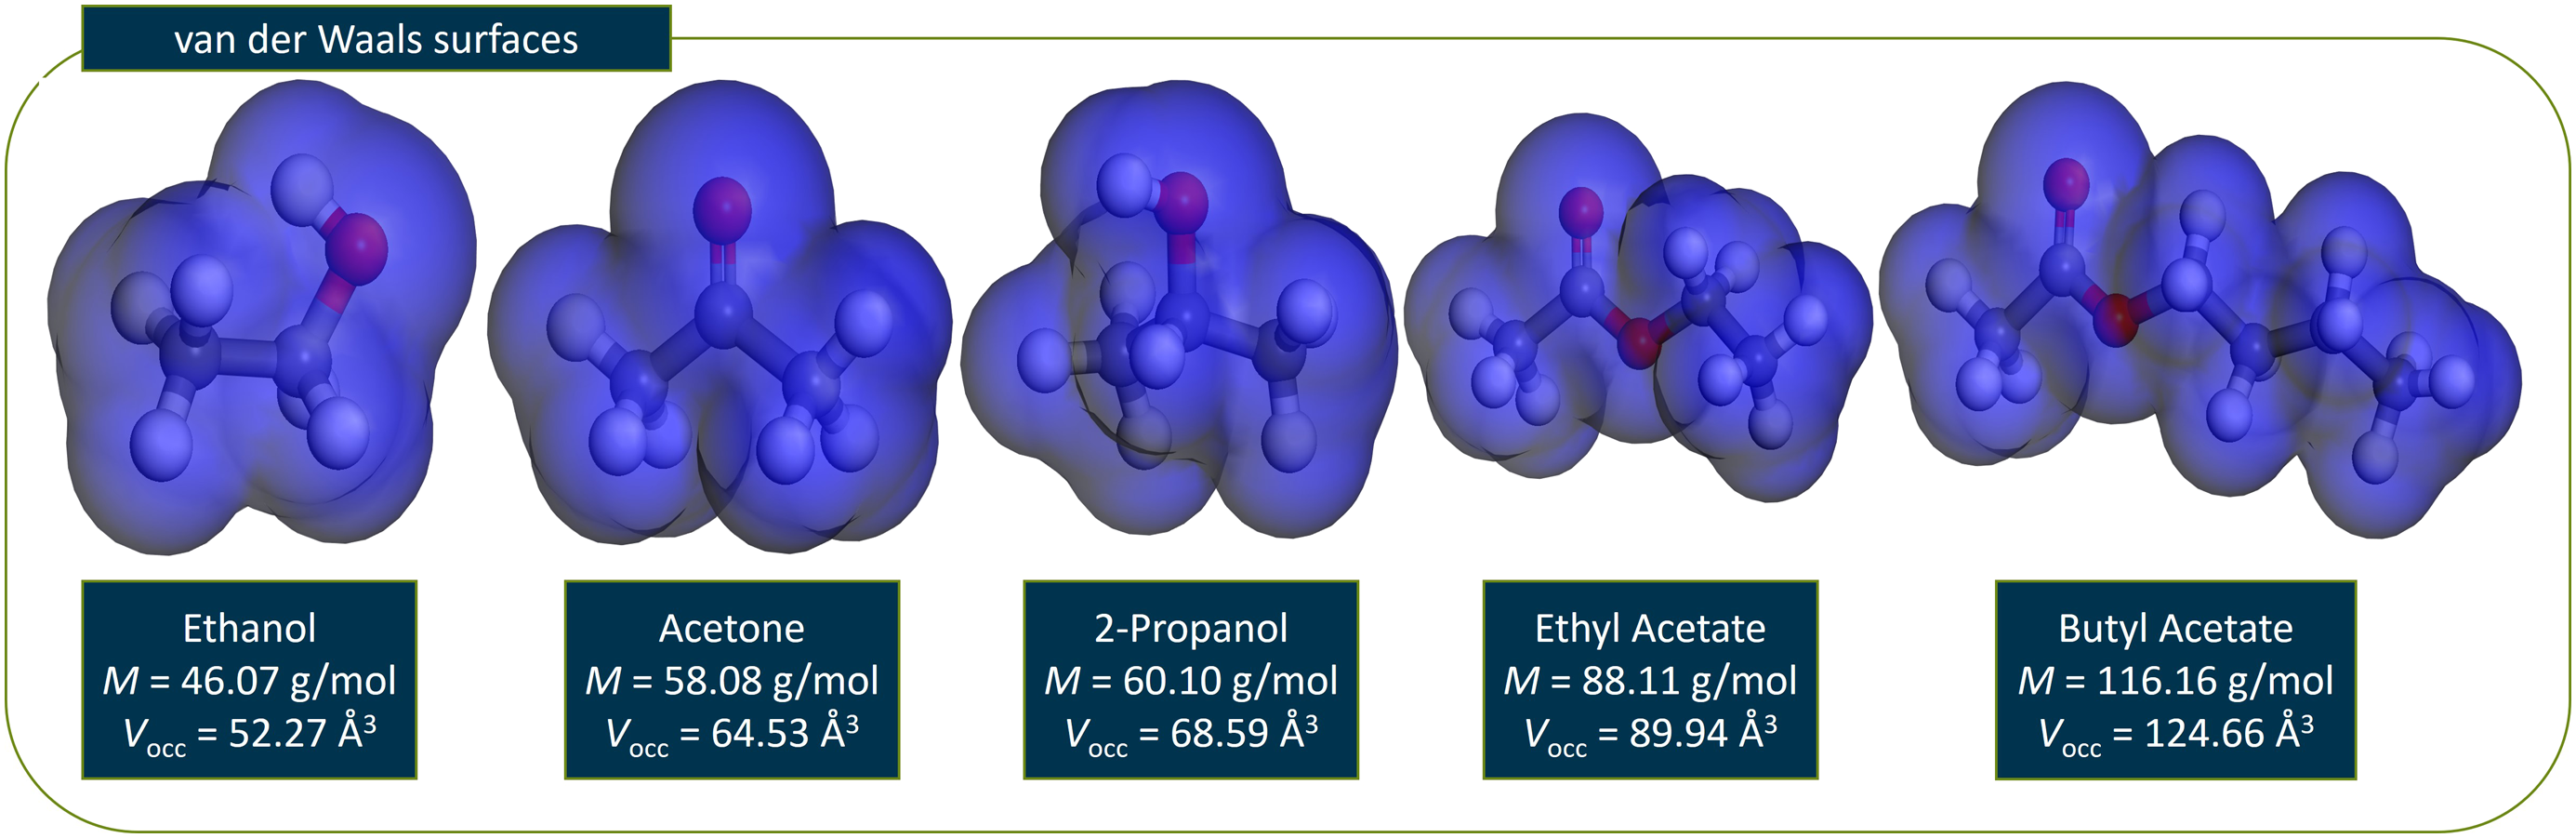
In Figure 6 the resulting van der Waals surfaces are shown, along with the calculated values of the occupied volume. When the differences between the values of the occupied volume and the molecular weight for the different diffusing molecules are compared, one can’t find any major deviation between these values. Only between acetone and 2-propanol there is a small divergence. To further illustrate the correlations, Figure 7 shows the plot of occupied volume against the molecular weight for all molecules in question and the three different temperatures investigated in this work. Occupied volume against molecular weight.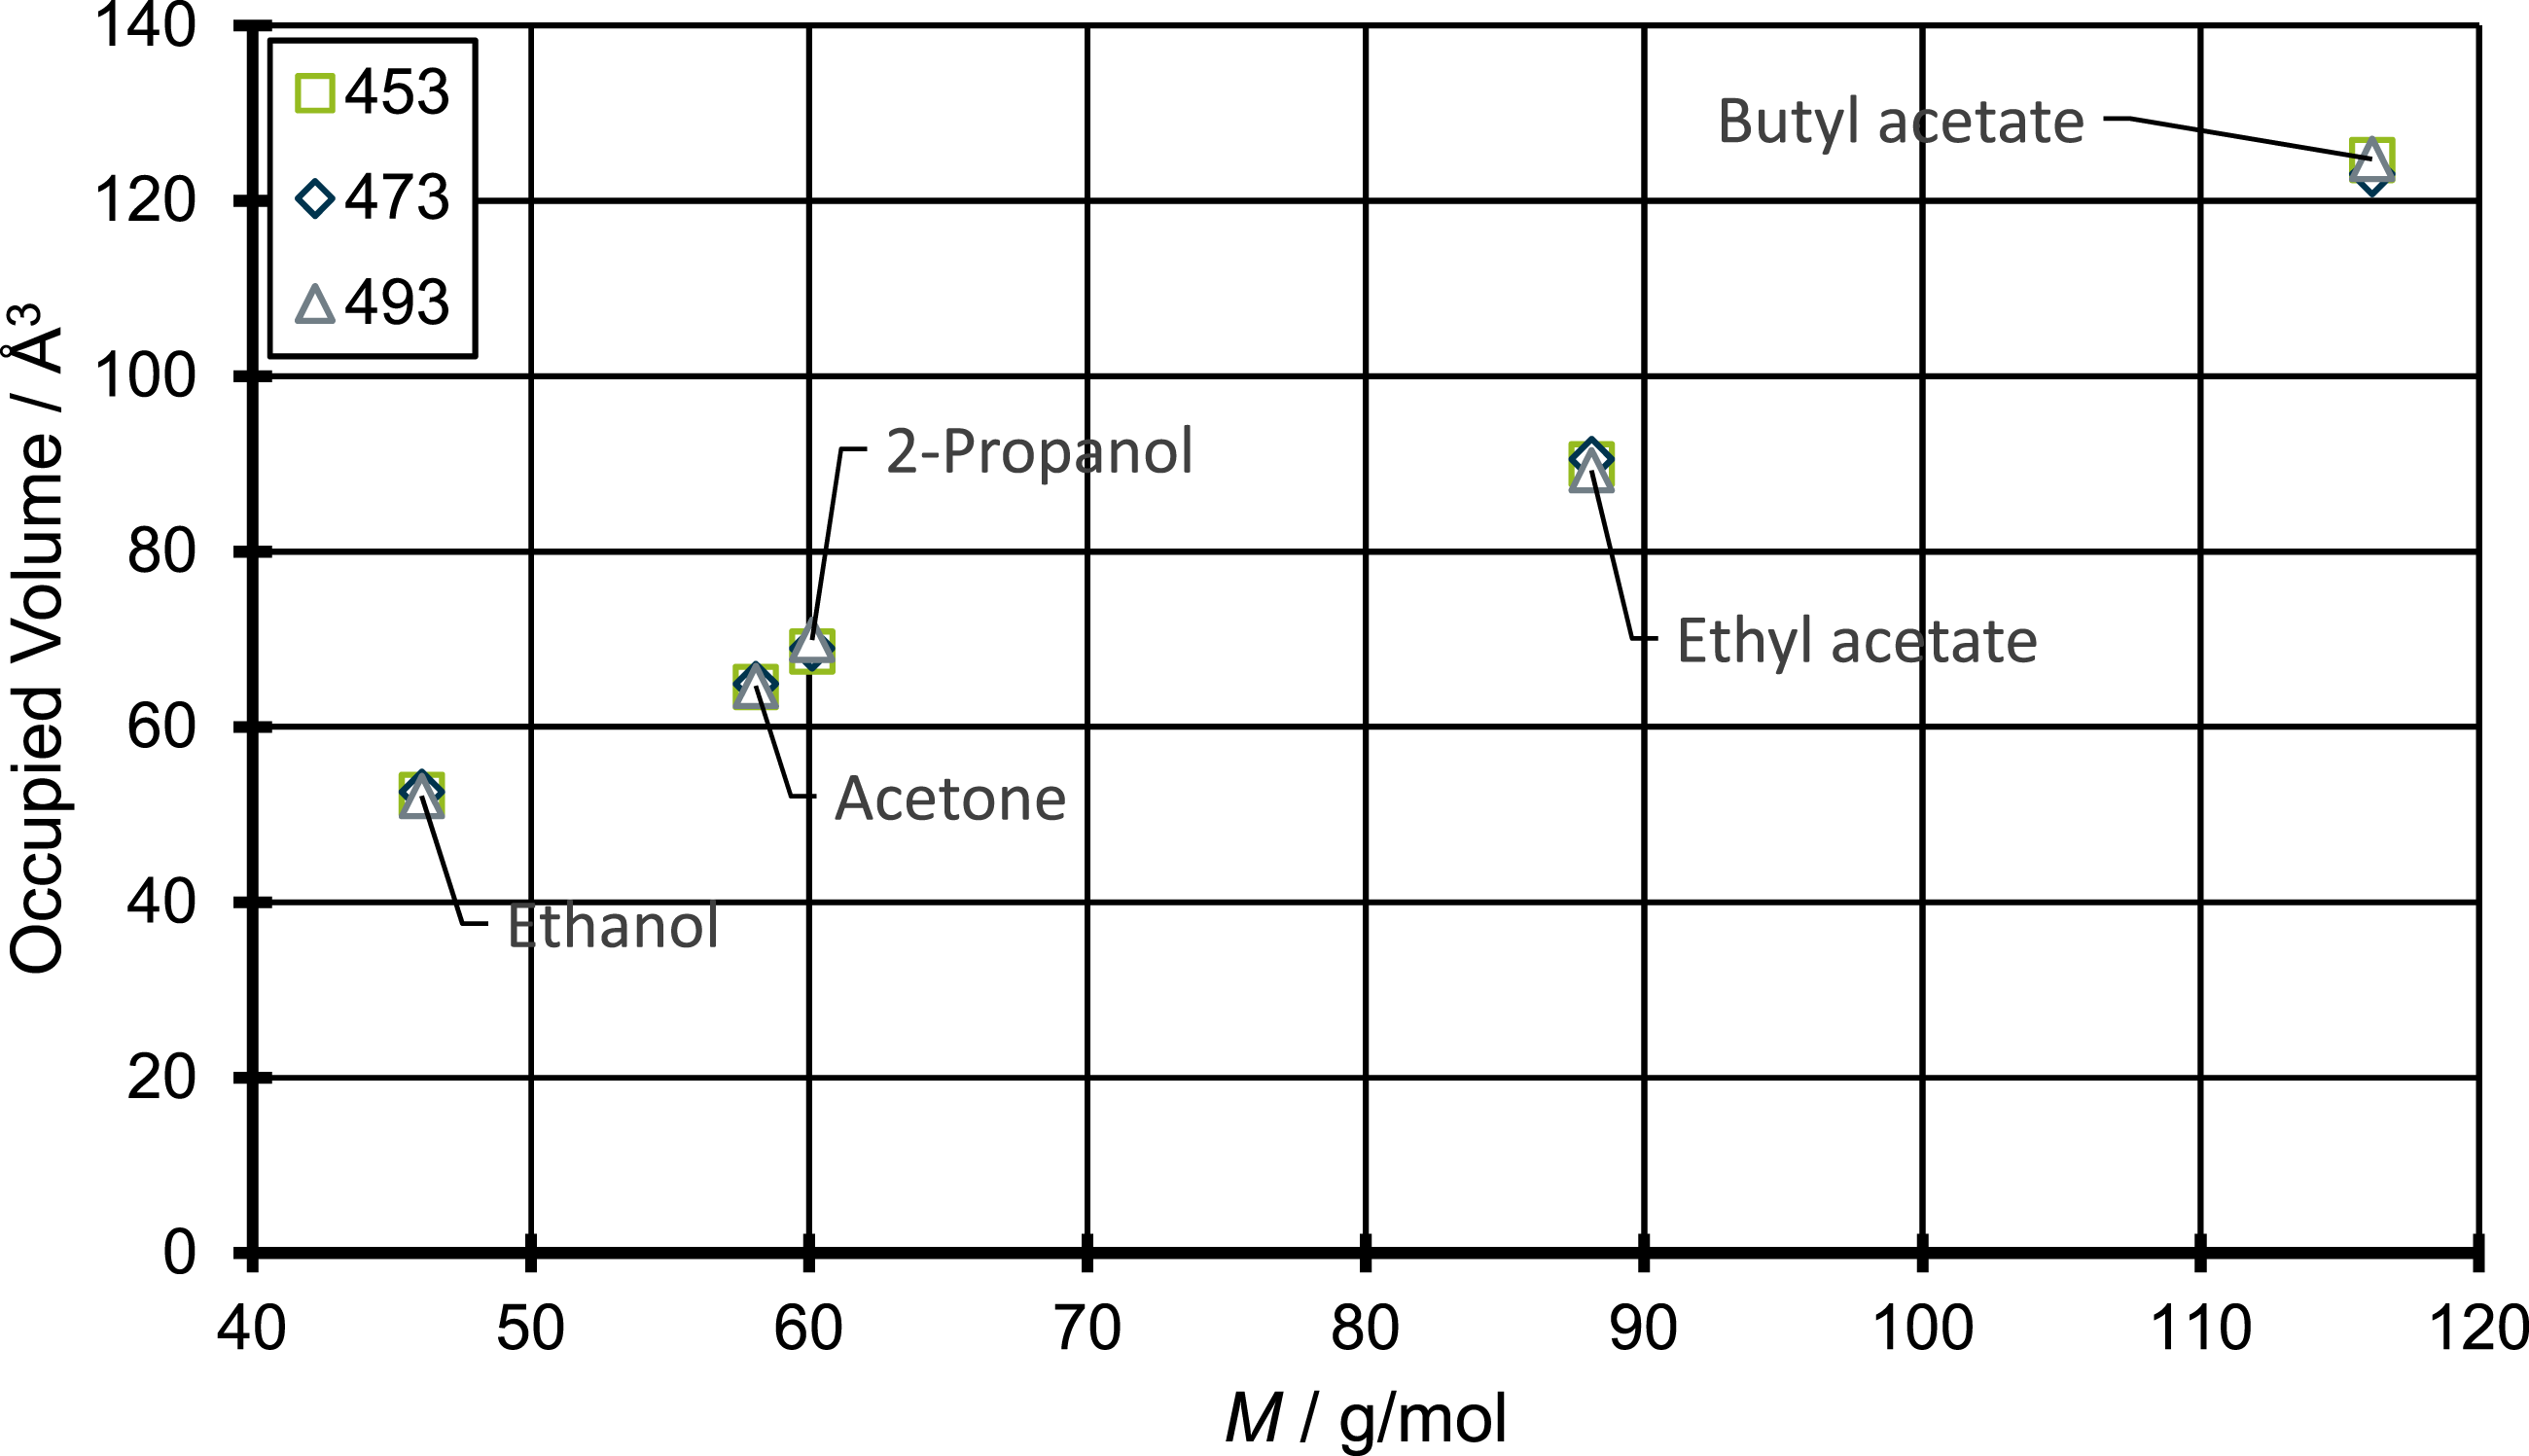
As the plot in Figure 7 shows, the relationship between the occupied volume and the molecular weight is mostly linear for the molecules in question. Solely between 2-propanol and acetone and between 2-propanol and ethyl acetate there are slight deviations from this behavior. In total the differences between the occupied volume and the molecular weight seem relatively small and therefore might not have a great influence on the diffusion coefficients.
One apparent explanation lies in the different polarities of the compounds. The consideration of the polarities of the penetrants is evident because PP as the polymer under consideration is a non-polar compound. Thus, the higher the polarity of the molecule in question, the greater the repulsive interaction between the polymer and the diffusing species should be. Basically, it can be assumed that the polarity increases in the order shown in Figure 8. Molecular structures of the investigated diffusing molecules sorted by polarity.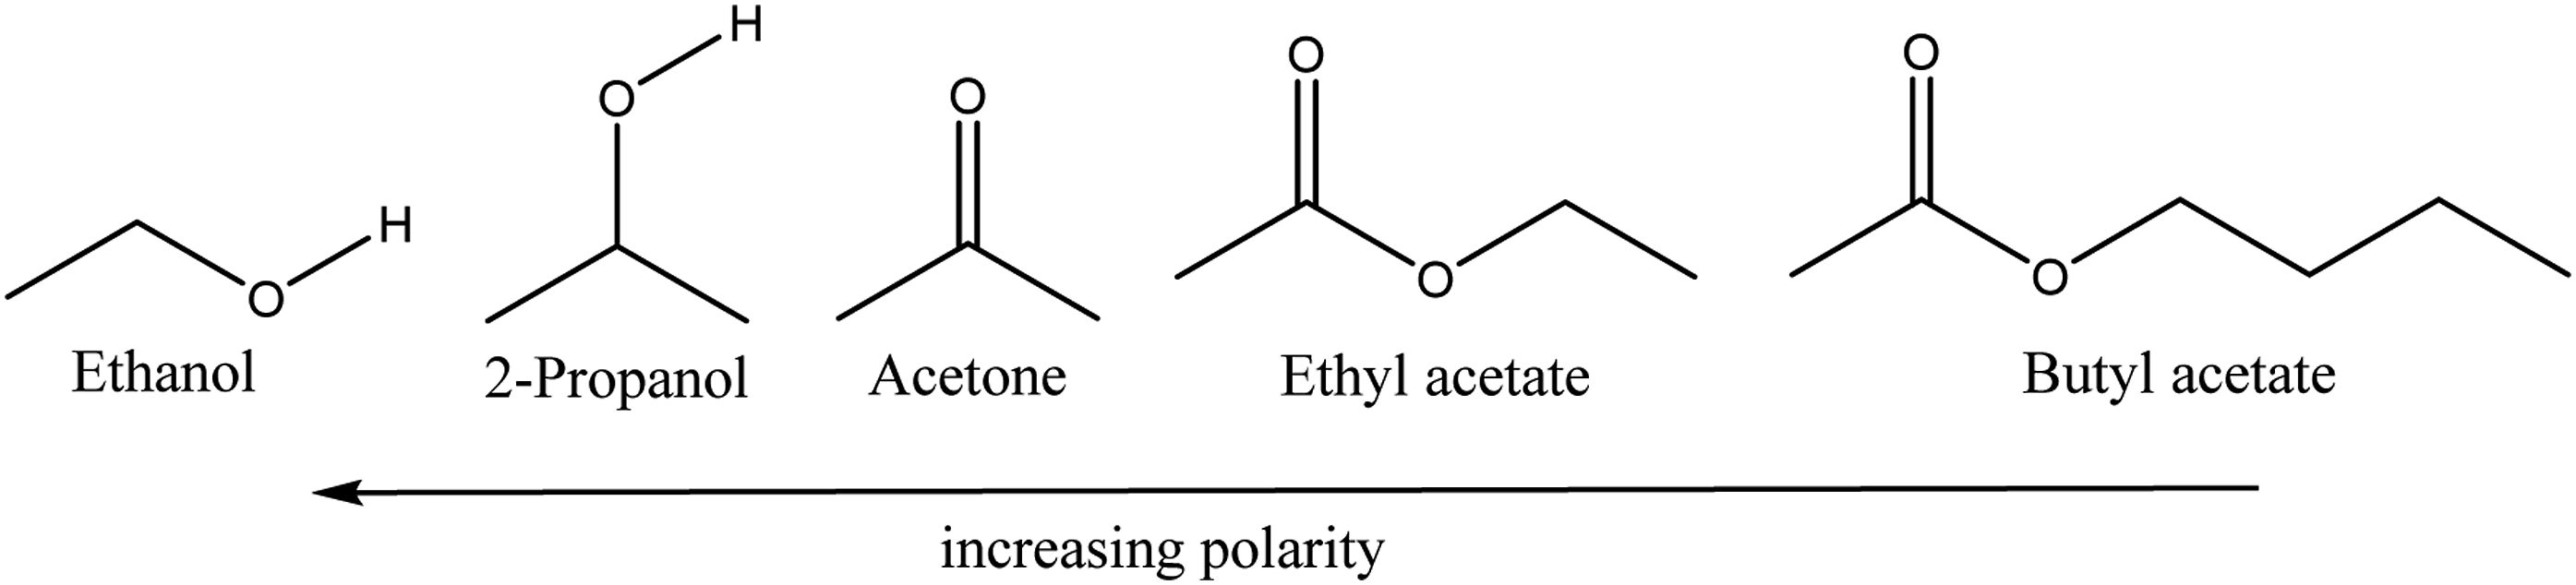
The qualitative picture of the order of polarity shown in Figure 8 is derived from the quantitative measurements by Dimroth et al.
43
, who have compiled a detailed list of ET-values for various solvents, which is often used for describing polarities.43–45 The determination of these values is based on UV/VIS absorption spectroscopy on dyes, which show sensitivity to the polarity of the solvent. As the polarity of the solvent changes, it occurs a peak shift in the absorption spectrum. ET, the excitation energy, can then be calculated from the wavelength of this peak. Since the position of the band depends on the polarity, a quantitative statement can be made about the polarity of the respective solvent.43–45 However, in the works referred to, no such ET-value is given for butyl acetate, but it is reasonable to assume its polarity is lower than the one for ethyl acetate, due to the longer carbon chain of the butyl acetate. By comparing Figure 4 in which the molecules are sorted by increasing molecular weight and Figure 8, in which the molecules are qualitatively sorted by their polarity, one can see that polarity and molecular weight changes in inverse directions, although the sequence of the molecules nearly stays the same. There is only one change in the order of molecules and that is for 2-propanol which has a higher polarity than acetone. This qualitative comparison already gives a hint that different polarities of the diffusing species might by an influence on the diffusion coefficient, besides the molecular weight and size. So, while there is a smaller diffusion coefficient for 2-propanol compared to acetone, although its molecular weight is quite close to the one of acetone, the polarity of the 2-propanol is significant higher. The explanation of the polarities for the differences in the diffusion coefficients is further clarified when the quantitative values for ET, according to Dimroth et al.,
43
are taken into account. For this purpose, the ET values for ethanol, 2-propanol, acetone, and ethyl acetate are plotted against their respective molecular weights in Figure 9. ET values by Dimroth et al.
43
for the molecules under investigation plotted against the corresponding molecular weights.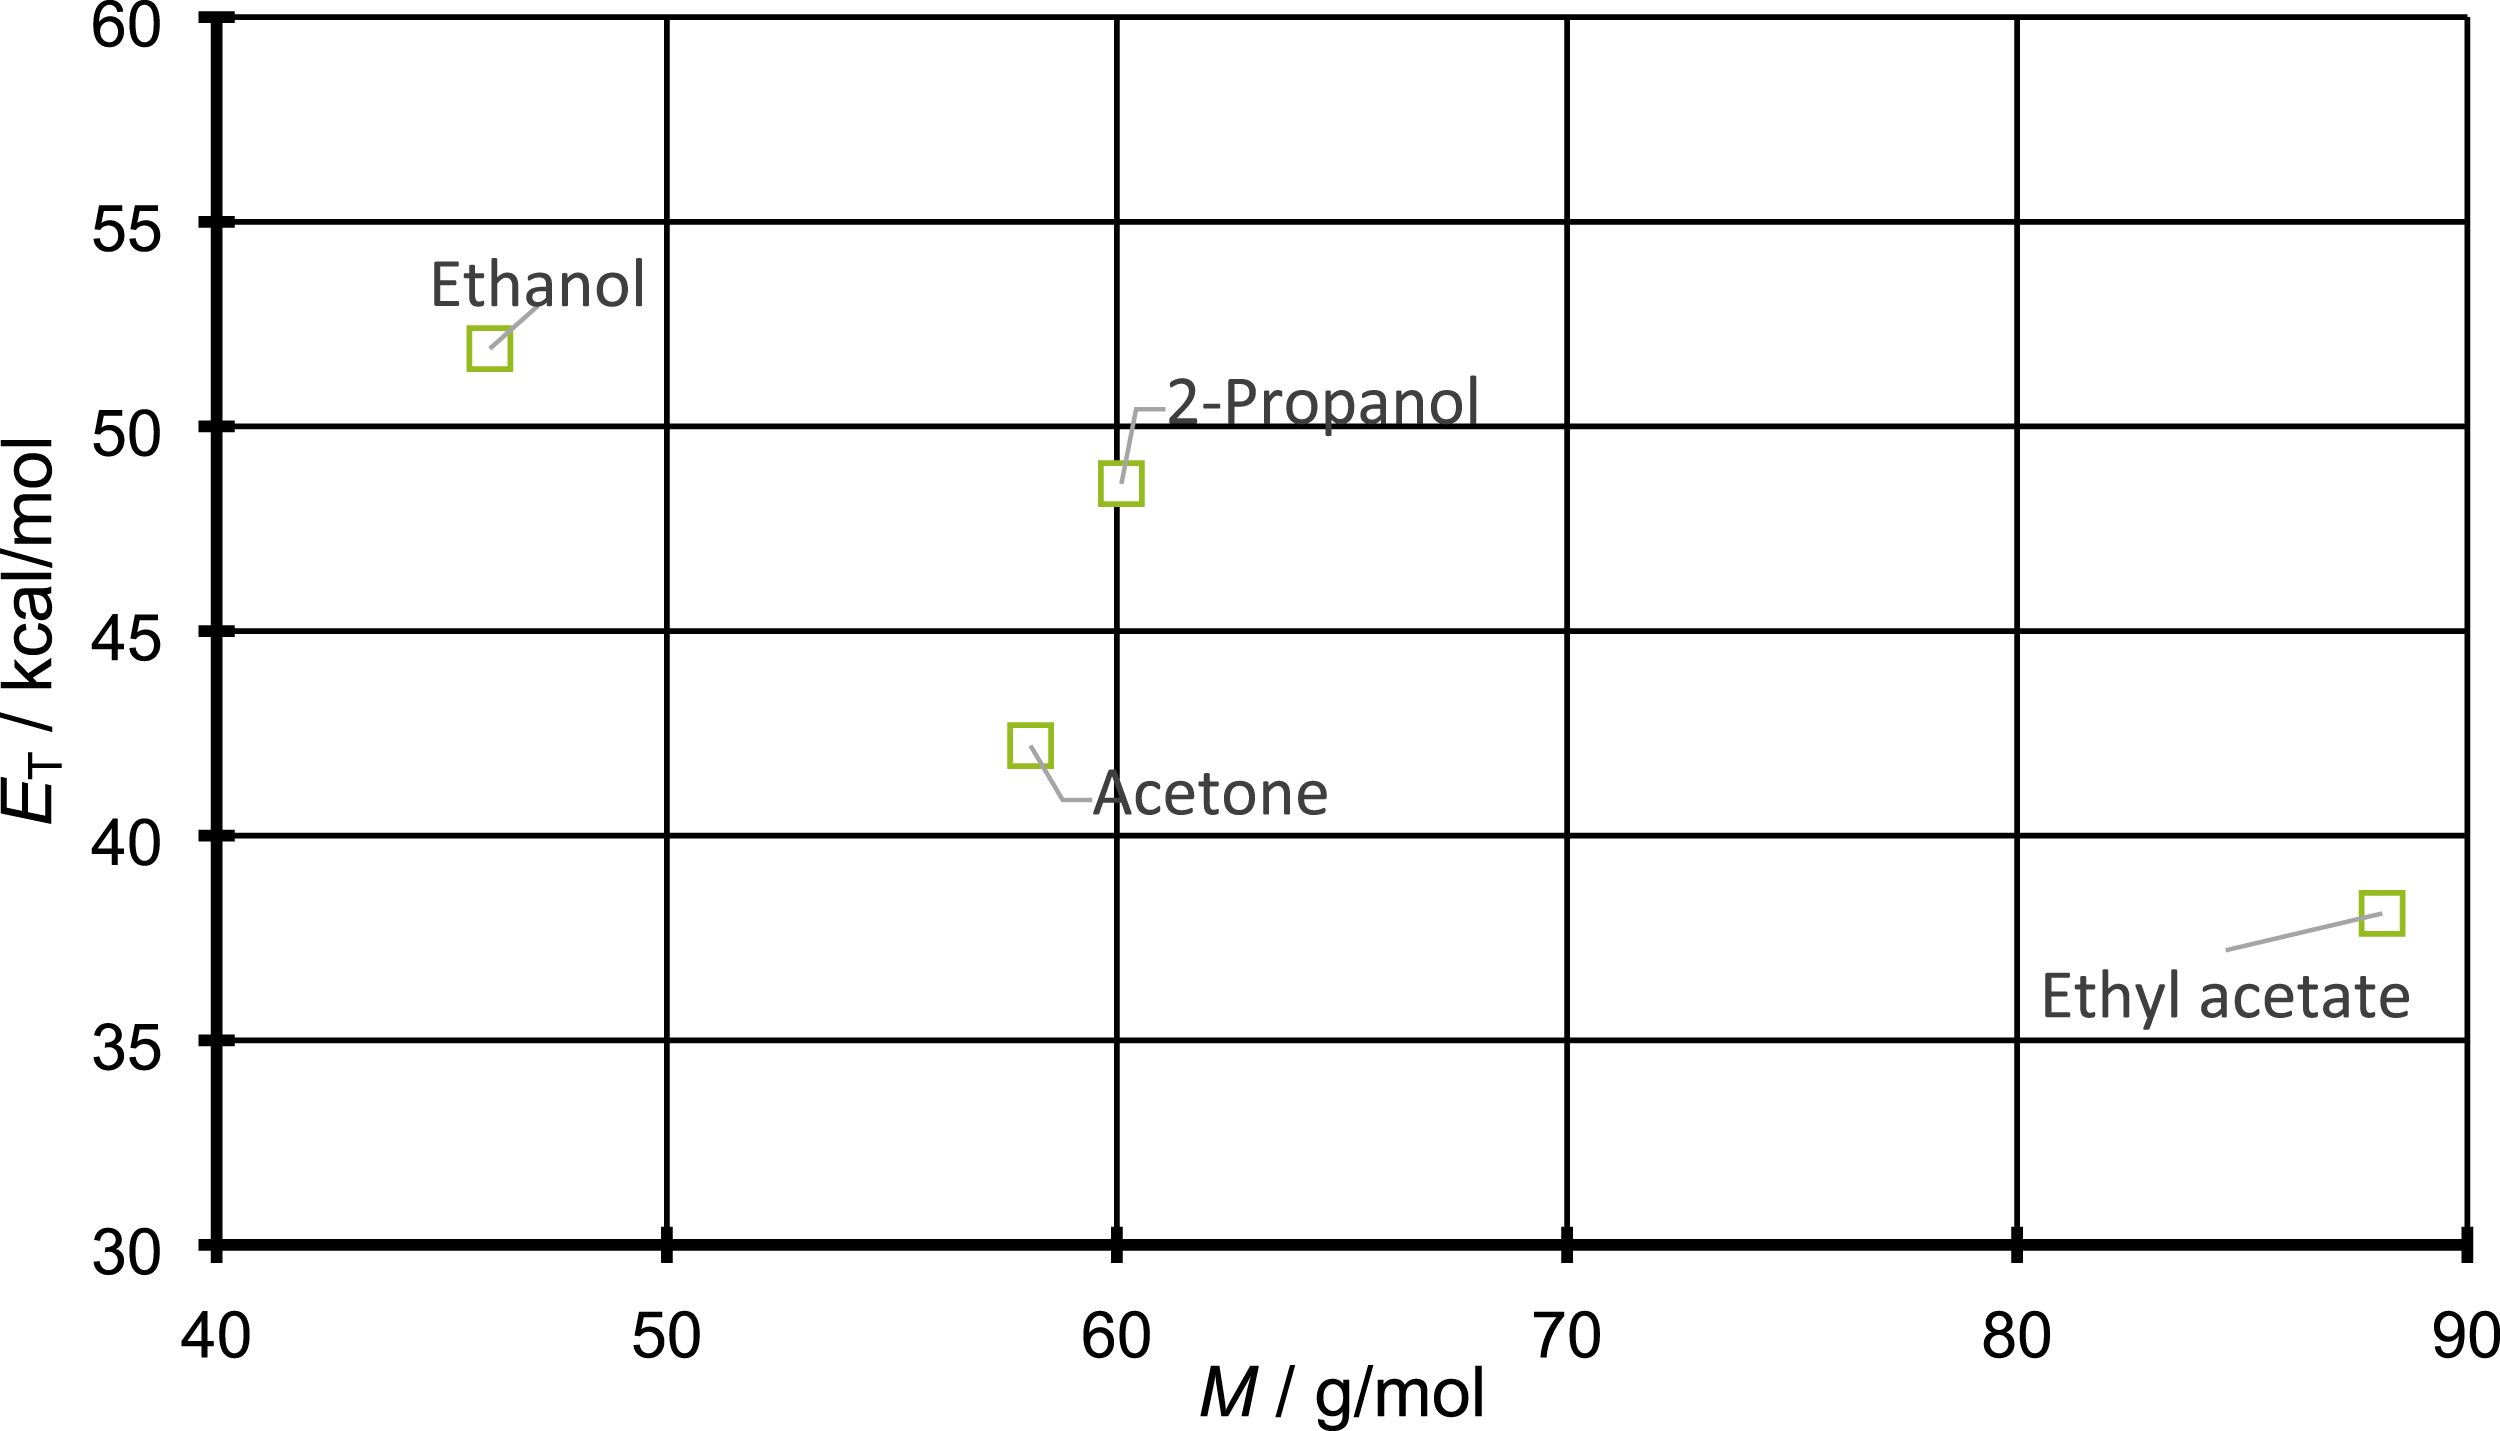
For the ET values plotted against molecular weight in Figure 9, there is a jump upwards from acetone to 2-propanol. This difference in polarity between 2-propanol and acetone might as well explain the difference between their diffusion coefficients. This correlation with polarity would be explained quite clearly. Since PP is a non-polar polymer, an increase in the polarity of the penetrant leads to an increased repulsive interaction between them. Since diffusion in polymers follows a jump mechanism, the increased repulsive interaction results in a higher activation energy for the execution of such a jump in case of polar compounds. In other words, for a polar compound a larger gap between polymers is necessary for diffusion to take place. This finding also would explain why the differences in diffusion coefficient between two propanol and acetone become smaller with increasing temperature. Since elevated temperatures leads to a higher chain mobility, it is possible that above a certain temperature the gaps for the penetrants are so large that the strained repulsive interaction for polar penetrants is of less importance.
The differences in the activation energies can be determined by deriving the Arrhenius plot of the different diffusing systems. The results are shown in Figure 10. Arrhenius plot of the diffusion coefficients for ethanol, acetone, 2-propanol, ethyl acetate and butyl acetate.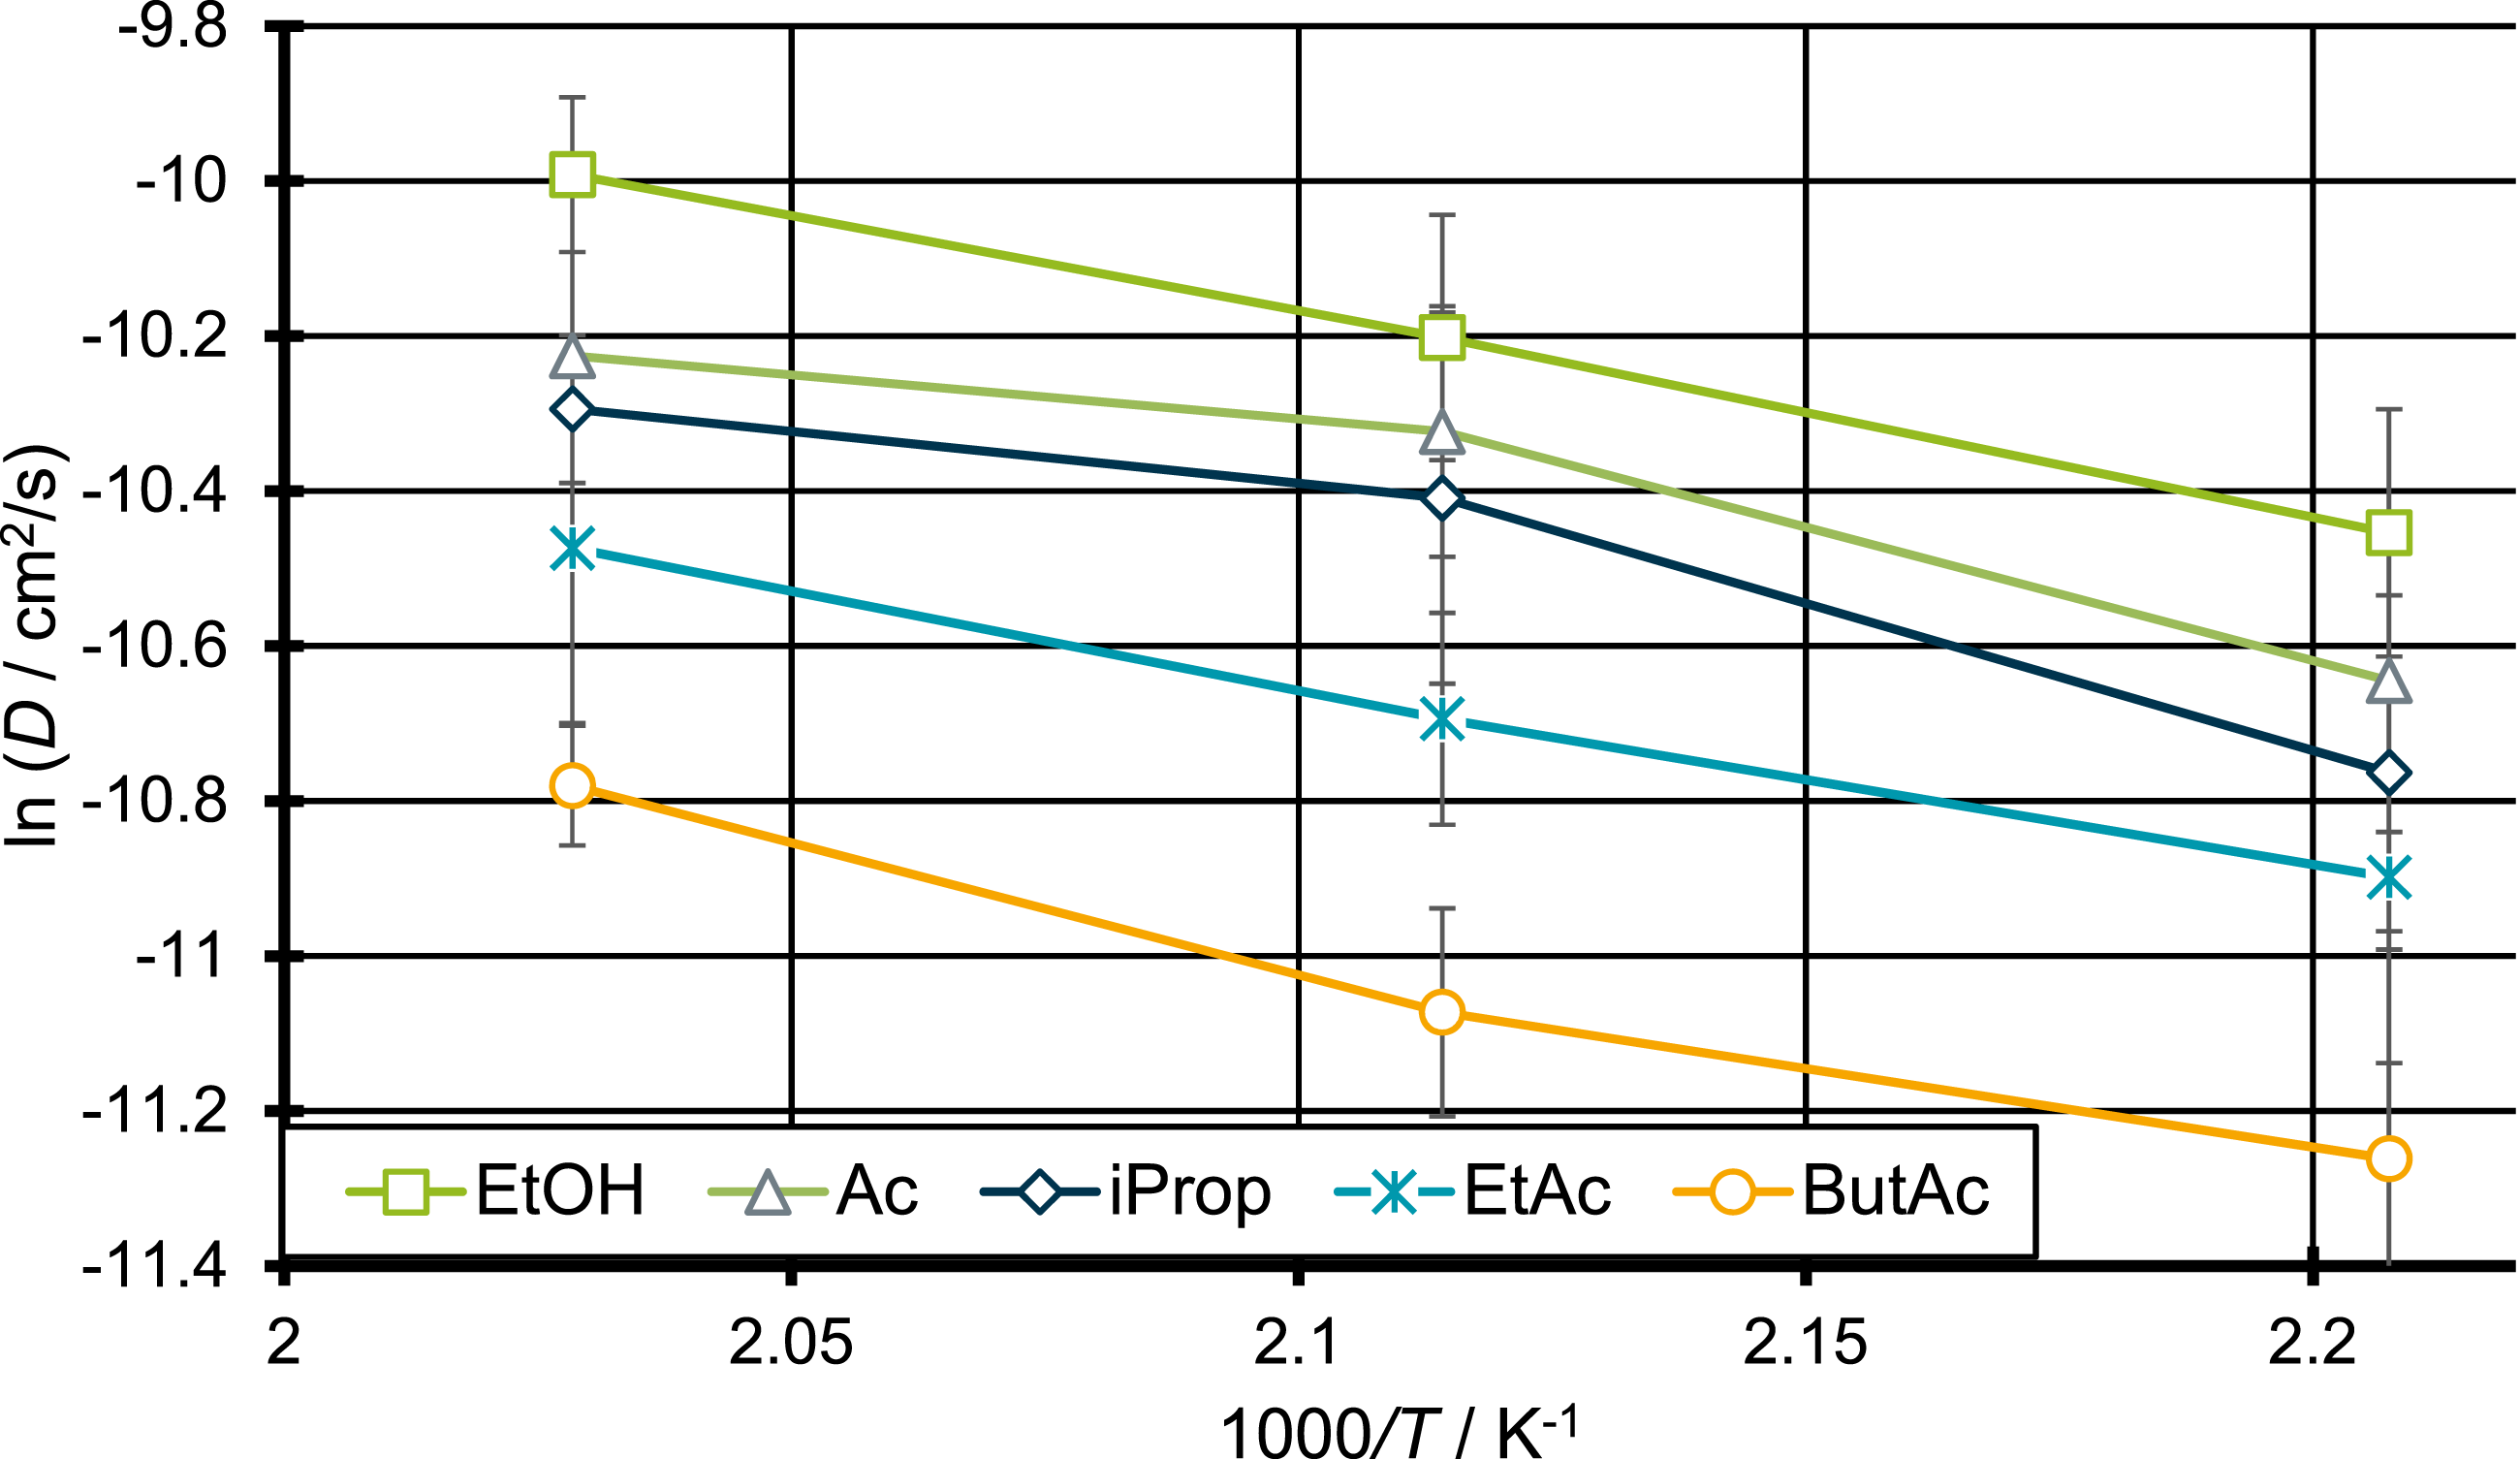
Activation energies for the molecules investigated in this work.
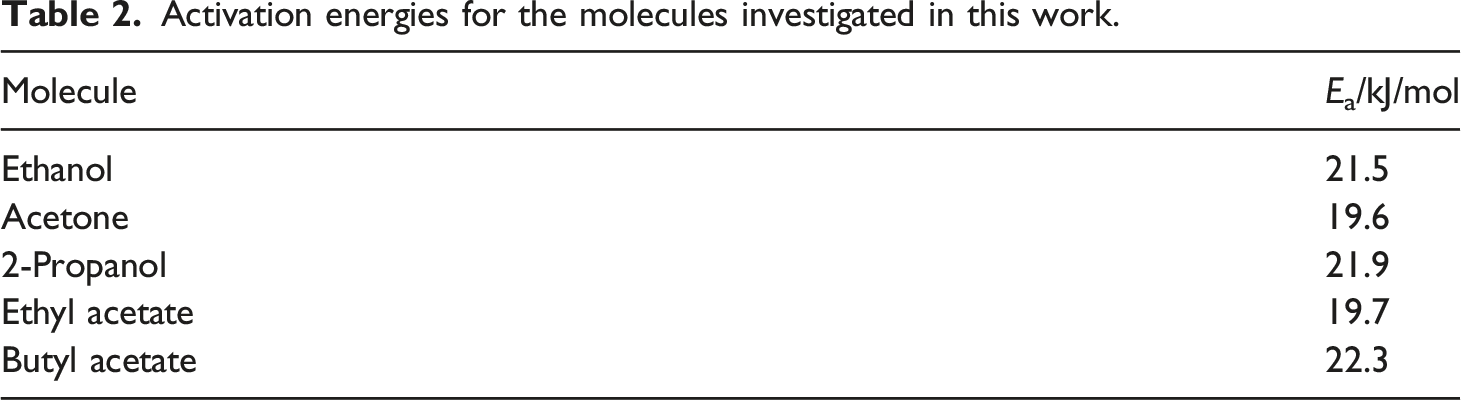
As can be seen, the diffusion of butyl acetate through PP requires the highest activation energy of all molecules investigated in this work. Since butyl acetate is the penetrant with highest molecular weight this result was to be expected. More interesting is the fact that the activation energies for ethanol and 2-propanol are both higher than the ones of acetone and ethyl acetate. This and the fact that the activation energies for the acetone molecule and the ethyl acetate molecule are almost identical, support the assumption made earlier that increased polarity leads to increased activation energies for the diffusion through PP. This supports the theory that the diffusion of 2-propanol and ethanol is slowed down despite their relatively small sizes compared to the other components, due to their higher polarity. Thus, the size or molecular weight might not be used as the only factor for evaluating the quality of the diffusion coefficients determined in this work.
In summary, the determined diffusion coefficients can be considered reliable, since they correspond to the expected trend compared to values for CO2, N2 and ethanol from our earlier work, if several influencing factors are considered.
Conclusion
For the modelling of bubble growth, the knowledge of the diffusion coefficients of the blowing agents is of great importance. Therefore, the diffusion coefficients under certain conditions and for different blowing agents are estimated by MD simulation which offers the possibility of reducing the experimental effort. The first step of this work was to investigate the influence of pressure applied directly to the simulation box on the diffusion of CO2 in PP. At the elevated temperatures which were used for the simulations, the polymer can be assumed to be in a rubbery or liquid state of matter. In the simulations no significant pressure influence on the CO2 diffusion through the PP was found. Since this result was achieved only for the already with CO2 loaded polymer melt further simulation in which an external CO2 pressure is applied on the polymer melt would be of interest. Next, the influence of mixing a blowing and co-blowing agent in one system was examined. Therefore, ethanol and CO2 were chosen and their diffusion coefficients in PP were simulated for different concentrations. The results showed only small influences on the estimated diffusion coefficients when the concentrations of the two penetrants were varied. Only when the values of pure CO2 and the mixtures of CO2/ethanol are compared there is a slight increase in the diffusion coefficient. But with increasing ethanol concentration and decreasing CO2 concentration no changes were detected above the standard deviation. So, while the influence in the change of the diffusion coefficient between simulations with and without ethanol is visible but small, the influence of increasing the co-blowing agent concentrations seems neglectable in the case of ethanol. Further studies are necessary to determine how mixtures of molecules that interact more strongly with each other behave. Finally, the diffusion coefficients of molecules with higher molecular weight, compared to ethanol, were determined and due to a lack of literature values to compare with, the results were assessed compared to earlier results. To be able to estimate the quality of the simulated diffusion coefficients for this higher molecular weight penetrants, the values were compared relative to what one would expect in light of the differences in molecular weight but also in polarity. In summary, the obtained diffusion coefficients can be viewed as reliable for the studied cases, if different influences on the diffusion through PP are considered. So, the simulated values can be used for the modelling of bubble growth, and it therefore was possible to reduce the experimental afford needed for such modelling.
Footnotes
Acknowledegments
Computational results were obtained by using Dassault Systèmes BIOVIA software programs. BIOVIA Materials Studio was used to perform the calculations and to generate graphical results.
Declaration of conflicting interests
The author(s) declared no potential conflicts of interest with respect to the research, authorship, and/or publication of this article.
Funding
The author(s) disclosed receipt of the following financial support for the research, authorship, and/or publication of this article: Funded by the Deutsche Forschungsgemeinschaft (DFG, German Research Foundation) under Germany’s Excellence Strategy – EXC-2023 Internet of Production – 390621612.