
Abstract
Polymer foams offer high sustainable performance in terms of their lightweight potential, insulation and high specific mechanical properties. The foaming of polymers depends on the properties of gas-laden solids or liquids. For foaming in the solid state, the foaming temperature must be higher than the glass transition temperature of the saturated polymer system. Moreover, the knowledge of sorption conditions and thermal properties is crucial for foam formation. In this study, the correlation between the glass transition temperature and the sorption conditions was investigated. This comparison was made by determining the sorption behavior for different pressure levels and the corresponding glass transition temperature using a high-pressure differential scanning calorimetry. The time, pressure and CO2 content were varied. For the first time, the Chow model could be verified for PLA with a coordination number of 3.
Keywords
Introduction
In general, foaming of polymers depends on various influencing factors, such as material type, 1 modifiers,2–5 rheological properties,1,4–10 crystallization behavior,1,11–14 type and amount of blowing agent. 15 However, the influence of modifiers on rheological or crystallization behavior can hardly be separated. Various studies have investigated the influence of temperature on batch foaming of polymers. However, the influence of the blowing agent is often not considered. Especially in batch foaming, the saturation process is crucial and needs to be studied in detail. As an example, CO2 as a blowing agent decreases the glass transition temperature and melting range, resulting in lower foaming temperatures that allow foaming below the initial glass transition temperature (PS, PLA) or melting peak. 16
CO2 is a commonly used blowing agent that leads to plasticization of polymers. Several publications deal with the effect of CO2 on glass transition, melting and crystallization behavior of polylactides and other polymers.13,14,17–23 Li et al. 13 investigated the effect of CO2 on a polylactide using high pressure differential scanning calorimetry (HPDSC). They focused on the non-isothermal crystallization behavior to select the foaming conditions for the foaming of PLA. In this study, the crystallization peak shifts to lower temperatures with increasing CO2 pressure. It was also shown that higher CO2 pressure leads to a higher number of crystals and a lower crystallization half-life. They also plotted the glass transition and melting temperatures versus CO2 pressure. Both the Tg and Tm show a linear decrease with increasing CO2 pressure. Similar results for PLA were shown by Nofar et al. 17 Their work focused on the crystallization behavior of linear and branched PLA in different CO2 atmospheres. It was found that the half-life of crystallization decreases for both linear and branched materials. In this study, the branched system showed the lowest half-lives. With respect to increasing the CO2 pressure from 1 bar to 45 bar, no continuous effect was found. It was found that a pressure of 15 bar gave the highest crystallinity among the pressure levels studied. Regarding the effect of CO2 on the glass transition temperature, different heating rates of 2 K/min, 5 K/min, 10 K/min and 20 K/min were investigated without significant deviations. Here, the drawdown was linearly related to the applied pressure. This linear dependence was also shown by Takada et al. 20 and Li et al. 13 for polylactide. The results for the dependence of Tg on the CO2 pressure in PLA systems from Nofar, 17 Takada 20 and Li 13 show a linear behavior. However, these studies refer to the dependence of the Tg on the loading pressure. Other models such as the chow model are predicting the glass transition depending on the amount of gas dissolved in the polymer.
In this study, we aim to show that neither the amount of CO2 nor the pressure level provides a comprehensive prediction of the glass transition of the polymer-gas system. We claim that the sorption conditions based on the saturation pressure must be taken into account to obtain a comprehensive information about the state of the polymer-diluent system. Additionally, the glass transition temperature will be correlated to the CO2 content which can be used in other applications to predict the processing temperatures.
Prediction of Tg depression in PLA-CO2 systems
The deviation of glass transition in polymer-gas mixtures can be calculated with the Chow model.
24
Chow’s model was developed based on the assumption of Gibbs and Di Marzio that the entropy at Tg is zero.
25
The model was developed by Chow to predict the Tg of polymer dilution systems based on classical and statistical thermodynamics.
24
Numerous studies have proved this model to estimate Tg depression for various polymer CO2 systems.25–27 Chow’s model is based on both classical and statistical thermodynamics. The glass transition depends on the diluent concentration, molecular weight, number of lattice sites, monomer weight and isobaric heat capacity of the polymer.
24
Following the calculations to determine the glass transition temperature depending on the CO2 content are shown
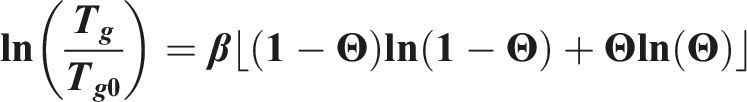
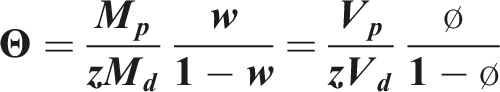
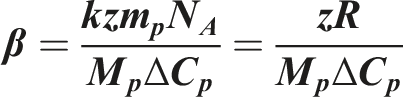
Chow’s equation was used to predict the change in glass transition temperature for a PLA-CO2 mixture. The following values Mp = 72 g/mol and Md = 44 g/mol and ∆ Cp = 0.559 J/(g K) were used. The Chow model states that Z = 1 and Z = 2 for the state of the diluent is gas and liquid, respectively. When the diluent CO2 is near the supercritical point, it can be either gas or liquid or both states.
25
Considering these factors, the predicted Tg values for Z = 1, Z = 2 and Z = 3 are used and shown as solid lines in orange color (Figure 1). An increasing Z value, which represents the number of dilution molecules adjacent to the polymer, leads to a greater decrease in the glass transition. It has been shown that the coordination numbers Z = 129,30 or Z = 2
24
agree well with the experimental data. However, the Chow model has not been applied to amorphous PLA, where the crystallization effects due to plasticization can be neglected. Theoretical calculation of the glass transition depending on CO2 uptake and the coordination number of PLA based on the chow model.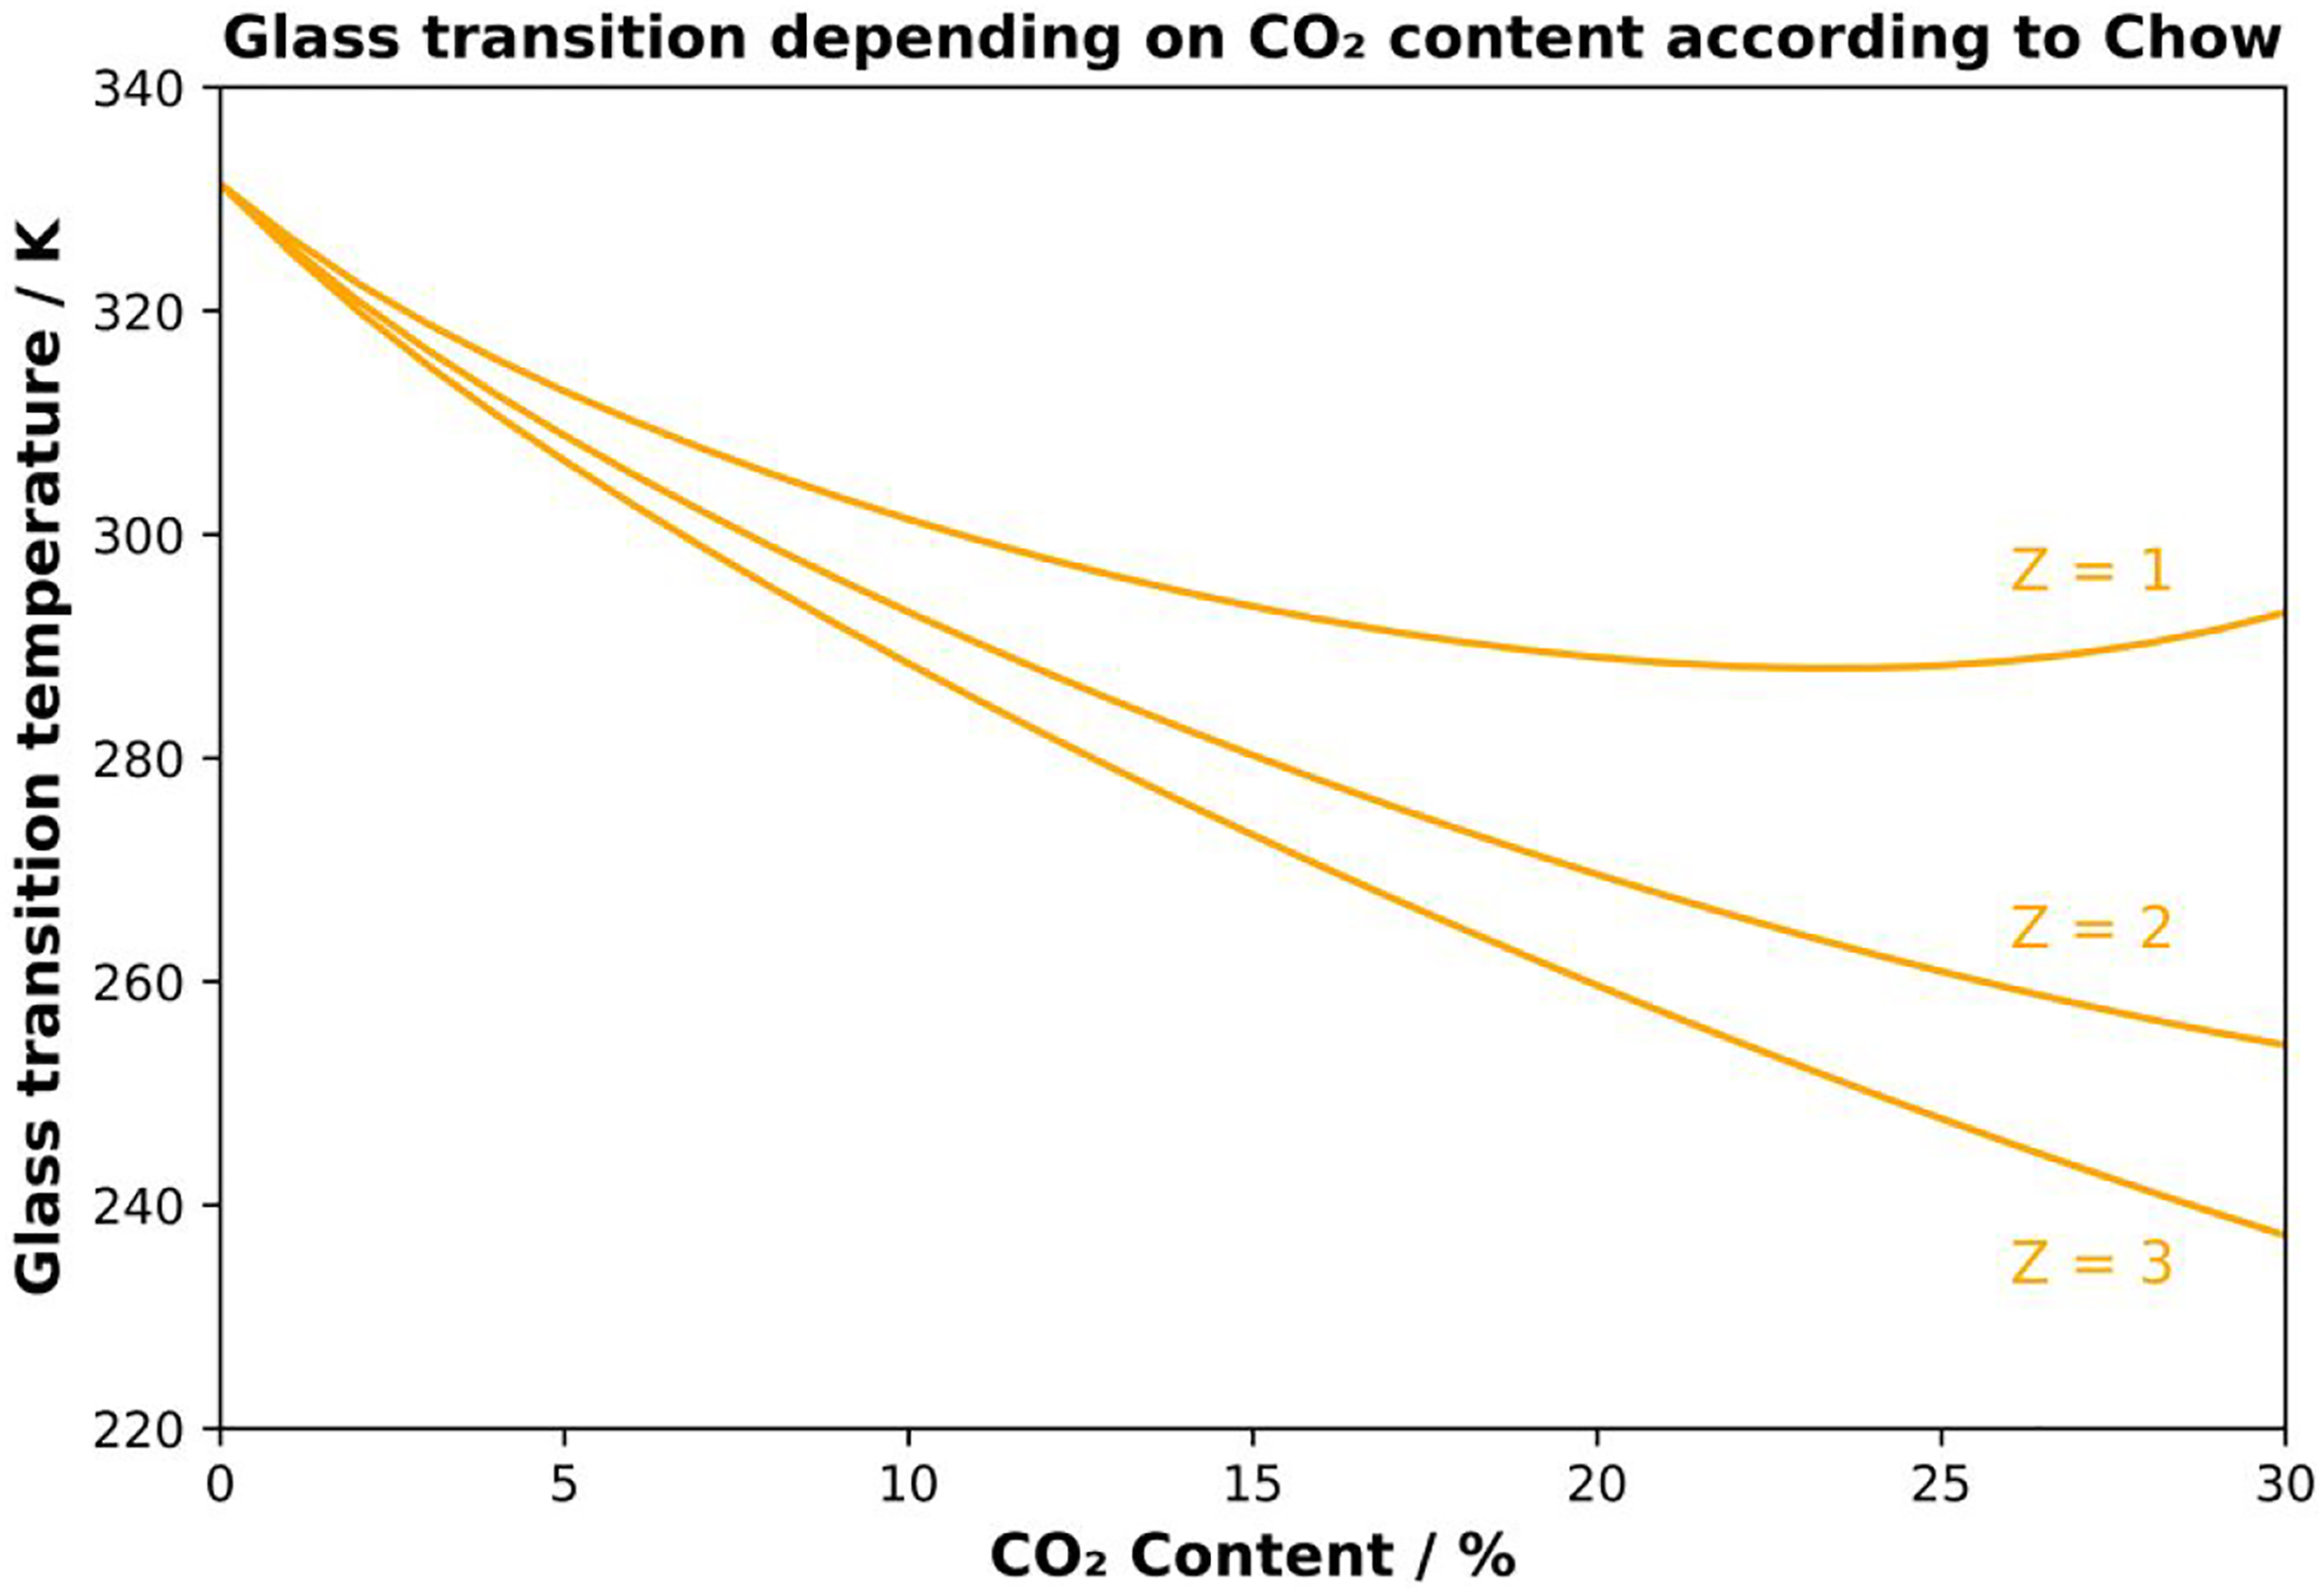
Materials and methods
Materials
For this study, an amorphous polylactide with a D content of 12% (IngeoTM Biopolymer 4060D) from Natureworks Ltd. (Minnetonka, USA) was used. The molecular weight (Mw) is 217,000 g/mol with a polydispersity index (PDI) of 1.84. This polymer was selected because it is known to remain amorphous. Crystallization during the saturation process would falsify the measurements here.
Methods
Sorption
An autoclave (HR -700, Berghof products and instruments GmbH, Eningen unter Achalm, Germany) to perform CO2 sorption measurements. Samples were prepared by hot-pressing into specific geometries of 10 mm × 18 mm × 0.55 mm. Measurements with these samples were performed at room temperature and a CO2 pressure of up to 5 MPa. After saturation, the polymer samples were weighed using a balance (Mettler Toledo, Columbus, USA) to determine the gas uptake.
High pressure DSC
A high-pressure DSC (DSC 204 HP Phoenix, Netzsch, Selb, Germany) is used to determine the effect of CO2 on thermal properties. CO2 pressures of up to 5 MPa for a saturation time of up to 16 h were investigated. The chamber was purged with CO2 at a flow rate of 20 mL/h. Due to the inertial system, the heating and cooling rates are lower than in a conventional DSC. Samples were saturated in the HPDSC at different pressures for different times. After the saturation step, the samples were cooled at 2.5 K/min to 243.15 K (−30°C) and 223.15 K (−50°C) for high saturation levels. During cooling, the pressure was slowly released to avoid foaming. After cooling, the sample was conditioned for 15 min to obtain stable conditions. At the end, a DSC scan was performed at 5 K/min to determine the glass transition temperature.
Results and discussion
First, the sorption behavior was determined to select suitable saturation conditions that can be applied to the high-pressure DSC measurements. After selecting the saturation parameters, the sample is treated in the high-pressure DSC and the thermal behavior is analyzed. Finally, the sorption values are correlated with the measured glass transition temperatures in the HPDSC and the Chow model.
Sorption behavior
The absorption behavior of amorphous PLA was investigated by applying a certain pressure and then weighing it after certain time steps. The results are shown in Figure 2. The samples were removed from the autoclave, weighed and correlated to the initial weight. After this saturation step, foaming of the samples occurred under certain conditions. Under these conditions, measurements could no longer be made and new samples were taken to measure the uptake. Foaming of amorphous PLA directly after sorption has been shown previously.
16
Sorption behavior of amorphous PLA under CO2 atmosphere (note: values based on the sample dimensions).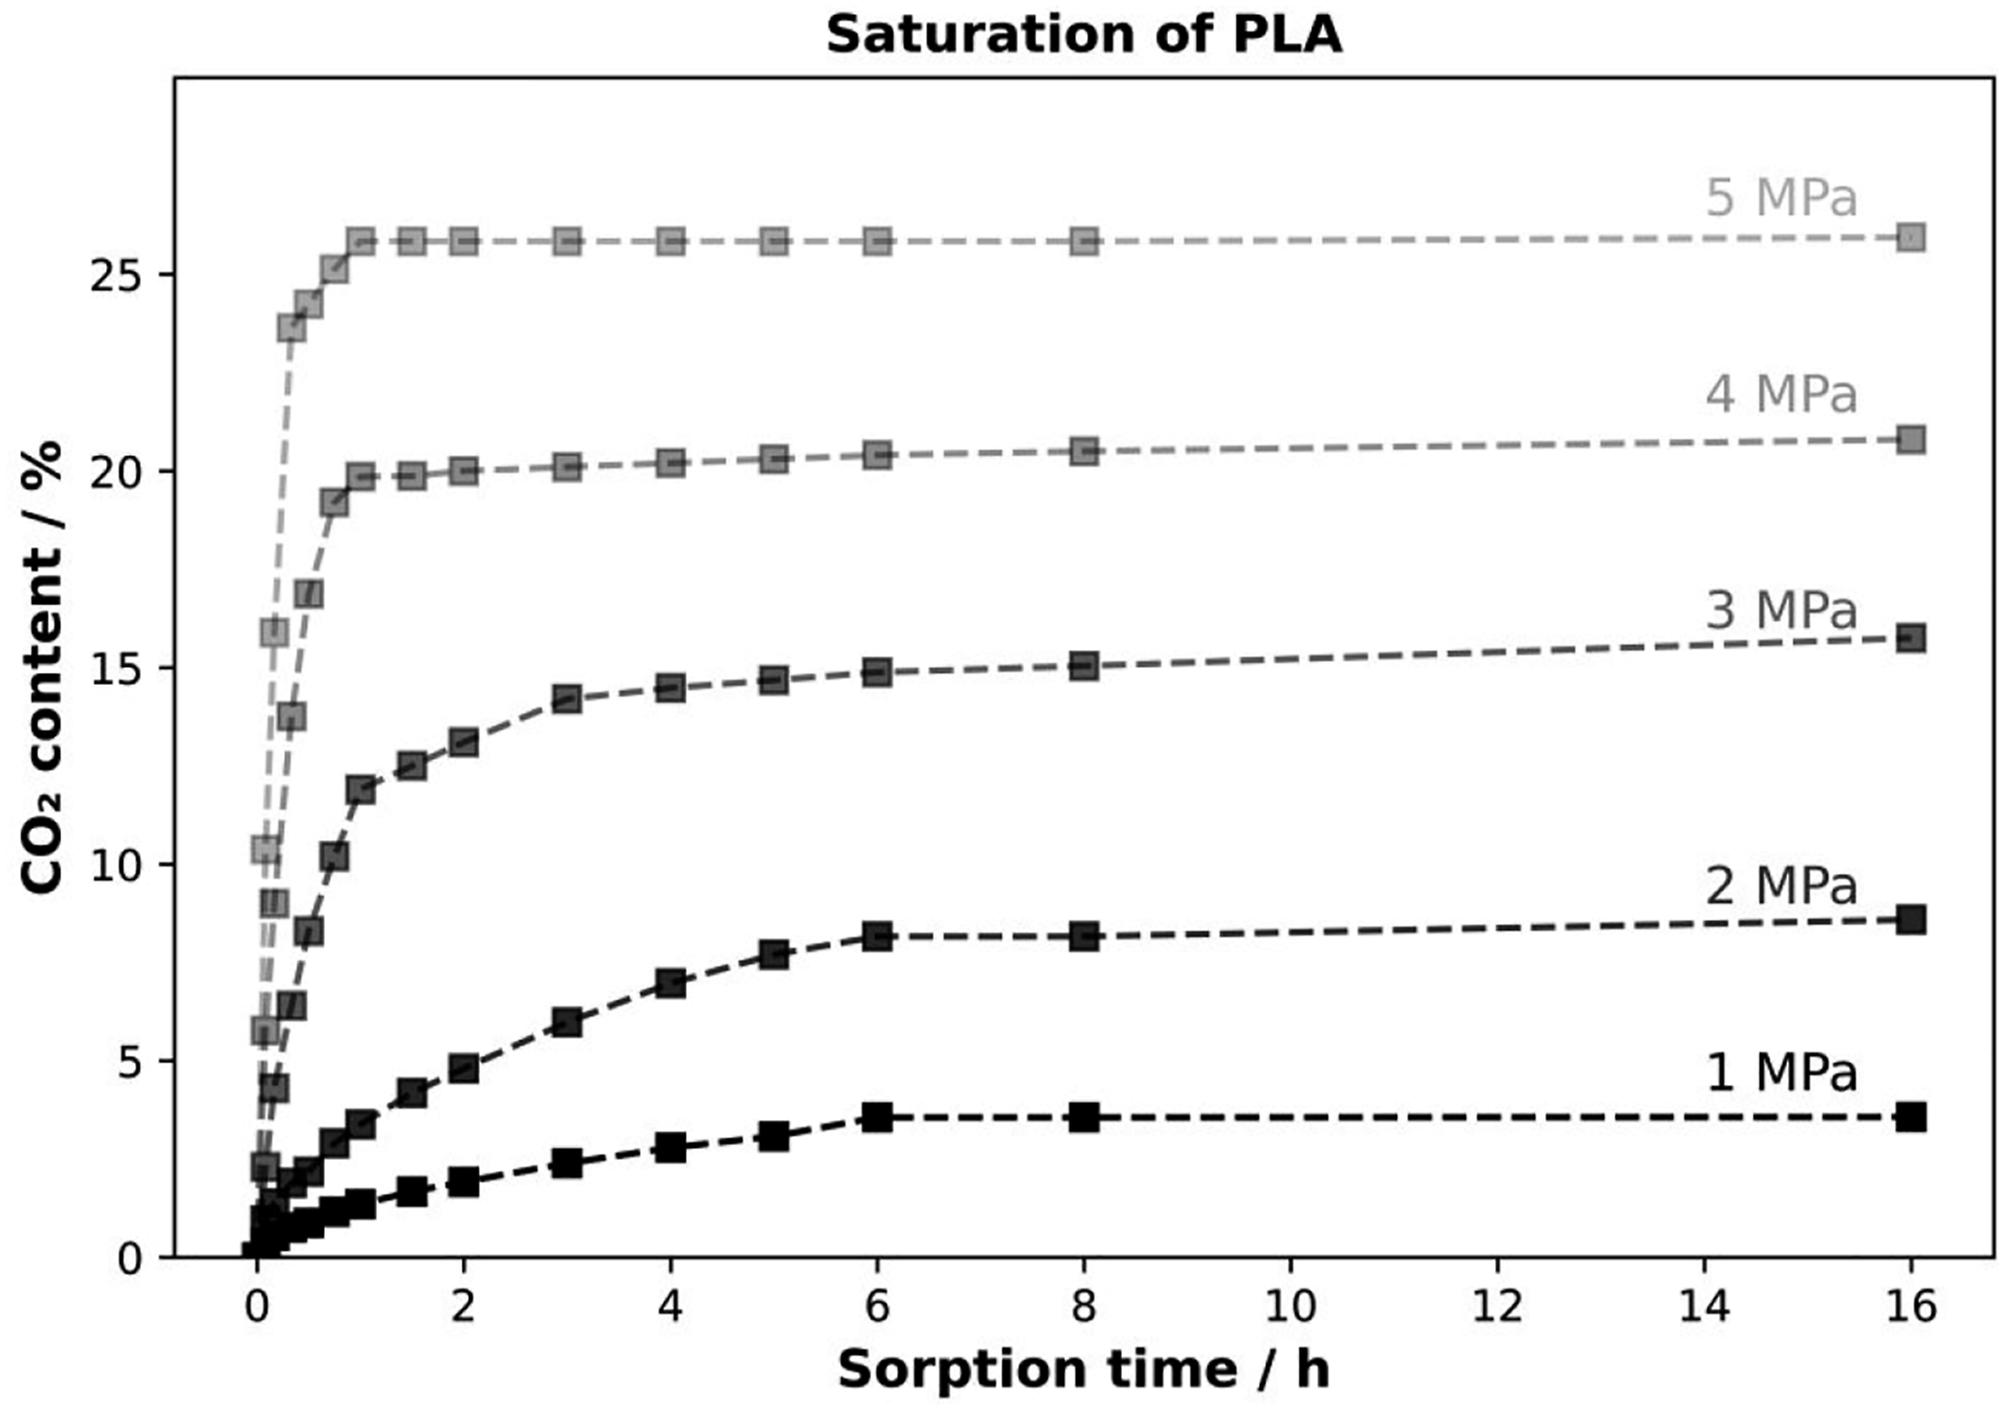
In addition to foam formation, the influence of time and pressure on adsorption can also be analyzed. Increasing the pressure leads to a higher diffusivity and thus to a higher adsorption rate, which can be estimated from the slope of the curves. Moreover, the maximum CO2 uptake shifts to higher values at higher external pressure, which is described by Henry’s law. These values are used to establish a correlation between CO2 uptake and Tg depression.
Investigation of the Tg evolution
The decrease in Tg is verified by high pressure DSC. First, the samples were saturated in the high-pressure DSC at 25°C under a certain pressure. Then, the measuring cell was cooled down, depressurized, and finally heated to measure the glass transition temperature of the saturated PLA-CO2 sample. These measurements are correlated with the sorption results.
Influence of sorption time on glass transition
Due to the inertial characteristics of the high-pressure DSC, relatively low heating and cooling rates were chosen. However, this is the only method for an in-situ saturation process where the thermal response can be measured directly. After the sorption measurements, the material was saturated on the HP-DSC for different saturation times at a pressure of 3 MPa. The corresponding DSC curves are shown in Figure 3. The glass transition temperatures are clearly visible in the measurements. However, sometimes a peak is visible in the region of the initial glass transition temperature and noise is visible at temperatures above 343.15 K (70°C). The peak at the glass transition temperature (Tg0) can be traced back through the volume of the sample to various saturation levels. The artifacts at temperatures above the glass transition are caused by foaming caused by the rapid temperature rise. The foaming led to contact problems within the HPDSC and consequently to incorrectly measured heat fluxes in these temperature ranges. These effects are visible in all measurements but depend on the saturation conditions. Tg evolution at 3 MPa for various saturation times.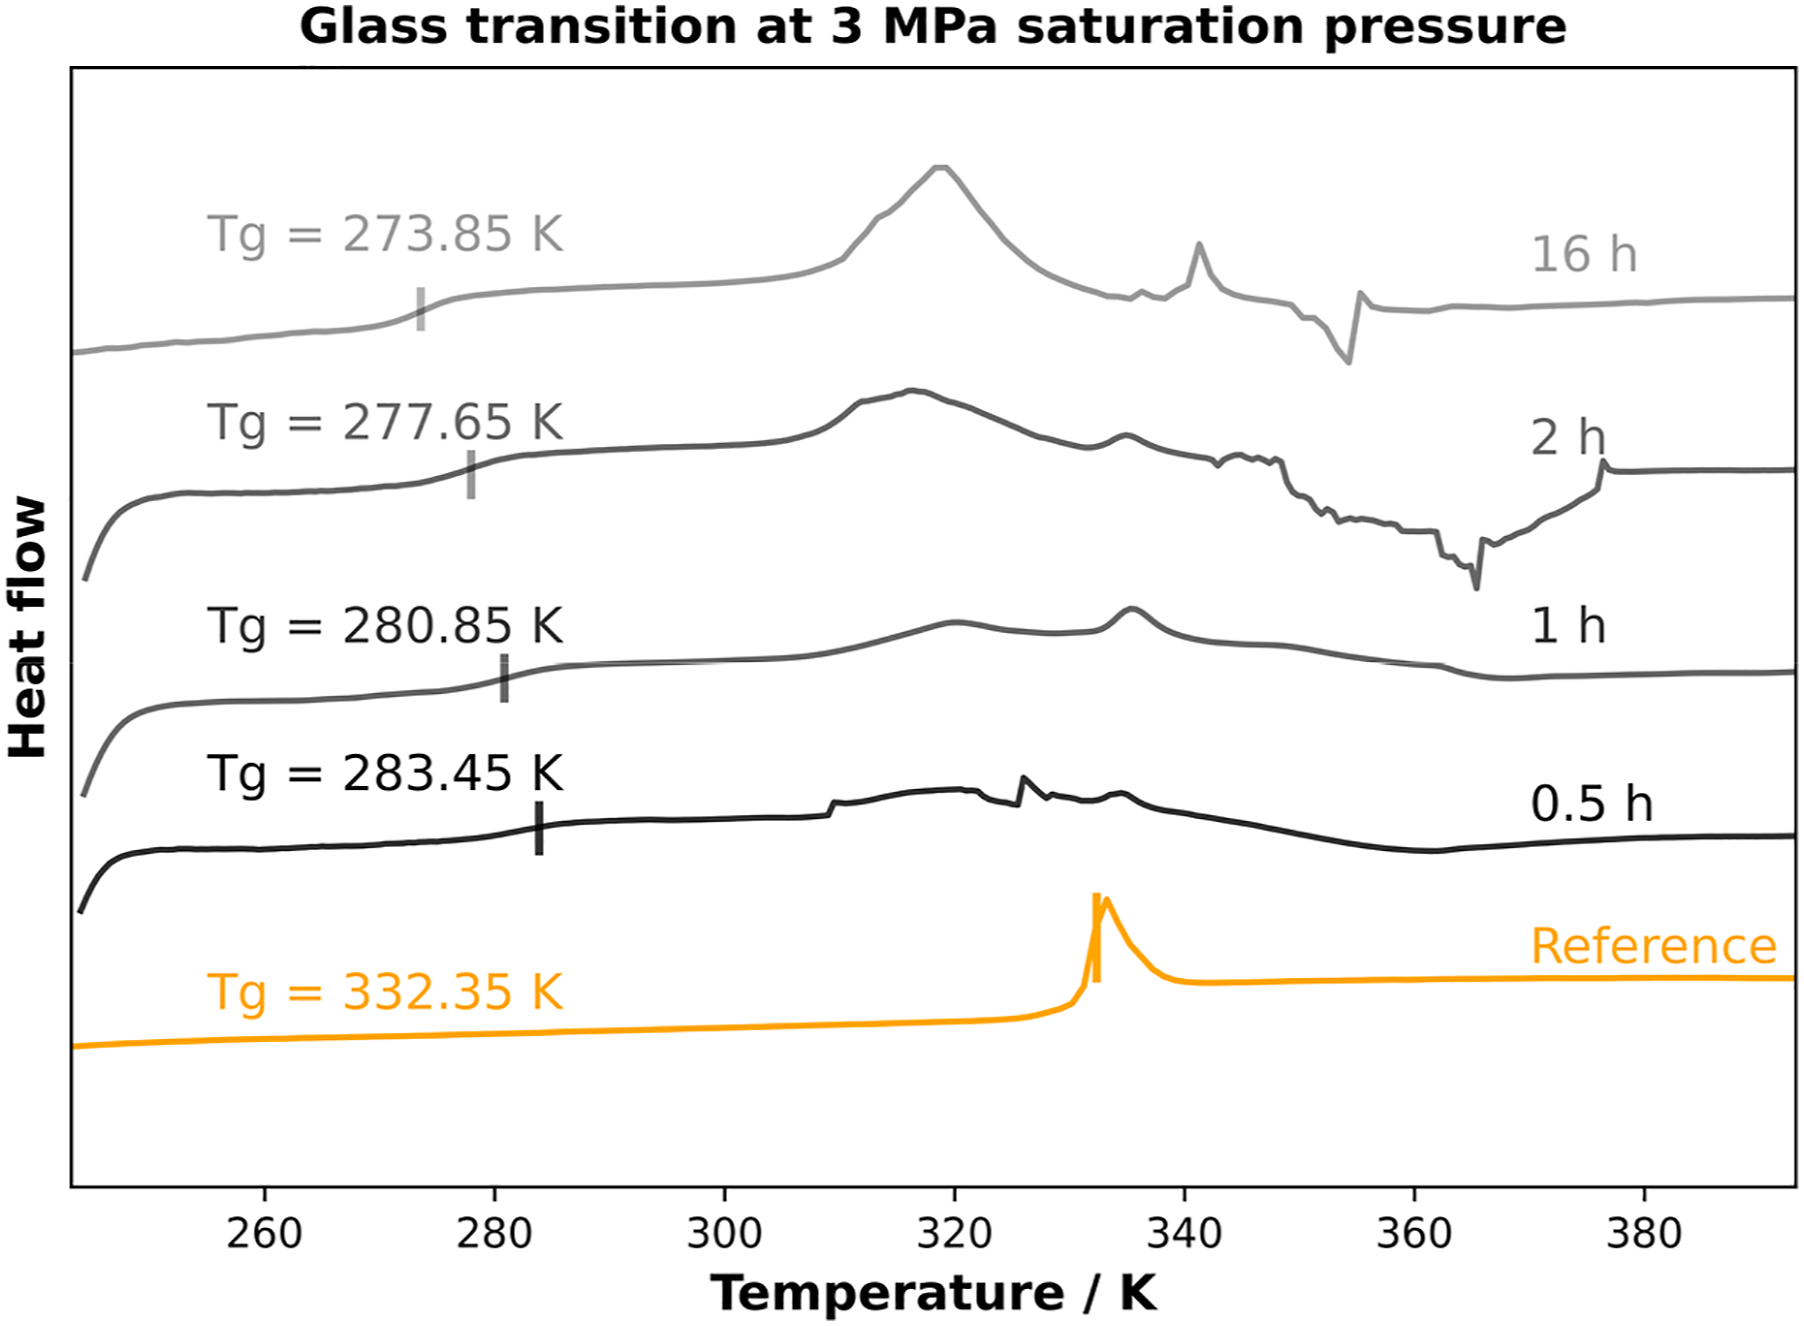
Figure 3 shows the DSC curves for pure amorphous PLA without any saturation (reference) after 30 min, after 1 h, after 2 h and after 16 h at a saturation pressure of 3 MPa. The values were selected based on the sorption measurements. Lower saturation times are not possible due to the inert nature of HPDSC and the corresponding low cooling rate. Nevertheless, the influence of CO2 is clearly visible. After 30 min of saturation at 3 MPa, the measured glass transition depression from 332.15 K (∼59°C) to 283.15 K (10°C) is about 50 K. As the saturation time increases, the glass transition decreases more and more to an equilibrium at 273.85 K (0.7°C), which corresponds to a decrease of almost 60 K. Plotting the glass transition temperature versus saturation time from Figure 3, one can clearly see the variation of the glass transition versus saturation time. This correlation is shown in Figure 4. Even after comparatively small saturation times, a tremendous decrease in glass transition temperature can be seen. Other publications comparing CO2 pressure with glass transition showed a △Tg of about 15 K13, 20 K20, 25 K17 for PLA at 3 MPa. These results show that the way of preconditioning is important to understand the influence of CO2 on the polymer system. Glass transition temperature as a function of saturation time at 30 bar of saturation pressure in CO2 atmosphere.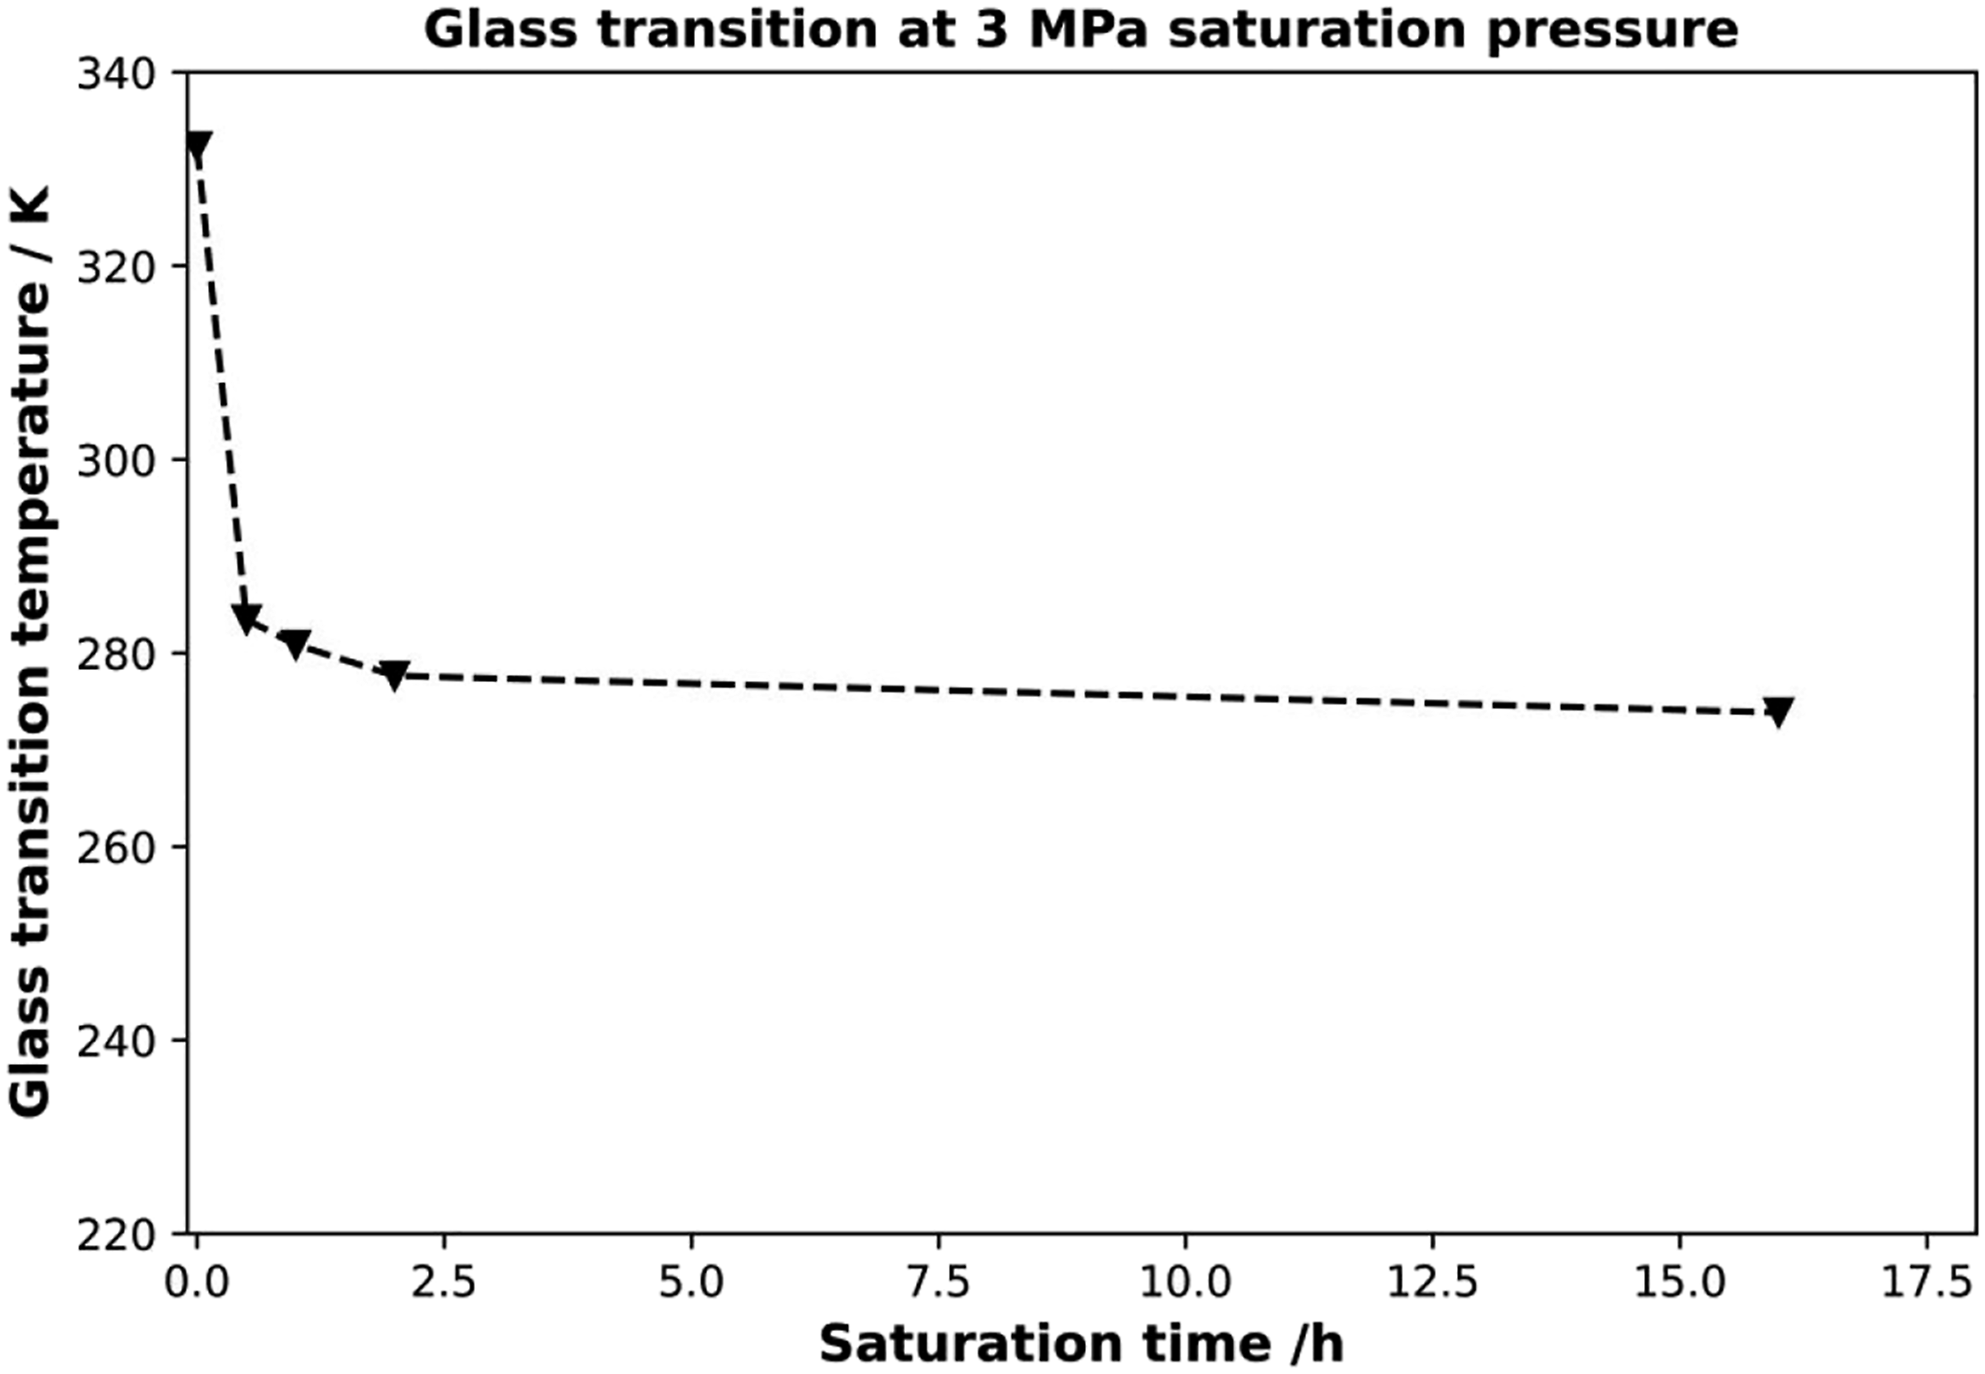
The low saturation times have a huge effect on the glass transition temperature, while with increasing saturation time the decrease is less pronounced. Here, it is assumed that the plasticization is more pronounced at the sample edges, leading to a rapid decrease in Tg, which is not representative of the whole sample volume, but is responsible for the measured value. The sufficient saturation time is highly dependent on the material, the pressure, and the temperature during the saturation. As an example, a pressure of 3 MPa for 1 h ws not sufficient to lead to a fully saturated sample. However, a pressure of 5 MPa for 1 h was enough time to ensure a fully saturated sample. These results underline that knowledge of the sorption conditions is crucial for the foaming of polymers.
Influence of CO2 pressure on glass transition
In addition to sorption time, pressure affects diffusion rate and thus gas uptake. By varying the CO2 pressure for identical saturation times, the effect of gas pressure on the sorption conditions in the polymer can be worked out. Therefore, the CO2 pressure was varied between 1 MPa and 5 MPa and the Tg value was determined after 1 h of saturation. The corresponding DSC curves can be found in Figure 5. Glass transition temperature depending on CO2 pressure at constant isothermal saturation times.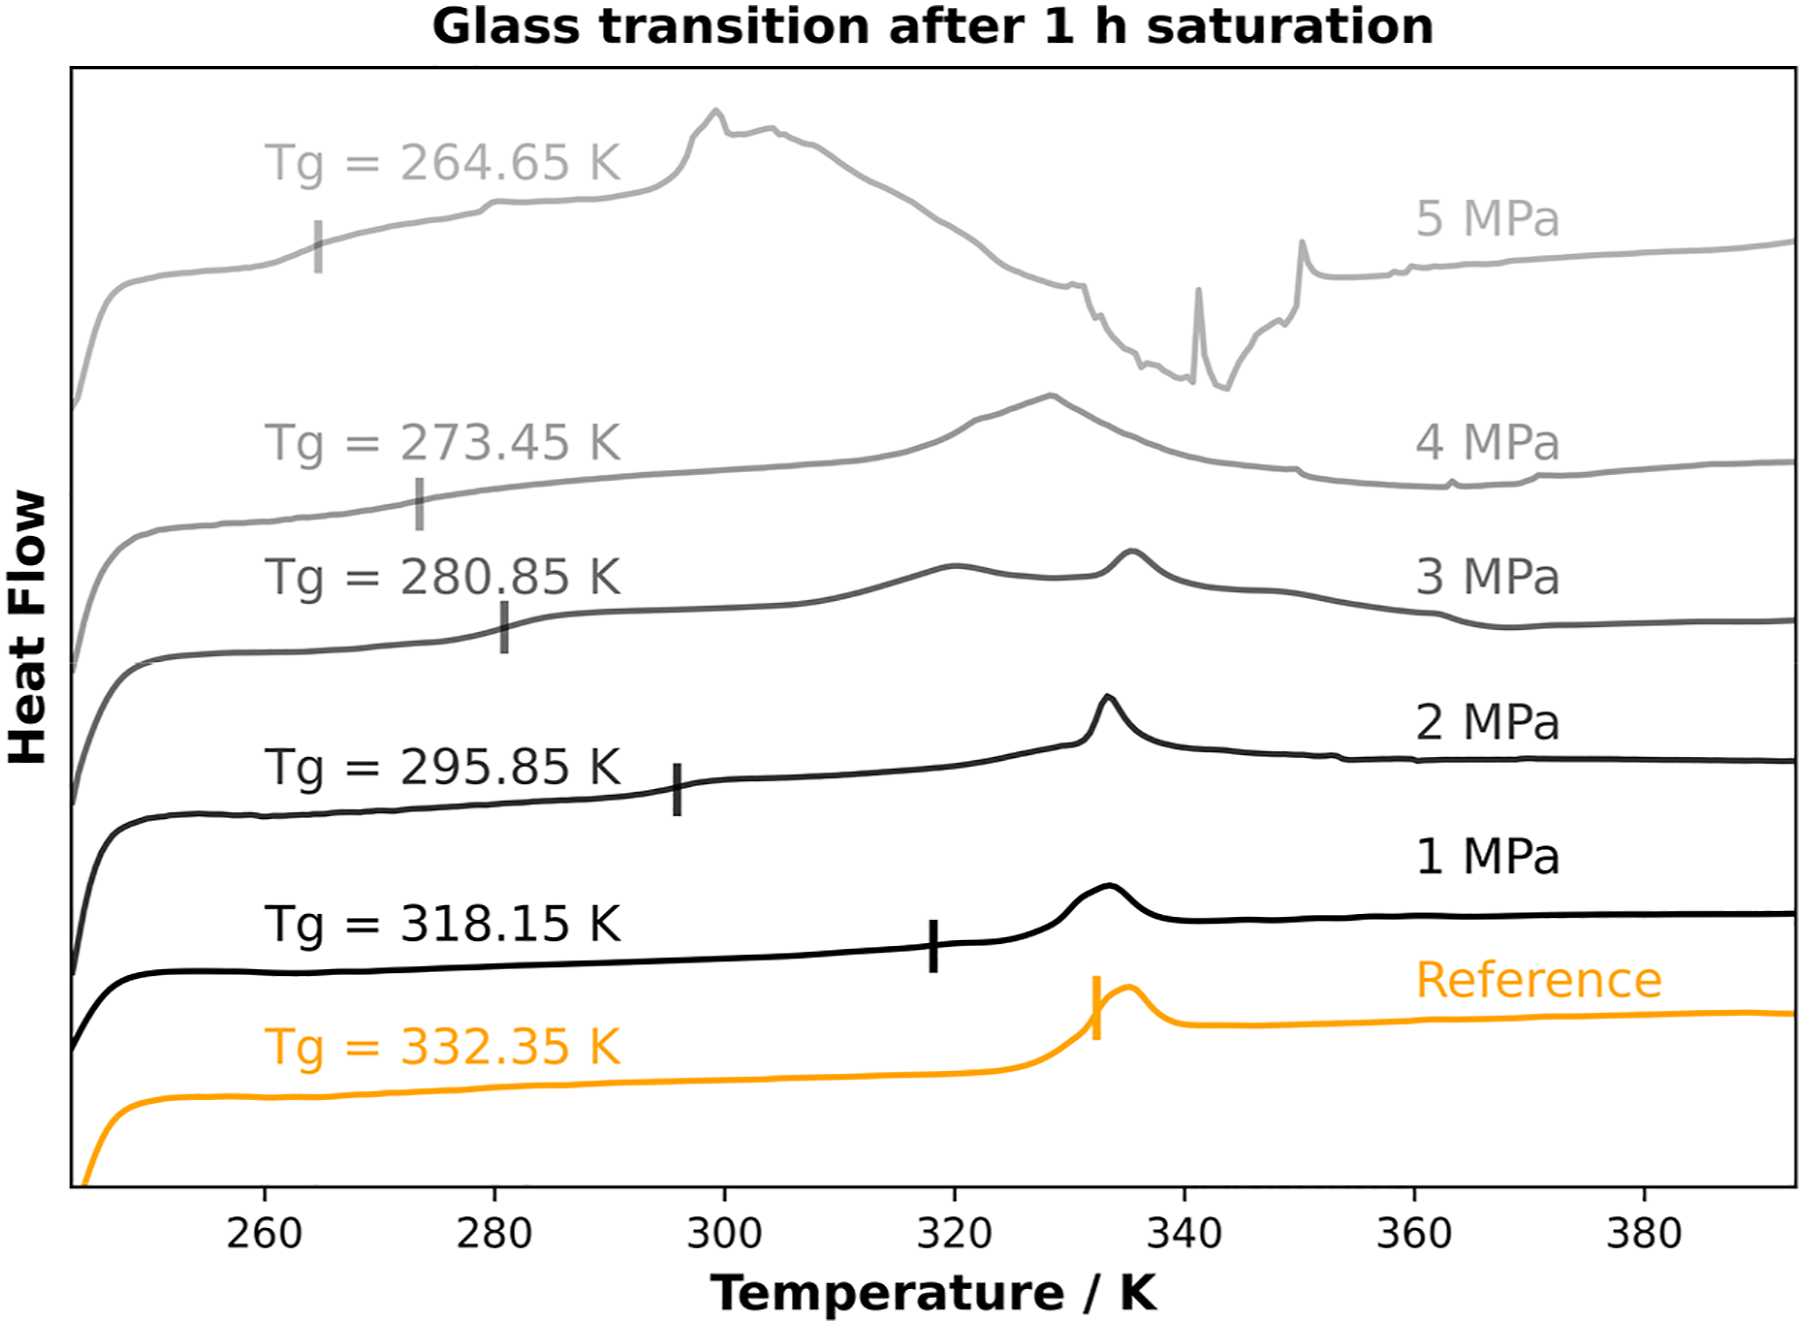
With increasing CO2 pressure at a constant saturation time of 1 h, the glass transition temperature decreases more and more. Starting from ambient conditions of about 332.35 K, it decreases by more than 14 K at a pressure of 1 MPa. By applying higher pressures, the glass transition temperature decreases to 280.35 K at a pressure of 3 MPa and 264.55 K at the highest selected pressure of 5 MPa. The continuous decrease in glass transition temperature can be explained by higher uptake of the blowing agent due to higher saturation pressure. The different external pressures lead to a variation of the diffusion rates and thus to a different amount of dissolved CO2 inside the polymer samples. The glass transition was plotted against the saturation pressure at a sorption time of 1 h (Figure 6). Glass transition temperature as a function of CO2 content at different saturation pressures after 1 h of saturation time.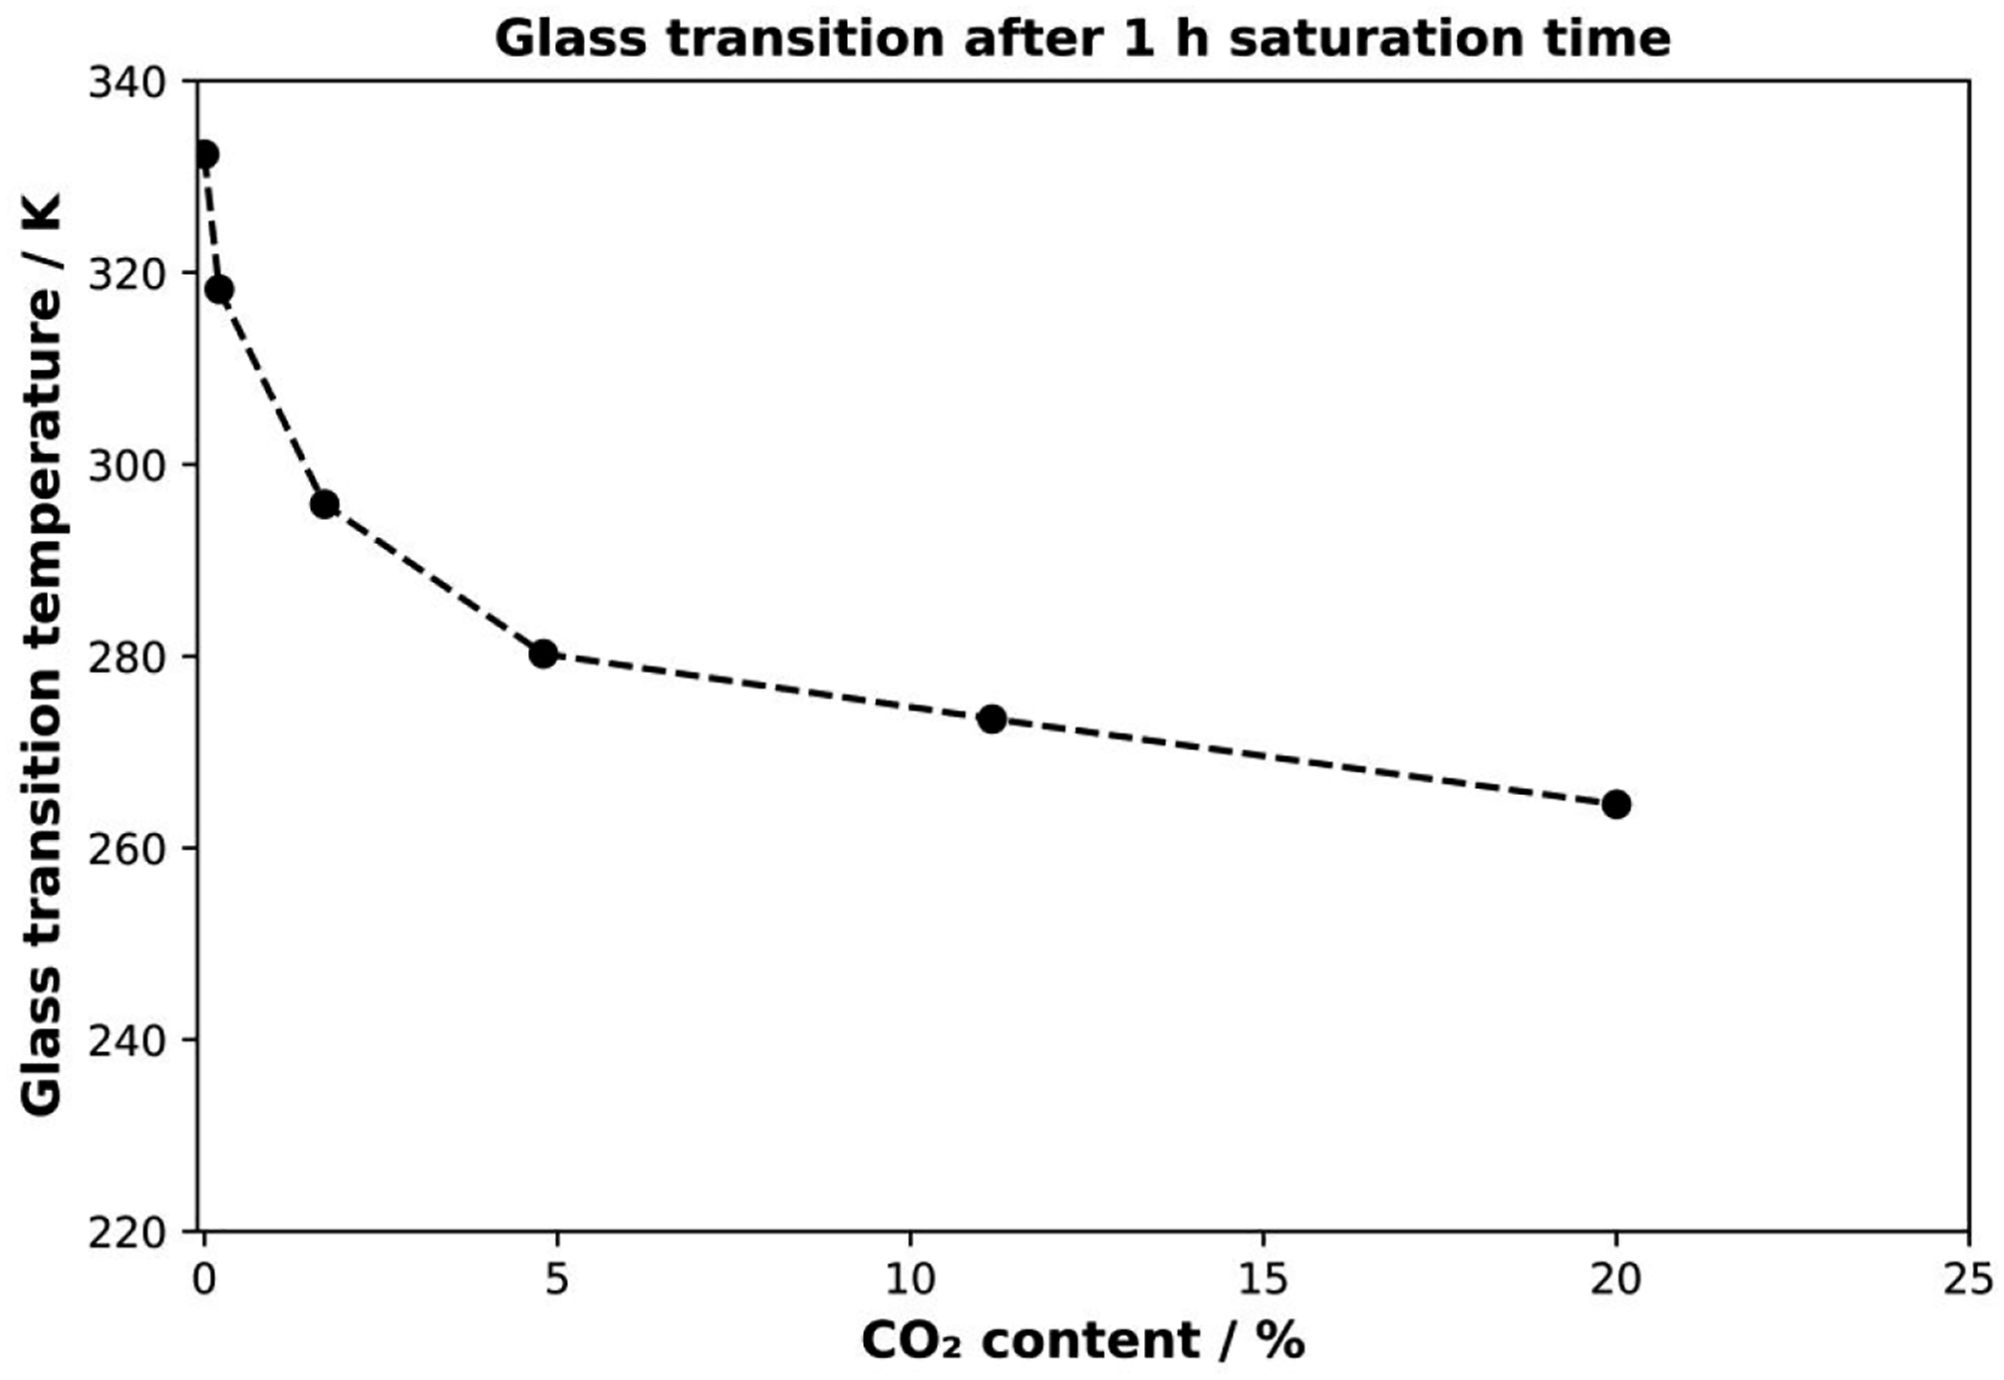
However, with respect to the sorption pressure, a linear dependence was found by Nofar. 17 The results presented here (Figure 6) do not fit a linear decrease. Moreover, the Tg decrease does not agree with the Chow model. This is due to the complex CO2 diffusion process. One reason is that the sample boundaries initially absorb the CO2, and the initial diffusion rate depends on the saturation pressure. Furthermore, this saturation causes a plasticization effect on these volume elements, which leads to a change in diffusion behavior as a function of CO2 concentration. It follows that for short saturation times, the outer regions of the samples absorb more CO2 than the core. This inhomogeneous distribution is measured in the DSC and leads to a comparably low glass transition temperature.
Influence of pressure and CO2 uptake on the glass transition temperature
In a fully saturated sample, the influence of inhomogeneous saturated volume elements can be compensated, and the pressure is directly related to the amount of blowing agent. Therefore, the samples were saturated in HPDSC for 16 h, which is the equilibrium condition for each pressure condition. The corresponding DSC curves and the correlation of glass transition and pressure are shown in Figure 7 and Figure 8. Glass transition depending on pressure in equilibrium. Glass transition temperature versus CO2 content for PLA in equilibrium.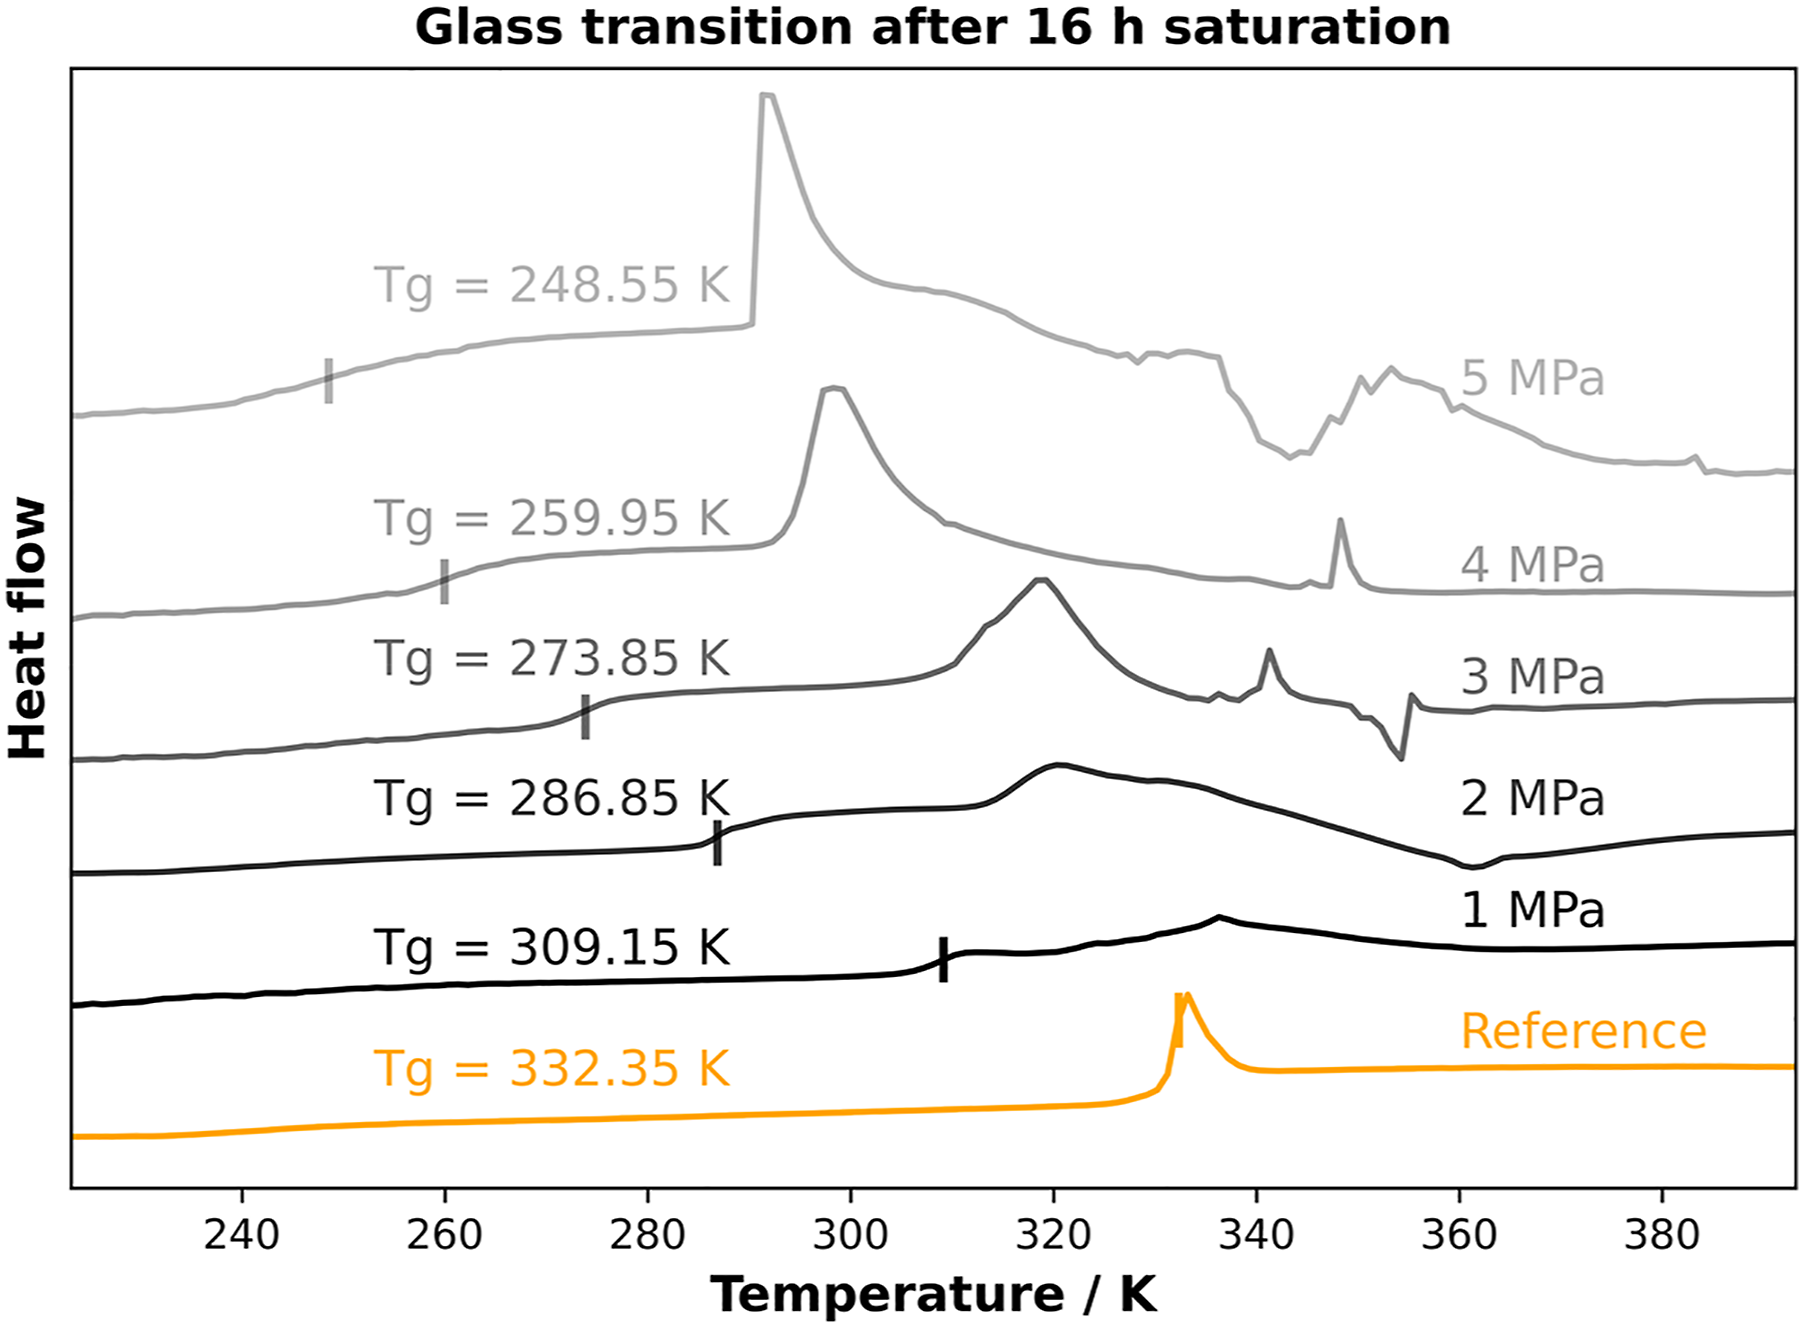
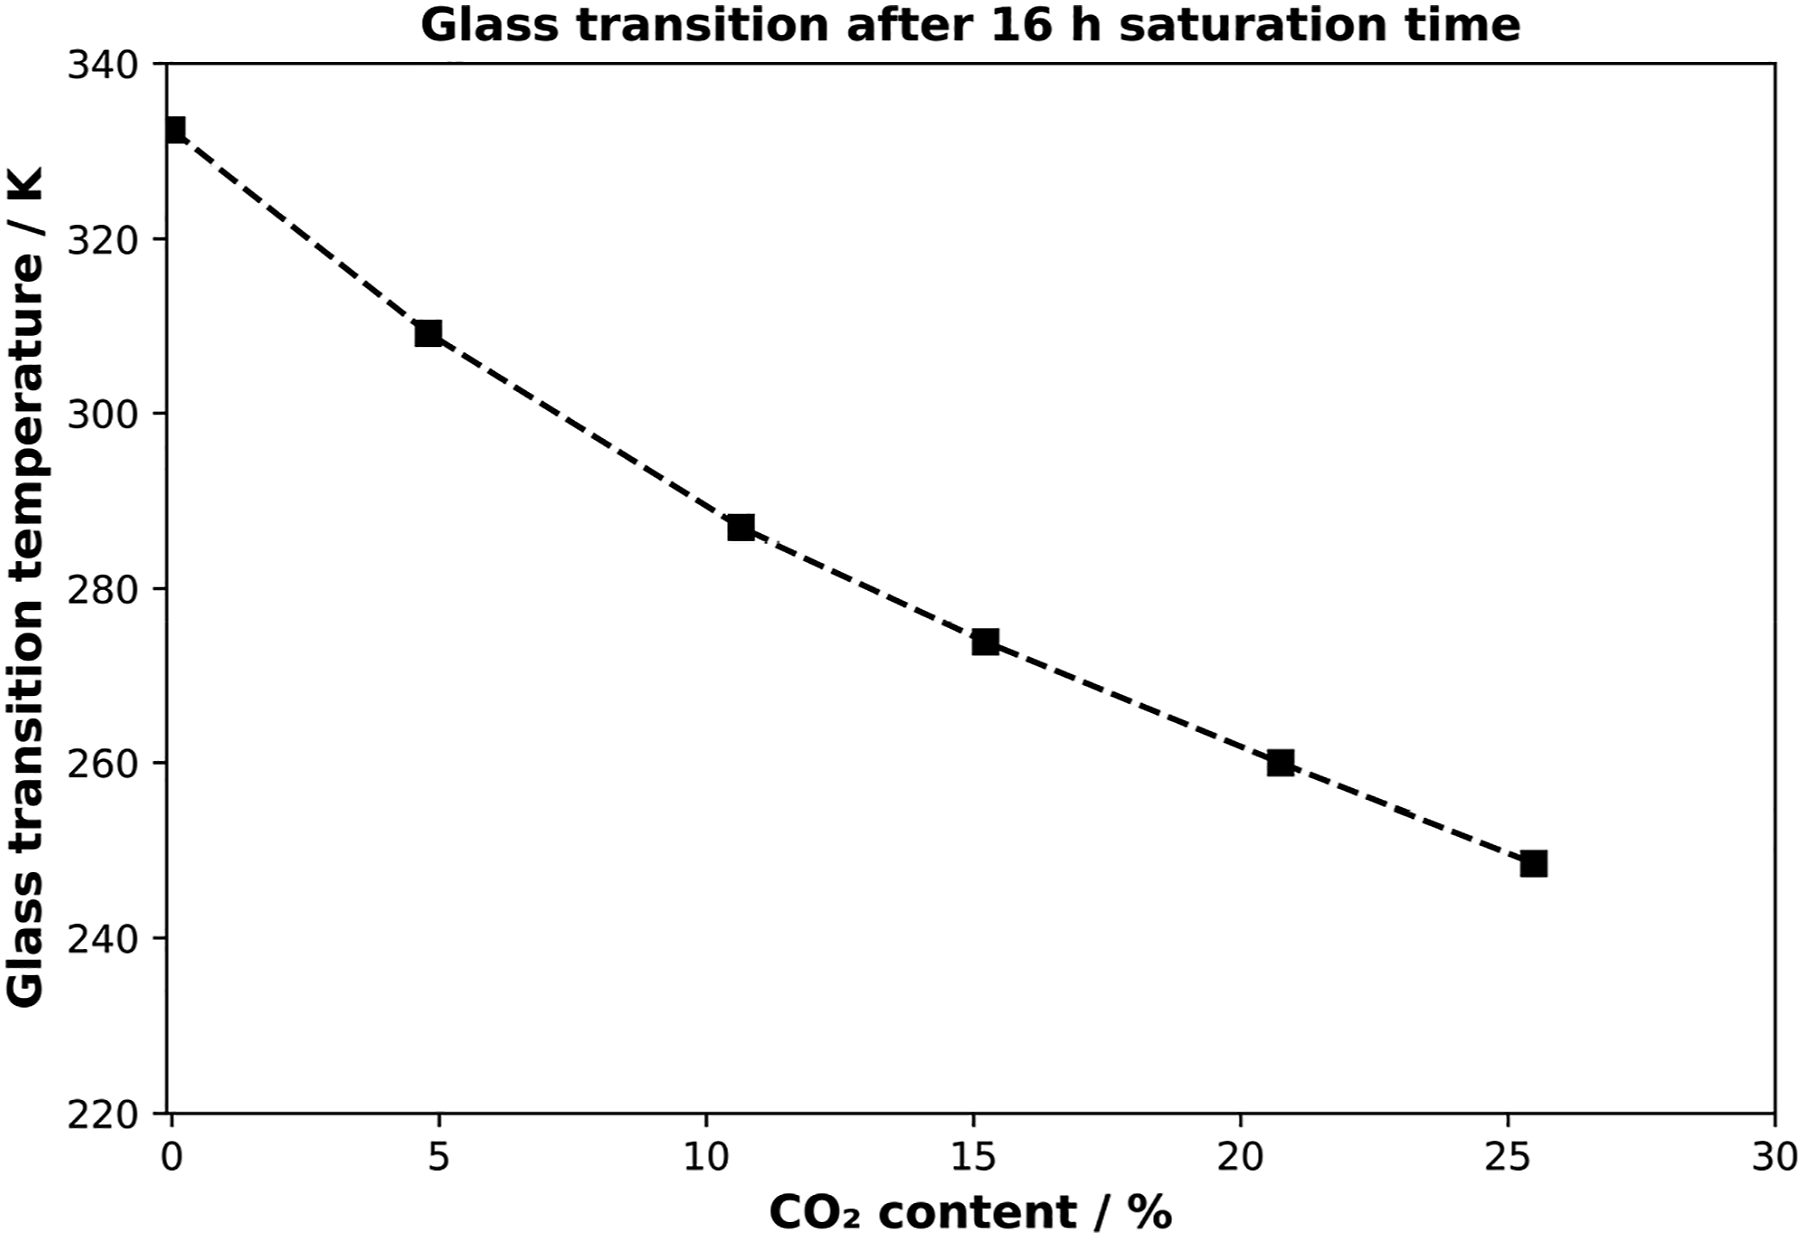
After applying discrete pressure values over 16 h, the CO2 uptake correlates linearly with the pressure levels which can be detected out of Figure 2. From Figure 7 a continuous decrease in glass transition can be seen. During the pressure levels from 0 MPa to 2 MPa, the decrease is about ∼ 22 K/1 MPa with 309.15 K at 1 MPa and ∼287.15 K at 2 MPa. However, at higher sorption levels (corresponding to pressure levels above 2 MPa) the decrease in glass transition is less pronounced. The softening point is decreasing about 13 K between 2 MPa and 3 MPa. As expected, the 4 MPa and 5 MPa show the lowest glass transition temperatures with 259.95 K and 248.55 K. The measured value at 5 MPa represents a decrease in Tg of about 84 K. This behavior can be traced back to the higher sorption values at higher pressures. The corresponding plot regarding the amount of CO2 and the glass transition is shown in Figure 8.
After 16 h of saturation time, the plasticizer CO2 is uniformly distributed throughout the volume. However, the results obtained do not fit a linear relationship as previously shown in the literature. The reason is the different measuring setup. Up to now the Tg was measured under CO2 load, which influences the Tg itself. In this case the no CO2 pressure was applied during the determination of the Tg. This difference leads to other information’s from the analyzes. In the following section, the measured glass transition temperatures in the HPDSC are compared with the amount of CO2 and the Chow model to evaluate the correlation between the sorption conditions and the glass transition.
Dependence of glass transition on CO2 absorption
To compare all the previous results, the glass transition is plotted against the CO2 content. The theoretical values for the Chow model with different coordination numbers (Z) are shown here. Next to the fit for the Chow model, the measured glass transition temperatures from the previous figures are plotted in correlation with the corresponding amount of dissolved CO2. All measured values, including the Chow model, are summarized in Figure 9. Correlation of measured glass transition values and the chow model for different Z values.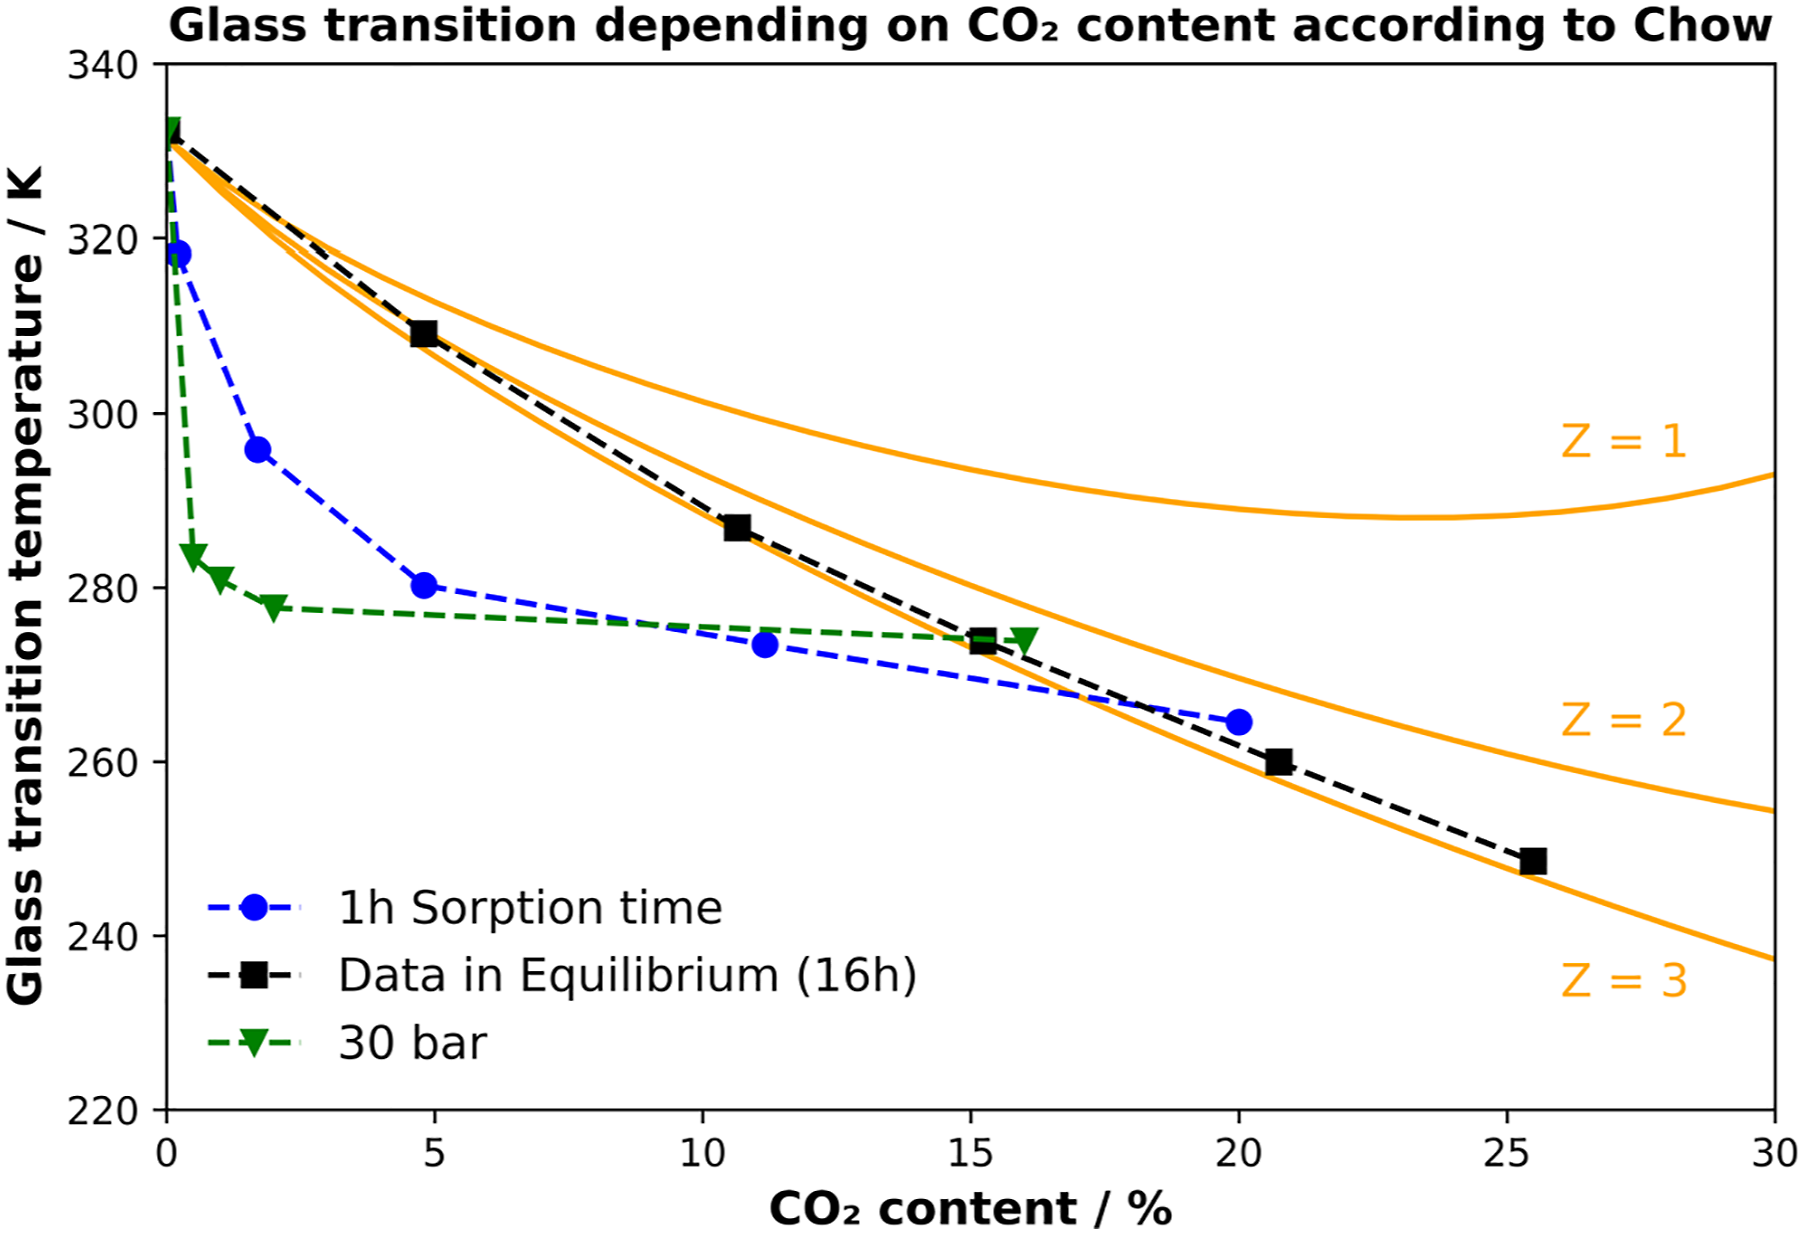
The solid lines correspond to the Chow model for the various coordination numbers Z. The squares represent the system at equilibrium after 16 h of sorption at various pressures. The downward pointing triangles correspond to the sorption data after 1 h of saturation time and the circles to the variation of saturation time at a constant pressure of 3 MPa.
In the literature, it is repeatedly shown that either 1 or 2 agrees well with the real data. Since neither a Z value of 1 nor 2 agrees with the measured values, the fit was performed for a value of Z = 3. Surprisingly, this value is a good fit to the measured data for the fully saturated PLA grade. For the amorphous PLA, the model is shown to fit well to a coordination number of 3, suggesting that three CO2 molecules surround a repeating PLA unit. With respect to the not fully saturated state, there is a huge decrease after relatively short saturation times. This indicates that the outer regions of the sample contain already a high amount of CO2, resulting in a low glass transition. In contrast, the core still contains a low amount of CO2. This explains the low measured CO2 content but the low glass transition temperatures after short saturation times. During the heating the material is foaming, why the core’s Tg cannot always be detected. However, in Figure 7 multiple Tg’s can be seen for 2 and 3 MPa of saturation pressure, respectively. This demonstrates that during saturation the CO2 concentration might be varying with depth of the sample.
At different pressure levels and a constant saturation time, no direct correlation can be seen. At low pressures, the measured glass transition at 1 MPa or 2 MPa already decreased by about 15 K and 36 K, respectively. Higher pressures from 3 MPa to 5 MPa show a weaker decrease of the glass transition. This behavior does not fit the linear findings in the literature, but rather the Chow model for a coordination number of 3. This means that the sorption state and thus the sorption conditions must be considered when measuring the glass transition. A simplified model for the sorption state and the measured glass transition is shown in Figure 10. This concept is intended to representatively illustrate the CO2 distribution through the volume of the measured sample. Visualization of saturation level over time for a circular sample geometry.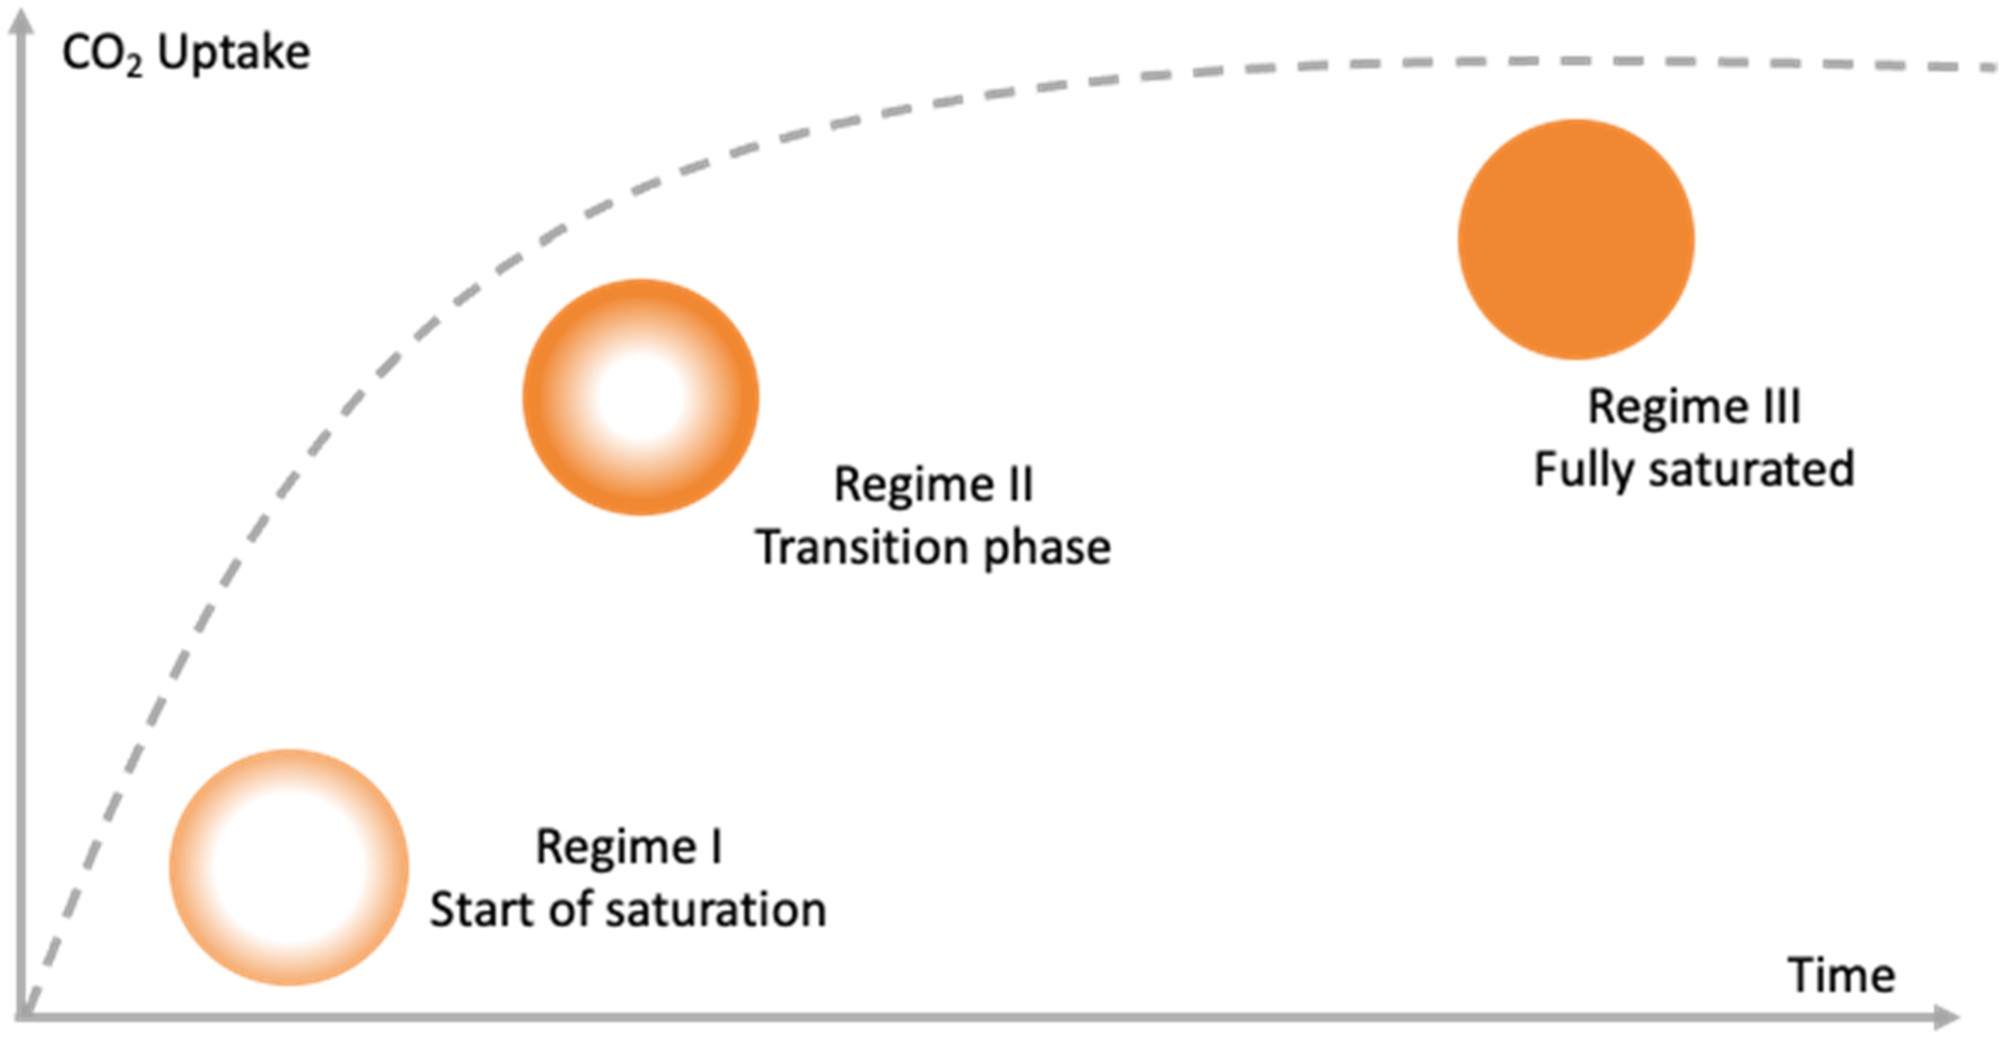
The visualization makes it easier to understand the saturation process through the polymer volume for a simplified circular sample. A distinction is made between 3 different states, which are referred to as regimes I- III. Regime I represents the beginning of the diffusion process. Initially, the outer regions of the sample become saturated, while the core region remains unchanged. With increasing time, the blowing agent diffuses more and more into the core region, while the outer regions still contain the highest relative amount of CO2. After sufficient time, the regime III is reached where the saturation is in equilibrium and the CO2 is homogeneously distributed in the polymer. Using this visualization, it is easier to explain the previous results. For short saturation times - regime I - the outer surface is highly saturated, while the inner region does not contain any blowing agent. Consequently, the amount of CO2, relative to the total volume, is small. However, when the glass transition temperature is measured, the gage does not consider the state of saturation. Assuming that the total volume can be divided into several layers with different proportions of CO2, each of these layers represents a different glass transition temperature due to the interaction of CO2 and the polymer. The measured glass transition then represents only a small volume region - the outer region - while the corresponding amount of CO2 is calculated as a function of the entire volume. This condition explains the measured values and in terms of sorption conditions. With respect to the prediction of the glass transition by a model, it is necessary to ensure complete saturation, which in our case is after 16 h. At high saturation times, the influence of diffusion is balanced and therefore the volume no longer needs to be considered as multiple layers. For saturation-dependent processes such as foaming, knowledge of the saturation state is crucial. Incomplete saturation would result in the outer regions being well foamed due to a high amount of blowing agent. However, the inner region, which may contain low or no CO2 content, could remain unfoamed. In summary, during the saturation process, it is important to consider the saturation pressure and temperature as well as the saturation time to ensure a state of equilibrium.
Conclusion
The sorption of PLA in CO2 atmosphere was studied by determining the weight uptake over time for different pressures. These conditions were applied to HPDSC measurements to correlate the effect of CO2 content on the glass transition temperature.
It was found that higher saturation times do not necessarily lead to lower measured glass transition temperatures, as the sorption profiles are inhomogeneous at relatively low saturation times. The increase in sorption pressure at long saturation times (equilibrium) resulted in lower glass transition temperatures. For the first time, the Chow model was verified by correlating the CO2 content with the measured glass transition temperatures. The Chow model was found to be valid for a coordination number of 3. Thus, it was shown that PLA with a content of 25% CO2 has a glass transition temperature reduced by 80 K.
Footnotes
Acknowledgements
The authors would like to acknowledge Bavarian Polymer Institute (BPI) for providing access to different analysis methods. Furthermore, we would like to thank Dini Ittiachen for her help in carrying out the experiments.
Author Contributions
Christian Brütting: conceptualization, writing – review and editing sections “1. Introduction”, “2. Materials and Methods”, “3 Results and Discussion”, abstract and conclusions, review, editing and preparation of original draft. Julia Dreier: reviewing. Prof. Dr.-Ing. Christian Bonten and Prof. Dr.-Ing. Volker Altstädt: supervision, reviewing and funding acquisition. Prof. Dr.-Ing. Holger Ruckdäschel: supervision and reviewing.
Declaration of conflicting interests
The author(s) declared no potential conflicts of interest with respect to the research, authorship, and/or publication of this article.
Funding
The author(s) disclosed receipt of the following financial support for the research, authorship, and/or publication of this article: This research was funded by German Research Foundation (DFG), grant number AL474/34-1. Open access charges were funded by the German Research Foundation (DFG) and the University of Bayreuth in the funding program Open Access Publishing.