
Abstract
This study attempted to show regional disparities in the level of deprivation among the Scheduled Tribe population in eastern Indian states (Bihar, Jharkhand, Odisha and West Bengal). This work is based on house listing and housing table of Census of India, 2011 and Socio-Economic Cast Census data. The Wroclaw Taxonomic method was employed for measuring the deprivation index. The results show that, out of 110 districts, 55 districts are in a middle-deprived stage and 13 districts are in a highly deprived stage. Among the states, the level of deprivation is very high in Odisha, followed by West Bengal. The situation is quite better in Jharkhand. The study also shows that the districts with little better condition are either situated in agricultural plain, mining centres, power plants or tourism centres. The study also reveals that the areas with the better conditions are either in agricultural plains, mining centres, power plants or tourism centres. As a result, the research recommends enhancing previously existing tribal development programmes as well as regional general development programmes in order to reduce concerns such as tribal, rural and regional deprivation.
Introduction
Deprivation may be defined as a condition of observable and verifiable disadvantage relative to the local community or the wider society or nation to which an individual, family or group belongs (Townsend, 1987). Deprivation occurs when there is an absence of something that is considered customary, desirable or approved in a society. It prevents people from attaining a decent standard of living. According to Townsend (1987), deprivation may be objective, covering scientific observation, measurement and also incorporating a wide variety of domains irrespective of a person’s consciousness. On the other hand, it can also be subjective depending on social perception. Social perception can be individually perceived or perceived by a group of individuals or a community. However, deprivation might be material or social. Material deprivation entails the circumstance where there is an absence of products or objects that are regarded as ‘necessities’. In contrast, social deprivation comprises not having access to regular social norms, activities and relationships (Chan et al., 2006; Fusco et al., 2011; Stafford et al., 2003; Townsend, 1987). Hence, deprivation signifies the absence of anything which is regarded as desirable, such as money and good health (Madge and Brwon, 1982). In a developing country like India, it may include the absence of proper diet, housing, clothing, education, social justice, health infrastructure and employment opportunities. However, deprivation is different from poverty as the latter is always associated with financial condition, but deprivation is not necessarily financial in nature. Deprivation can also be measured in various dimensions, including health, education, economic position, housing, social status, well-being and development parameters. In a country like India, deprivation is mostly material as a generous portion of the population lacks the basic conveniences of contemporary living. If evaluated across multiple social groups, the most underprivileged groups are the Other Backward Classes (OBCs), Scheduled Castes (SCs) and Scheduled Tribes (STs). Among the three, deprivation is much higher among the STs. In India, there are 705 STs, accounting for 8.6% of the total population. Despite the adoption of various tribal development schemes, tribal communities endure deprivation in all aspects of developmental indicators, including housing, education, health and well-being. It expanded the chasm between tribal and non-tribal people of society, thus exacerbating social and economic exclusion of the tribal people. The disparity, however, continues regionally among the STs. The present study has shown a pattern of regional variations in the level of deprivation among the Scheduled Tribe communities in eastern India, spanning four states: Bihar, Jharkhand, Odisha and West Bengal, which account for about a quarter of the country’s ST population.
Measuring deprivation of any region
Several studies have been carried out to quantify the deprivation across the world using various domains, such as health and welfare, education, housing and development (Bell et al., 2007; Durán and Condorí, 2019; Fu et al., 2015; Havard et al., 2008; Salmond et al., 1998; Ward et al., 2019). Carstairs and Morris (1989) produced an index for Scotland’s postcode sectors that included four factors obtained from the 1981 UK Census (proportions of male unemployment, lack of automobile ownership, low social class and household overcrowding). Townsend (1987) devised an index known as the ‘Townsend Material Deprivation Score’ or ‘Townsend Index’. He used four indicators of deprivation: unemployment, household overcrowding, non-house ownership and non-car ownership, derived from the Census and highlighted the disparities in the UK during the 1970s and 1980s. Julkunen (2002) undertook a comparative examination of deprivation status among the unemployed young people of Denmark, Finland, Iceland, Norway, Sweden and Scotland. Martínez and Ruiz-Huerta (2000) created a deprivation index using indicators of standard of living. Yuan and Wu (2014) measured multidimensional deprivation in Guangzhou city, Southern China, based on income, employment, education, health and housing deprivation domains. Exeter et al. (2017) worked on the multiple deprivations of New Zealand by using 28 indicators from national health, social development, taxation, education, police databases, geospatial data providers and the 2013 Census, which represent seven domains of deprivation, including employment, income, crime, housing, health, education and geographical access.
Deprivation studies in India
In India, regional disparities are very high due to asymmetry in development processes across the states, districts and villages, as well as across the various social groups. Hence, numerous studies have been conducted to illustrate the regional disparity in deprivation. Amartya Sen (1981, 1987, 1992, 1997) made major contributions in the various dimensions of deprivations in the Indian context, and emphasized that deprivation is the fundamental impediment to economic progress through a series of his writings. Bhatty (1998) studies deprivation in primary education, notably among children who, owing to poverty, prefer to enter the work market, despite the fact that there are different government initiatives in this area. Using functions of social satisfaction, Chakravarty and Mukherjee (1999) constructed numerous measures of relative and absolute deprivation. Pathy (2003) illustrated the appalling condition of the tribes in the Kashipur block of Orissa. Based on data from the National Family Health Survey (NFHS), Srinivasan and Mohanty (2004) calculated the deprivation of basic amenities in India, dividing the population by caste and religion. Sarkar et al. (2006) calculated the human development index (HDI), human poverty index (HPI), gender development index (GDI) and gender empowerment measure (GEM) for the ST community in India, with a special focus on Odisha, to compare STs with all-India averages, as well as in the global scenario. Based on the Census of India and NSSO produced data. Gaiha et al. (2007) explored the inequalities in deprivation between rural and urban India. Bhattacharjee and Wang (2011) measured weighted deprivation indices at Household level of the North Eastern States of India based on safe drinking water, sanitary facility and electricity supply. Kumar (2015) highlighted the difference among rural households in terms of possessing basic facilities. Mishra (2018) evaluated the deprivation in Kolkata by employing eight variables that are related to the environmental, household and economic situations. Basu and Das (2020) revealed the geographical pattern of deprivation in rural India using an index of multidimensional deprivation (IMD) at the district level based on the Census of India, Socio-Economic Caste Census (SECC) and National Family Health Survey (NFHS) data. None of these studies focused on the regional disparities in deprivation among ST households. Hence, the present study addresses the geographical pattern of disparity of deprivation among the STs of India. The study focuses on the rural areas because these belong to the dwelling of nearly 92% of the tribal people.
Study area
Eastern India comprises four states, namely, Bihar, Jharkhand, Odisha and West Bengal (Figure 1). The geographical extension of this region is 17.80 dd N to 27.52 dd N and 81.38 dd E to 89.88 dd E. Eastern India has diversified physiographic units. The Himalaya is found in the northern-most part of West Bengal; the Chotanagpur plateau region, which is also known as the mineral belt of India, lies almost in entire parts of Jharkhand, the northern-western part of Odisha, the south-western part of West Bengal and the southern part of Bihar. Heavy engineering, machine tools, fertilizers, cement, paper, locomotives and heavy electrical are some of the significant industries in this region. Important hubs are Ranchi, Dhanbad, Chaibasa, Sindri, Hazaribag, Jamshedpur, Bokaro, Rourkela, Durgapur, Asansol and Dalmianagar. In eastern India, the areal coverage of the Chotanagpur plateau region is significantly higher than the other physiographic units. This region is drained by the Damodar, Ajay and Subarnarekha rivers. The Eastern Ghats is found in the south to south-western part of Odisha. The Mahanadi, Baitarani, Brahmani, Rushikulya and so on rivers drain this region. The coastal plain is located in the north-eastern and eastern parts of Odisha and the southern part of West Bengal. The Gangetic plain region stretches from the north-western to north-eastern parts of eastern India. Most of the physiographic region of Bihar is covered by the middle Ganga plain. The Ganga, Ghaghara, Gandak and Kosi rivers flow through this plain. This region is prone to recurring mega-flood occurrences, as well as frequent channel migration. Except for the Himalaya in north and the Chotanagpur plateau region in south-western corner, almost entire region of west Bengal is covered by the lower Gangetic plain. This region is drained by the Ganga, Teesta, Torsha, Jaldhaka, Mahananda and so on. Around 13.96% of the total forest cover of India is situated in eastern India. Forest covers approximately 33.15% of the total geographical area in Odisha, followed by Jharkhand (29.62%), West Bengal (19.04%) and Bihar (7.72%) (India State of Forest Report, 2019).
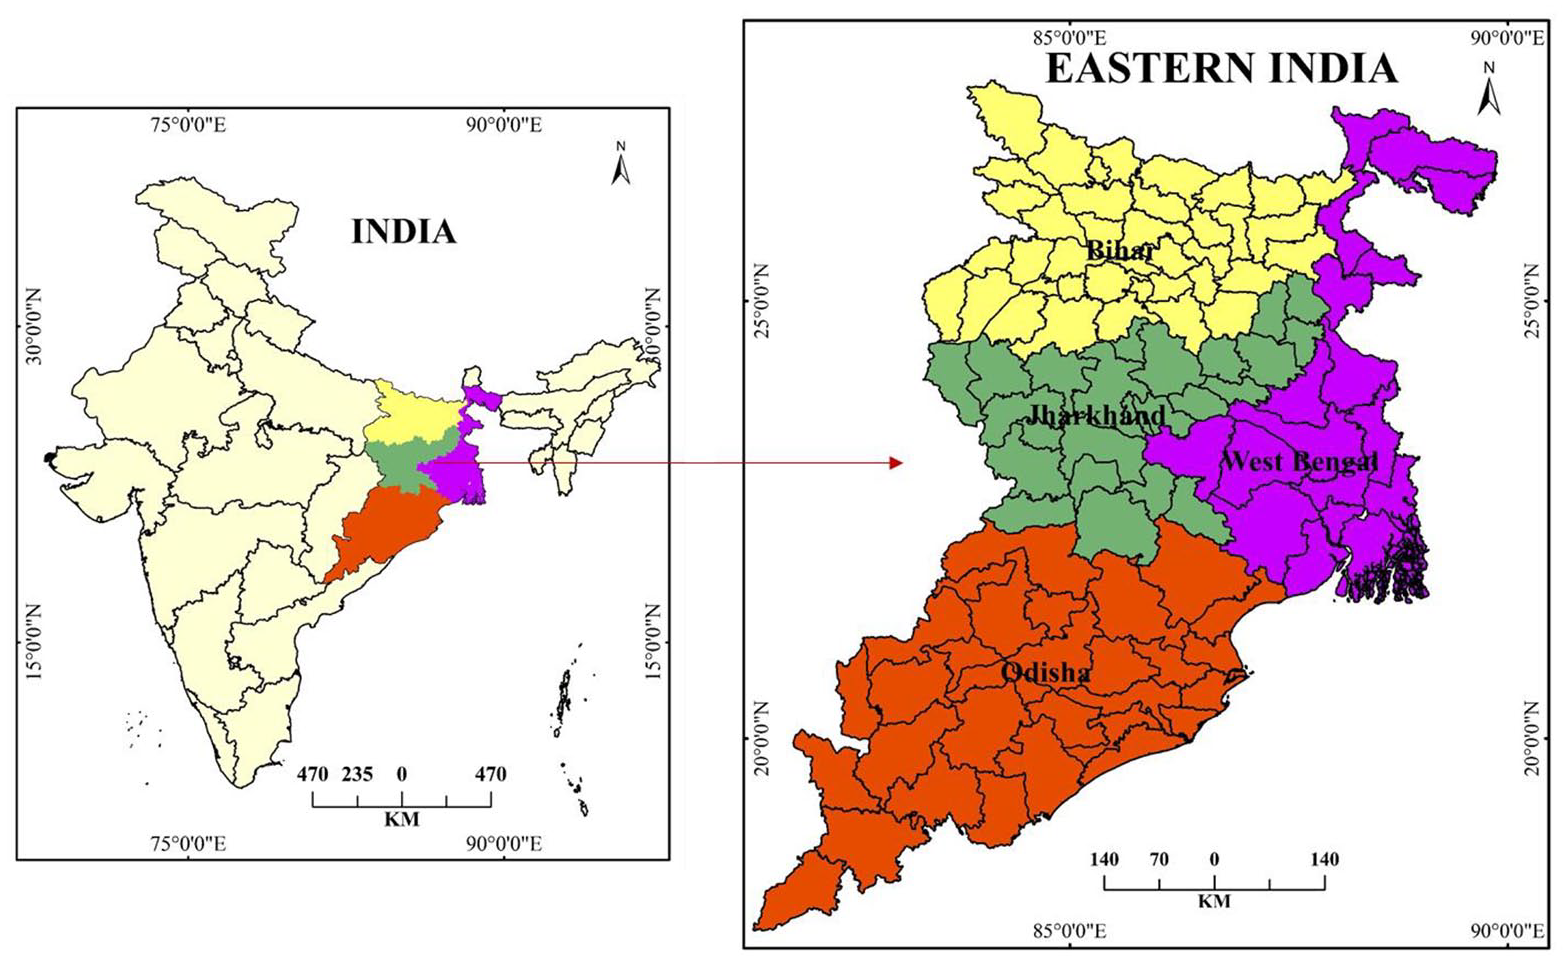
Location map of study area.
The eastern Indian states are recognized among the major states of India in terms of their size and population. This region accounts for 22.33% of India’s total population. According to the Census of India (2011), Bihar and West Bengal share the 3rd and 4th largest populations among the states and UTs of India. However, Odisha and Jharkhand rank 11th and 13th, respectively. Among the states of India, Bihar and West Bengal secure 1st and 2nd place, respectively, in the density of population, which is around three times to the national average. Around 79.36% people of eastern India live in rural areas. The highest concentration of the rural population is found in Bihar (88.71%), followed by Jharkhand (83.31%), Odisha (75.95%) and West Bengal (68.13%). As of the 2018–2019 financial year, West Bengal contributes 5.7% of India’s GDP. It ranks 6th among the states in terms of GDP share. Bihar, Odisha and Jharkhand each contribute 2.81%, 2.58% and 1.57% of the national GDP, respectively.
The higher degree of occupation dependence of the people of these states is found in the agricultural sector. Among the major states of India, the per capita income level is significantly lower in the eastern Indian states. In 2018–2019, Bihar registered the lowest per capita income (Rs. 40,982/annum) among all the states of India. Jharkhand, Odisha and West Bengal rank at 27, 20 and 19 respectively. A substantial number of districts are considered economically backward and less developed in human development. The NITI Ayog, Government of India enlisted the 124 most backward districts of India, of which 45 belong to East Indian states. Of those, 19 were from Jharkhand, 13 from Bihar, 10 from Odisha and 3 from West Bengal. The NITI Ayog also designated 20 extremely backward districts in India. Of those, 6 districts belong to the eastern Indian state (Purnia, Araria, Banka and Katihar districts from Bihar; and Sahibganj, Pakur districts from Jharkhand). Out of the entire ST population in India, 23.79% live in eastern India. Odisha has the greatest number of ST population (9,590,756) among the 4 East Indian states, followed by Jharkhand (8,645,042). In terms of the percentage share of STs in the overall population, Jharkhand registers the highest (26.21%) followed by Odisha (22.85%) and West Bengal (5.80%). Only 1.28% of Bihar’s population is classed as ST.
Database
The present study is based on the secondary data gathered from House listing and Housing Census Data, 2011. Apart from that, the Socio-Economic and Caste Census (2011), has also been used to quantify the extent of deprivation. The information on housing quality, housing amenities and household assets has been derived from House listing and Housing Census Data, 2011. Data from the 2011 Socio-Economic and Caste Census were used to compute income slabs, salaried jobs and house types.
In the present study, a district-level analysis of household deprivation among rural tribes in eastern Indian states has been done. A total of 110 districts have been chosen for the investigation. To quantify household deprivation, a composite index of housing quality, housing amenities and economy and assets has been constructed based on the Wroclaw Taxonomic Method. In this study, 18 variables were chosen from 4 domains of household deprivation. The first domain is the quality of housing, which comprises the house’s physical condition, building materials, the number of rooms for married couples and ownership of the house. The analysis of housing conditions is useful in identifying residences that are poorly constructed and heavily congested. It also shows the percentage of people who do not own a house. The second domain, deprivation in terms of supplying basic housing facilities, includes indicators such as drinking water from nearby sources, safe drinking water, electricity, a latrine and a bathroom, among others. The wealth status of a household can be determined by information on tangible assets such as land, animals, agricultural capitals and transportation equipment. Education, the last domain, is particularly successful in determining the reason of deprivation. Deprivation has an inverse relationship with education. The variables were chosen based on previous research in the field of deprivation, which successfully demonstrated regional disparities
Domain 1. Quality of Housing
Households (HHs) having dilapidated house.
HHs having Kuchcha houses.
HHs not having exclusive rooms for married couples.
HHs not having own house.
Domain 2. Housing amenities
HHs collect drinking water away from the premises.
HHs collect drinking water from untreated sources.
HHs not having electricity/solar.
HHs use non-clean fuel.
HHs not having a separate kitchen.
HHs not having a latrine facility.
HHs not having bathroom facility.
HHs having an open drainage system for wastewater outlet.
Domain 3. household economy and asset
HHs do not avail of any banking facilities.
HHs do not have any assets.
HHs having no salaried jobs.
HHs with less than Rs. 5000 monthly income.
Domain 4. Education
Illiteracy.
Female Illiteracy.
Methodology
Various statistical methods have been adopted by the researchers for quantifying the level of deprivation at the regional or national level such as principal component analysis, multiple factor analysis, aggregation method, ratio index, ranking technique and so on. But all these methods have some drawbacks, for example assumptions made on variables; data redundancy; allocating weight for combination index and so on (Kumar and Rani, 2019, 2020). Keeping all these restrictions in mind, the Wroclaw Taxonomic Method has been utilized for the present investigation. Because under this method, all of the selected factors have equal weight for assessing the level of development. Besides, it includes the dispersion among indicators (Gostowski, 1970). This method is created by Florek et al. (1952). Since then, it has been employed widely by the academics and planners for identifying the degree of development and also for developmental planning at the regional or national level (Arief, 1982; Narain et al., 2003, 2005, 2009, 2012; Kumar and Rani, 2019, 2020; Ohlan, 2013; Deb and Mukherjee, 2022).
Measuring the level of deprivation
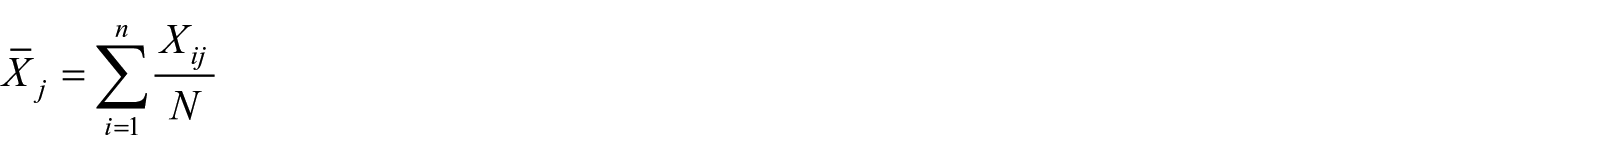
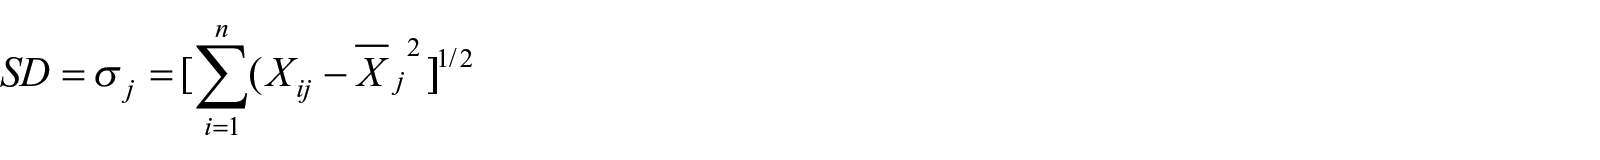
According to the Wroclaw Taxonomic method, let [Xij] be the data matrix, i = 1, 2,.. . . n (number of districts) and j = 1, 2, . . . k (number of indicators). Each district is represented by a vector in k-dimensional space. Since the units of measurements of the chosen variables are not uniform, they need to be standardized. For combined analysis, [Xij] is transformed to the matrix of standardized indicators [Zij] as follows
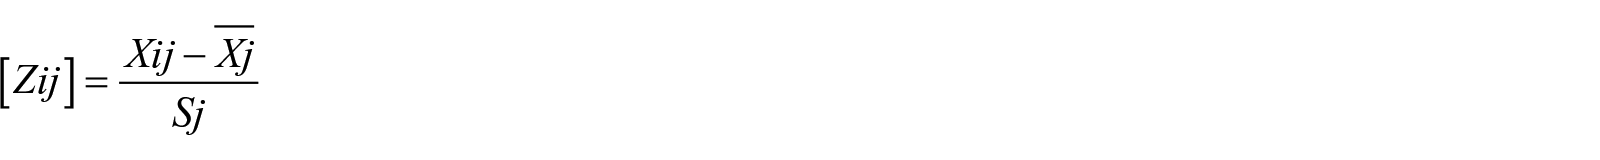
where j is the mean of the jth indicator and Sj is the standard deviation of the jth indicator
From [Zij], the optimum value for each indicator (denoted as

where
For each i and j pattern of deprivation is obtained by
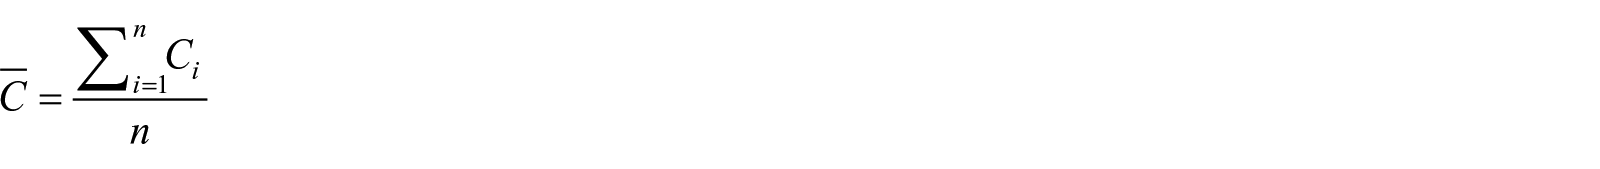
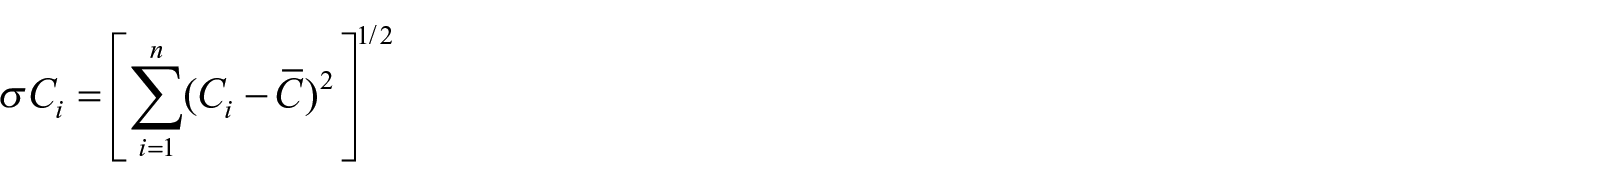
where
where C is the mean value of
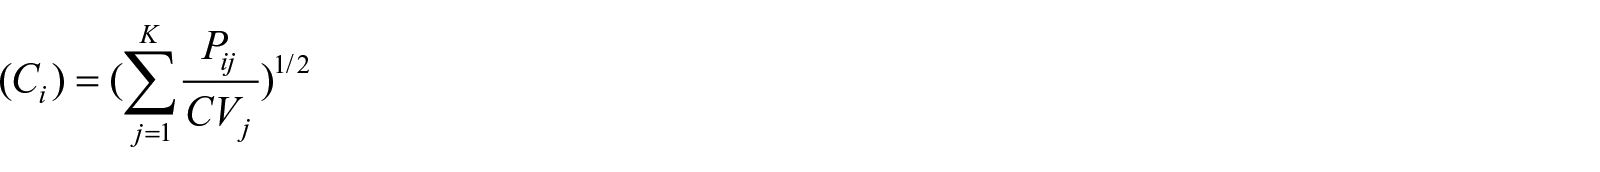
Composite index (

where
where 0 <
The district having a value of
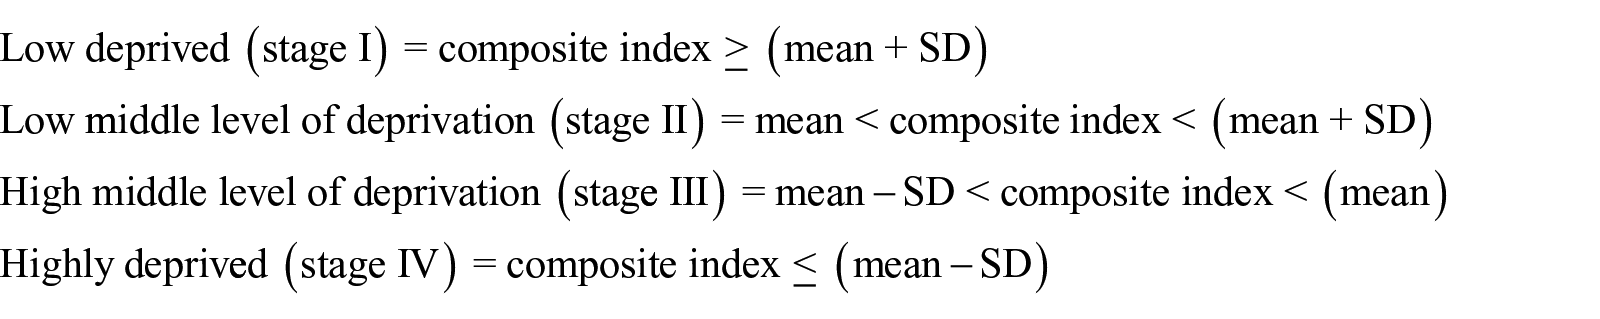
In this study, the Tribal Household Deprivation Index (THDI) has been calculated considering 4 domains: quality of housing, housing amenities, household economy and asset, and education. The different stages of deprivation at the district level are defined by implying a simple ranking procedure on the basis of the composite index. The district-wise classification has been constructed using the mean and SD of the composite index as follows
Result and discussion
The majority of tribal people in India still live in rural areas. Eastern India has a higher concentration of tribal people, accounting for 24.43% of India’s total rural tribal population. The largest concentration of rural STs is found in Odisha (9.56%), followed by Jharkhand (8.36%) and West Bengal (5.16%). A total of 22,989,083 tribal families were registered in eastern India in the 2011 census. The major tribal communities of these states are: Khonds, Gond, Santal, Kolha, Munda from Odisha; Santhal/Santal, Oraon, Munda, Ho, Kharia from Jharkhand; Santal, Oraon, Munda, Bhumij and Kora from West Bengal; and Santal, Oraon, Kharwar, Gonds, Munda from Bihar.
Tribal household deprivation and its spatial variation in eastern India
A total of 18 indicators have been taken to quantify tribal deprivation at the district level. In the following, spatial variation of deprivation indicators at district level for each concerned state has been discussed separately.
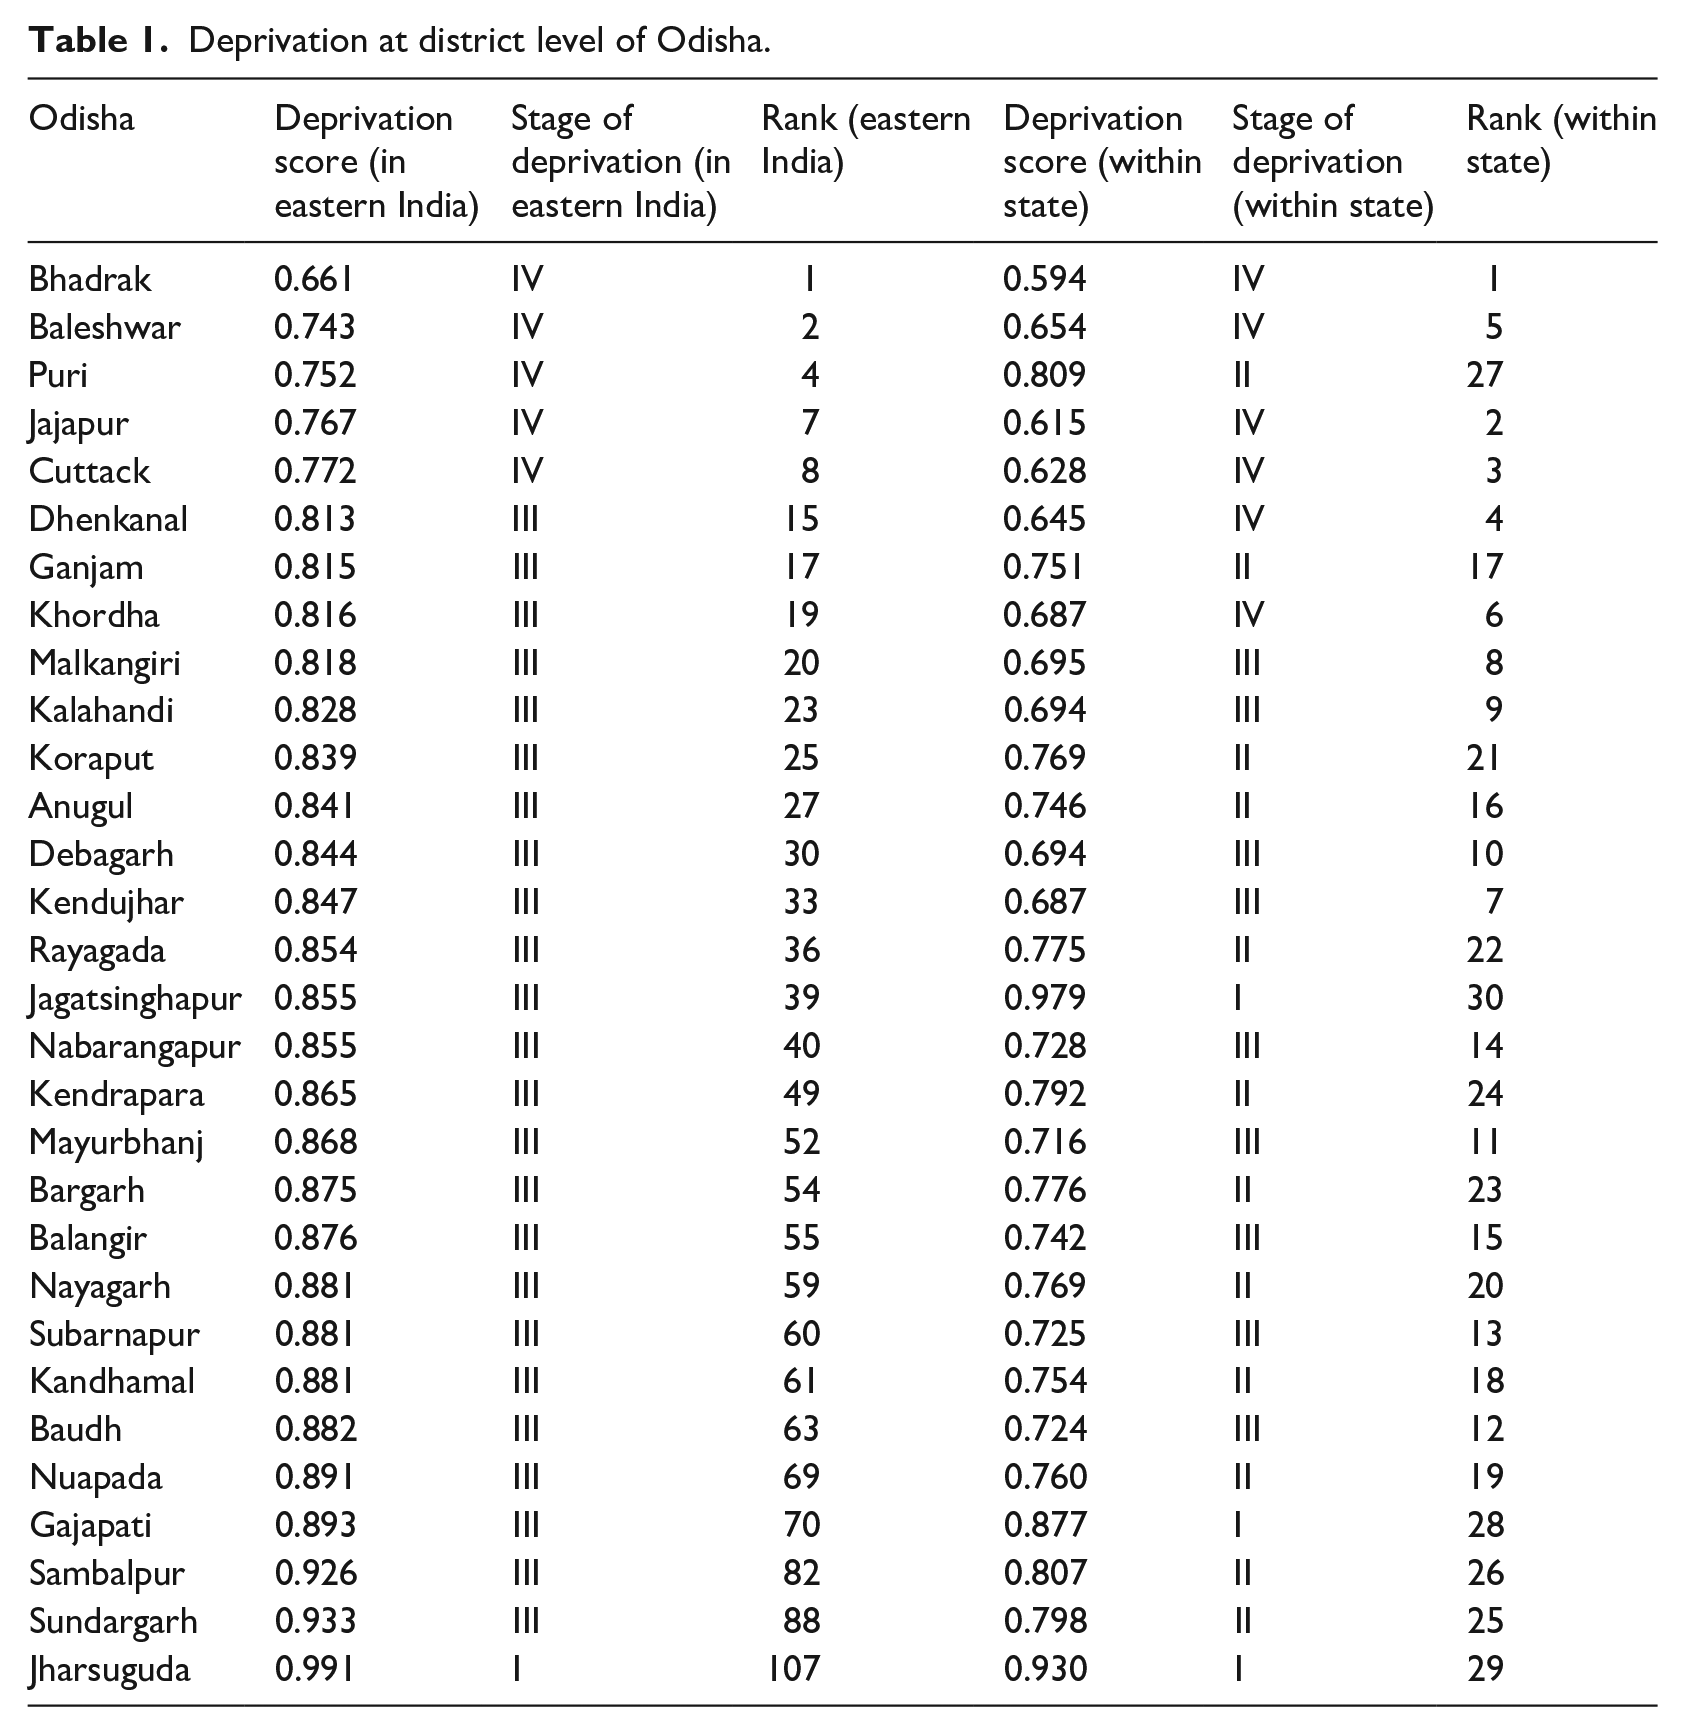
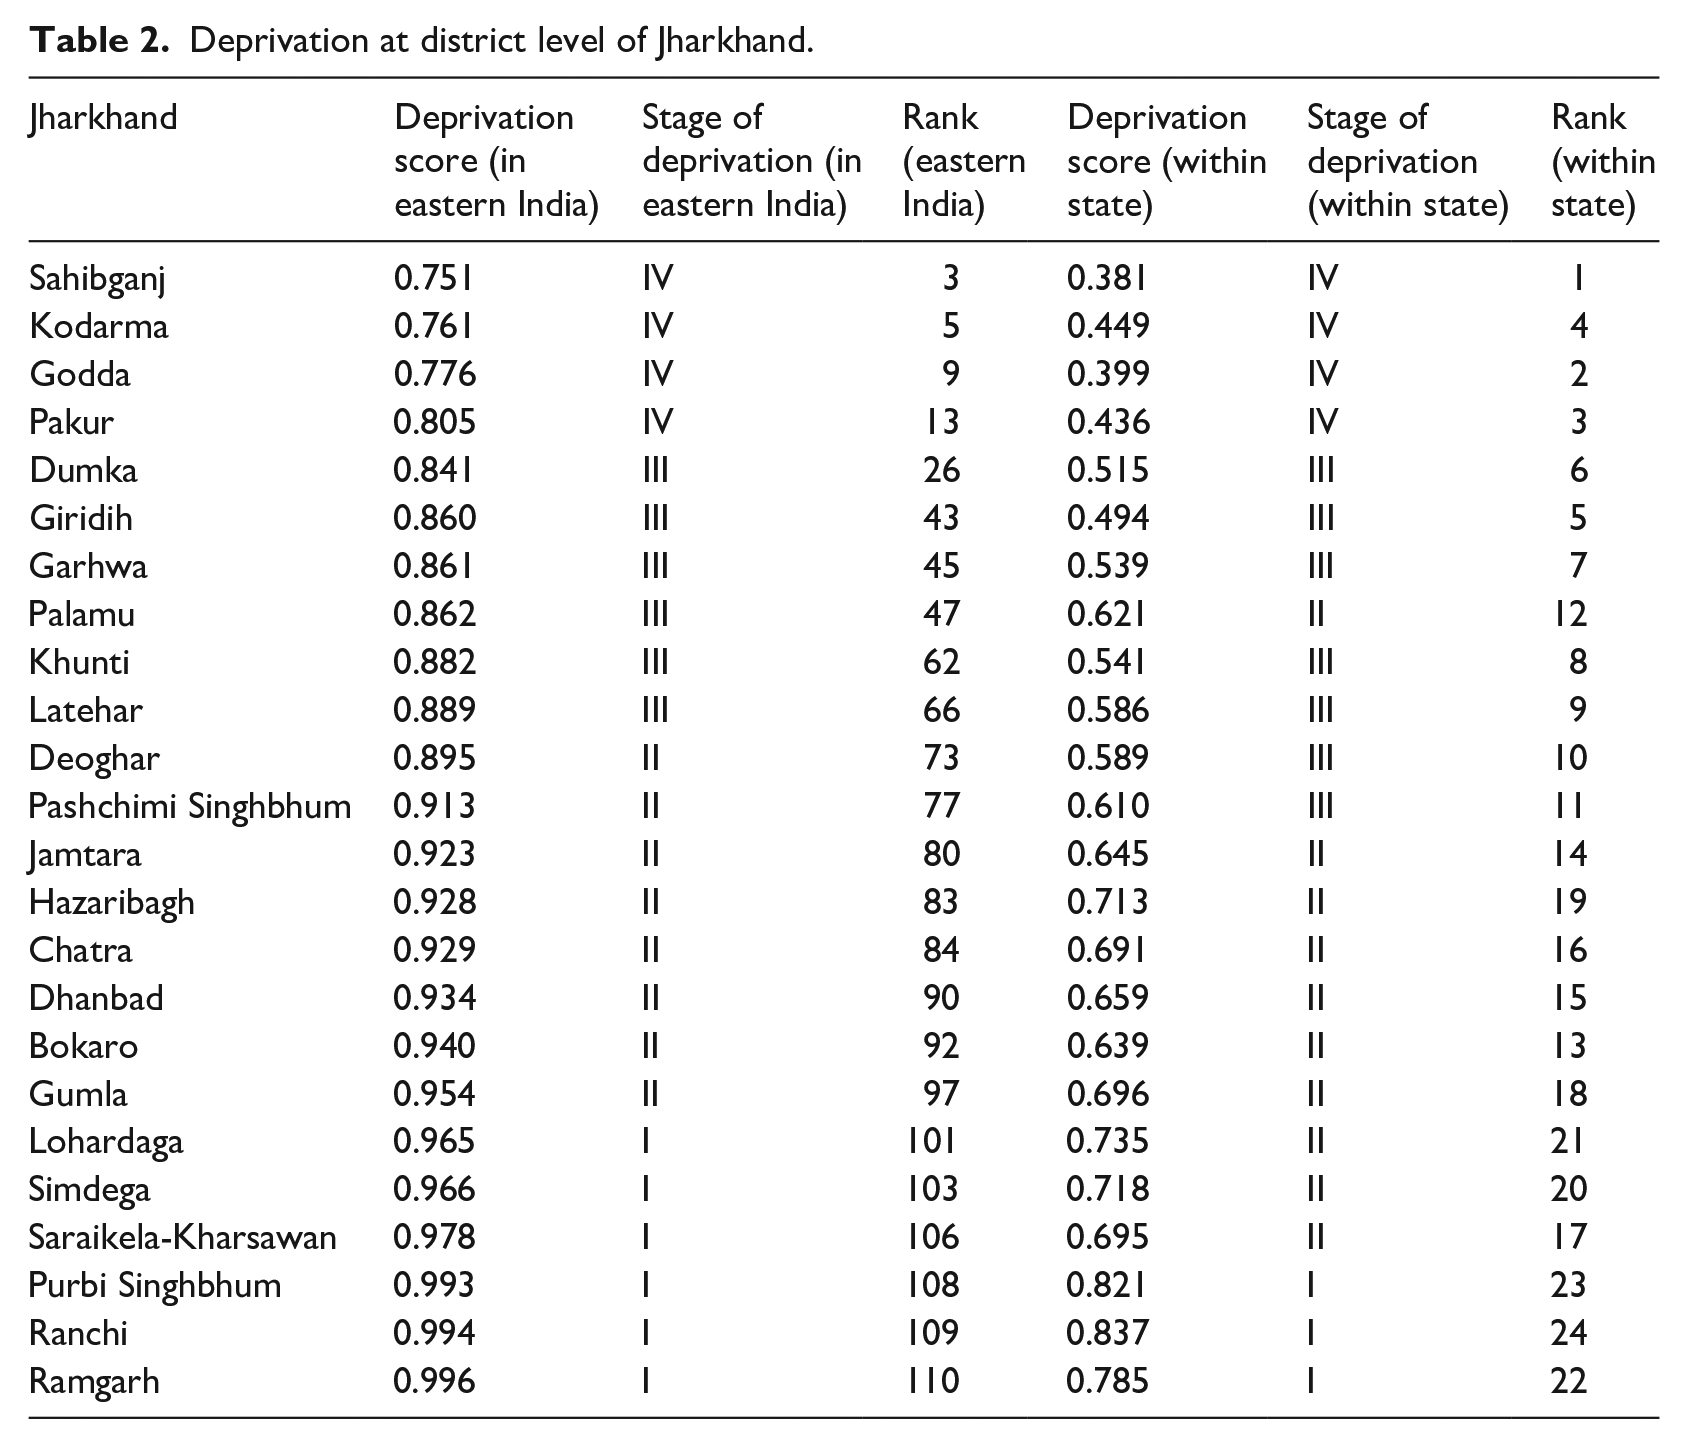
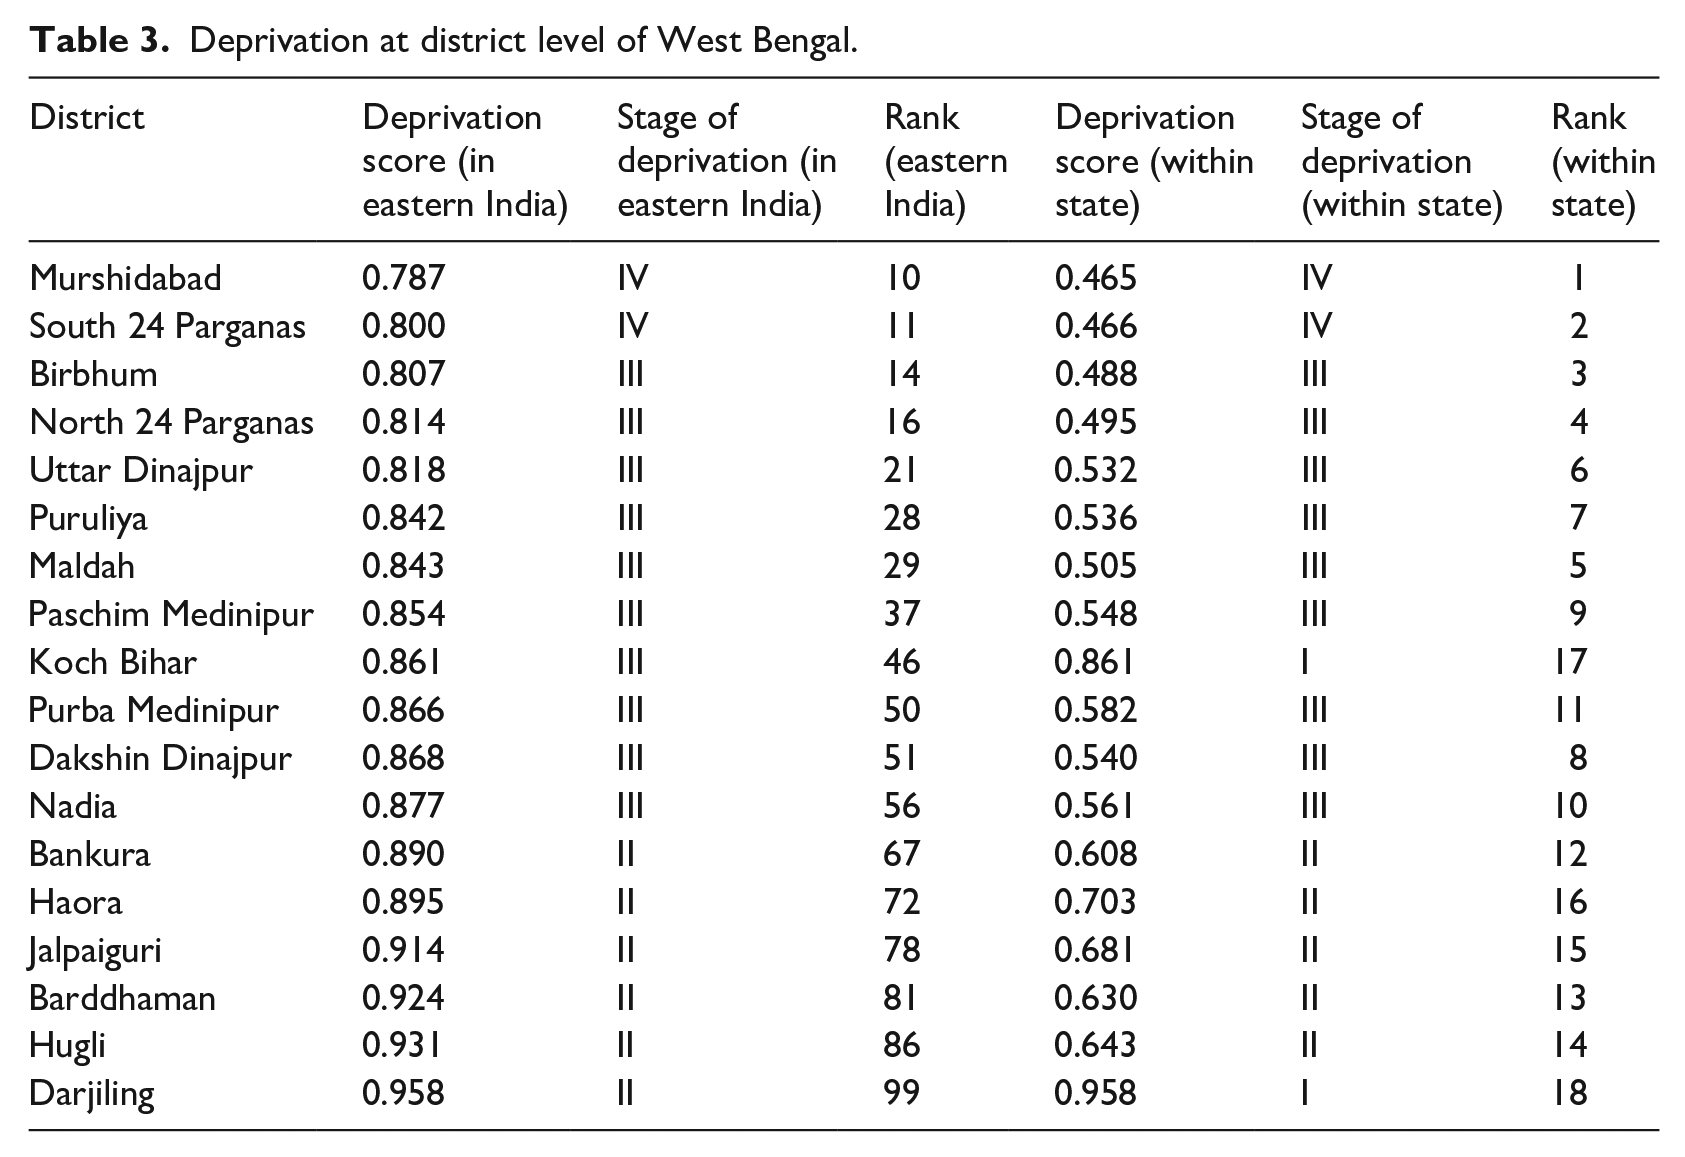
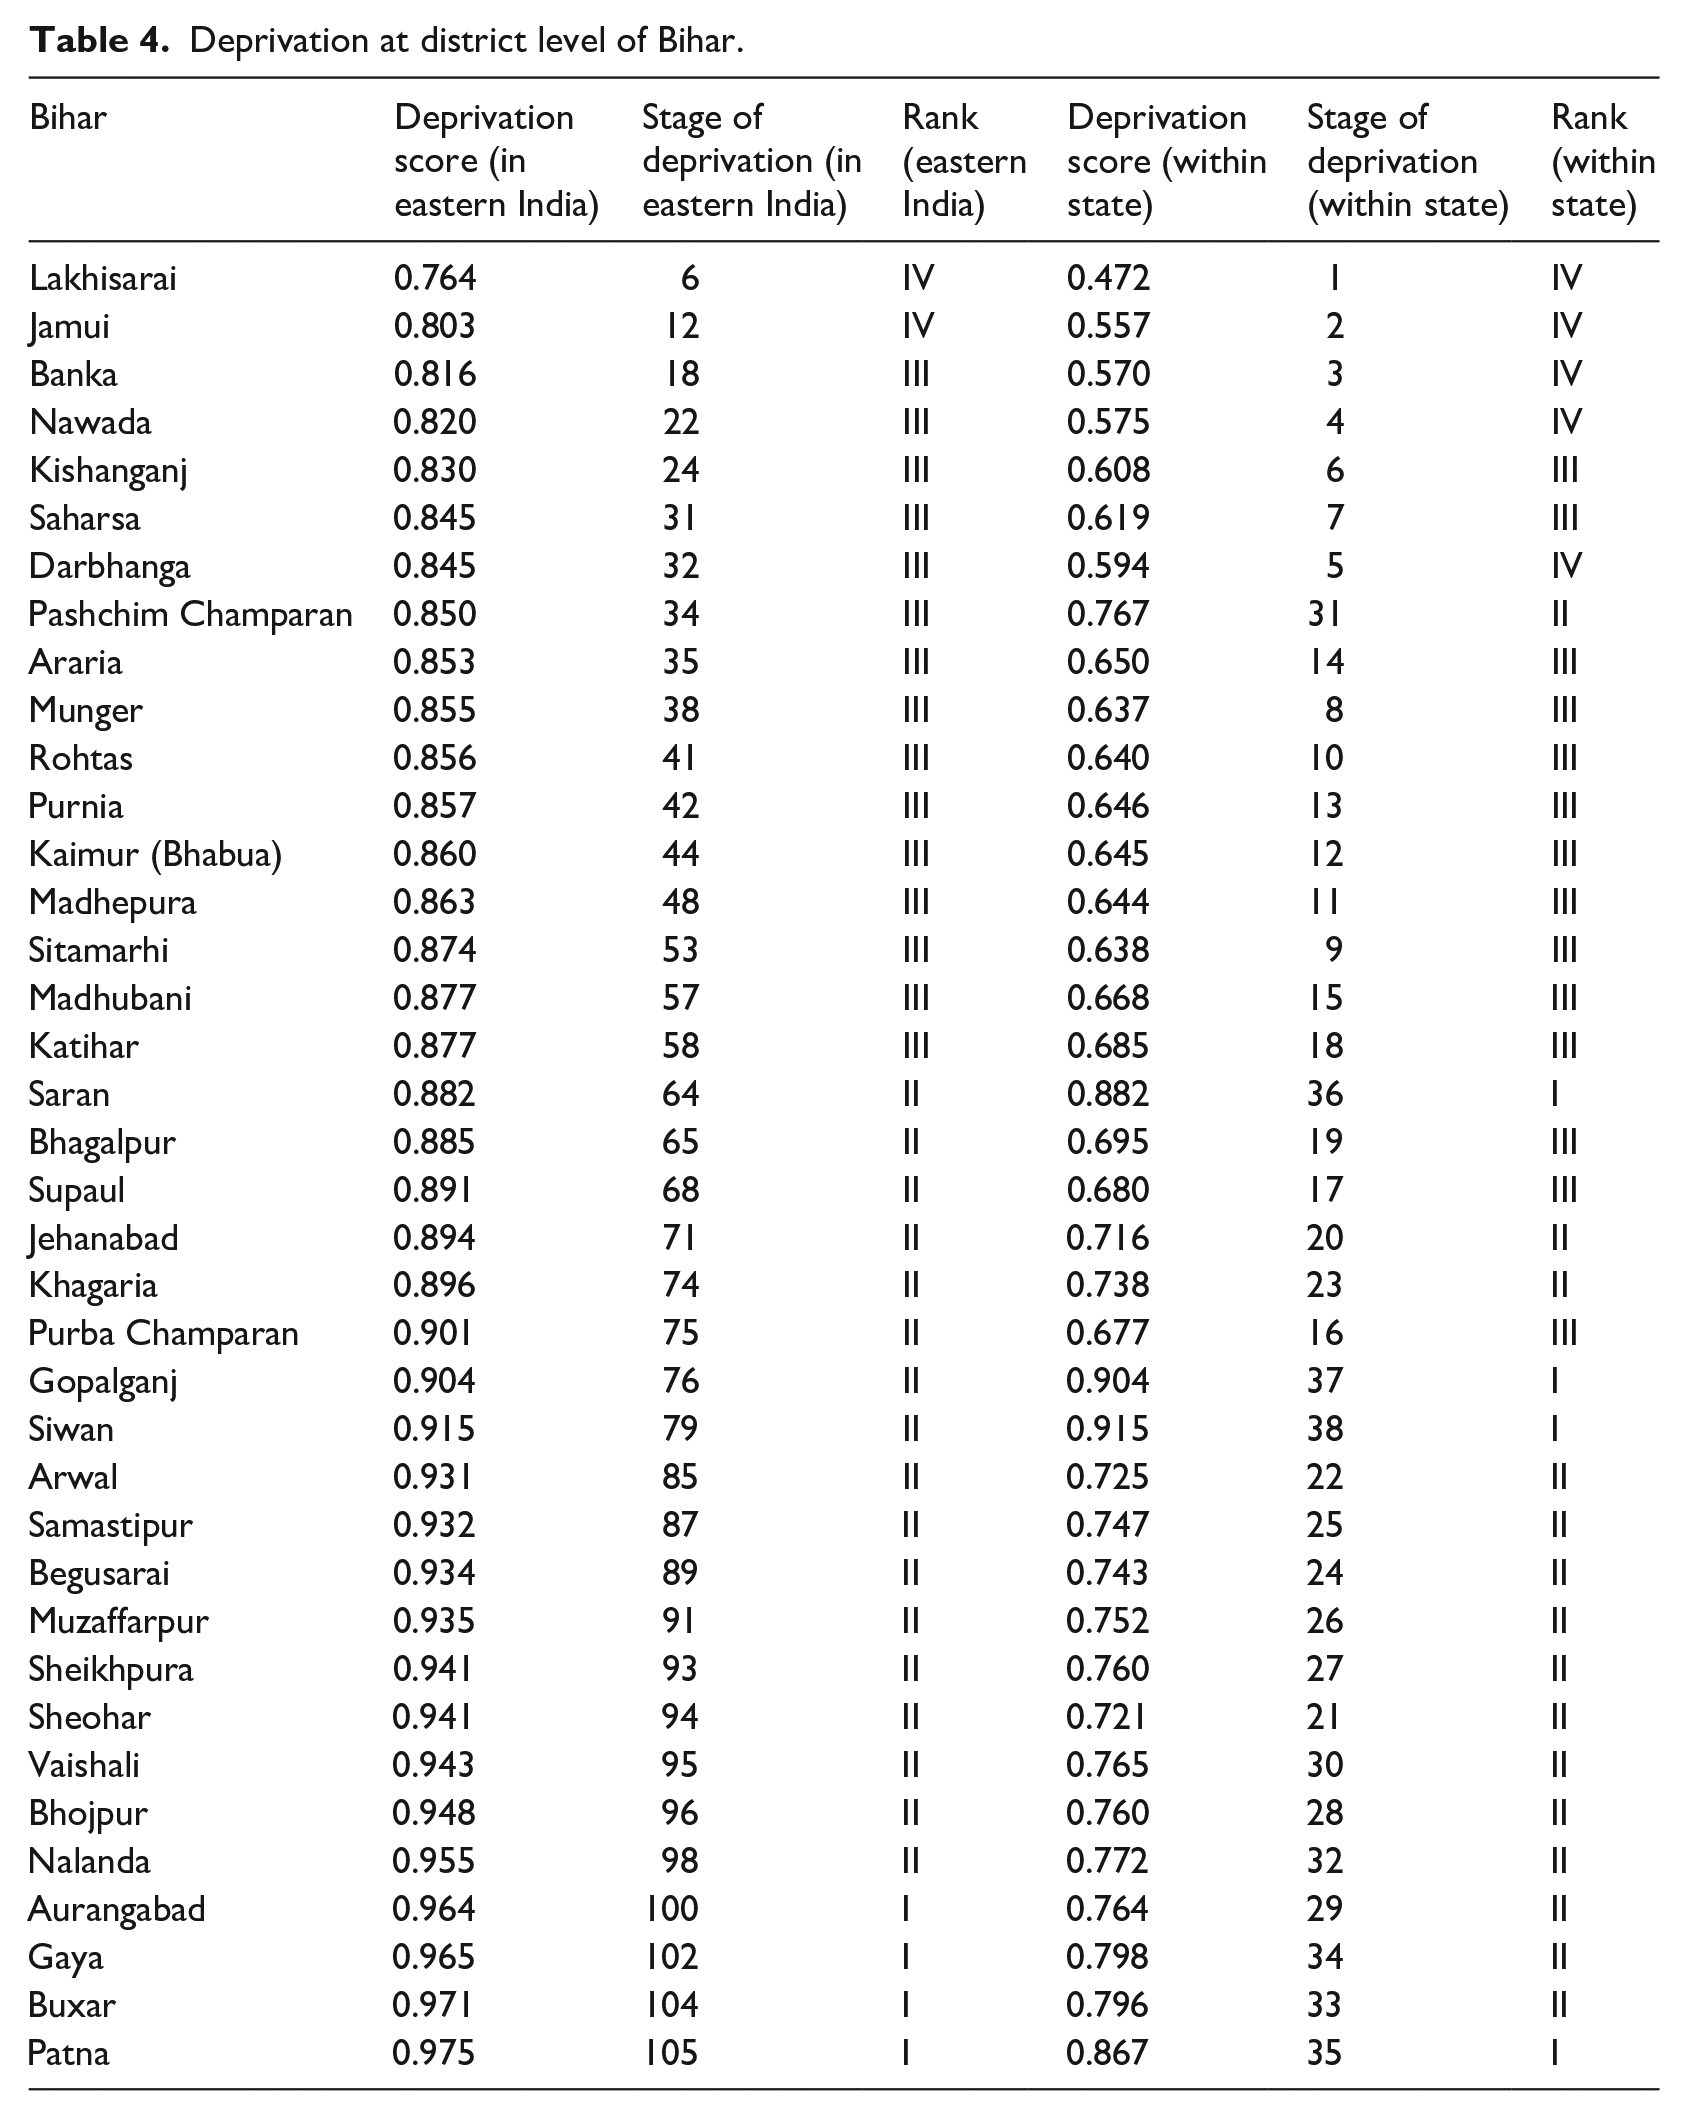
Tables 1–4 display the district level of all deprivation score derived from all selected variables of quality of housing, housing amenity, housing economy and asset and education domains in the eastern Indian states. It is noteworthy that Odisha has the highest number of districts (5) falling into the category of deprivation at the state level, followed by Jharkhand (4).
Deprivation at district level of Odisha.
Deprivation at district level of Jharkhand.
Deprivation at district level of West Bengal.
Deprivation at district level of Bihar.
The performance of West Bengal in the housing quality domain, including dilapidated houses (17.54%), no exclusive rooms for married couples (4.32%), and not having own houses (4.32%) is considerably lower than the other states. It demonstrates that tribes in rural West Bengal have a higher level of housing quality deprivation. On the other hand, Jharkhand has the largest proportion of kuchcha houses (77.89%). In eastern India, the deprivation in terms of having kuchcha houses (64.45%) is significantly larger than the other variables in the same domain. It is found that most of the tribal houses are kuchcha in nature. The kuchcha house does not have a concrete roof/wall/floor and is made by grass/thatch/bamboo/wood/mud, plastic/polythene, handmade or machine-made tiles, burnt brick, stone/slate, metal/asbestos sheets and so on.
In terms of housing amenities, Jharkhand’s performance is lower than average in eastern India. Jharkhand has the greatest percentage of untreated source of water (98.30%), non-clean fuel (99.20%), no latrine (96.57%), no bathroom (95.15%) and open drainage (99.43%) out of eight indicators. West Bengal’s housing conditions are better than that of other states. Odisha, on the other hand, has the highest share of households that fetch water from a long distance (34.37%) and those that do not have electricity (99.82%). Bihar has the greatest percentage of households without a separate kitchen (71.73%). These circumstances exemplify the bleak image portrayed in tribal rural households. The lack of access to treated drinking water is a major contributor to the spread of water-borne illnesses. Furthermore, poor sanitation facilities pose a health risk, particularly for tribal women. Likewise, the use of non-clean fuel for cooking generates indoor air pollution, which compounds the poor health conditions of the tribes.
The region has been demonstrated to be downtrodden in terms of its economy and assets. The acquisition of a salaried job is the most deprived of the four variables in this subsection. In the whole region, 94.21% of families do not have a salaried job. Another variable, monthly income, also shows signs of deprivation. The monthly income of 85.35% of households is less than Rs.5000. Odisha is the most impoverished state in terms of GDP and assets. This state has the greatest percentage of families without access to banking services (67.97%), no salaried jobs (96.38%) and a monthly income of less than Rs. 5000 (94.75%). West Bengal has a higher percentage of people not having assets (38.06% West Bengal, 33.82% eastern India). The economic condition is producing further deprivation in areas such as education, housing quality and infrastructure.
The growth of a family’s socio-economic standing is strongly influenced by literacy. If a person’s literacy level is low, it might lead to severe economic and social distress. Illiteracy, on the other hand, is a deprivation variable in itself. In rural parts of eastern India, the tribal people have a 55% illiteracy rate. Bihar (61.17%) has the largest proportion, while West Bengal has the lowest (42.84%). Female literacy is vital for socio-economic upliftment in addition to overall literacy since children spend the most of their time with female members of the family. As a result, a knowledgeable woman may educate her whole family, especially the next generation. However, female illiteracy is relatively common among tribal households in this scenario as well. Female illiteracy is prevalent in eastern India, with 65.32% of women being illiterate. Odisha (69.85%) has the highest percentage, while Jharkhand has the lowest.
State-wise spatial variation of deprivation
Odisha
The higher proportion of deprivation indicators in the state Odisha reflects the higher incidence of deprivation in this state. In terms of housing quality, it is seen that around 11% of all tribal households live in dilapidated houses. In the Bhadrak, Jajapur, Baleshwar, Cuttak and Puri districts, it is found in around 19% of the households. Around 73% of them are residing in Kuchcha houses. The housing condition is relatively better in the Kandhamal, Gajapati, Korapur and Raygarh districts, where more than 45% of tribal households are dwelling in semi-pucca or pucca houses. Around 98.94% of them do not have exclusive room for married couples. However, most of them have the ownership of their houses. Its concentrations are higher for the district Puri, Bhadrak, Jagatsinghapur, Kendrapara and so on. In the field of possession of bathroom and toilet facilities, the conditions of tribal households are excruciatingly awful. It is found that more than 93% households do not have latrine and bathroom facilities in their houses. Even, in terms of having basic amenities also, the condition is pitiful. Around 41.5% of them do not have a separate kitchen and nearly cent percent households use non-clean fuel for cooking. These include coal, cow dung, firewood, plant leaves and so on. Around 99.82% of them do not have access to power. Another most worrying issue is that 97.90% of them consume untreated water, which is engrossed in health degradation. The level of education is also exceedingly bad. Around 53.67% of the overall tribal population is illiterate, while the female illiteracy rate is 63.02%. In the Jharsuguda, Subarnapur, Nayagarh, Puri, Sambalpur and Bargarh districts, the level of literacy is quite better where more than 56% of the total tribal population are literate.
The spatial pattern of monthly income among the tribal households is relatively consistent. Around 95% of them earn less than Rs 5000 per month. In the Malkangiri district, it is found in 97.74% of the total tribal households. In the case of salaried jobs, a similar pattern is evident. Around 96.38% of them do not have any salaried jobs. Around 37.76% of them claimed that they do not have any form of census-defined household assets. In the case of the availability of banking facilities, substantial variation is noted at the district level. More than 80% of tribal households in Kordha, Nabarangpur and Malkangiri districts have access to banking services; however, the figure in Gajapati, Kandhaman and Kendrapara districts is much lower (50%).
Jharkhand
In Jharkhand, around 77.89% of tribal households have Kuchcha houses. In the Giridih, Deoghar, Jamtara and Khunti districts, more than 92% of them have kuchcha houses. The situation is better in Purbi Singhbhoom and Ramgarh districts, where ~50% of them live in kuchcha houses. The scenario is better in terms of having good condition houses and ownership of houses. Only 4.60% of them are residing in dilapidated houses and only a small percent of them do not have their own houses. But only a very small percentage of them have a separate room for married couples. Like in other states of eastern India, the condition of latrine and bathroom facilities among the tribal households are also very poor. Around 95% of them do not have bathroom and latrine facilities. The majority of them (71.09%) do not have a separate kitchen. In almost all households (99.20%), non-clean fuels are used for cooking. The availability of electricity varies widely across the districts. In Pakur, Sahibganj, Garwa, Godda and Simdega districts, around 92% of households do not have access to electricity. This condition is appreciably better for the districts having a higher level of urbanization and industrialization like Ranchi, Bokaro, Dhanbad, Purbi Singhbhum districts and so on. Around 98.30% of them drink untreated water, and 99.43% of them do not have a close drainage outlet. In this state, the level of illiteracy is highest among the eastern Indian states. About 61.72% of the total tribal population is illiterate, and the female illiteracy rate is significantly lower than the male.
The economic condition of the tribal households is likewise dire. Around 93.48% of them do not have a salaried job, and 83.77% of them earn less than Rs 5000 per month. However, it has been noticed that throughout Jharkhand’s industrial belts, the percentage of tribal people who get involved in salaried jobs increases significantly, and their family income also rises. It can be evident for the tribal households of Ramgarh, Hazaribag, Purbi Singhbhum, Saraikela-Kharsawan, Dhanbad, Ranchi and so on.
West Bengal
In this state, around 17.54% of the total tribal households dwell in dilapidated houses. This concentration is highest for the North 24 Parganas (35.89%), followed by South 24 Parganas (28.51%), Purba Medinipur districts (23.10%) and so on. In most of the districts of Southern West Bengal, Kuchcha houses account for more than half of all tribal dwellings. Northern part of West Bengal has a better housing condition, with semi-pucca to pucca houses accounting for around 80% of all tribal dwellings. Around 96% of the tribal household no exclusive room for married couples are found. Around three-fourths of tribal families do not have access to latrines. More than 95% of them used to defecate in the open field in Purulia, Birbhum and Bankura. Around 10% of them do have access to a bathroom. Approximately 97.81% of them cook with non-clean fuel. Out of 18 districts of West Bengal, in 11 districts, it has been found that more than 75% of the tribal house do not have access to electricity. There is a wide range of variations on the availability of drinking water within the premises. In South 24 Parganas and Purulia districts, around 53.91% and 52.83% of the tribal households collect water away from their houses. The major issue, however, is that 92.87% of them consume unclean water. Around 1.2% of the total households have closed drainage. The literacy level of the tribes in this state is quite better than other concerned states. Around 42.84% of the total tribal population is illiterate, but the performance of female literacy is remarkably lower than male literacy. Around 59.67% of the female population are illiterate.
Their monthly income represents a very low standard of living. More than 84% of tribal households in 17 districts earn less than Rs 5000. Only a limited number of tribal people get involved in salaried jobs. The condition is relatively generous for the Koch Bihar and Jalpaiguri districts. Around 38% of them do not have any household assets. The tribal families of Darjiling, Bankura and Paschim Medinipur, on the other hand, own a larger share of the household assets. Around 67.61% of them do not have any banking facilities. This condition is extremely dismaying for the Uttar Dinajpur, Nadia, Malda and South 24 Parganas.
Bihar
In Bihar, the concentration of the tribal people is exceptionally lower than in the other three states of eastern India. However, the data on tribal deprivation portray a grim picture of their quality of life. Around 7.69% of them have dilapidated houses. Around 59.17% of them stay in Kuchcha houses. Only 3.46% of them have a separate room for married couples. Like in other concerned states, the toilet and bathroom facilities are critically insufficient. Around 71.73% of them do not have separate kitchens and just 2.85% of them use purified water.
In this state, the economic conditions of the tribes are also impecunious. Only ~2.4% of them have salaried jobs and ~24% of them have more than Rs 5000 family income. Around 63.85% of them do not have any banking facilities.
Variation in the level of deprivation using Wroclaw Taxonomic Method
For assessing the level of deprivation, 110 districts from four states have been taken as a combined unit. But to highlight intra-state variance, the deprivation index has been measured individually for each concerned state.
Eastern India
The score of the district-level deprivation index in eastern India varied from 0.661 (Bhadrak district, Odisha) to 0.996 (Ramgarh district, Jharkhand). Out of 110 districts in eastern India, 55 are in the high-middle stage of deprivation (stage III) and 13 districts are in the very deprived stage (stage IV) (Figure 2). Hence, around 60% of the districts in this region, the level of deprivation is alarming. The condition is worsening for Odisha, where 29 districts out of 30 are in the high to high-middle stage of deprivation. The 12 districts of West Bengal and 17 districts of Bihar are likewise at the high to high-middle stage of deprivation. Only 11 districts in eastern India are at the low deprived stage (stage I), out of which six districts are from Jharkhand (Lohardaga, Simdega, Saraikela-Kharsawan, Purbi Singhbhum, Ranchi and Ramgarh) and four districts from Bihar (Aurangabad, Gaya, Buxar and Patna) and one from Odisha (Jharsuguda). In eastern India, the top 10 highly deprived districts are Bhadrak (Odisha), Baleswara (Odisha), Sahibganj (Jharkhand), Koderma (Jharkhand), Puri (Odisha), Lakhisarai (Bihar), Jajapur (Odisha), Cuttak (Odisha), Murshidabad (West Bengal) and Godda (Jharkhand).
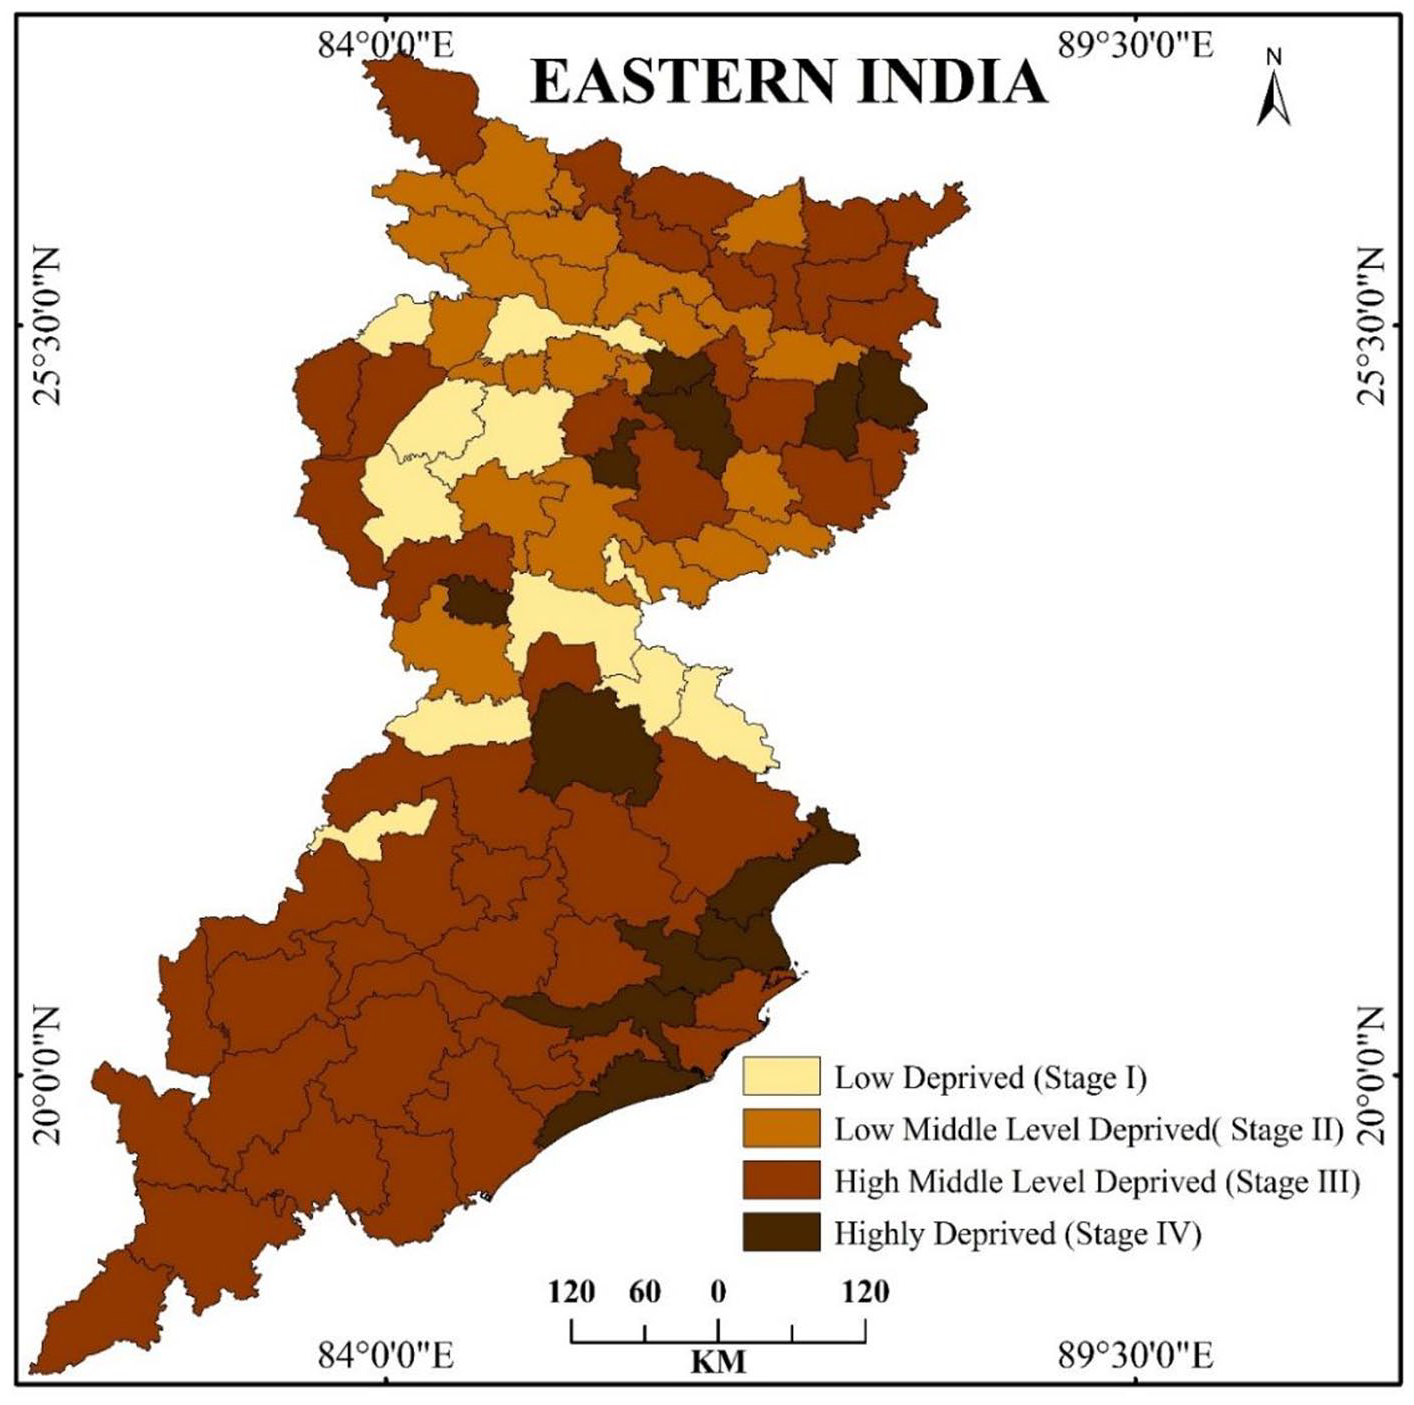
Level of deprivation in eastern India.
The wider variety in the stage of deprivation has been found for Jharkhand, where 4 districts are in stage IV, 6 in stage III, 8 in stage II and 6 in stage I. Here also, the coefficient of deprivation score is greater, followed by Odisha.
Intra-state variation in the level of deprivation
Odisha
Among all the eastern Indian states, the performance in tribal development is extremely appalling in this state. At the national level as well, Odisha is under extremely poor condition. Table 1 indicates a broad range of differences in the deprivation score. It varies from 0.594 (Bhadrak) to 0.979 (Jagatsinghapur). The 5 districts, namely Bhadrak, Jajapur, Cuttak, Dhenkanal and Baleswara, are in a highly deprived stage (Figure 3(a)). All these districts are located in the north-eastern region of Odisha. The 11 districts are at the high-middle stage of deprivation. All these districts lie in a tract (excluding Kordha) from the north to south-western part of the districts. The districts located in the deltaic plain and coastal plain areas are found in the low-middle and low-deprived stages. Only the districts of Gajapati, Jharsuguda and Jagatsinghapur have a low level of deprivation.
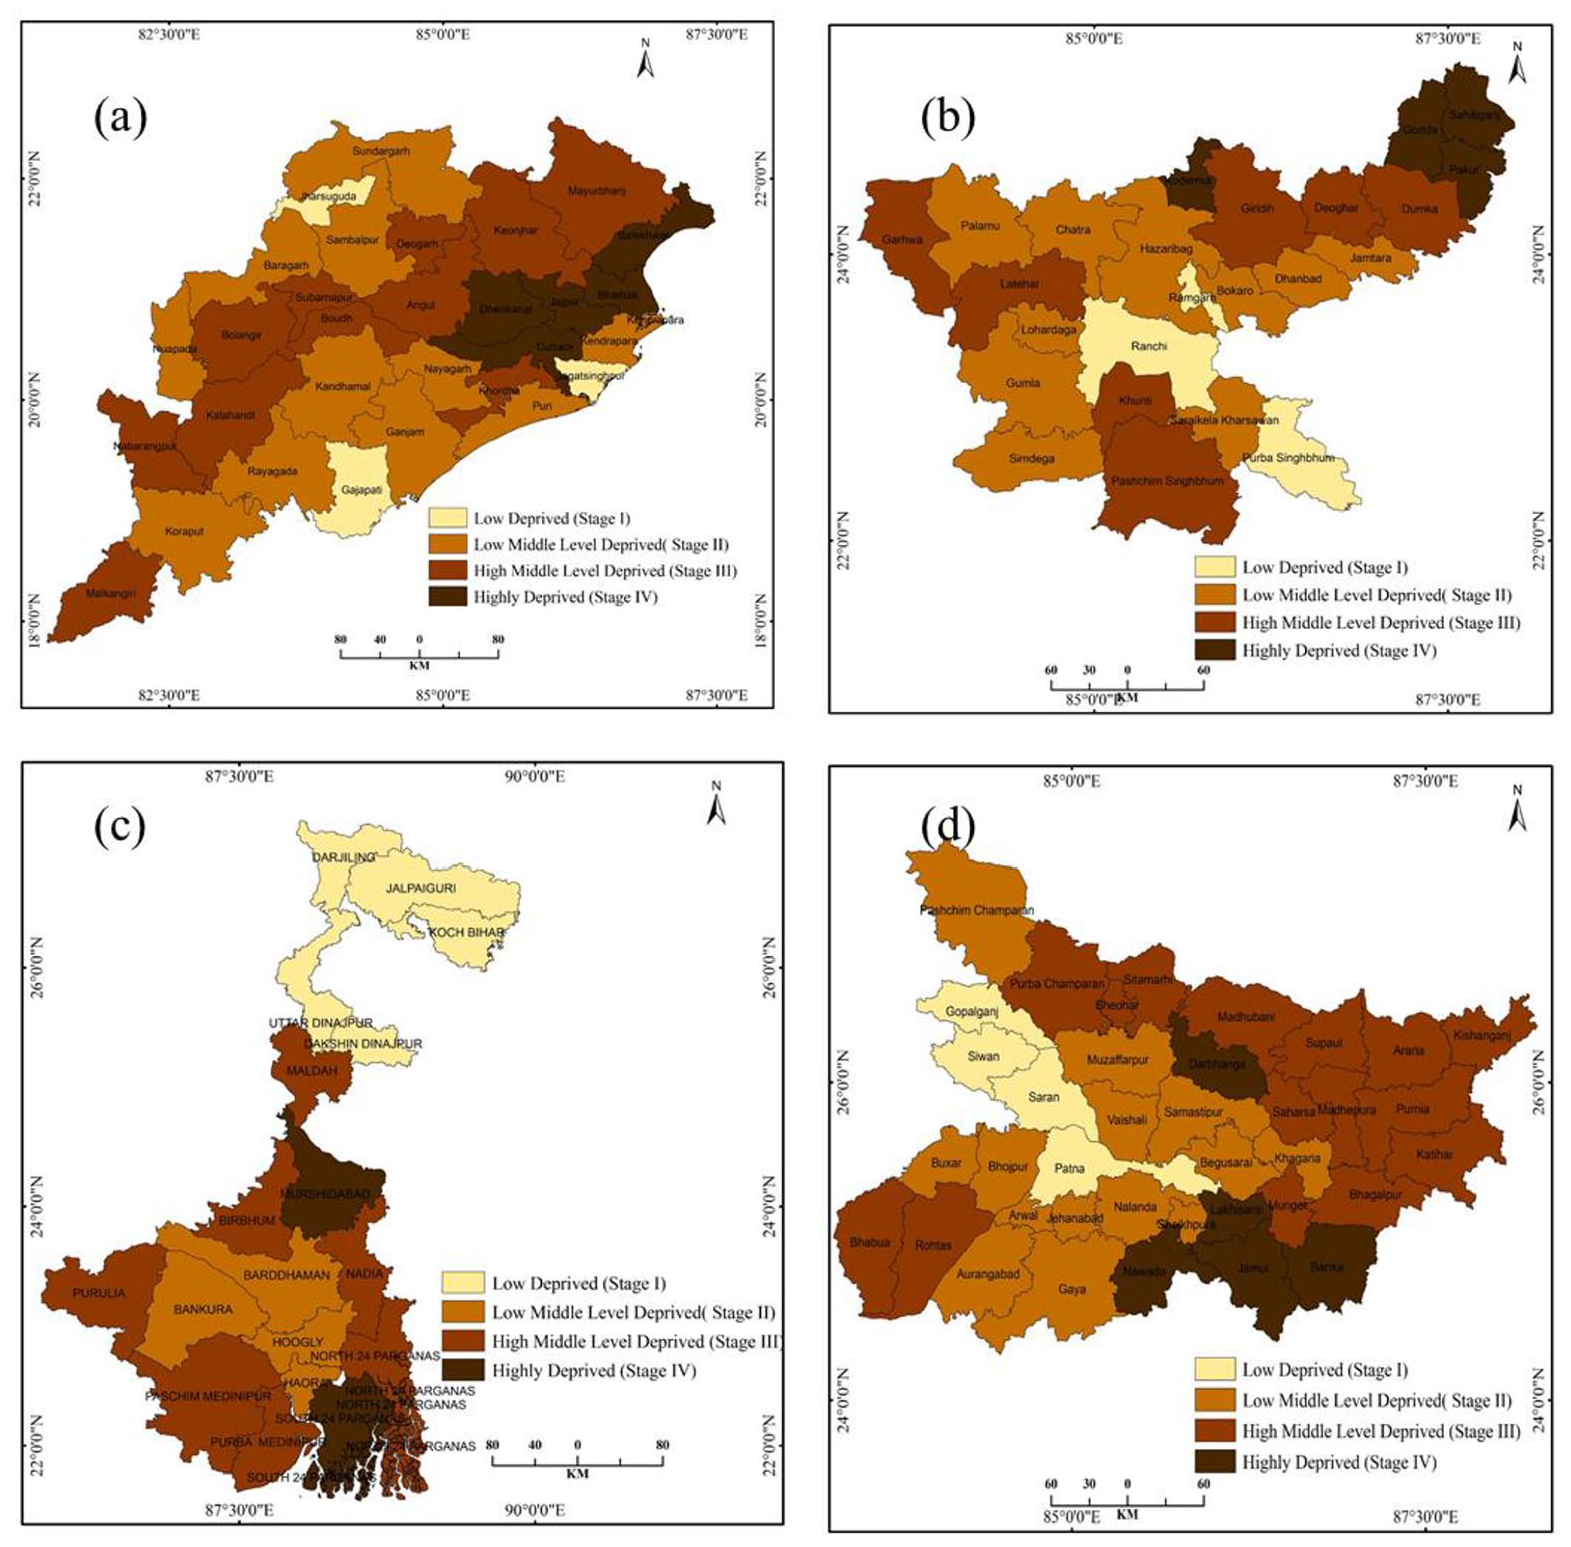
Level of deprivation (a) Odisha, (b) Jharkhand, (c) West Bengal and (d) Bihar.
Jharkhand
Among all the concerned states, the intra-state variation in the deprivation score is substantially larger. It varies from 0.380 (Sahibganj) to 0.996 (Ramgarh). The Sahibganj, Koderma, Godda and Pakur districts are in a highly deprived stage (Table 2). The NITI Ayog, Government of India has enlisted Sahibganj and Pakur districts among the 20 most economically backward districts. All the districts located in the north-eastern region of this state are in the high-middle to highly deprived stage (Figure 3(b)). The highly urbanized and industrial areas, namely Ranchi, Bokaro, Dhanbad, Ramgarh, Purbi Singhbhum, Saraikela-Kharsawan and so on are at the low to low-middle deprived stage.
West Bengal
In West Bengal, all districts are found to have stage II to stage IV levels of deprivation (Table 3). Here, the Darjiling district comes top, followed by Hugli, Bardhaman, Jalpaiguri and so on. Murshidabad and South 24 Parganas are at a highly deprived stage (Figure 3(c)). 10 districts are at the high-middle stage of development. The districts with higher proportions of urbanization and industrial growth, for example, Haora, Hugli, Burdwan and Darjiling districts, exhibit a lower degree of deprivation than other districts of West Bengal.
Bihar
Bihar has a significantly lower ST population concentration than the other eastern Indian states. There are large differences in the inter-district deprivation score (Table 4). It varies from 0.472 (Lakhisarai) to 0.915 (Siwan). The districts of Lakhisarai, Jamui, Nawada, Banka and Darbhanga are in a stage of extreme deprivation (Figure 3(d)). 14 districts are identified as being in the high-middle stage of deprivation. The districts of Gaya, Patna, Saran, Gopalganj and Siwan are at a low-deprivation stage.
The linkage between tribal deprivation and tribal population concentration
After closely evaluating the tribal population concentration and the phases of deprivation, it can be stated that there is no substantial degree of relationship detected between these two. It should be mentioned that 60.90% of the tribal people live in the Gajapati district of Odisha but is in stage I deprivation. Bhadrak district, on the other hand, has 1.84% of the tribal population and is under stage IV of deprivation. The Darjiling district in West Bengal has the largest proportion of STs, which is in stage I, but the Murshidabad district, with 1.51% of the tribal population, is in stage IV. A similar trend can be seen in the Purbi Singhbhum (stage I) and Koderma districts (stage IV). In all variations of tribal distributions, the higher middle to a higher level of deprivation has been seen.
The tribal people who live in the districts of the middle and lower Gangetic plains rely primarily on agriculture and pastoralism for a living. Among them, the level of deprivation is very high. In this Gangetic plain region, where the concentration of urban centres is appreciably higher and well-established middle- and large-scale industries are found, the tribal people have engaged themselves in the diversified fields of the economy. Along with agriculture and pastoralism, a significantly larger number of people are getting involved in the secondary, tertiary and also quaternary sectors of the economy. Hence, the level of deprivation becomes remarkably lower. In the hard rock terrain areas of the Chotanagpur plateau and Eastern Ghats, the tribal people have to suffer hardships for their sustenance. Agriculture is not widely practised here due to the dominance of infertile soil, poor drainage system and prolonged drought periods in most years. The tribal people are mainly involved in hunting and gathering. Hence, their level of deprivation has become immensely higher. However, this region has plenty of mineral and power resources. Therefore, in the places where extraction and processing industries for mineral and power resources are located, urban centres are also developed herewith. Only in this region, the quality of living increases among the tribal people (e.g. Ranchi, Purbi Singhbhum, Bokaro, Dhanbad, etc. of Jharkhand; Jharsuguda, Sundargarh, etc. of Odisha). But away from urban and industrial centres, they are found in exceptionally poor and deprived conditions. In the coastal belts of Odisha higher proportion of urban centres and industries are observed. In spite of this, in Kordha and Cuttak districts, the tribes are found in the higher-middle to the highly deprived stage. Although the socio-economic conditions of the tribes are quite better for the coastal districts like Jagatsinghapur, Puri, Ganjam, Gajapati and so on. The tribes located in the Himalaya and Himalayan foothill regions of West Bengal (Darjiling, Jalpaiguri and Koch Bihar districts) are found in better living conditions. The improved quality of life is due to the successful implementation of the hill areas tribal development programme, improvement of tourism and plantation industries, as well as the increasing level of urbanization and literacy among them.
The linkage between implementation of tribal development programmes and tribal deprivation
Tribes are the underprivileged section of society. Several studies have shown that the STs are consistently behind the SCs in terms of development (e.g. Mamgain, 2013; Rao and Babu, 1994; Xaxa, 2008). Since independence, various approaches to tribal development have been implemented, including additional financial assistance in 5-year plans through community development approaches, the creation of Special Multipurpose Tribal Development Projects (MTDP) and the conversion of community development blocks into Tribal Development Blocks with a tribal population of 60% or more. Finally, a Tribal-Sub Plan was developed, in which tribal development was integrated with the region’s general development objectives through the Integrated Tribal Development Project (ITDP) (National Commission of Scheduled Tribes Report (NCSTR), 2021). As a result, aside from particular tribal development schemes, the development schemes for the concerned region are expected to help the tribes. Newly implemented programmes may be beneficial to the rural tribal population’s level of deprivation. Schemes such as Swachh Bharat Mission (provision of household-owned and community-owned toilet) and Pradhan Mantri Awas Yojana (provision of houses in rural regions) can help to provide toilet facility and housing respectively (Basu and Das, 2021). Other schemes include Deen Dayal Upadhyaya Grameen Jyoti Yojana (DDUGJY) for continuous power supply in entire rural India, the Swajal scheme for the supply piped water in the rural area. The Pradhan Mantri Jan Dhan Yojana (PMJDY), which aims to provide financial inclusion to all households in the country, maybe beneficial. Aside from providing banking services, it is also expected to distribute all government benefits to beneficiaries via Direct Benefits Transfer (DBT). Through this method, cash transfer through the banking system, which was proposed as an alternate strategy to reduce corruption, can become a reality (Bhagat, 2013). The Pradhan Mantri Jeevan Jyoti Bima Yojana, PMJJBY which provides life insurance, can also be beneficial to underprivileged family members.
Conclusion
This study examines the extent of deprivation among eastern India’s scheduled tribe populations. The authors were able to identify districts with various levels of deprivation using the Wroclaw Taxonomic Method, such as highly deprived, high-middle deprived, low-middle deprived and low deprived. The study brings out the fact that, over 60% of the districts are classified as being in the high and high-middle stages of deprivation. As a result, most districts are in jeopardy, with the exception of those on agricultural plains, near metropolitan centres, near mining sites, power plants and tourism hotspots. According to the study, the most deprived indicators are identified in housing amenities and economic sectors. Even the indicators are so intertwined that a deficiency in one component causes a deficiency in the other. For example, in the study area, around 85% of households have a low income, which adds to a lack of essential facilities in dwellings. The deprivation of drinking water, sanitation and toilet facilities is especially obvious at the district level of entire eastern India. Likewise, illiteracy is another sign of impoverishment. However, illiteracy plays a substantial role in a household’s economic standing. As a result, it is both an indicator and a cause of income deprivation. The study aims to investigate the level of deprivation among the most marginalized sector of society, the STs, in addition to identifying stages of development in various districts. As a result, policymakers and governments can be benefitted from the study because dimensions such as tribes, rurality and spatial pattern of regional deprivation have converged into a single point, providing insight into how to introduce new policies, revise existing policies, figure out why previous policies were delayed or failed and allocate resources accordingly.
Footnotes
Funding
The author(s) received no financial support for the research, authorship and/or publication of this article.