
Abstract
The food basket of the world is diversifying toward high-value crops. A diversified cropping system offers multifaceted opportunities for farmers. The nature of diversification in developing countries is significantly different at both farming and cropping levels; thus, it is felt important to investigate such a study at different land size holding. This study is conducted to examine the spatiotemporal pattern of crop diversification under different land size classes in the state of West Bengal, which assumes as a representative image of India. The study uses secondary data obtained from the Agriculture Census for the years 1995–1996 and 2015–2016. Gibbs-Martin’s diversification technique is employed for the calculation of the diversification index. Overall analyses reveal that the stunting change in diversification is noted in marginal, small, large, and all land classes. The implication of such growth pushes the rural economy in a skewed direction. For de-stunting growth in diversification index, short- and long-term policy push from public and private agencies is the need of the hour.
Introduction
The food basket of the world is diversifying toward mainly vegetables and horticulture. Various studies suggest the proposition in favor of diversifying food baskets induced by vegetable farming. Newman et al. (2014) have studied the multifaceted opportunities of vegetable farming and conclude that diversification of crops toward vegetables is needed which must be supported by specific policy intervention from public and private partners. Another study by Joshi et al. (2004) has found that the nature and extent of crop diversification in South Asian countries in the past 20 years has shifted toward high-value commodities, namely, fruits and vegetables, livestock, and fish production. Due to multistage opportunities in crop diversification systems, the high-value crops are getting more area through changing cropping patterns or crop replacement. Zentner et al. (2002) conclude that the cropping system in the Canadian Prairies is shifted from traditional cropping toward an extended and diversified rotational cropping of oilseeds and pulses crops with cereal as prime grains. To support growing consumerism, increase income, and maintain nutritional intake, crop diversification does find its way in recent years. A study on “Long-term Changes in Indian Food Basket and Nutrition” by Kumar and Dey (2007) examines the pattern of food consumption from 1983 to 2000 and concludes that the recent extents of crop diversification have gained momentum toward fruits, vegetables, oilseeds, milk, and eggs over traditional coarse cereals. Large-scale diversification in developing countries goes with cereals along with high-profit crops to ensure households’ consumption and maintain livelihood options. A temporal study by Satyasai and Viswanathan (1996) shows that the crop diversification in India from 1952–1953 to 1992–1993 is shifted from cereals and pulses to high-value food like oilseeds, fruits, and vegetables but coarse grains crop remains in the entire production systems.
Since demands of food crops are different in a spatiotemporal context, nature of diversification is attributed at different levels such as food crops, non-food crops, commercial crops or cash crops, and so on. Large-scale commercial farming in developed agriculture has already set the example of vertical diversification in different pockets of Europe and North America. And therefore, the nature of diversification is getting limited to small-scale or even window gardening (Womack, 2018). In developing countries, the agricultural system is mainly diversifying from food to non-food crops due to increasing vertical diversification (Yahya, 2001). Large-scale diversification at the cropping level is phenomenal in South Asia and Africa but limited to a few crops only but small-scale diversification is growing at the fastest rate in agriculturally developing countries like India, Sri Lanka, Nigeria, Brazil, and others (UNDP, 2019). In countries like India, the nature of diversification does match with global trends but is significantly different at both farming and cropping levels. With more than 75% marginal farmers, India’s crop diversification is mostly driven by risk aversion, income generation, and policy pushed impetus such as Natural Resource Management for Sustainable Agricultural Development (2007), Food and Nutritional Security Program (2007), Promotion in Opening of Seed Hub Center (2008), and other. The present study can be taken as a representative image of India with an actual analysis from a state, that is, West Bengal. The state is inhabited by more than 96% marginal and small farmers which is indeed almost equivalent to India’s farming group from two land size classes; therefore, nature and extent of diversification would be identical with that of India as a whole.
The necessity of crop diversification has been felt at many different levels. Crop diversification boosts income as the high-value crops such as vegetables and root crops not only intensify the cropping system but also give higher financial returns per unit of land (Kasem and Thapa, 2011). A study on “Diversification into Horticulture and Poverty Reduction: A Research Agenda” by Weinberger and Lumpkin (2007) has found that diversification into horticultural crops assists small and poor farmers in developing countries to escape from poverty by increasing income and employment. A similar study is conducted by Chand (1996) in Western Himalayan Region and observed that diversification through horticulture crops has a huge potentiality to augment income and employment among marginal and submarginal holdings compared with the bigger farmers due to more family labor engagement. Adding to horticultural crops, diversification toward commercial crops also assists the small and marginal farmers to uplift their economy through increasing their farm output (Shiyani and Pandya, 1998).
The diversified agriculture toward high-value foods of oilseeds, fruits, and vegetables has witnessed a significant improvement in food security in terms of per capita calories consumption (Satyasai and Viswanathan, 1996). The physical availability and accessibility of foods of small and marginal farmers is ensured from crop diversification for households’ consumption over a limited parcel of land (Rahaman and Singh, 2020). Ensured calorie intake is necessary to all people at a time which is greatly focused on by Bamji (2000). His study on “Diversification of Agriculture for Human Nutrition” concludes that diversification of agriculture toward high-value commodities of fruits, vegetables, and livestock furnishes food and nutrition security at both national and household levels. Crop diversification toward high-value commodities brings varieties in household dietary patterns, leading to nutritional security among household and individual levels. In a study, Rajendran et al. (2017) have examined the relationship between household dietary patterns and crop diversification. The study has pointed out that crop diversification is although not directly helping farmers to increase their income rather it gives opportunities to spend more on market-based food and thus, ultimately it improves household dietary diversity. Another study by Mango et al. (2018) posits that households with higher crop diversification intensities are more likely to have a diverse diet. Farming households that grow multiple crops tend to be more secure in food supplies and income. Therefore, crop diversification enhances food security by providing food stock in terms of quantity and variety to smallholding farmers.
Various available literature suggests that crop diversification is an important adoption to cope with environmental change and soil conversion. Crop diversification has the potential to deal with environmental risk and enhance agricultural sustainability (Piedra-Bonilla et al., 2020). Climate change is one of the growing concerns of environmental risk that needs to be controlled. Ochieng et al. (2020) have analyzed how crop diversification can act as a strategy to counter climate variability and changes. The study has found that small farmers in warmer regions extend crop diversification as a risk management strategy. Cultivation of the same crops again and again in the same field reduces soil fertility, and therefore, farmers diversify their farms toward those crops that help the soil regain fertility. A case study of Malawian smallholder farmers by Kerr et al. (2007) found that farmers choose to adopt legume diversification over existing maize-based cropping system which is beneficial for soil conservation as it helps in improving soil fertility through enhancing Nitrogen (N) and Phosphorus (P) level and recycling nutrients in the soil. Nunes et al. (2018) also have observed that tillage practices and diversified cropping systems in the form of crop rotation and cover crops have beneficial effects on soil health.
The need for diversification of crops at the present is different among developed and developing countries. In developed countries, diversification of horticulture and vegetable crops is still missing as they focus on creating varieties of products from a single crop (Pellegrini and Tasciotti, 2014). The developed world has resources and dedicated infrastructure such as advanced machinery, well-connected roads, and available markets to practice crop diversification out of passion (Morel et al., 2020). They have opportunities to cultivate various sites in the form of window gardening, track farming, greenhouse tent, lake farming, and so on.
In developing countries like India, Brazil, Sri Lanka, Pakistan, and Nigeria, the craze of crop diversification has come to light in the 1990s after the introduction of LPG (Liberalization, Globalization, and Privatization) policy, allowing foreign companies to invest directly in various sectors. These countries have overcome the challenges of self-sufficiency in food and increased agricultural production recently. Now the focus has shifted toward other issues like income, employment, health, and nutritional security based diversification (Rahaman, 2021). Ample evidence from the works of the literature shows that the scope of crop diversification is multi-folded, that is, it augments income and employment opportunities as well as improves food and nutritional security (Bamji, 2000; Chand, 1996; Kasem and Thapa, 2011; Mango et al., 2018; Rajendran et al., 2017; Satyasai and Viswanathan, 1996; Shiyani and Pandya, 1998; Weinberger and Lumpkin, 2007). Intensive subsistence farming creates severe environmental problems, like depletion of groundwater resources, soil erosion, and loss of fertility. Diversification through rotation and alternation of crops helps to reduce these problems (Chhatre et al., 2016). Opportunities from crop diversification are multiple but growth in the same is not identical even within a similar geophysical environment. The last 29 years’ trends reveal stunting to de-stunting growth patterns at different cropping levels, hence crop diversification in India (Rahaman & Singh 2020). In his situation, setting up of evidence based-policy intervention and following up the best practice approach as viable policy avenue to promote crop diversification at both levels, that is horizontal and vertical, to reach the goal of doubling farmer income.
Study area
According to the 2011 Census, West Bengal is the home of a 91.28 million population spreading over an area of 88,752 sq. km, out of which 68.13% live in a rural area. Agriculture Census of 2015–2016 shows that the total net sown area of the state is 5.17 million hectares. Marginal farmers account for 82.71% of the total farmers and their share in the total net sown area is 53.67%. About 13.40% of farmers belong to the small land size class, and they contribute 28.68% of the total net sown area. The share of semi-medium, medium, and large farmers in the total cultivators remains 3.53%, 0.24%, and 0.01%, respectively, but their representations in the net sown area are 13.26%, 1.57%, and 2.81% consecutively. Nearly 44.03% of the total workforce in the state is engaged in the agriculture sector alone and out of which 78.09% inhabits male. Different types of crops are grown in both Rabi and Kharif seasons but the presence of the heterogeneous geophysical condition and agro-climatic environment do not allow major Rabi and Kharif crops to grow in different districts evenly throughout the state. Although the state is suffering from different constraints like low productivity, unorganized markets, deterioration of soil health, inadequate farm mechanization, and so on, still the state has ample opportunities to tackle these challenges (Goswami, 2020). The state of West Bengal has potential favorable climatic conditions, physiographic advantages, fertile alluvial soil, and human resources to practice agriculture in a better manageable way (Dasgupta, 2014).
The state government has adopted Rashtriya Krishi Vikas Yojana—Remunerative Approaches for Agriculture and Allied Sector Rejuvenation (RKVY-RAAFTAR) in 2007 to boost up agricultural development in general and to increase crop productivity through multiple cropping in particular through the preparation of the District Agriculture Plan (2008) and State Agriculture Plan (2007). On the other hand, the central government has taken several steps such as soil health card scheme in 2015 to improve soil fertility, Pradhan Mantri Krishi Sinchai Yojana (2015) for access and efficiency of irrigation, and Pradhan Mantri Fasal Bima Yojana (2016) to alleviate risk in agriculture which targets to develop diversified cropping system. Despite the immense effort by the central and state government, the share of agriculture in the state and central GDP is falling rapidly; the share of agriculture in GDP has declined from 51.9% in 1950–1951 to 17.8% in 2019–2020 (Economic Survey 2019–2020). Moreover, workforce participation in agriculture is also decreasing. The negative growth rate of the agriculture workforce, especially out-migration of the productive adult population, is a matter of concern. Horizontal crop diversification, although increased at cropping level, but the expansion of such is limited hence, this requires short- and long-term policy impetus. The present study is conducted to answer such critical concerns.
Objective
The specific aim of the study is to examine the spatiotemporal pattern of crop diversification under different land size classes in West Bengal during the period of 1995–1996 to 2015–2016 and to suggest required policy intervention in favor of de-stunting diversification index.
Hypothesis
Ho. There is no significant difference in change of crop diversification across land size categories.
Data and methodology
The present work is entirely based on secondary data sources. The required data have been obtained from the Agriculture Census of India.
There are several statistical methods available in the literature to measure the magnitude of diversification. Every method has its advantages and limitations due to the nature of the data each formula deals with and the specific purpose of interpretation. Gibbs and Martin’s (1962) technique is employed for this study because it is best suited to continuous data of the areal extent of crops. Gibbs and Martin’s technique is defined as
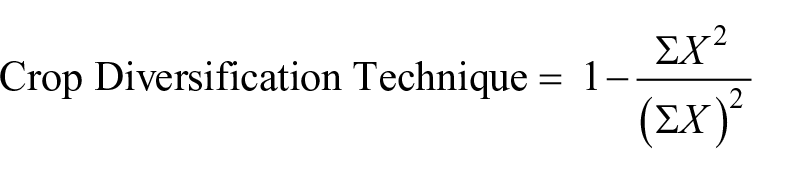
Here, X is the percentage of the total cropped area occupied by an individual crop at a point in time. The index value of this technique ranges from 0 to 1. It is directly related to the magnitude of diversification, that is, the higher the index value, the higher would be the diversity, and vice versa.
The study discusses changes in crop diversification under five independent land size classes. To compare the change in crop diversification index under different land size groups, the one-way analysis of variance (ANOVA) technique has been used. The ANOVA summary justifies whether the framed hypothesis is failed to accept or reject at a significant level.
Result and discussion
Marginal land size class
Figure 1 shows that the district average in diversification records a positive change in 2015–2016 in eight districts with the highest index in Darjeeling (0.754). This higher index is induced by horticulture and floriculture (Kumar et al., 2012). Contrary to this, Purulia (0.200) district stands at the bottom due to the cultivation of single or two cereal crops only. Although 10 districts are located at a lower diversification index than the state average, some districts like North 24 Parganas and others exhibit the same state average. With the same number of districts in 2015–2016, the least diversified district was East Midnapore (0.164) due to no addition of crops in major cropping systems like vegetables, fruits, oilseeds, and others. In the same year, Nadia district (0.795) arises as the most diversified district in the state. The overall change of index value of the state is although positive (0.057), it is not that much significant due to the least share from major districts. This positive gain is attributed from vegetables, fruits, oilseeds, and floriculture combined in overall diversification index.
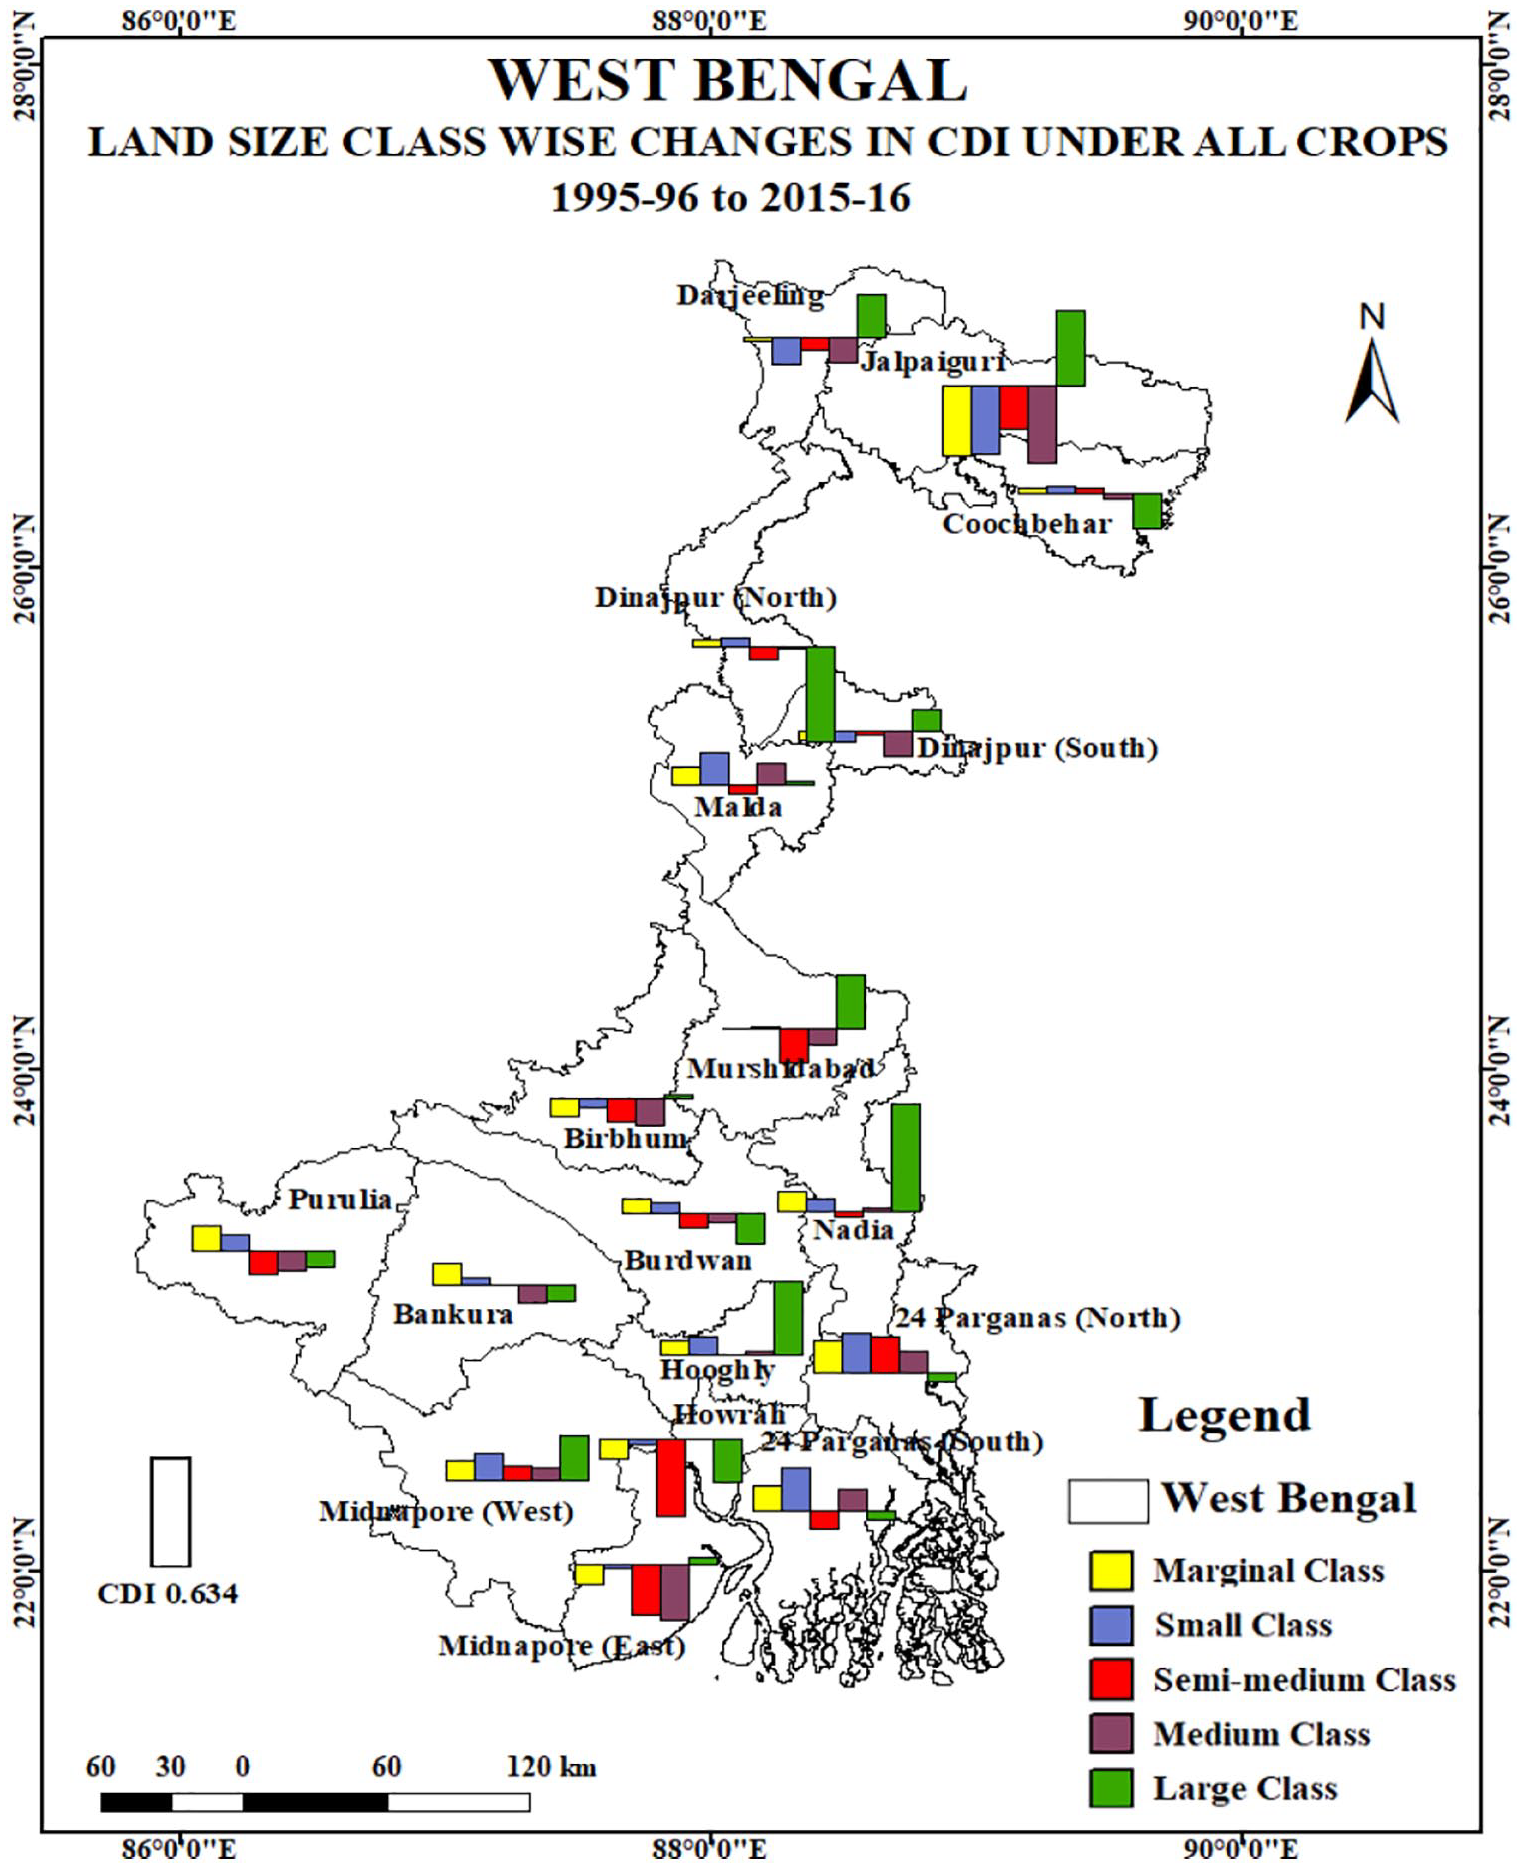
Land size class wise change in crop diversification index, 1995-96 to 2015-16.
Small land size class
Figure 1 reveals that in 1995–1996, a total of five districts recorded the diversification index more than the state average (0.524), among which Darjeeling (0.794) was at the top. On the other hand, the least index value is recorded in South 24 Parganas (0.192). The higher concentration of only a few major crops is the reason for such a lower index (Mithiya et al., 2018). In 2015–2016, the number of districts with a diversification index higher than the state average increased to eight, where Nadia (0.787) appeared out to be the most diversified district. Jalpaiguri district (0.238) posited the minimum index value in same year on account of single crop domination, that is paddy. The change of diversification index in the state as a whole is positive (0.063) and the same is substantiated by the shifting of cereals (paddy, wheat, maize, barley, and others) to horticultural crops such as vegetables, fruits, and others.
Semi-medium land size class
Under this class, the state has witnessed a negative growth (–0.060) from 1995–1996 to 2015–2016 (Figure 1). Eight districts stand above the state average of diversification index in each period. Darjeeling (0.795) posited the maximum index value at the district level, while South 24 Parganas (0.123) was located at the lowest position during 1995–1996 because farmers choose not to diversify their farms in favor of horticultural crops as it requires additional labor employment. In 2015–2016, the state’s lowest and highest diversification index is secured by East Midnapore (0.038) and Nadia (0.737) districts, respectively.
Medium land size class
Figure 1 represents that in 1995–1996, seven districts fall under the positive diversification index compared with the state average with the maximum index value in Nadia (0.736). The reason being this higher index is the proportionate distribution of the area under different crop categories. Conversely, South 24 Parganas (0.170) stays at last because of the prevailing monoculture of paddy. In 2015–2016, again Nadia (0.703) appears as the most progressive district in terms of diversification index. In the same year, Howrah (0.000) shows the complete crop specialization with rice due to the subtraction of area of vegetables, oilseeds, and fibers. Above all, the diversification index of the state has fallen (–0.133) as big farmers choose to cultivate their farms with cereal crops rather than diversify toward non-food crops (Birthal et al., 2015).
Large land size class
An exciting picture has been noticed under the large land size class category (Figure 1). North Dinajpur which was the most diversified district in 1995–1996 was placed at the bottom during 2015–2016. Over the years, land fragmentation reduced the area under this land class category, which further affected the diversification index. In 1995–1996, Darjeeling (0.025) displayed the lowest diversification index because of the cultivation of tea crop in the almost entire region. Nadia (0.711) turned out to be the maximum diversified district in 2015–2016. Altogether, the state indicates a surprising positive (0.321) increase in diversification index from 1995–1996 to 2015–2016. This significant increase is mainly caused by the introduction of other crops such as vegetables, fibers, and plantation crops in the existing paddy cultivation system.
All land size classes
It is clear from Figure 1 that as many as eight districts obtain higher index values than the state’s average in 1995–1996 as well as in 2015–2016. Darjeeling (0.792) ranked as the most diversified district in 1995–1996, while in 2015–2016, the top position was attained by Nadia (0.786). These higher index values resulted from switching of cropping patterns from cereal crops toward high-value crops such as vegetables, fruits, oilseeds, and spices. Purulia (0.201) witnessed the minimal index values in 1995–1996 and East Midnapore (0.185) in 2015–2016. Although the state managed to gain a slight increase (0.036) in diversification index over the past 20 years, it is inconsequential because the paddy crop still dominates the entire cropping system of the state.
Comparative analyses
From aforesaid analyses on crop diversification, it is clear that the amount and intensity of changes in cropping patterns across land size class categories are significantly different from one another. However, semi-medium and medium land groups posit negative change but the remaining other groups add positively to the crop diversification basket. Within positive groups, large land size class categories witness maximum change, and marginal land size categories witness the least. This change has been statistically measured through ANOVA.
It is seen in Table 1 that the significant change in crop diversification across land size class category (more than 95% confidence level with 2.29 F-critical value) is not the same. Hence, the proposed hypothesis fails to be accepted at a 0.5% significant level. It means each land size category exhibits a different amount of diversification at different paces and intensities over two decades.
ANOVA result.
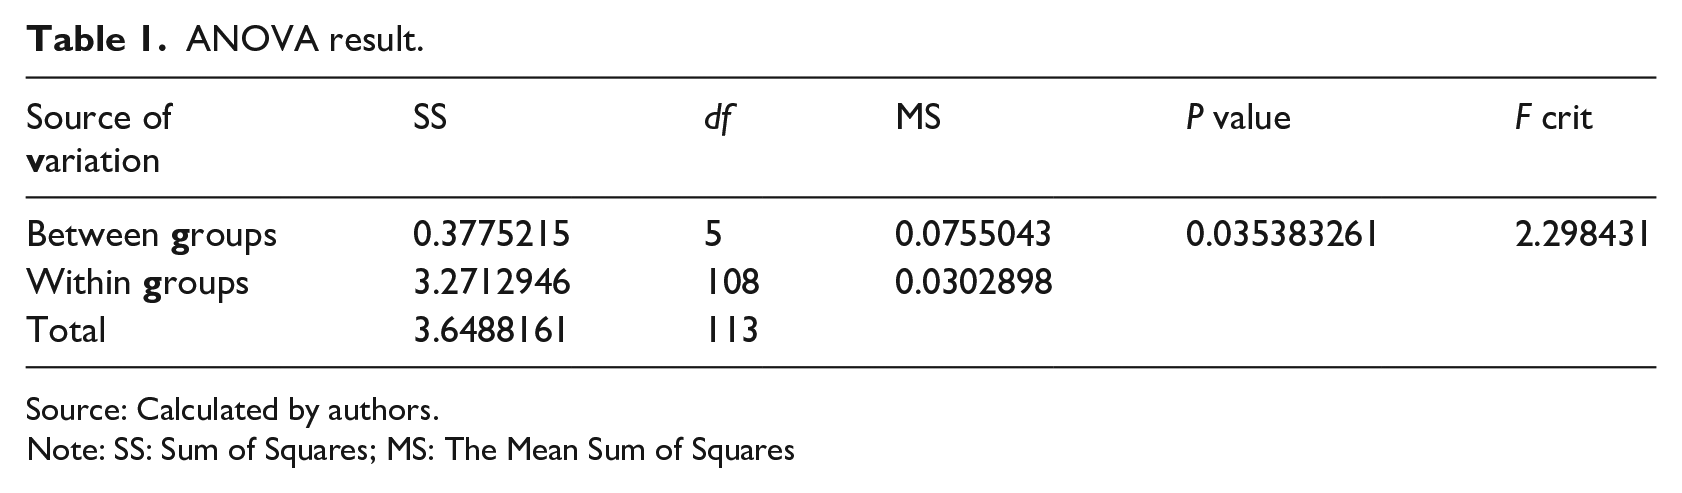
Source: Calculated by authors.
Note: SS: Sum of Squares; MS: The Mean Sum of Squares
Moving toward policy options
Overall analyses from two periods of data reveal that the stunting change in diversification is noted in marginal, small, large, and all land classes. The significant reasons for such change remain the same as the slow introduction of horticulture crops, oilseed, spices, and cash crops in existing cropping patterns. However, the amount of diversification at large land size class category posits higher due to agricultural innovation but the extent of such is significant under marginal land size class as this group shares more than 85% of total states cultivator. In such lights, small farmers have to play an important role as their share is next to marginal groups and combine both to 91%. The cause of such variable and visible growth in the diversification index remains similar but not the same as geographic conditions differ significantly across districts of the state. To boost up diversification across districts of West Bengal, no doubt more props such as window farming, vertical farming, precision agricultural practices, and others are needed to be introduced by different agencies. Apart from that stunted districts must be taken into consideration by respective district agencies to carry forward the diversification programs into rural areas.
Overall changes also represent another picture from semi-medium and medium land size classes. These noted groups represent a negative change in the index. The introduction of new crops would not be viable at present to those districts because infrastructure development is the most needed specially to develop irrigation infrastructure and increase farmer incentive on a timely basis as various policy outcomes already proved this (Schroth and Ruf, 2014). To manage existing obstacles in the study area, findings from different researches can be taken along the line of agricultural development measures, active and direct engagement of district administration, conduct capacity building programs, and other exercises in full spirit (Behera et al., 2007; Beillouin et al., 2019; Hitayezu et al., 2016; Immink and Alarcon, 1991; Kemboi et al., 2020; Maggio and Sitko, 2019, 2021). In developing countries like India, it is only possible if a dedicated diversification center comes up as an independent agency (Hazra, 2001; Rahaman & Singh 2020).
One of the serious concerns of diversification toward vegetables is that the seasonal farmers grow vegetable crops in their backyard, garden, and other small vacant places around their habitat to feed their households. This creates a hindrance for the professional marginal and small vegetable growers who grow vegetables for local market and thus pushing them backward. Besides, fruits and vegetables record the maximum amount of post-harvest losses among the crop commodities. In these circumstances, the government needs to examine the situation carefully by either creating facilities for them to export that production in the bigger market by improving the connectivity and storage infrastructure at the lower regional units or implementing schemes and programs relating to the benefits of crop groups other than vegetables so that they can eliminate their risk by shifting their diversification to other crop groups such as oilseed, pulses, and plantation crops. The immense pressure of population hampers the scope of converting more area for agriculture purposes. Therefore, the only option to increase agricultural productivity is through the vertical expansion of crops. The government needs to identify the main pockets of vegetable cultivation from various parts of the country and then set up processing industries in those zones to expand the diversification into the vertical level from which the marginal and small farmers will get benefit as this will not only reduce the post-harvest losses but also help to augment their income. To do so, the mere excuse of government is that it would create a lengthy and massive budget. In this situation, the government has to allow the involvement of private sectors. One serious backdrop of this is that privatization will lead to the exploitation of farmers. So, careful attention to that will be much needed. Hence, the government should allow the investment process in the hands of private sectors but in control, manage farms and price policy which should be inspected and checked up by public agencies. In the end, stunting growth in crop diversification is just a situation, not a permanent practice but its continuity is a hindrance in the way of farmers’ doubling income.
Footnotes
Appendix
Land size class–wise crop diversification index under all crops in West Bengal, 1995–1996 and 2015–2016.
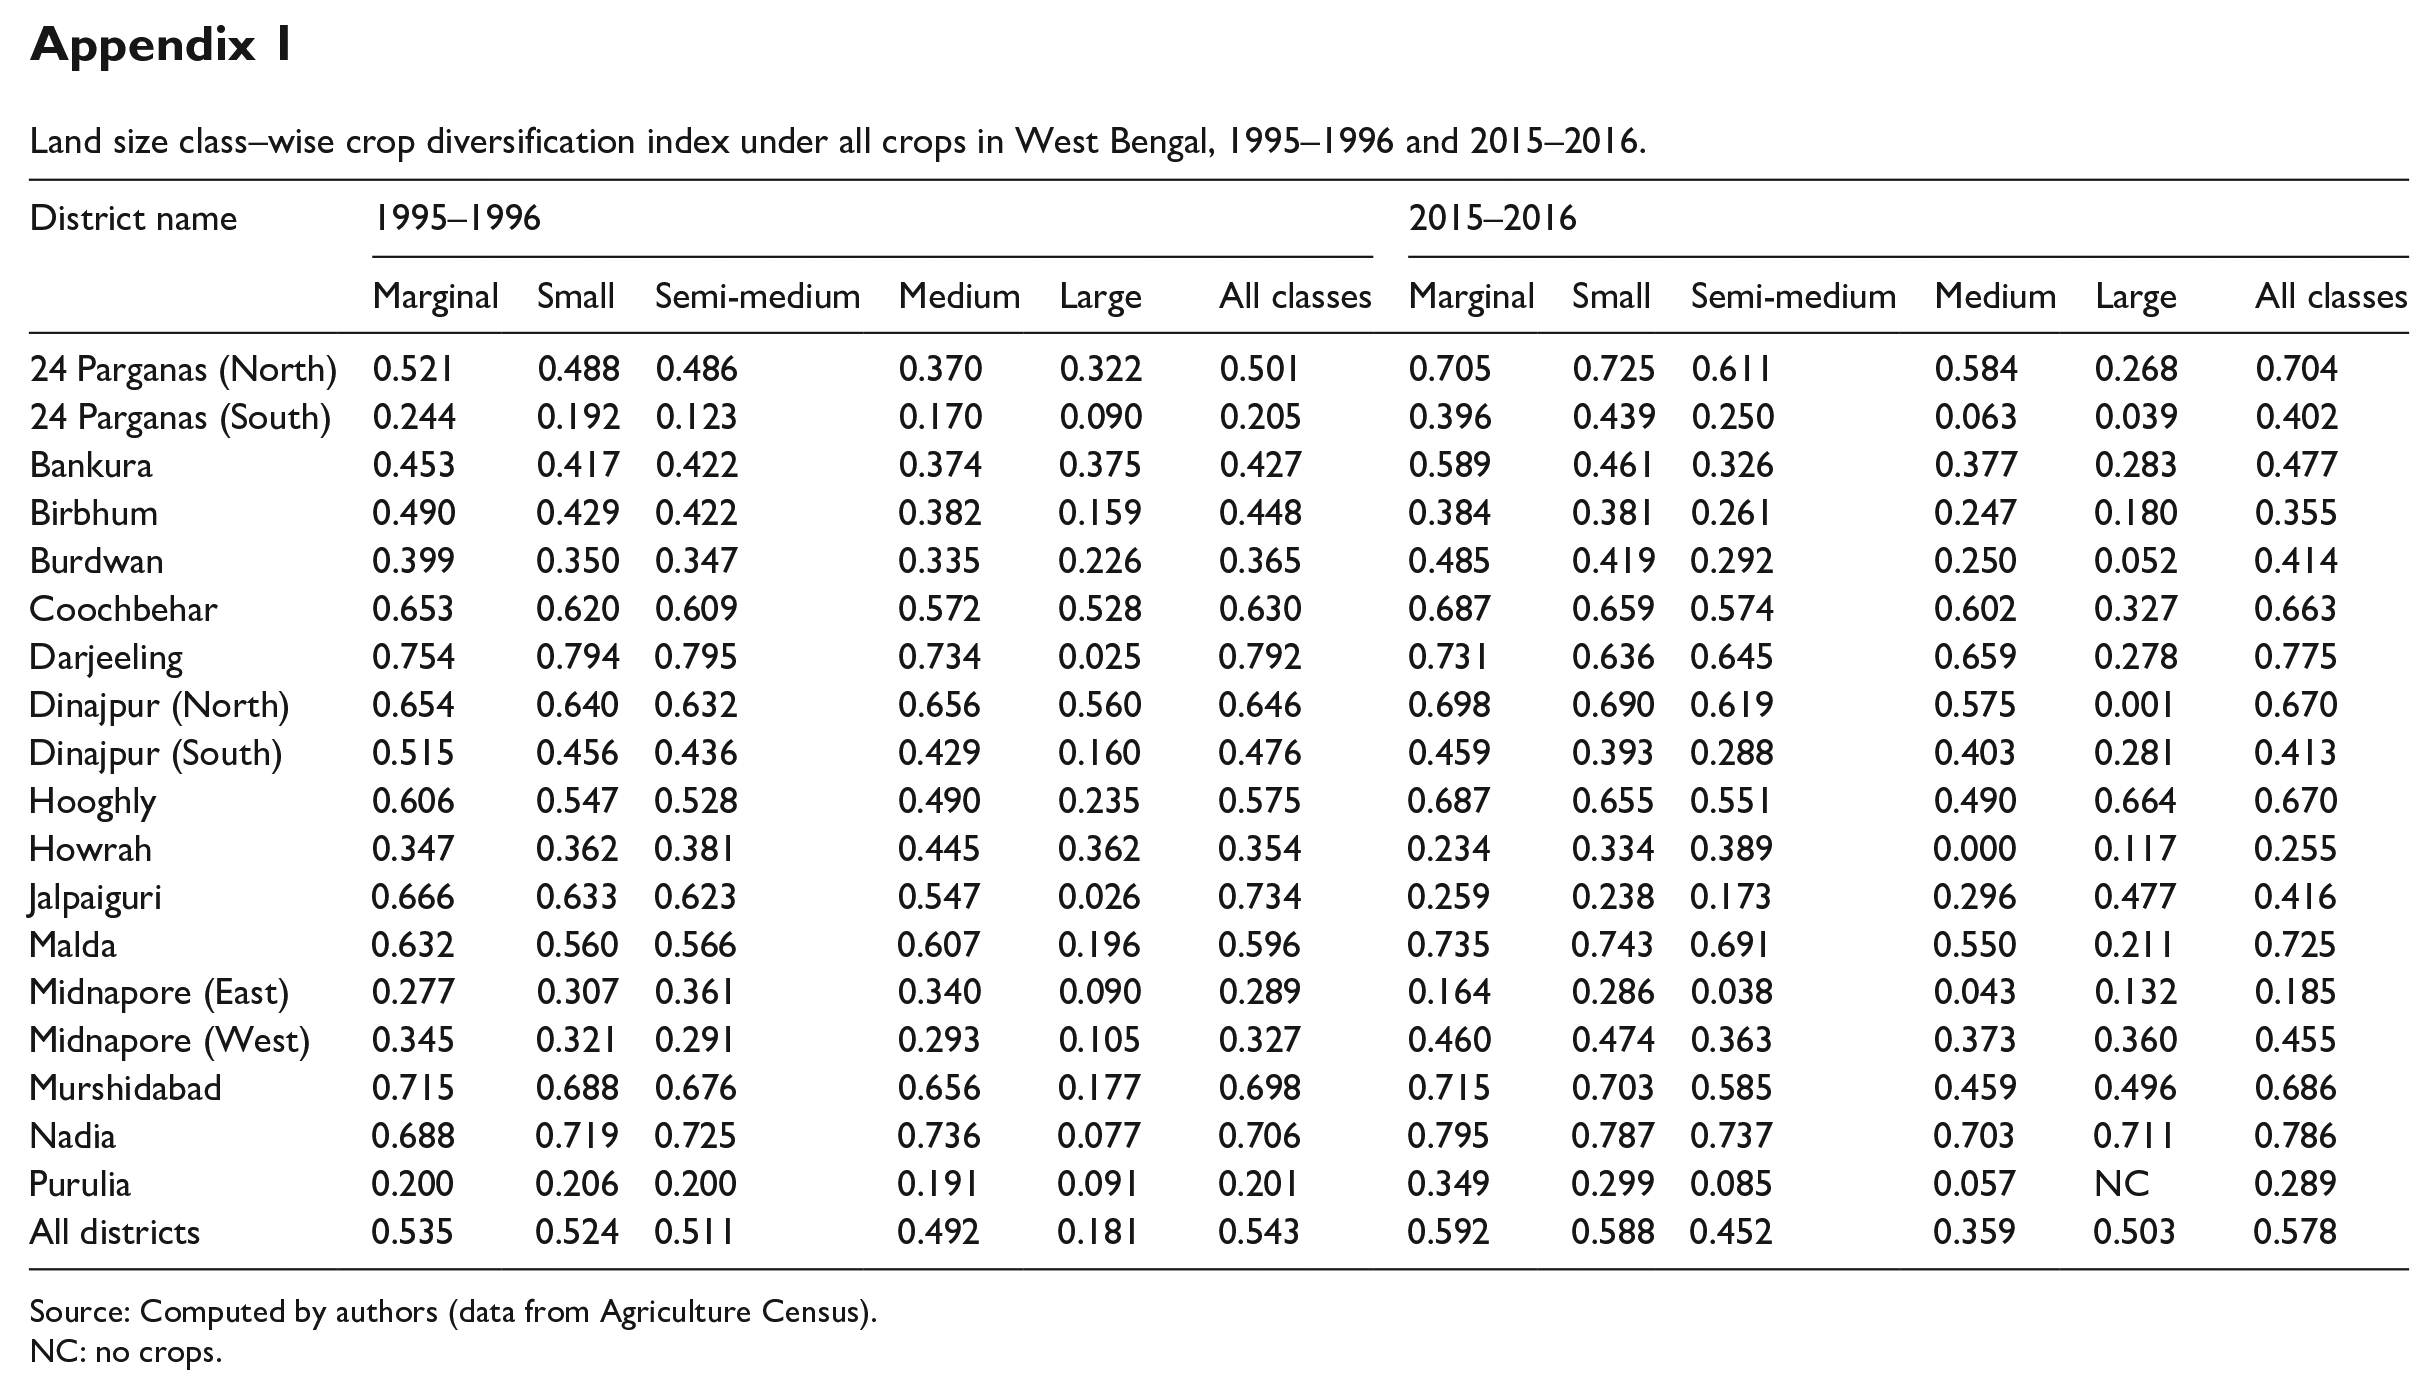
| District name | 1995–1996 | 2015–2016 | ||||||||||
|---|---|---|---|---|---|---|---|---|---|---|---|---|
| Marginal | Small | Semi-medium | Medium | Large | All classes | Marginal | Small | Semi-medium | Medium | Large | All classes | |
| 24 Parganas (North) | 0.521 | 0.488 | 0.486 | 0.370 | 0.322 | 0.501 | 0.705 | 0.725 | 0.611 | 0.584 | 0.268 | 0.704 |
| 24 Parganas (South) | 0.244 | 0.192 | 0.123 | 0.170 | 0.090 | 0.205 | 0.396 | 0.439 | 0.250 | 0.063 | 0.039 | 0.402 |
| Bankura | 0.453 | 0.417 | 0.422 | 0.374 | 0.375 | 0.427 | 0.589 | 0.461 | 0.326 | 0.377 | 0.283 | 0.477 |
| Birbhum | 0.490 | 0.429 | 0.422 | 0.382 | 0.159 | 0.448 | 0.384 | 0.381 | 0.261 | 0.247 | 0.180 | 0.355 |
| Burdwan | 0.399 | 0.350 | 0.347 | 0.335 | 0.226 | 0.365 | 0.485 | 0.419 | 0.292 | 0.250 | 0.052 | 0.414 |
| Coochbehar | 0.653 | 0.620 | 0.609 | 0.572 | 0.528 | 0.630 | 0.687 | 0.659 | 0.574 | 0.602 | 0.327 | 0.663 |
| Darjeeling | 0.754 | 0.794 | 0.795 | 0.734 | 0.025 | 0.792 | 0.731 | 0.636 | 0.645 | 0.659 | 0.278 | 0.775 |
| Dinajpur (North) | 0.654 | 0.640 | 0.632 | 0.656 | 0.560 | 0.646 | 0.698 | 0.690 | 0.619 | 0.575 | 0.001 | 0.670 |
| Dinajpur (South) | 0.515 | 0.456 | 0.436 | 0.429 | 0.160 | 0.476 | 0.459 | 0.393 | 0.288 | 0.403 | 0.281 | 0.413 |
| Hooghly | 0.606 | 0.547 | 0.528 | 0.490 | 0.235 | 0.575 | 0.687 | 0.655 | 0.551 | 0.490 | 0.664 | 0.670 |
| Howrah | 0.347 | 0.362 | 0.381 | 0.445 | 0.362 | 0.354 | 0.234 | 0.334 | 0.389 | 0.000 | 0.117 | 0.255 |
| Jalpaiguri | 0.666 | 0.633 | 0.623 | 0.547 | 0.026 | 0.734 | 0.259 | 0.238 | 0.173 | 0.296 | 0.477 | 0.416 |
| Malda | 0.632 | 0.560 | 0.566 | 0.607 | 0.196 | 0.596 | 0.735 | 0.743 | 0.691 | 0.550 | 0.211 | 0.725 |
| Midnapore (East) | 0.277 | 0.307 | 0.361 | 0.340 | 0.090 | 0.289 | 0.164 | 0.286 | 0.038 | 0.043 | 0.132 | 0.185 |
| Midnapore (West) | 0.345 | 0.321 | 0.291 | 0.293 | 0.105 | 0.327 | 0.460 | 0.474 | 0.363 | 0.373 | 0.360 | 0.455 |
| Murshidabad | 0.715 | 0.688 | 0.676 | 0.656 | 0.177 | 0.698 | 0.715 | 0.703 | 0.585 | 0.459 | 0.496 | 0.686 |
| Nadia | 0.688 | 0.719 | 0.725 | 0.736 | 0.077 | 0.706 | 0.795 | 0.787 | 0.737 | 0.703 | 0.711 | 0.786 |
| Purulia | 0.200 | 0.206 | 0.200 | 0.191 | 0.091 | 0.201 | 0.349 | 0.299 | 0.085 | 0.057 | NC | 0.289 |
| All districts | 0.535 | 0.524 | 0.511 | 0.492 | 0.181 | 0.543 | 0.592 | 0.588 | 0.452 | 0.359 | 0.503 | 0.578 |
Source: Computed by authors (data from Agriculture Census).
NC: no crops.
Acknowledgements
Both the authors acknowledge the contribution and help in the form of research support to the Department of Geography, Aligarh Muslim University (A.M.U), Aligarh, Uttar Pradesh, India.
Declaration of conflicting interests
The author(s) declared no potential conflicts of interest with respect to the research, authorship, and/or publication of this article.
Funding
The authors disclosed receipt of the following financial support for the research, authorship and/or publication of this article: The author acknowledge the contribution and help in the form of research support from the Department of Geography, Aligarh Muslim University (A.M.U), Aligarh, Uttar Pradesh, India