
Abstract
This study investigates the influence of service, financial and political characteristics on municipalities’ choices of four service delivery modes in the Dutch local government setting, thereby making a distinction between services in the physical and in the operational domain. It shows that, overall, use of inter-municipal cooperation and, to a lesser extent, municipality-owned firms increased substantially from 2010 to 2018. For use of private firms, we find remarkable differences. Whereas this use increased for the physical domain, it decreased for the operational domain. For both domains, we find that in-house production decreased substantially. We also find that the influence of especially transaction cost characteristics on the likelihood that municipalities choose a certain institutional form differs between 2010 and 2018, as well as between the physical and the operational domain.
Points for practitioners
Our finding that the use of in-house production decreased substantially from 2010 to 2018 suggests that municipalities are looking for mixed institutional forms, such as inter-municipal cooperation, to realize economies of scale. We observe that service delivery modes are especially driven by service characteristics, thereby stressing the importance of transaction cost motives in decisions about service delivery modes. However, our study also shows that financial and political characteristics have some influence. As the effects of the latter are not stable, we show that the way to implement reforms may vary over time and across domains.
Introduction 1
A large and growing body of research examines municipalities’ choices of service delivery modes, that is, what institutional forms municipalities use to produce and deliver their services. Largely, this research mainly focuses on services, such as garbage collection, for which data are widely publicly available. Also, most research is cross-sectional in nature (i.e. studying how choices of service delivery modes are related to service and/or municipal characteristics at some point in time), though there are also some longitudinal studies that focus on changes in these choices over time (see Bel and Fageda, 2017).
Furthermore, this literature has focused primarily on the classic ‘make or buy’ choice. In this regard, studies have sought to examine the outcomes of these choices, focusing their attention especially on whether public or private production results in lower delivery costs (e.g. Bel et al., 2010). The outcomes of the privatization of local services have been mixed given that contracting services out to private parties has not always produced the results expected by its promoters. Potential explanatory factors for this mixed record include the variable transaction costs incurred in the management of direct and privatized service delivery (Brown and Potoski, 2005) and the non-competitive and concentrated nature of local service markets (Bel and Costas, 2006; Dijkgraaf and Gradus, 2007).
In addition to these strictly public and private dimensions, other notable institutional forms exist, including inter-municipal cooperation and municipality-owned firms. Several European countries show a trend towards corporatization or more use of municipality-owned firms (for recent overviews, see Tavares, 2017; Voorn et al., 2017). While privatization was mainly based on the benefits of competition, inter-municipal cooperation reflects the importance of collaboration to achieve economies of scale and reduce externalities. Based on 1998–2005 data, Dijkgraaf and Gradus (2008) found some evidence that contracting out or privatizing Dutch waste collection leads to lower costs, though Dijkgraaf and Gradus (2013) showed that cooperation between municipalities can also be an efficient delivery mode. This is in line with a meta-regression by Bel et al. (2010), which suggests that cost savings from privatizing solid waste collection erode after 2000. In a review of 37 empirical studies on contracting out local services between 2000 and 2014, Petersen et al. (2018) show that, on average, the cost difference between private and public production decreased from 8.5% in 2000–2004 to 0.4% in 2010–2014. They also find that, in their sample, the cost savings for contracting out technical services, such as garbage collection and parking management, are 6%, whereas for social services, such as healthcare and schools, these are 0%.
Whereas many municipal services were privatized from the 1980s onwards, there are indications of opposite developments. For US local government, Hefetz and Warner (2004) found that, in 1997, 18% of the services were contracted out over the previous five years, and 11% had been contracted back in. Five years later, the same authors (Hefetz and Warner, 2007) observed that contracting back in became more popular (18%) than contracting out (12%). In a recent study, Warner and Aldag (forthcoming) found that 14% of the US local governments contracted services back in over the period 2012–2015. A similar trend can be observed in Europe: Gradus and Budding (2020) found that 38% of the changes in the modes of garbage collection in the period 1999–2010 were insourcing. This percentage increased to 44% for the period 2011–2014, so contracting in and out are more equal. Analysing the same service in Germany, Demuth et al. (2018) even found a percentage of 93% towards in-house services. Based on a review of both quantitative and qualitative studies, Clifton et al. (forthcoming) conclude that re-munipalization is part of a broader set of re-privatization options and mostly a pragmatic choice.
There are also indications for reverse privatization of services besides garbage collection in the Netherlands. Gradus et al. (forthcoming) analysed shifts in the delivery mode of 12 municipal services between 2010 and 2018 for 20 municipalities. They found that inter-municipal cooperation increased from 8% in 2010 to 24% in 2018 and use of municipality-owned firms from 8% in 2010 to 13% in 2018. In contrast, in-house production and use of private firms declined. Interestingly, in the physical domain, with services such as maintenance of roads and green spaces, there was a large decrease of in-house production and increase of inter-municipal cooperation, as well as a modest increase of use of municipality-owned and private firms. In the operational domain, with services such as information and communication technology (ICT) and cleaning, there was a large increase of inter-municipal cooperation and decrease of use of private firms between 2010 and 2018. This is interesting as the early literature indicates that cleaning services contracts suggest cost savings of about 20% without sacrificing the quality of service provided (e.g. Christoffersen et al., 2007; Domberger et al., 1995). However, based on more recent data, Elkomy et al. (2019) point out that quality is recently reducing due to the contracting out of hospital cleaning services.
The purpose of this article is to extend the empirical analysis on explaining the delivery mode of services other than garbage collection in the Netherlands and to explore its drivers. Following Schoute et al. (2018), we analyse the influence of service, financial and political characteristics 2 on municipalities’ choices of service delivery modes for 11 municipal services. Whereas Schoute et al. (2018) only use data for 2010, this article also takes data for 2018 into account. This enables us to analyse effects over time, thereby making explicit the differences between both years. Furthermore, we explore differences between two domains (the physical domain and the operational domain) in this study. We discuss these differences as well as (possible) explanations. In doing so, this article aims to contribute to the literature on the drivers of service delivery mode choices, more specifically, insourcing and outsourcing decisions, by including both the time dimension and differences between domains.
The remainder of this article is structured as follows. First, the second section describes the changes in municipal service management over time. This is followed by the third section about the drivers of service delivery modes. The results are presented and discussed in the fourth section. Finally, the fifth section offers some concluding remarks and topics for future research.
Changes in municipal service management
We collected our data on municipalities’ choices of service delivery modes from two surveys. 3 First, in 2010, we surveyed all 430 Dutch municipalities except the four largest (cf. Groot and Budding, 2004), and obtained 86 usable responses (20.2%). Second, in 2018, we surveyed all 380 Dutch municipalities, and obtained 113 usable responses (29.7%). The municipalities that responded to each of the two surveys are representative of all Dutch municipalities. 4 In principle, we could have had 2178 observations (198 municipalities multiplied by 11 services); however, due to missing values, we actually have 1964 observations as some municipalities do not have certain services (in particular, catering, cafeteria and parking management). We distinguish between four service delivery modes (cf. Schoute et al., 2018): in-house production, inter-municipal cooperation, municipality-owned firm and private firm. From a legal perspective, in-house production and inter-municipal cooperation are subject to public law, whereas municipality-owned and private firms are subject to private law. Municipality-owned firms thus operate under Dutch private law, while their shares are owned by municipalities.
Changes in patterns of service delivery modes
Our data set makes it possible to examine changes in patterns of service delivery modes over time. As shown in Table 1 (available at: https://journals.sagepub.com/doi/suppl/10.1177/0020852320968906), overall, inter-municipal cooperation (and, to a lesser extent, use of municipality-owned firms) increased significantly between 2010 and 2018, whereas in-house production and use of private firms declined. More specifically, in-house production decreased from 61.9% in 2010 to 44.2% in 2018, whereas use of private firms decreased from 26.2% to 21.7%. In contrast, inter-municipal cooperation and use of municipality-owned firms increased from, respectively, 5.4% and 6.5% in 2010 to 21.0% and 13.2% in 2018. These changes are in line with Gradus et al. (forthcoming), who analysed shifts in the delivery mode of 12 municipal services between 2010 and 2018 for 20 Dutch municipalities.
In the Netherlands, local government is considered the most important and visible level of sub-national government. It has a relatively autonomous position and can initiate local policies that it considers important for the local community. In 2018, municipalities had a budget of about 7% of gross domestic product (GDP) and 20% of government spending (Gradus et al., forthcoming). The services of Dutch local government can be divided into several domains. Besides the social domain (which we exclude due to lack of data for 2010), the physical domain, with services such as the maintenance of roads/green spaces and garbage collection, is important.
Furthermore, municipalities have considerable autonomy concerning how they organize the back office of their local service provision. When analysing the changes in patterns of service delivery modes, we therefore distinguish between services from the physical and the operational (i.e. administrative and supportive) domain. Interestingly, there are some differences between these domains (see Figure 1). In both domains, consistent with the overall changes, in-house production decreased between 2010 and 2018, whereas inter-municipal cooperation and use of municipality-owned firms increased (it should be noted, however, that inter-municipal cooperation increased much more in the operational domain). However, whereas use of private firms increased slightly in the physical domain, it decreased substantially in the operational domain. Figure 1 shows the changes in service delivery modes between 2010 and 2018, for all services combined and separately for the physical and the operational domain.
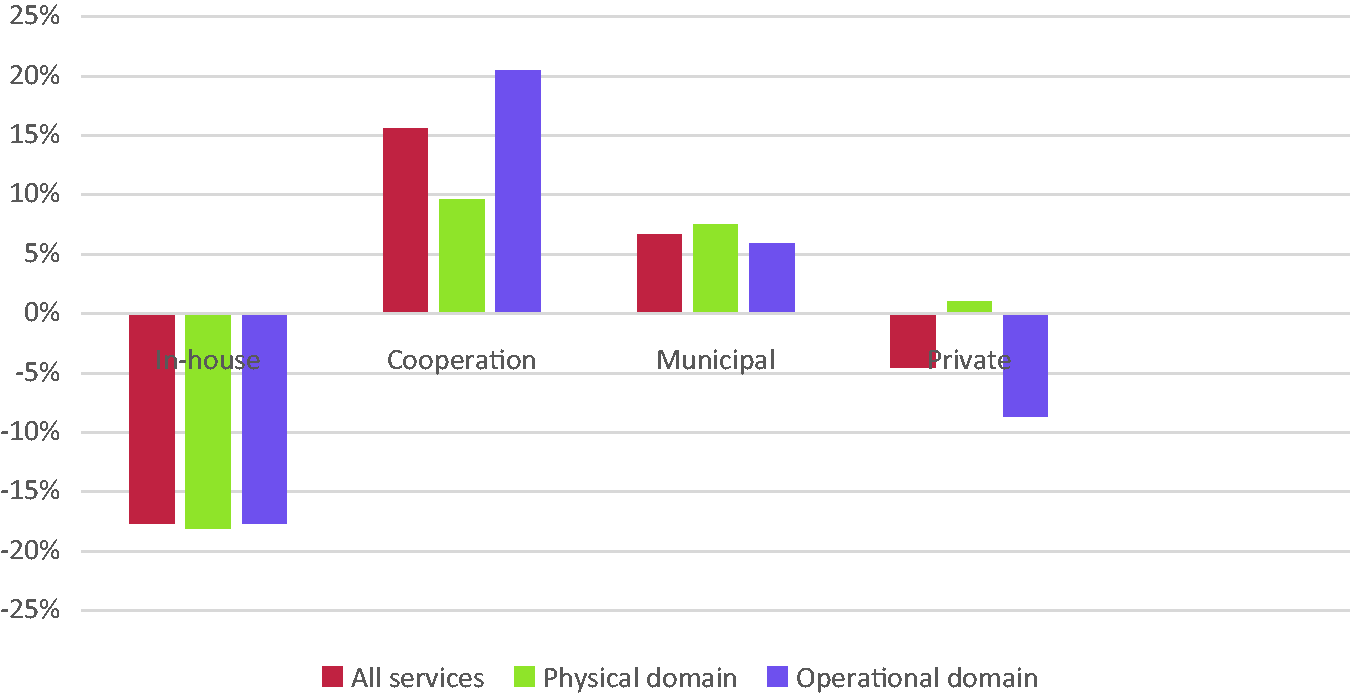
Changes in patterns of service delivery modes between 2010 and 2018, per domain.
When we look at the changes for the 11 services separately, we see that for most services, the pattern in 2010 is different from 2018. For parking management, catering and cafeteria, there is no significant difference (based on Chi-square tests). Cafeteria is the only service where in-house production increased. For all services, inter-municipal cooperation has become more important but there are large differences between the services. Remarkably, for asset valuation, the difference is almost 38%, suggesting the existence of large-scale effects that have become more important over time (cf. Niaounakis and Blank, 2017). There is also a large increase in inter-municipal cooperation for ICT. The pattern for the physical domain is caused by the increased use of private firms for three of these services, namely, maintenance of roads, sports facilities and parking management. For parking management, there are some indications that privatization lowers costs (Blom-Hansen, 2003). Moreover, as they are more capital-intensive, these services have relatively long-term contracts and are therefore more difficult to re-privatize. In contrast, for cleaning, there is a large decrease in use of private firms. The literature for the UK suggests a connection between lower quality and cost savings of contracted-out cleaning services, and highlights the poor working conditions provided by private contractors (Elkomy et al., 2019). The European Public Service Union (EPSU, 2012) also suggests that cleaning contracts mature between five and seven years, and there are relatively more opportunities to re-privatize. 5
Drivers of service delivery modes
In this section, we describe how we have measured the service, financial and political characteristics, as well as the control variables, in our study, and present some descriptive statistics.
Service characteristics
Similar to, for example, Brown and Potoski (2005), we are interested in two service characteristics: asset specificity and measurement difficulty. From December 2013 to January 2014, we surveyed an expert panel of 30 municipal financial managers. 6 We provided these managers with an extensive definition of the two characteristics, which we based on those used by Brown and Potoski (2005), and asked them to rate each of the 11 services on a five-point Likert scale for both asset specificity (1 = very low; 5 = very high) and measurement difficulty (1 = very easy; 5 = very difficult). We obtained 24 usable responses (80.0%). In December 2018, we repeated this survey and obtained 12 usable responses (40.0%). Table 1 (available at: https://journals.sagepub.com/doi/suppl/10.1177/0020852320968906) reports the (weighted) average service characteristic ratings for each service. Overall, there is considerable dispersion on the average service characteristic ratings among the 11 services. For asset specificity, the scores vary between 1.47 (for cleaning) and 4.17 (for garbage collection), whereas for measurement difficulty, the scores vary between 1.57 (for cafeteria) and 3.05 (for ICT). Similar to Schoute et al. (2018), we expect that services involving (1) more asset specificity and (2) more measurement difficulty are less likely to be contracted out to a private or a municipality-owned firm.
Financial characteristics
We measure the financial position of the municipalities by taking the average of the Z-score of three indicators: (1) the inverse of the solvency ratio (unreserved fund balance scaled by total assets); (2) the net debt ratio (i.e. level of debt as opposed to their own financial resources); and (3) the net debt ratio corrected for outstanding loans. These indicators are part of a package of six indicators that municipalities were obliged to publish in both their budgets and annual reports from 2017 onwards and that are meant to increase the possibilities for benchmarking these entities. We selected those indicators for which we were able to calculate both the 2010 and 2017 figures. Similar to Schoute et al. (2018), we expect that services of municipalities that have a better financial position are less likely to be contracted out to a private firm.
Political characteristics
As political characteristics, we focus on the ideological (left–right) orientation of the municipal council of the municipalities, and on their fragmentation. Data about the number of seats in 2010 were collected from the ‘Gids Gemeentebesturen’ (‘Guide Municipal Boards’) in 2012, and those about the number of seats in 2018 from the ANP (the Dutch Press Agency). To measure the ideological (left–right) orientation of the municipalities’ municipal councils, we used the 2010 and 2017 (for 2018) Chapel Hill Expert Survey (CHES) data set (available at: www.chesdata.eu), which provided us with ratings on a scale concerning general party positioning, ranging from ‘extreme left’ to ‘extreme right’, for all Dutch national political parties. For each municipality, we calculated the left–right orientation of the municipal council by weighting the proportion of seats from the different political parties that are part of the municipal council by these Chapel Hill ratings. Council members from so-called independent local parties were excluded from the calculations because they were not rated on this left–right scale. We use the Laakso-Taagepera index (i.e. the inverse of the Herfindahl index of the size of political parties) (cf. Gradus and Dijkgraaf, 2019), which can be interpreted as the relative size of parties, to measure the fragmentation of the municipalities’ municipal council. Similar to Schoute et al. (2018), we expect that services of municipalities of which the municipal council has a more right-wing political orientation are more likely to be contracted out to a private firm. Given mixed results in prior studies for fragmentation (e.g. Gradus and Budding, 2020; Warner and Hefetz, 2002), we are unable to specify a sign for our expectation concerning political fragmentation.
Control variables
When estimating our model, we control for the following socio-economic characteristics: number of inhabitants, population density, number of people with unemployment benefits (per 1000 inhabitants) and average income per household (cf. Schoute et al., 2018). The data for these variables were obtained from Statistics Netherlands. For the number of inhabitants and population density, we calculated the natural log in order to improve their distribution.
Descriptive statistics
Table 2 (available at: https://journals.sagepub.com/doi/suppl/10.1177/0020852320968906) shows the descriptive statistics for the independent variables, both in total and per institutional form, where we present the average scores for 2010 and 2018 combined, as well as for both years separately. As observed in Table 2, the average scores for asset specificity and measurement difficulty are almost the same in both years. The average score for asset specificity is 2.52, which indicates that this variable scores between ‘low’ and ‘average’. As the score for measurement difficulty is somewhat lower (2.17), this implicates that the average score for this variable is just above ‘easy’.
It should be noted that the financial position is an inverse composite variable of three underlying indexes. As the average score declined from 0.09 in 2010 to –0.01 in 2018, this indicates that the average financial position of the municipalities in our sample was stronger in 2018. For the political variables left–right orientation and fragmentation of the municipal council, we observe that the average municipal council in a Dutch municipality became more right-wing and more fragmented between 2010 and 2018. Especially due to municipal mergers, the number of inhabitants and population density are somewhat higher in 2018 than in 2010. We observe that the number of people with unemployment benefits increased rather substantially between 2010 and 2018. Also, the average income per household increased. It should be noted that the unconditional means per institutional form show no clear pattern, in that all forms score highest on at least one variable and lowest on another. In addition, for all but three of these variables, both the ANOVA and Welch test show that the differences in unconditional mean scores among the four institutional forms are significant.
Model estimation results
We analyse the relationships between the service, financial and political characteristics and municipalities’ choices of the four service delivery modes by estimating a multinomial logit model (MNLM), with standard errors clustered by municipality (cf. Schoute et al., 2018). As they are relatively easy to interpret, the estimates of the marginal effects for the overall model (with all services included), the physical domain model and the operational domain model are presented in Table 3 (available at: https://journals.sagepub.com/doi/suppl/10.1177/0020852320968906). 7
Service characteristics
Based on the argument that if the asset specificity of services is high, it is more difficult to use those assets for other services (cf. Brown and Potoski, 2005), we expect that services involving more asset specificity are less likely to be contracted out to a private or municipality-owned firm. The marginal effects for the overall model only support these expectations for private firms in 2010. The effect for municipality-owned firms is contrary to our expectations but could be explained by the relatively close relationship between such firms and their municipality owners (cf. Schoute et al., 2018). The effects also indicate that an increase in asset specificity decreases the probability of in-house production and increases the probability of inter-municipal cooperation. However, while we observe clear differences between the two domains, within the domains the effects are quite similar for the two years. In the physical domain, asset specificity increases the probability of inter-municipal cooperation and using municipality-owned firms, and decreases the probability of in-house production. In contrast, in the operational domain, asset specificity increases the probability of in-house production and decreases the probability of the other three institutional forms, though the effect for municipality-owned firms is not significant in 2010. Overall, in the physical domain, asset specificity seems to be dealt with by collaboration (inter-municipal cooperation or municipality-owned firms) thereby realizing economies of scale, whereas in the operational domain, it is handled by in-house production.
Based on the argument that if it is more difficult to measure the outcomes achieved and the activities performed, it is more difficult to assess the performance of an external provider (cf. Brown and Potoski, 2005), we expect that services involving more measurement difficulty are less likely to be contracted out to a private or municipality-owned firm. The marginal effects for the overall model support these expectations. In addition, these effects also indicate that an increase in measurement difficulty increases the probability of in-house production, as well as the probability of inter-municipal cooperation in 2018. However, we observe clear differences between the two domains and within the domains also between the two years. In the physical domain, measurement difficulty increases the probability of in-house production in both years; however, while it decreases the probability of using a private firm in 2010, it decreases the probability of inter-municipal cooperation in 2018. In contrast, in the operational domain, measurement difficulty increases the probability of inter-municipal cooperation and decreases the probability of using a private firm in both years; however, while it decreases the probability of using a municipality-owned firm in 2010, it decreases the probability of in-house production in 2018.
Financial characteristics
We find no support for our expectation that services of municipalities that have a better financial position are less likely to be contracted out to a private firm. In fact, overall, financial position has surprisingly little influence in 2010 and only some in 2018. The marginal effects for the overall model indicate that an increase in financial position (which actually means that a municipality has more debt and thus a weaker financial position) decreases the probability of inter-municipal cooperation in 2010, whereas it increases this probability (and decreases the probability of in-house production) in 2018. Consistent with the overall model, an increase in financial position (i.e. having more debt) increases the probability of inter-municipal cooperation in both domains in 2018; however, whereas it decreases the probability of using private firms in the physical domain, it decreases the probability of in-house production in the operational domain. These results may partly be due to that fact that the average financial position of the municipalities in our sample was stronger in 2018 than in 2010.
Political characteristics
In earlier studies in the Dutch context, some indications have been found that left-wing parties prefer in-house production and inter-municipal cooperation, whereas right-wing parties have a preference for private firms (Gradus and Budding, 2020; Schoute et al., 2018). In the overall model, though only in 2018, we do indeed find that if a municipal council is more left-wing, the probability of in-house production increases. For the operational domain, and in the same year, we observe the same finding. For the physical domain, though for 2018 only, we find that if a municipal council is more left-wing, the probability increases that the municipality performs services in a municipality-owned firm. For 2010, and only for the physical domain, we observe that if a municipal council is more left-wing, the probability increases that inter-municipal cooperation is used, whereas the probability decreases that a private firm is used. For the operational domain, we do not find any statistically significant results for 2010. Overall, some weak evidence is found for an influence of political characteristics, which is mainly in line with previous studies.
Largely, there are some indications that political fragmentation decreases the ability to outsource. In the overall model for 2010, the marginal effect for in-house production indicates that more fragmentation decreases the probability of inter-municipal cooperation and increases the probability of using in-house production. For the physical domain, we also find the latter result. Furthermore, we observe for this domain that more fragmentation decreases the probability of using a municipality-owned firm. For 2018, we find that more fragmentation decreases the probability of using a municipality-owned firm in our overall model, as well as for the operational domain. We do not find this, however, for the physical domain. In sum, our results are more in line with Warner and Hefetz (2002) than with Gradus and Budding (2020).
Conclusions
This study investigates the influence of service, political and financial characteristics on municipalities’ choices of four service delivery modes (in-house, inter-municipal cooperation, municipality-owned firm and private firm), both over time and across domains. Based on data for 2010 and 2018, we find that inter-municipal cooperation (and, to a lesser extent, use of municipality-owned firms) increased significantly between these years, whereas in-house production and use of private firms declined. In line with Schoute et al. (2018), our analysis suggests that municipalities’ choices of service delivery modes are especially driven by service characteristics. For both years and domains, we find significant results for our asset specificity and measurement difficulty variables. However, whereas we observe that the influence of these variables is generally the same for both years in the overall model, we notice some remarkable differences between the two investigated domains. More specifically, we find that the results for the physical domain are mainly in line with the overall model, whereas we find some contradictory results for the operational domain.
For financial characteristics, we do not find many significant results and those we do find are only weak and generally not consistent over time and across domains. However, interestingly, we find that when a municipality has more debt, this decreased the probability that a municipality used inter-municipal cooperation in 2010, whereas it increased this probability in 2018. This indicates that the financial position of municipalities plays a role in their service delivery mode choices. Overall, the financial position of Dutch municipalities was considered problematic in 2010 due to the global economic crisis, whereas it was much better in 2018.
For the political characteristics, we especially find some interesting results for political fragmentation. In line with Warner and Hefetz (2002), we find some indications that political fragmentation decreases the ability to outsource to especially a municipality-owned firm. However, whereas we notice this effect in 2010 for the physical domain, in 2018, it is the operational domain in which we observe this finding. For left–right orientation, we do not find many results, though we observe some evidence that left-wing parties seem to prefer inter-municipal cooperation above other institutional forms and also have a preference for in-house production, which is consistent with Gradus and Budding (2020).
There are some limitations and thereby also some avenues for future research that we would like to mention. First, we did not explore all possible drivers of service delivery modes. For example, we did not analyse the influence of proximity of other municipalities, which may enhance the likelihood of finding municipalities to partner with. Second, more attention should be paid to the social domain. In the Netherlands, municipalities spend a considerable amount of their financial means on this domain nowadays, especially as a result of a large-scale decentralization of three governmental tasks in 2015. However, as this study uses data from 2010 and 2018, it was not possible to include this domain in this article. Third, although our analyses show that the municipalities that responded to the two surveys are representative for all Dutch municipalities in 2010 and 2018, given that the municipalities that responded to both surveys only partly overlap and due to municipal mergers, the two independent samples may not be fully comparable. Finally, as there are indications that it is not just the service, financial and political characteristics of municipalities that play a role in service delivery mode choices, but also the characteristics of key actors in the decision-making process (e.g. Albalate and Bel, forthcoming), we suggest that more attention should be paid to these actors and their characteristics in future studies.
Supplemental Material
sj-pdf-1-ras-10.1177_0020852320968906 - Supplemental material for Drivers of service delivery modes in Dutch local government: an analysis over time and across domains
Supplemental material for this article is available online at https://journals.sagepub.com/ doi/suppl/10.1177/0020852320968906.
Footnotes
Declaration of conflicting interests
The author(s) declared no potential conflicts of interest with respect to the research, authorship, and/or publication of this article.
Funding
The author(s) received no financial support for the research, authorship, and/or publication of this article.
Notes
![]()
![]()
![]()
References
Supplementary Material
Please find the following supplemental material available below.
For Open Access articles published under a Creative Commons License, all supplemental material carries the same license as the article it is associated with.
For non-Open Access articles published, all supplemental material carries a non-exclusive license, and permission requests for re-use of supplemental material or any part of supplemental material shall be sent directly to the copyright owner as specified in the copyright notice associated with the article.