
Abstract
Background:
The aim of this study was to compare the prevalence of depressive symptoms among migrants and non-migrants living in Qatar and identify variables associated with depressive symptomology in these groups, including culture of origin, time living in country and perceived quality of life. In addition, we tested if the latter two variables moderated the effect of culture of origin on depressive symptomology in the migrant groups.
Subject and Methods:
A telephone survey of a probability-based sample of 2,520 participants was conducted in February 2016. The sample was divided into three groups based on nationality and income: labour migrants (LMs), white-collar migrants (WCMs) and non-migrants or Qatari nationals (QNs). Participants completed the Whooley two-question test for depression.
Results:
The odds of depression were significantly increased in LMs (OR = 3.31, 95% CI = 2.36–4.65) and WCMs (OR = 1.40, 95% CI = 1.04–1.90) compared with non-migrants. Among LMs, having a problem with current employer in the last 3 months was also associated with depressive symptoms (OR = 2.10, 95% CI = 1.14–3.84). Culture of origin was significantly associated with depressive symptoms including South Asians (OR = 3.12, p < .001), East Asians (OR = 0.52, p = .013) and Westerners (OR = 0.45, p = .044) relative to Arabs. LM status remained strongly associated with depressive symptoms independent of culture of origin (OR = 2.02, p < .001).
Conclusion:
Perceived quality of life, but not length of stay, appears to be an important variable in explaining differences in symptoms between some cultural groups. Findings from this study highlight the importance of the context of migration and culture of origin as potential determinants of depressive symptomology in the host country.
Introduction
Migration is a complex phenomenon, involving changes in the sociocultural, economic and psychological aspects of life, often with far-reaching implications for individuals, their families and the communities involved. As people make this transition and adapt to a new country, their mental health – it is argued – can be affected. Nevertheless, the impact of migration on mental health remains equivocal; it is still far from clear, for example, if migration increases the burden of mental illness (Bhugra, 2004; Bhugra & Minas, 2007; Cantor-Graae & Selten, 2005; Lindert, Ehrenstein, von Priebe, Mielck, & Brähler, 2009; van Os, Linscott, Myin-Germeys, Delespaul, & Krabbendam, 2009).
Migration seems to impact people from different cultures, in different ways. Poor psychological adaptation may result from culture conflict; this is often described as ‘culture shock’ (Oberg, 1960) or acculturative stress (Berry, 1970). Previous research shows that acculturative stress or stress due to lack of congruity between culture of origin of the migrating group(s) and host culture (Alderete, Vega, Kolody, & Aguilar-Gaxiola, 1999) may be a risk factor for depressive and anxiety disorders (Murphy, 1977) and their symptomatology (Hovey, 2000; Revollo, Qureshi, Collazos, Valero, & Casas, 2011). The acculturative stress and any potential depressive symptomology associated with settling in the country are also likely to vary as function of length of stay in the country (Gullahorn & Gullahorn, 1963; Oberg, 1960). Perception of quality of life may also be an important variable influencing the actual appraisal of the acculturation experience (Belizaire & Fuertes, 2011).
A small country in the Arabian Peninsula, Qatar ranks the highest in the world for its gross domestic product per capita, backed mostly by natural gas reserves. In addition to the unprecedented growth in its economy in the past decade, winning the right to host the 2022 FIFA World Cup has increased the country’s reliance on migrants to build the necessary infrastructure. Today, Qatar has the highest proportion of migrants in the world (Kamrava & Babar, 2012) with approximately 85% of Qatar’s 2.7 million population (Planning and Statistics Authority, 2018), and 94% of its economically active population are not Qatari nationals or QNs (Kamrava & Babar, 2012).
The majority of workers in Qatar are labour migrants (LMs) from South Asia (India, Pakistan, Bangladesh and Nepal) and South East Asia (the Philippines; De Bel-Air, 2014). LMs are mostly male labourers often possessing little or no vocational training, who are employed in the construction sector or oil-and-gas industry. LMs typically live with other male labourers in camps provided by their employer and are often described as single male labourers, a misnomer reflecting their living arrangements in Qatar rather than their actual marital status. In contrast, white-collar migrants (WCMs) engage in higher paid professional, managerial or administrative jobs that require formal training or education. WCMs are mostly nationals from other Arab or Asian countries. Unlike LMs, they often have their families living with them. Nationals from North America, Australia and Europe make up only a relatively small proportion of the migrant population in Qatar and are predominantly WCMs. Both LMs and WCMs are sponsored under a set of migration rules, called the Kafala, which require that all migrants have an in-country sponsor – normally their employer – who is responsible for their legal status in the country.
Much of the available literature on migration and depression is focused on Europe (D. Bhugra, 2004; Bhugra & Jones, 2001; Carta, Bernal, Hardoy, & Haro-Abad, 2005) and North America (Fenta, Hyman, & Noh, 2006; Grzywacz et al., 2010; Hovey, 2000; Turner & Lloyd, 1999). Only a handful of studies were identified that explore this association in Qatar and neighbouring countries (Al Ansari, Hamadeh, Ali, & El Offi, 2007; Al-Maskari et al., 2011; Nadim et al., 2016). Arabian Gulf countries like Saudi Arabia, Kuwait, United Arab Emirates and Bahrain have a similar reliance on foreign workers, including LMs from low-income countries of South and South East Asia and are governed by similar Kafala laws found in Qatar. Therefore, the country of Qatar and most of the Gulf countries represent a unique social setting as the majority of the population constitutes migrants with very distinct migratory pathways from migrants in which migration-related depression studies are usually published.
The aim of this study was to compare the prevalence of depressive symptoms and to identify variables that accounted for differences in depressive symptomology in the three population groups (WCMs, LMs and non-migrants) typical of Qatar and other Gulf countries. We predicted that culture of origin would be an important independent predictor of acculturative stress as measured by depressive symptoms. We also hypothesized that the type of migrant (LMs vs WCMs) was a significant predictor of depressive symptomology independent of culture of origin. In addition, we explored whether length of stay and perceived quality of life in the country were potential modifiers of the effect of the culture of origin on depressive symptomology among migrants to Qatar.
Methods
A telephone survey was conducted in February 2016 of people who were 18 years or older, living in Qatar, by the Social and Economic Research Institute at Qatar University. The survey covered a broad range of health and social issues. Up to 10 minutes in the survey was allocated for questions relating to mental health.
Sampling strategy
The sample was selected from a frame obtained from the two main cell phone network providers in Qatar. As most people in Qatar do not have a landline phone, but do own a cell phone from one of these two providers, our sample frame covered the majority of the population (approximately 98.0% coverage rate). A probability-based sampling approach was used to select a representative sample from this frame using a list-based dialling technique (Casady & Lepkowski, 1993). Systematic stratified sampling was carried out separately for non-migrants and migrants. The former were over sampled, as they are a minority group in the population. Weights were constructed to account for sampling disproportionality and non-response.
Sample size determination
The target sample size for this survey was estimated at 2,252 (see Appendix 1 for details) and was calculated based on standard sample size formula for complex survey design (Cornfield, 1951; Kish, 1965). To allow for statistically adequate comparisons between the three population groups at the 5% significance level, the target sample of completed interviews was estimated to be about 750 per group (LMs, WCMs and QNs).
Strategies to minimize bias
To improve survey response and reduce selection bias, selected phone numbers were released in batches to help ensure that standard call procedures were followed for all mobile phone numbers. Seven attempts were made to contact each potential participant. Phone calls were made at different times of the day and on different days of the week.
Data collection
The study was reviewed and approved by the University’s Institutional Review Board (reference number: 264-E/13). Using computer-assisted telephone interviewing system (Kelly, 2008), researchers entered responses directly into Blaise survey management software as they interviewed participants over the phone (Blaise, Statistics Netherlands, n.d.).
Symptoms of depression
The Whooley two-question screening test (dependent variable) was used to estimate the prevalence of depressive symptoms that meet one or two of the core diagnostic symptoms for depression in the past month: (1) ‘During the past month, have you often been bothered by feeling down, depressed, or hopeless?’ and (2) ‘During the past month, have you been bothered by little interest or pleasure in doing things?’ (Whooley, Avins, Miranda, & Browner, 1997). This instrument has been used previously for screening purposes in primary care (Spitzer et al., 1994; Whooley et al., 1997) and validated against a gold-standard diagnostic interview for major depression (Cantor-Graae & Selten, 2005; Spitzer et al., 1994; Whooley et al., 1997) and other brief screening instruments (Cantor-Graae & Selten, 2005).
Additional measures – quality of life in Qatar and health status
All participants rated their quality of life in Qatar on a 1 (the worst possible place to live)-to-10 (the best possible place) scale. The EQ-5D (3L), a valid measure of health quality in five dimensions (Berkhemer et al., 2015; EuroQol Group, 1990; Nord, 1991) such as mobility, self-care, usual activities, pain or discomfort and anxiety or depression, rated on a 3-point scale (no, moderate or extreme). Overall health rating on a scale of 0–100 – from worst imaginable to best imaginable state – was also captured as part of the EQ-5D and used in this survey (EuroQol Group, 1990).
Language and translation
The Whooley questions, along with the rest of the survey questionnaire, were professionally translated from English to Arabic, Hindi, Malayalam, Tagalog, Tamil, Urdu and Nepali. Two independent reviewers who were fluent in each of these languages and English verified the translation and reached a consensus on any disagreements in the final wordings of the entire survey instrument. Officially translated versions of the phone adaptations of the EQ-5D were obtained from the EuroQol group and applied for all the languages except Nepali, which was not available. This language version of the EQ-5D was translated and tested following the same procedure as other survey questions. All survey questions were pre-tested on a sample of 50 respondents for clarity and comprehension before fielding.
Classification of participants
Participants were classified into one of the three migration status groups based on their responses to a series of questions related to nationality and income. Participants who stated they were Qatari citizens were classified as non-migrants. Migrants were asked a series of questions about income. Participants were defined as LMs if they had a combined household income of less than $1,100 per month. Respondents with earnings above this threshold were classified as WCMs. This threshold represents a viable income cut-off, which reliably delineates between LMs and WCMs in this part of the world (Gardner et al., 2013).
Cultural groups were also defined based on nationality, which were coded based on geographical regions into the following: Arab or Middle Eastern, South Asian (excluding Nepal), Nepal, East Asian, African and Western (Europe, United Kingdom, Russia, United States, Canada and Australia). The language chosen by the respondent to complete the interview was also used to confirm the cultural background of migrants. We decided to treat Nepal, a country not a world region, separately from the rest of South Asian countries because migrants from Nepal are culturally quite different (language, religion and heritage) from India and surrounding countries (Joshi & Tulasi Abhi Subedi, 1975) and because of the fact they make up the second largest proportion of Qatar’s LM population (De Bel-Air, 2014). Both of these reasons warranted examining Nepalese as a separate migrant group.
Monthly income
To reduce non-response for income, both non-migrants and migrants were asked a series of broad questions about their total monthly income. However, as non-migrants generally have higher income than migrants in Qatar, different lower and upper income brackets were asked for each group. For non-migrants or QNs, the following income categories were generated based on income questions asked of these participants (Qatari Riyal converted to US Dollars): less than $2,746; $2,747–$9,259; $9,260–$19,228 and greater than $19,228. For high-income migrants (HIMs), the following income categories were generated: less than $2,746; $2,747–$4,120; $4,121–$4,745 and more than $4,745. For low-income migrants (LIMs), the following income categories were generated: less than $275; $276–$413; $413–$550 and greater than $550, but less than $1,100. Quartiles of net household income were further generated for the entire sample based on these different cut-offs and the quartile distribution for income in each group.
Employment status, socio-demographics and other variables
The employment status was ascertained of all participants. Participants who reported being employed were asked to rate their job satisfaction on a 5-point scale (very satisfied to very dissatisfied). The following demographic information was also elicited: age, gender, education, number of children and marital status. In addition, LMs were asked if they had experienced any problems with their current employer.
Statistical analyses
Initial bivariate analyses were conducted using the Chi-square test of proportions to compare those with and without depression symptomology across migration status groups, socio-demographics, work- and health-related characteristics (p < .25). To correct for survey design effects on the sampling variances of these proportions, the F-transformed version of the Pearson Chi-square statistic was used (Heeringa, West, & Berglund, 2011). Correlations among all covariates were tested using the weighted Pearson’s R statistic to identify all collinear pairs (r > .5).
Based on results from the previous steps (bivariate and correlations), 11 out of a total of 15 variables were advanced to the multivariable modelling stage. With the exception of gender and age, that we decided a priori to include in all the models, variables that were not statistically significant predictors of depression symptomology (p > .25) or were collinear with other variables were excluded.
Combined and separate statistical models for the three population groups
Multivariable logistic regression models were fitted to assess the main association between migrant status (WCMs and LMs) and depression relative to non-migrants (QNs) while adjusting for other variables of interest. As per our literature review and hypothesized difference in the prevalence and potential determinants of depressive symptoms across LMs, WCMs and non-migrants, separate models were also fitted for each of the three population groups.
Models with culture of origin
To explore the putative role of culture of origin, quality of life and length of stay in explaining differences in the probability of experiencing depressive symptoms, we fitted two models for experiencing depression symptomology in the past month with and without adjusting for LM status among migrants only. In both of these models, the main effects of culture of origin, length of stay in the country and the perception of quality of life in Qatar were estimated. In addition, only few other variables that were ubiquitously significant across the separate models that were fitted previously for WCMs and LMs were included.
Next, we separately assessed for two types of interactions. The first model included an interaction term that is a product term for culture of origin and duration of stay in the country. The second model included an interaction term between culture of origin and quality of life. In both of these models, the likelihood of depressive symptoms along with the main effects for culture, duration of stay, female gender, reports of physical pain and LM status were included. The design-adjusted Wald test was used to assess the goodness of fit by comparing models with and without these interaction terms. To aid in the interpretation of the two-way interaction between quality of life and cultural groups, we estimated and plotted the average marginal effects (AMEs) from these models (Long & Freese, 2014).
Two statistical approaches were used with all types of models presented here: full adjustment and selected adjustment. For more information about these approaches and criteria used for selection of variables in our final modes, please see description in Appendix 2.
All statistical analyses were weighted and carried out in STATA version 13 (StataCorp, 2013).
Results
Demographic information
Of the 5,398 people approached to participate in this study, a total of 2,520 consented and completed the telephone interview, yielding a maximum margin of error of ±2.7%. The outcome of all calls made by researchers is available in Appendix 1. Based on AAPOR standards (The American Association for Public Opinion Research, 2016), the adjusted response rate was 53.8%. Figure 1 shows the flow of participants through the study.
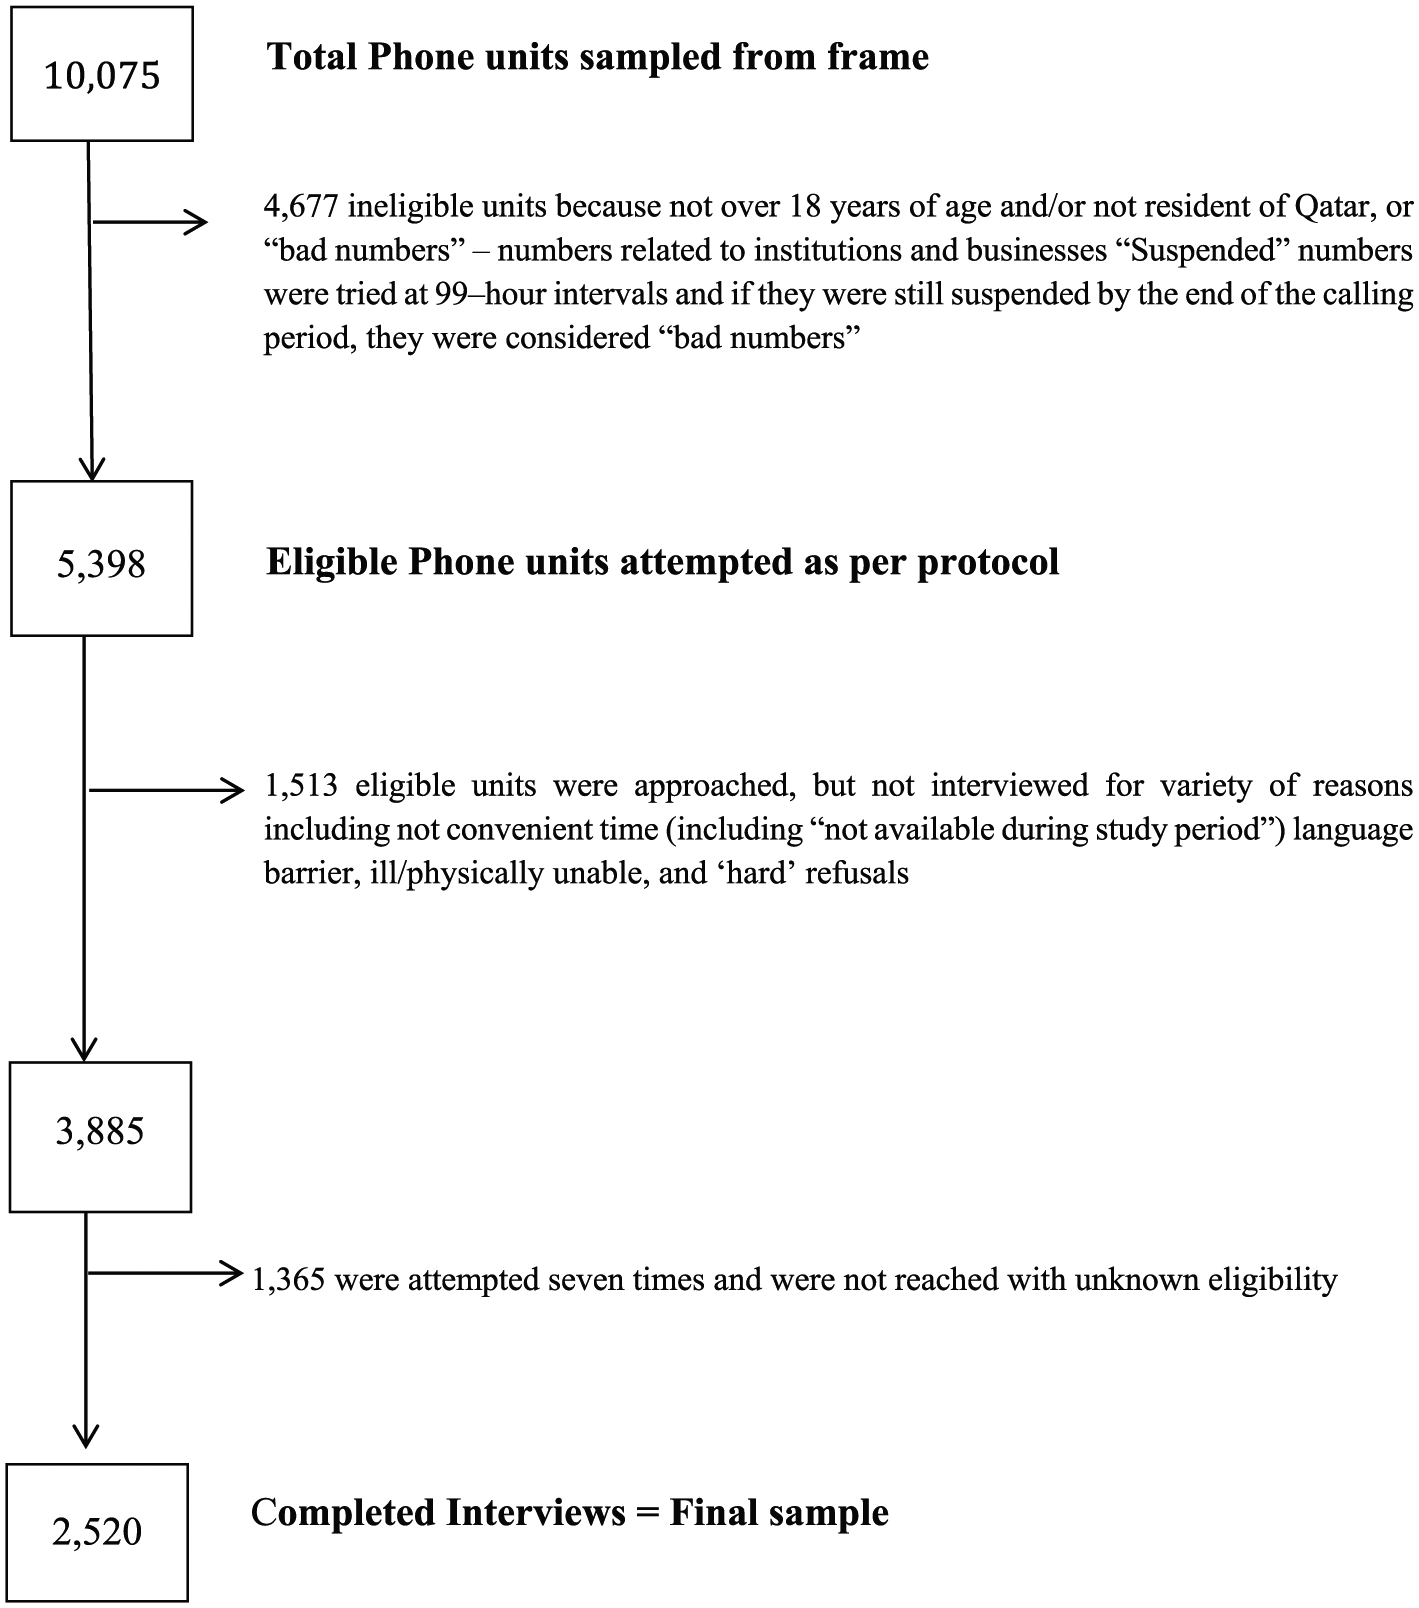
Sample flow.
The main known reasons for not participating were not convenient time (including ‘not available during study period’), ill/physically unable and ‘hard’ refusals (refusal to participate). The weighted proportions for all migration status groups yielded the following representation in the total sample: 8.2% (QNs), 33.5% (WCMs) and 58.3% (LMs).
Table 1 shows the demographic characteristics of the sample in total and by group (QNs, WCMs and LMs). Participants were in their mid-thirties, and the vast majority were males. Two-thirds of the sample was married. Just under half of the respondents had completed post-secondary education and the proportion not working was low. Compared to QNs, WCMs and LMs were more likely to be male and in the 25–34 and 35–44 age groups. They were also more likely to be married. Almost a third of QNs earned over $19,228 per month, and 41.6% of WCMs earned less than $2,746 per month. Just under half of the LMs reported that they earned more than $550 per month. Non-migrants reported the highest levels of job satisfaction; two out of three said that they were very satisfied with work. The proportion of LMs who reported being dissatisfied or very dissatisfied was 11.9%, and those who reported a recent problem with their employer in the past 3 months was 15.3%.
Distribution of socio-demographics and work- and health-related characteristics across migration status groups and total sample.
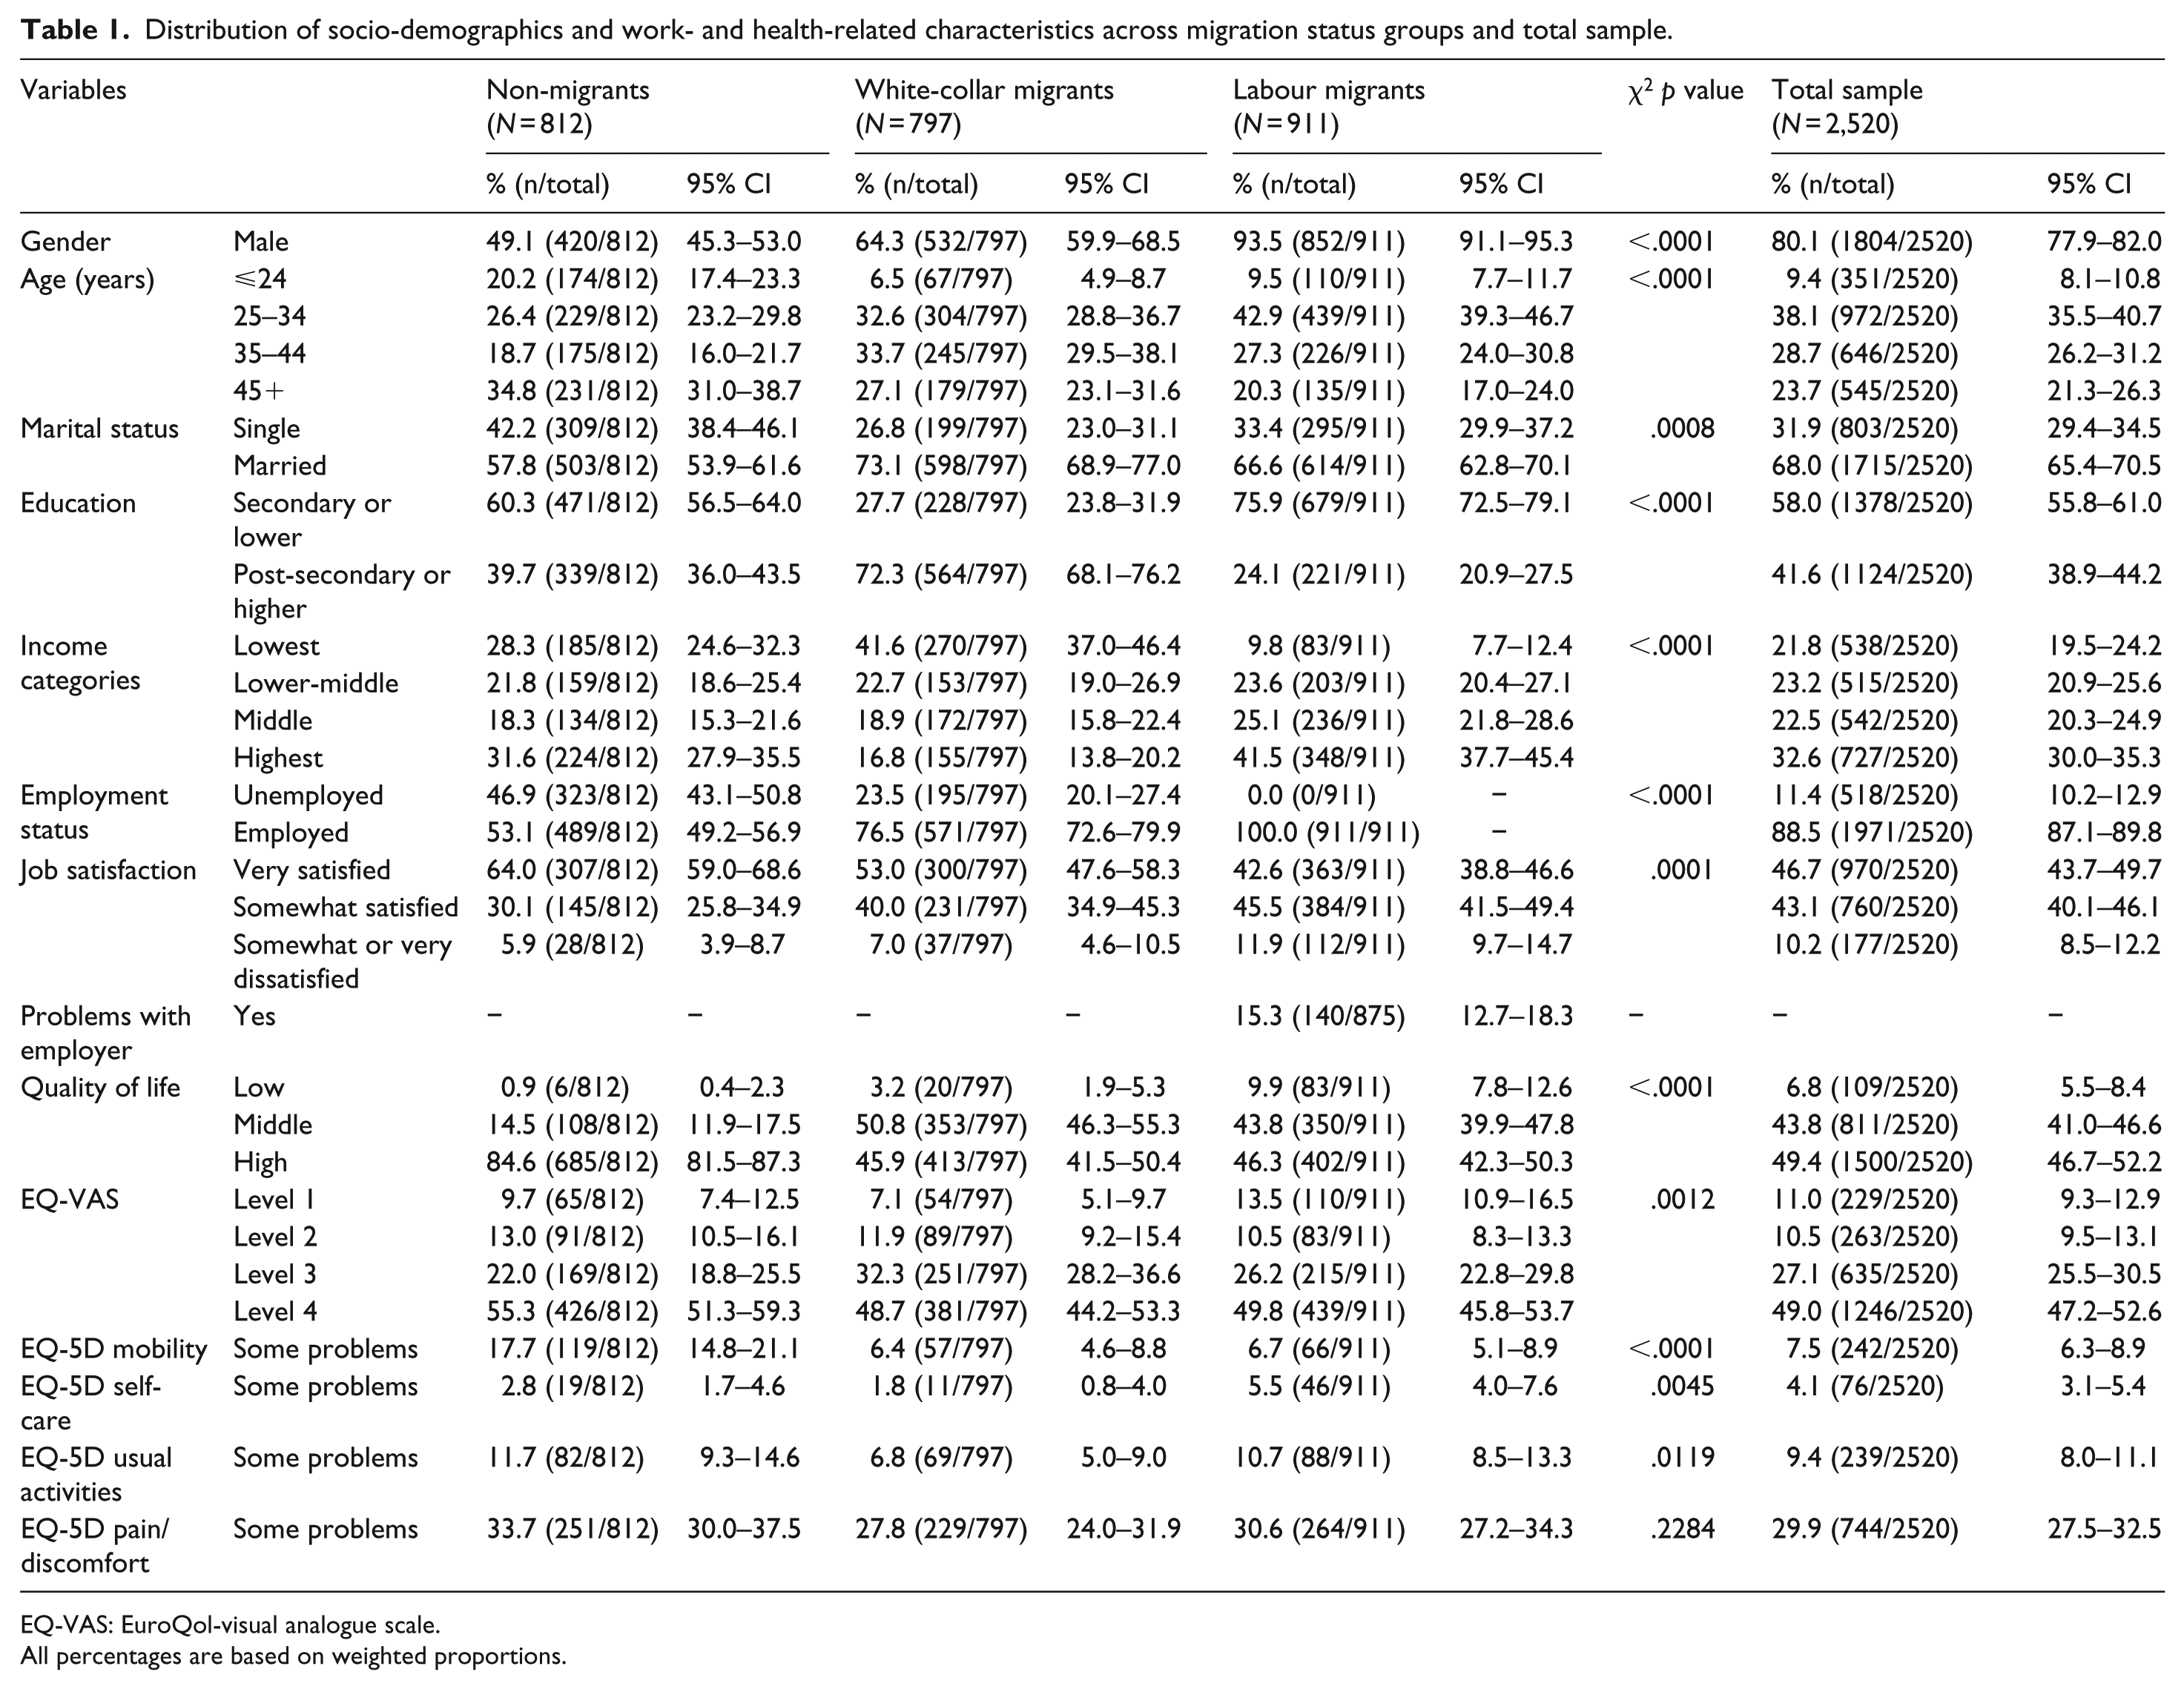
EQ-VAS: EuroQol-visual analogue scale.
All percentages are based on weighted proportions.
Migrants’ nationalities and world region
The distribution of nationalities among the LMs in our sample was as follows: India (32.1%), Nepal (26.0%), Bangladesh (12.6%), the Philippines (8.5%), Pakistan (4.1%), Sri Lanka (3.9%), Egypt (3.1%), Sudan (1.1%) and all other countries (8.6%). The majority of WCMs in our sample were from South Asia (47.4%), with the majority from India, Arab countries in the Middle East (42.0%), with a majority from Egypt, and South East Asia (14.2%) or the Philippines. Approximately, 5.5% of WCMs were from North America (United States and Canada), Australia, Russia and Europe (United Kingdom, Germany, Italy and Spain).
Quality of life and health status
Overall quality of life was highest in QNs, with approximately 85% giving a rating of 9 (or higher) out of 10. Compared with WCMs and LMs, problems with mobility were almost three times more common in the national population. A small number of participants reported problems with self-care or undertaking usual activities (work, study, housework, family or leisure). Pain/discomfort was reported by around a third of all participants.
Prevalence of depression symptoms
The prevalence of depression symptoms, adjusting for demographic and health-related characteristics, is shown in Table 2. Just over half (n = 1,249, 57.9%) of the participants responded yes to one or both of the depression screening questions. Prevalence was highest in the LM group with just over two-thirds (n = 585, 68.5%) screening positive. Around half of the participating women in each of the groups screened positive for depression. As might be expected, fewer male, compared to female, participants in the national (n = 139, 31.5%) and WCM (n = 209, 41.8%) groups reported depressive symptoms. Depression symptoms were significantly more common in male compared with female in LMs.
Past month prevalence of depression caseness estimates by socio-demographics and work- and health-related characteristics for migration status’ subpopulations and total sample.
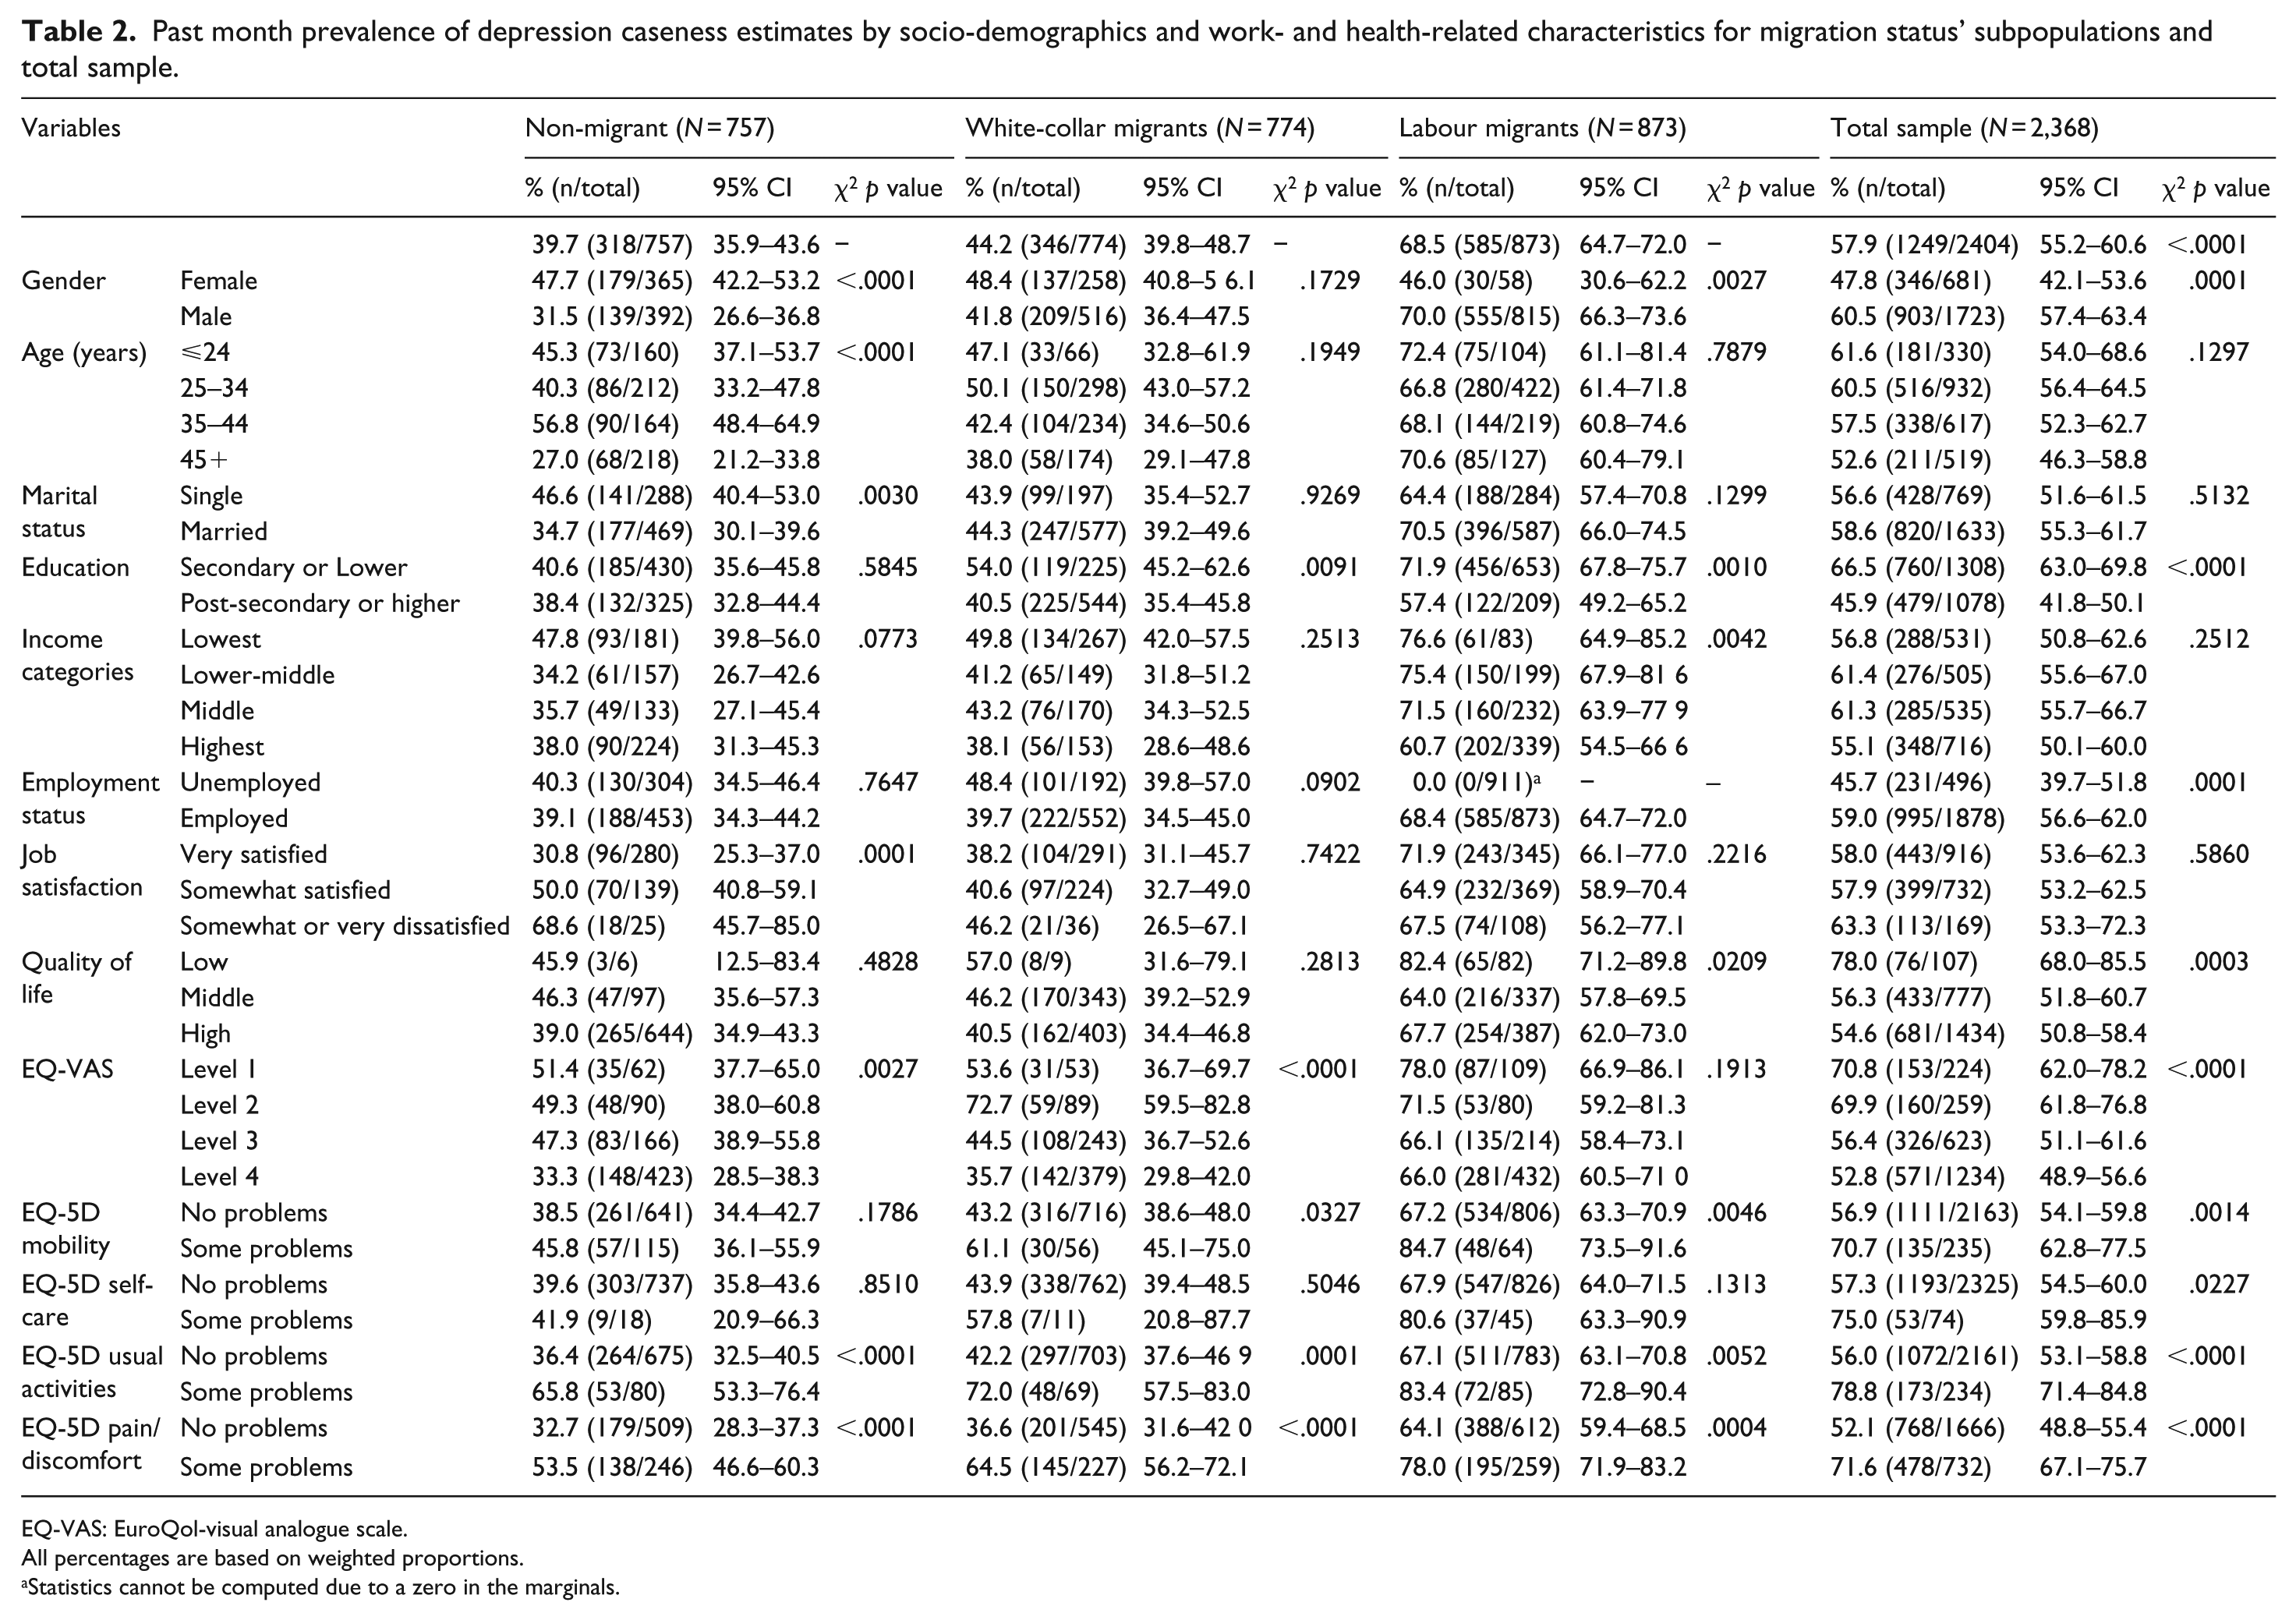
EQ-VAS: EuroQol-visual analogue scale.
All percentages are based on weighted proportions.
Statistics cannot be computed due to a zero in the marginals.
Combined and separate multivariable models
In the multivariable analysis, migrant status, education, quality of life, problems with usual activities and pain were significantly associated with depression (Table 3). The adjusted odds ratio for depression symptoms was increased by 40% in WCMs (OR = 1.40, 95% confidence interval (CI) = 1.04–1.90) and 231% in LMs (OR = 3.31, 95% CI = 2.36–4.65) relative to QNs. In LMs, having a problem with employer in the past 3 months increased the odds of reporting depressive symptoms by 110% (OR = 2.10, 95% CI = 1.14–3.84).
Final multivariable models for migration status with Whooley depression status.
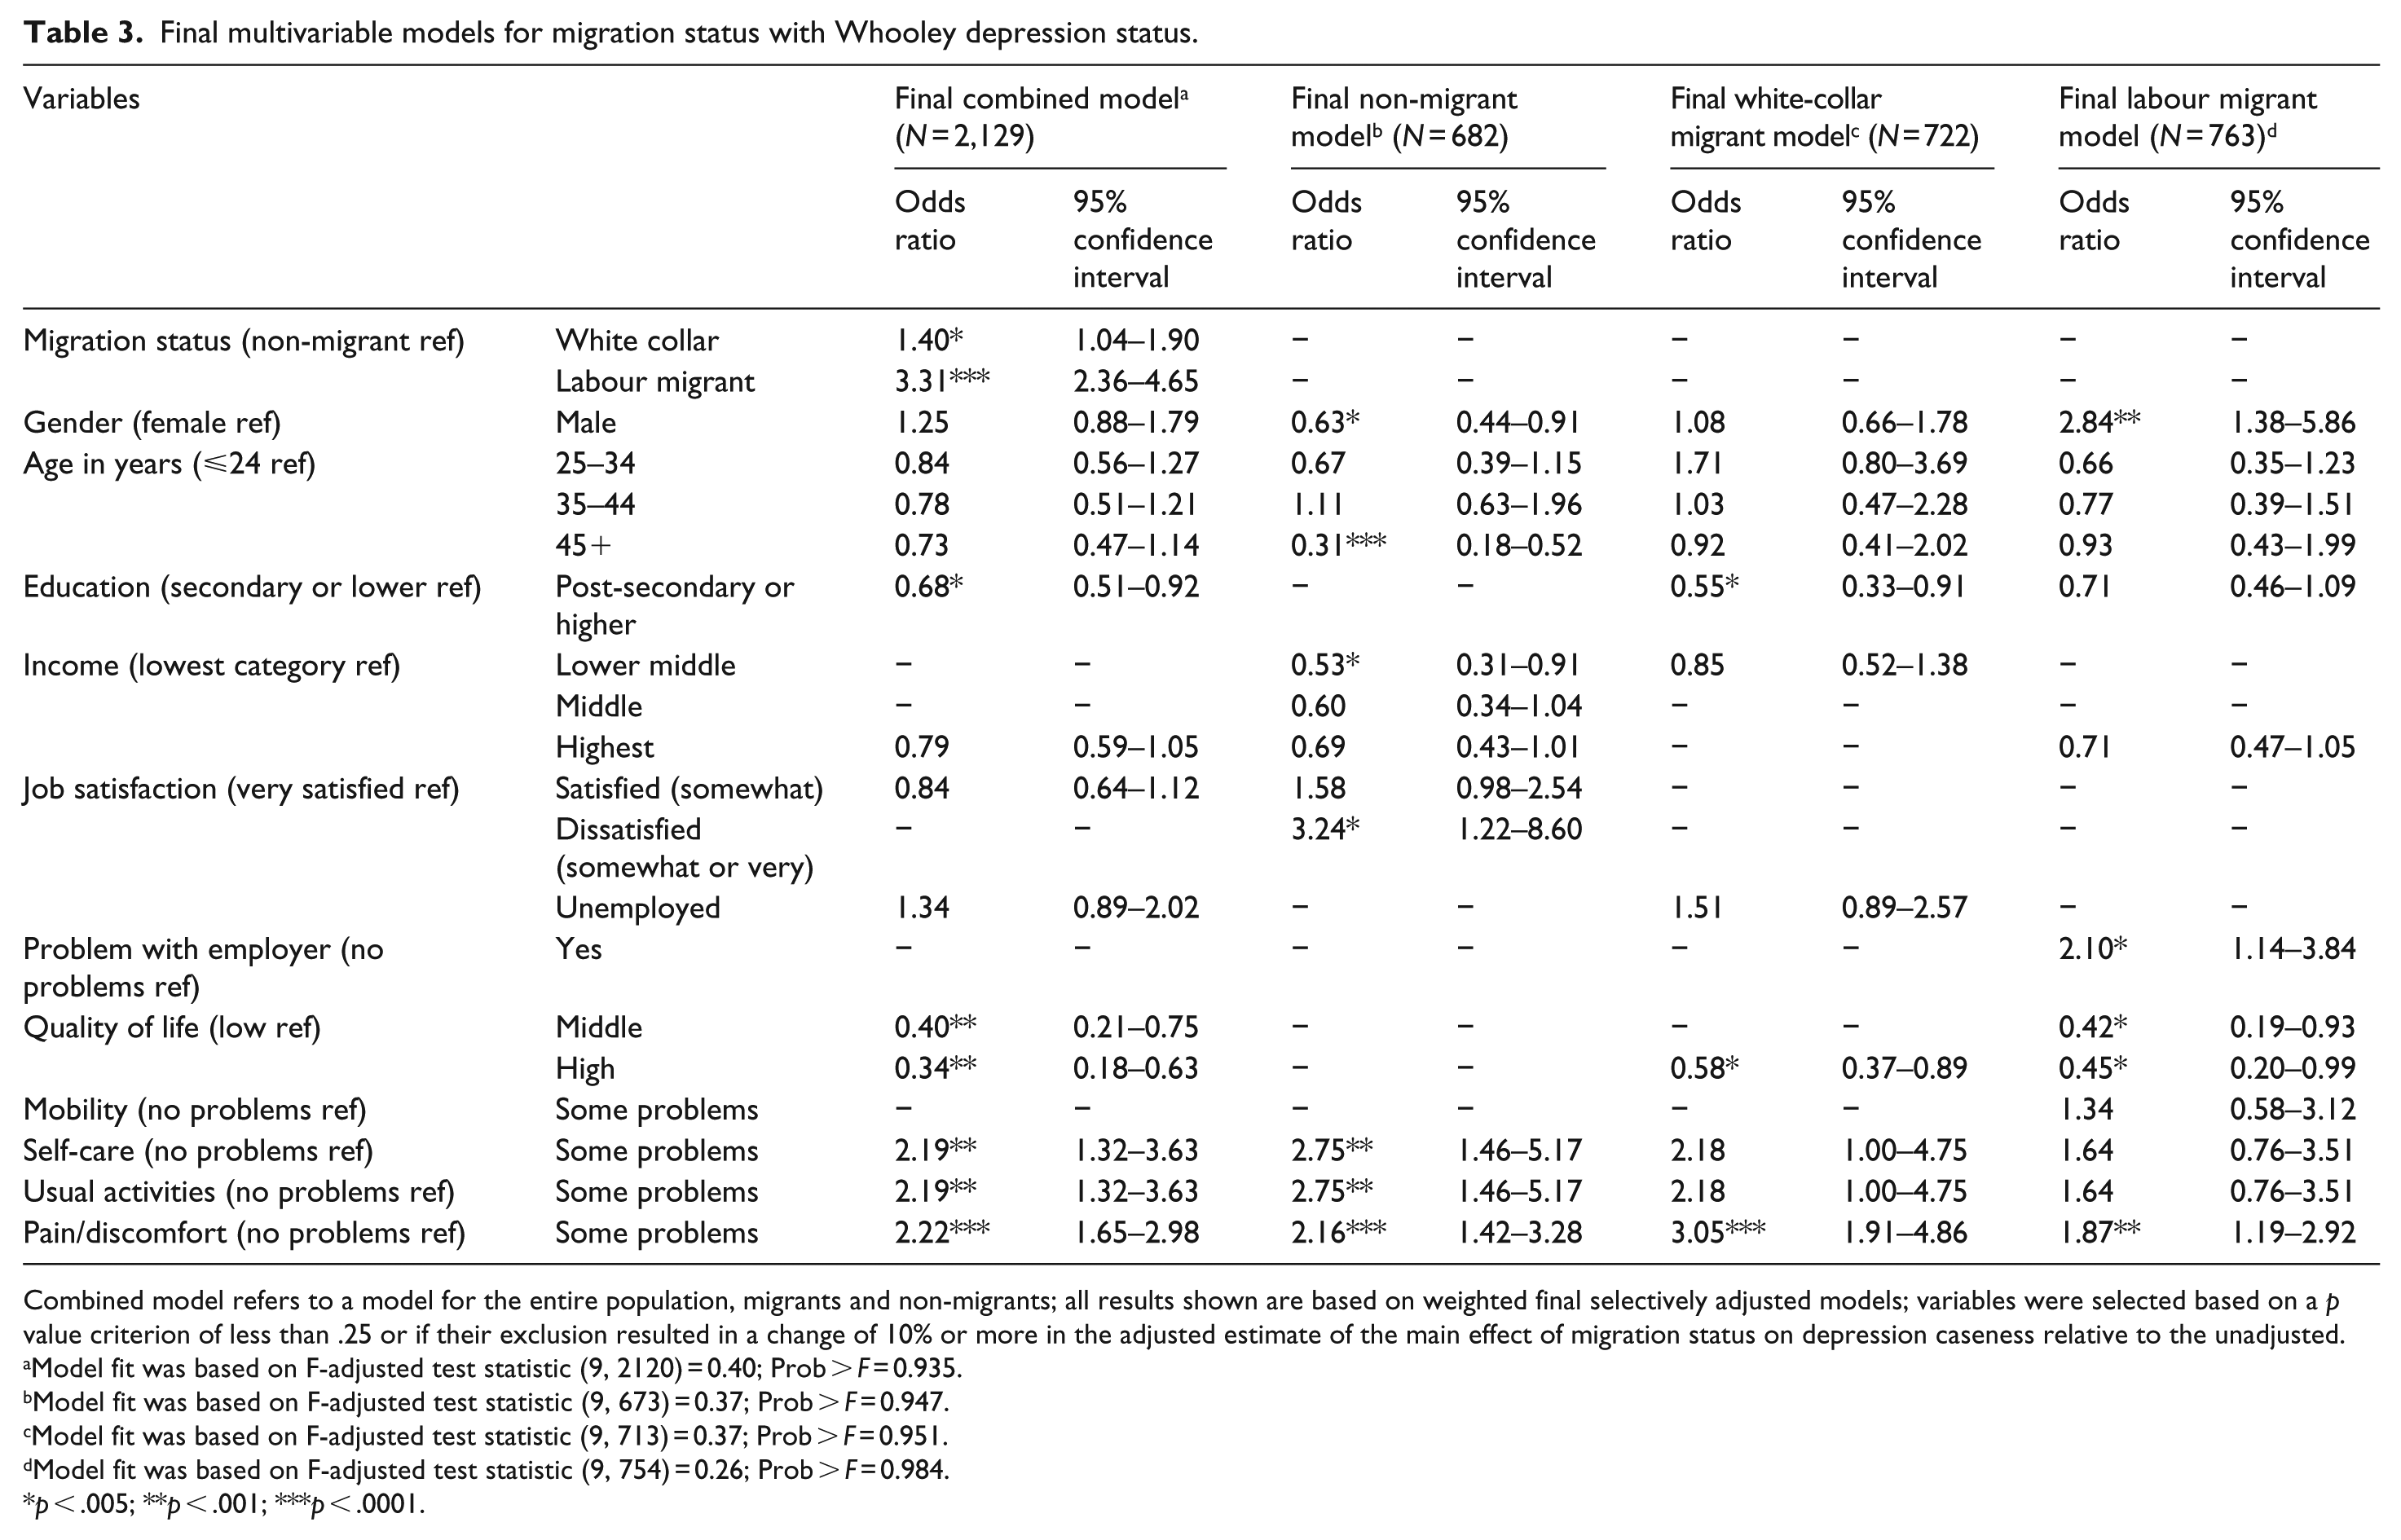
Combined model refers to a model for the entire population, migrants and non-migrants; all results shown are based on weighted final selectively adjusted models; variables were selected based on a p value criterion of less than .25 or if their exclusion resulted in a change of 10% or more in the adjusted estimate of the main effect of migration status on depression caseness relative to the unadjusted.
Model fit was based on F-adjusted test statistic (9, 2120) = 0.40; Prob > F = 0.935.
Model fit was based on F-adjusted test statistic (9, 673) = 0.37; Prob > F = 0.947.
Model fit was based on F-adjusted test statistic (9, 713) = 0.37; Prob > F = 0.951.
Model fit was based on F-adjusted test statistic (9, 754) = 0.26; Prob > F = 0.984.
p < .005; **p < .001; ***p < .0001.
Multivariable models for culture of origin
In a model that adjusted for gender, migrant type (LMs vs WCMs), culture of origin, quality of life, duration of stay and pain (Supplementary Table 1), culture of origin was an important predictor of depressive symptoms independent of LM status. In particular, South Asians were significantly more likely to report depressive symptoms compared to Arabs (OR = 2.3, 95% CI = 1.6–3.3). The opposite was true for South East Asians relative to Arabs (OR = 0.4, 95% CI = 0.2–0.7). Similar to South East Asians, protective associations were found for Africans (OR = 0.6, 95% CI = 0.2–1.7) and Westerners (OR = 0.5, 95% CI = 0.2–1.0) relative to Arabs, though neither of these associations was statistically significant (p = .185; p = .057, respectively). As such, these two groups were further regrouped with South East Asians under ‘other’ to increase power in further analyses. In this same model, LM status, quality of life and pain remained statistically significant predictors of depressive symptoms, but this was not the case for gender or length of stay in Qatar (Supplementary Table1).
There was no evidence that the association between length of stay and depressive symptoms differed between migrants on the basis of their cultural background (see Supplementary Table 1; South Asian × duration of stay, p = .805; Nepalese × duration of stay, p = .619; other × duration of stay, p = .723). However, a significant interaction between quality of life and culture of origin was found for the South Asian relative to Arab comparison only (OR = 1.20, p = .018), but not for the Nepalese relative to Arab (OR = 1.22, p = .055) or other cultural groups (South East Asian, African and Westerner) relative to Arab (OR = 1.06, p = .627) comparisons (see Supplementary Table1).
Figure 2 is a plot of the population-averaged predicted probability for depression symptomology as function of perceived quality of life in Qatar among the different cultural groups. Unlike Arabs (AMEs = –0.049, p < .001) and ‘other’ cultural groups, including Westerners, Africans and South East Asians (AMEs = –0.032, p = .086), the slopes of the lines representing the average predicted probability of depression as function of one-unit change in the quality of life scale are close to zero for both South Asians (AMEs = –0.007, p = .413) and Nepalese (AMEs = –0.005, p = .771). A one-unit increase in quality of life was associated with statistically significant increase in the predicted probability of depression by 4.2% (p = .008) for South Asians versus Arabs (Supplementary Figure 1) and by 4.4% (p = .051) for Nepalese relative to Arabs (Supplementary Figure 2).
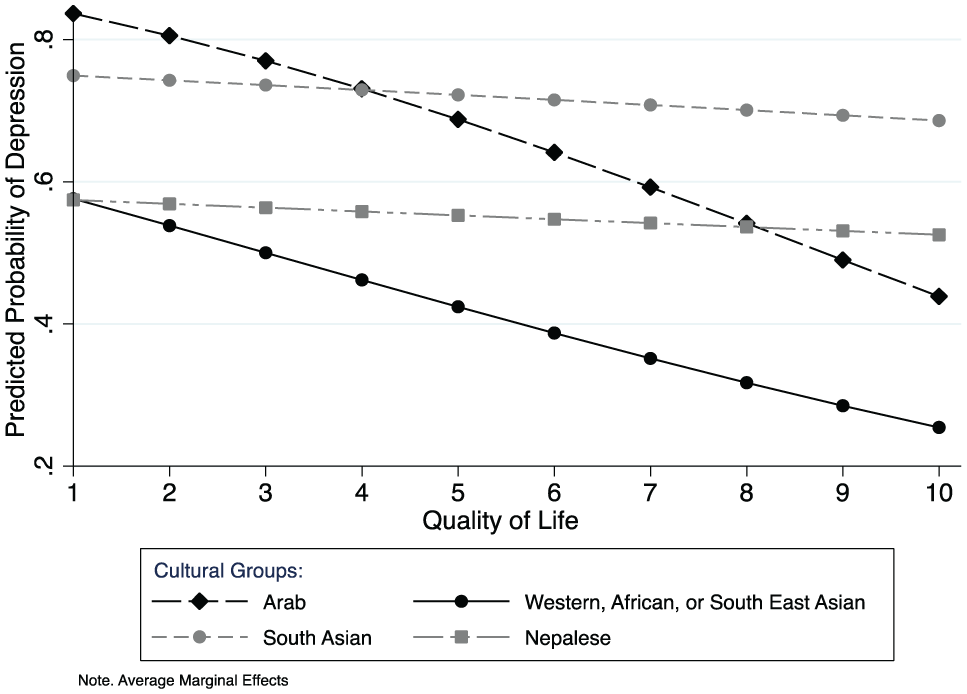
A plot of the average predictive margins for culture and quality of life on depression symptomology.
Discussion
The primary aim of this study was to document differences in depression symptoms in migrants relative to non-migrants typically found in Qatar and other neighbouring countries. The odds of depression symptoms increased significantly among migrants (LMs and WCMs) compared to non-migrants. This may suggest that migration to Qatar and other Gulf countries is associated with higher levels of depression symptoms. Our observation is contrary to findings of a large meta-analytic review that reported no clear association between migration and depression (Swinnen & Selten, 2007). Authors of other studies have highlighted the importance of the host country context and unique consideration of particular groups of migrants (Alegría et al., 2007; Lindert et al., 2009). The context of Qatar and other Gulf countries are distinct and require careful consideration, as does the cultural background of those migrating to these countries.
One unique contribution of this study is in highlighting the role of culture of origin as an independent pre-immigration variable that is associated with symptoms of depression or acculturative stress in the host country. Relative to Arab migrants, South Asians were more likely to experience depression, while the opposite was true for migrants from South East Asia, Africa and Westerners. This is consistent with previous studies that highlighted cultural differences in relation to psychiatric disorders and distress (Kirmayer, 1989, 2001; Kirmayer, Gomez-Carrillo, & Veissière, 2017; Qureshi et al., 2013).
While other studies have reported on the associations between acculturative stress and depression in migrant workers in the United States (Hiott, Grzywacz, Davis, Quandt, & Arcury, 2008; Ramos, Su, Lander, & Rivera, 2015), Korea (Lee, Ahn, Miller, Park, & Kim, 2012) and Saudi Arabia (Nadim et al., 2016), our findings extend the existing literature by linking culture of origin to variables that may impact depressive symptomology in the host country. In this respect, our data may indicate that perception of quality of life, not length of stay, in Qatar is a potential mechanism through which these differences may manifest across cultural groups of migrants.
Specifically, we found that when compared to Arabs, both South Asians and Nepalese, on average, experience an increase in the predicted probability of depressive symptoms, by approximately 4%, for every unit increase in perceived quality of life. This seemingly paradoxical finding may reflect divergent cultural beliefs and attitudes towards life in the host country among these groups relative to Arab migrants including greater emphasis on the importance of family and a sense of belonging to the wider community in these cultural groups; it may also be due to the greater separation from families that South Asians and Nepalese migrants typically experience in Qatar compared to Arab migrants. This is consistent with previous research showing that family closeness and financial resources might buffer against acculturative stress experienced by Mexican migrants in the United States (Hovey, 2000).
We also observed that the prevalence of depression was much higher in LMs compared with QNs. In fact, LM status remained strongly associated with reporting depressive symptomology independent of culture of origin and other variables. This observation may be due to the occupational nature of the work that these migrants engage in (Hiott et al., 2008; Ramos et al., 2015). It also may be due to the realities of LMs living in Qatar and neighbouring Gulf countries that include, but are not limited to, strenuous working conditions, long-term separation from family and lack of financial security. Interestingly, there was a clear association between having a problem with current employer in the past 3 months and 30-day depression in the LM group. In the context of Kafala system, employers control sponsored employees’ residence status, ability to change job and to exit the country. It is perhaps not surprising that worker–employer disputes may predispose members of this group to high levels of depressive symptoms.
We also replicated some established associations between depression and other variables including gender, age and problems with self-care or usual activities (Blazer, Kessler, McGonagle, & Swartz, 1994; Brenes, 2007; Glaesmer, Riedel-Heller, Braehler, Spangenberg, & Luppa, 2011). Reports of bodily pain or discomfort significantly predicted depression in all three groups. Poor quality of life was strongly associated with depression in migrants only. Being a male was also associated with depression in LMs only.
Our study was undertaken in a large representative sample of the population of Qatar and included representative sample of main population groups including LMs, who are hard to access. Our response rate was good for a telephone survey, and we had few missing data. The major limitation of our study relates to the brevity of the instrument used to capture and compare prevalence estimates of depression symptoms across different cultural groups. Specifically, the absence of information on severity of depressive symptoms is a major pitfall. Furthermore, as far as can be determined, the Whooley questions have not been previously used in ethnically diverse populations, so information about clinical validity as a first stage screening tool in non-Western populations is not available. In Western settings, the sensitivity of the instrument was reported to be excellent (96%; Whooley et al., 1997) and better than alternative – but longer – instruments such as the Beck Depression Inventory (BDI; 89%; Beck, Steer, & Brown, 1996) and the Patient Health Questionnaire-9 (PHQ-9; 88%; Kroenke, Spitzer, & Williams, 2001) Specificity was, however, somewhat lower than both alternatives (Two questions = 57%, BDI = 65% and PHQ-9 = 88%; Whooley et al., 1997). Moreover, whether the Whooley questions measure the same concept and was associated with the same level of functional impairment in ethnically diverse groups is unknown. These assumptions were not verified in our sample. The decision to use the Whooley two-question test was based on expediency; the measure needed to be administered over the phone, in multiple languages and within the short amount of time allocated. Participants were interviewed over the phone by lay interviewers working in a call centre at Qatar University. The absence of visual cues on the phone might compromise rapport and probing (Novick, 2008). There may also be potential for this method to introduce response bias. Although survey questionnaires were thoroughly translated and administered in the mother tongue of most respondents, we cannot rule out other sources of response bias.
Conclusion
Qatar has the highest proportion of migrant workers in the world. Up to this point, little is known about their mental health status relative to non-migrants. To our knowledge, this study is the first to compare prevalence of depressive symptoms in non-migrants and migrants – including LMs and WCMs typically found in Qatar and other Gulf countries. The prevalence was higher for migrants in general and substantially higher for LMs compared to the national population, suggesting that migration and the realities of life in the host country are most likely an important determining factor. Our observation warrants further investigation into severity of these symptoms and focused and tailored intervention for this segment of the population with careful consideration of the best way to outreach to this group of individuals.
Supplemental Material
Supplementary_Figures – Supplemental material for Depression in migrant workers and nationals of Qatar: An exploratory cross-cultural study
Supplemental material, Supplementary_Figures for Depression in migrant workers and nationals of Qatar: An exploratory cross-cultural study by Salma M Khaled and Richard Gray in International Journal of Social Psychiatry
Supplemental Material
Supplementary_Table_1 – Supplemental material for Depression in migrant workers and nationals of Qatar: An exploratory cross-cultural study
Supplemental material, Supplementary_Table_1 for Depression in migrant workers and nationals of Qatar: An exploratory cross-cultural study by Salma M Khaled and Richard Gray in International Journal of Social Psychiatry
Footnotes
Appendix 1
Appendix 2
Two modelling approaches were used: full adjustmentand selected adjustment. In the former, the following variables were included: age categories, gender, education, marital status, job satisfaction, quality of life in Qatar and health-related quality of life. In the latter approach, model selection was based on manual backward stepwise deletion carried out on a model that adjusts for all variables that advanced to this stage (Sun, Shook, & Kay, 1996) – first removing variables that were least associated with depression symptomology (p > 0.25), while evaluating the contribution of each predictor to the model using the F-adjusted Wald test and the F-adjusted mean residual goodness of fit test (Hosmer, Stanley, & Rodney, 2013). The inclusion of variables in the final model was based on a p value criterion of less than 0.25 or if their deletion resulted in a change of 10% or more relative to the unadjusted estimate of the main effect of migrant status on the probability of experiencing depression symptomology (Budtz-Jorgensen, Keiding, Grandjean, & Weihe, 2007; Maldonado & Greenland, 1993).
Acknowledgements
The Social and Economic Survey Research Institute at Qatar University made this study possible. The statements made herein are solely the responsibility of the authors.
Author contributions
S.M.K. and R.G. jointly contributed to the design of the study and analysis of data. Both authors contributed to the writing of the manuscript and have read and approved the final manuscript.
Conflict of interest
The author(s) declared no potential conflicts of interest with respect to the research, authorship and/or publication of this article.
Ethical approval
Ethical approval was obtained from Qatar University IRB (QU-IRB 264-E15/16).
Funding
The author(s) received no financial support for the research, authorship and/or publication of this article.
Supplemental material
Supplemental material for this article is available online.
Notes
References
Supplementary Material
Please find the following supplemental material available below.
For Open Access articles published under a Creative Commons License, all supplemental material carries the same license as the article it is associated with.
For non-Open Access articles published, all supplemental material carries a non-exclusive license, and permission requests for re-use of supplemental material or any part of supplemental material shall be sent directly to the copyright owner as specified in the copyright notice associated with the article.