
Abstract
While marketization has been promoted as a mechanism for improving educational equity and effectiveness, substantial evidence suggests that it may have the opposite effect. We contribute to this debate by examining educational equity and effectiveness in two similar countries that have embraced educational marketization to different degrees. Drawing on data from the Program for International Student Assessment and a causal-comparative design, we show that Australian schooling has more choice and competition, is more socially segregated, has larger school stratification of human and material resources, and has greater inequalities of educational outcomes and overall lower effectiveness than Canadian schooling. Our findings suggest that educational marketization reduces educational equity and effectiveness by increasing school social segregation and stratification of resources.
Keywords
Introduction
Inequalities of educational opportunities, experiences and outcomes are a central concern to education researchers and policymakers. While differences in educational outcomes between individual students are to be expected given students’ varying aptitudes and talents, consistent and substantial differences in educational outcomes between groups of students is a matter of concern because it suggests the presence of structural barriers (Portes, 2005). Inequalities based on socioeconomic status (SES) or income are particularly prevalent, and in most countries of the world, SES is one of the largest predictors of academic achievement (Sirin, 2005).
The impact of marketization policies on inequalities of educational outcomes is a matter of debate. Proponents of school choice and competition such as Chubb and Moe (1990) argue that marketization policies can ameliorate educational inequalities because they incentivize schools to improve educational quality in their quest to compete for students. However, marketization policies have been linked with heightened levels of educational inequalities in many national contexts (Lubienski et al., 2022; OECD, 2019a; Waslander et al., 2010; Zancajo and Bonal, 2022). While the consensus seems to lean toward the thesis that marketization is more likely to exacerbate educational inequalities than ameliorate them, more research is needed as many educational jurisdictions increasingly embrace educational marketization.
To shed light on this debate, we examine the links between marketization and educational inequalities in two “like” cases that allow us to control for the potentially confounding roles of poverty, demography, culture, and economic development. As argued by Berliner (2014) and Merry (2013), poverty, not teachers or schools, is the main reason behind educational disadvantage and inequality. Similarly, societal-level demographic characteristics, such as the proportion of immigrants or level of economic development, influence educational outcomes and inequalities (Fagerlind and Saha, 1989; McMahon, 2002; Siddiqi et al., 2007; Volante et al., 2019). While societal level characteristics impact education outcomes, education policies and structures are not irrelevant (Chiu and Khoo, 2005). Examining educational inequalities in two “like” countries allows us to control for the confounding role of poverty or other socio-cultural-economic contexts and thus better isolate the impact of marketization policies on educational inequalities. Furthermore, by examining educational inequalities in two countries that have comprehensive secondary education systems, we are able to isolate the impact of marketization policies from academically selective admissions and institutional differentiation, which is a major driver of school segregation (Gutiérrez et al., 2020).
We use a causal-comparative research design to explore the impact of marketization on educational inequalities in two cases (nations). Several features of this approach are useful for our aims. First, comparative analysis allows us to generate causal inference when experimentation is not possible (Arnove et al., 1982; Brewer and Kubn, 2010). By choosing cases that are similar along theoretically relevant dimensions but different on others, comparative analysis can provide an alternative to experimental research by “controlling” for possible confounding factors (Manzon, 2007). Second, retrospective analyses are useful for examining the impact of slow-moving processes that occur over years or even generations (Pierson, 2003). The effects of slow-moving social forces may be unmeasurable in the short-term but are nonetheless powerful and worthy of study as the failure to adequately account for them can lead to inaccurate causal and theoretical claims (Pierson, 2003). In the case of our study, we examine education policies and structures that have been operating for decades. Third, theoretically driven case studies are ideal for identifying causal effects and mechanisms (Rohlfing, 2012). While such studies cannot establish causation as can be done with well-designed experimental or longitudinal studies, comparative case studies are useful for identifying the processes that link causes and effects. Thus, a causal-comparative historical case study design is appropriate for our study as it allows us to “control” for potentially confounding variables, propose processes and mechanisms that link cause and effect, and examine macro-social forces that unfold gradually over long periods of time.
We hypothesize that educational marketization increases school socioeconomic segregation and stratification, which in turn amplify inequalities of educational outcomes between socially disadvantaged and advantaged students. We define school socioeconomic segregation as the clustering of students from particular socioeconomic backgrounds into separate schools (e.g. a segregated school is one that mostly enrolls students from low socioeconomic or working-class backgrounds, or conversely, from mostly high SES and professional class backgrounds). Integration is the opposite of segregation, that is, the mixing of students of different socioeconomic backgrounds within schools rather than their clustering into separate schools. We define school stratification as the unequal allocation of human, material and educational resources and accompanying status differences between schools.
We test this theory by conducting a causal-comparative case study analysis of schooling in Australia and Canada. We chose these two countries because they have similar economic, demographic and cultural contexts but have embraced educational marketization polices to different degrees. While comparative studies of Australia and Canada have used PISA to examine inquiry learning (McConney et al., 2014), science engagement (Woods-McConney et al., 2014), reading and math achievement (Perry and McConney, 2013), rural disadvantage (Sullivan et al., 2018) and the role of federalism (Sellar et al., 2021), no studies to the best of our knowledge have examined how marketization is related to educational inequality in the two countries.
In the following sections, we elaborate previous theoretical and empirical work about educational marketization and its link with educational inequality. We then describe the features of educational marketization in our two case studies, as a foundation for informing our findings and hypothesis generation. Next, we compare the two countries along a range of social, cultural, demographic, and economic indicators to make the case that we are comparing two cases that are similar on key variables. We then draw on secondary sources and data from the Program for International Student Assessment (PISA) to show how marketization is linked with educational inequalities through the intermediary processes of school segregation (student sorting) and school stratification of human and material resources.
Background and theoretical framework
As suggested by previous theoretical and empirical research, we anticipate that educational marketization policies and practices are linked to the ways in which students from different social backgrounds are sorted between schools, that is, to school social segregation (Perry et al., 2022a). This in turn is related to between-school inequalities in human and material resources, which is then associated with inequalities of educational outcomes for students from socially advantaged and disadvantaged backgrounds. These relationships are detailed in our theoretical framework, shown in Figure 1.
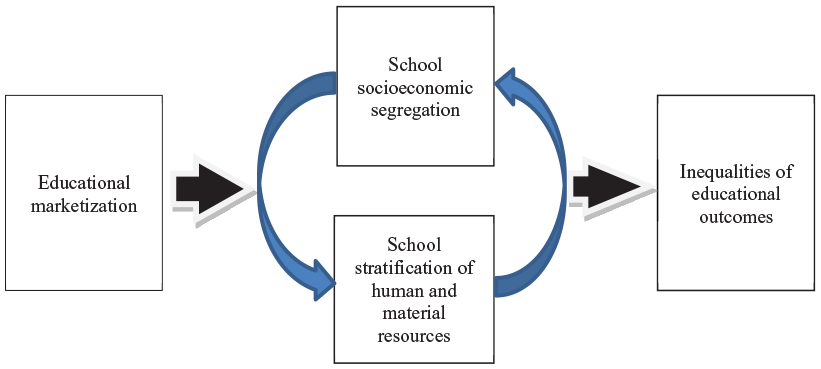
Theoretical framework of the impact of marketization policies on inequalities of educational outcomes.
The first dimension of our theoretical framework includes policies and practices that are related to educational marketization. Marketization is the process by which market principles are applied to public services and institutions for the purpose of improving quality and efficiency (Whitty and Power, 2000). The three main market principles are consumer choice, competition between providers, and substantial degrees of operational autonomy for those providers (Chubb and Moe, 1990). According to standard economic theory, providing choices to consumers forces producers to use that autonomy to compete, and this competition leads to increased quality, efficiency and innovation. In the sphere of education, proponents of marketization such as Chubb and Moe (1990) and Walberg and Bast (2003) argue that allowing families to choose a school forces schools to compete, leading to an increase in educational quality. Privatization can be a mechanism for promoting choice and competition, but it is not the conceptual equivalent of educational marketization. Nor is privatization a necessary element of marketization (Lundahl et al., 2013). Choice and competition can be promoted through the public school system alone, for example, with charter schools, magnet schools, academically selective schools, and open enrollment admissions.
While market theory suggests that marketization can improve educational effectiveness, the evidence on whether marketization leads to higher quality educational provision is far from clear (Lubienski and Lubienski, 2014; OECD, 2014b). Some advocates of marketization point to their analyses of voucher programs in the United States (Forster, 2009; Greene, 2001), but those studies are small, older, and highly contested (Lubienski, 2009; Lubienski and Malin, 2021). Even where positive effects are found for policies such as vouchers and charter schools, they tend to be relatively small (Maul and McClelland, 2013; Waslander et al., 2010). However, much of this research comes from older, local studies in the US context, and particularly from metropolitan regions that are highly unequal and segregated. But even in these earlier instances, market mechanisms such as school choice might not lead to much improvement in educational outcomes because better performing students have already exited these systems (Walsh, 2009). Larger scale studies in the United States and elsewhere offer reasons to be suspicious of the potential of choice and competition to reduce segregation and/or improve outcomes (Frankenberg et al., 2011; Lubienski and Lubienski, 2014; OECD, 2014a). Indeed, the most recent, larger-scale studies from the United States all show large, negative impacts on student achievement (Abdulkadiroğlu et al., 2018; Figlio and Karbownik, 2016; Marcotte and Dalane, 2019; Waddington and Berends, 2018).
The literature suggests that marketizing policies might have a negative effect on academic outcomes indirectly, via school segregation. Many studies have found that choice and competition increase social (ethnic, racial and/or socioeconomic) segregation (Waslander et al., 2010; Zancajo and Bonal, 2022). Most researchers argue that social segregation has negative consequences on academic achievement, as well as non-academic outcomes such as social cohesion and intergenerational mobility (Gutiérrez et al., 2020; Molina and Lamb, 2021). This is because the school socioeconomic composition effect is one of the largest school-level predictors of student achievement (Benito et al., 2014), in some instances even larger than student SES (Borman and Dowling, 2010; Perry et al., 2022b; Sirin, 2005). Students who attend a socially advantaged school tend to have higher academic outcomes than do demographically comparable peers from a similar social background who attend a socially disadvantaged school. Studies from a range of national contexts, including the United States (Palardy, 2013), Belgium (Dumay and Dupriez, 2008), and Australia (Chesters, 2019; Sciffer et al., 2022), find that this relationship is valid for all students, regardless of their social background. A recent meta-analysis by Tan et al. (2023) of more than 90 studies found that school SES is strongly associated with student academic outcomes, with a large effect size.
Therefore, we include four systemic features and policies that are related to choice and competition, that are common in one or both countries, and that have the potential to increase social segregation between schools. These four features are school choice, privatization, school funding, and public reporting of school performance. School choice relates to the ability of a parent to choose a school beyond their local public school. In the public sector it includes public schools that accept non-local students, magnet schools and independent public schools such as charter schools. As noted previously, school choice is associated with increased segregation (Kosunen et al., 2020; OECD, 2014a; Rotberg, 2014; Waslander et al., 2010; Yoon et al., 2020, 2022), but research of some education markets has found that it is not linked (Gorard et al., 2001; Greene, 2005). Private schools provide another mechanism for enacting school choice since they rarely use student residence as a criterion for admission. When they are subsidized with public funding, as with voucher programs in the United States or Chile, or state-supported private schools in the Netherlands or Canada, their capacity to expand choice is amplified. Similarly, school funding mechanisms that allow some schools to enjoy markedly superior facilities and resources are theoretically in a better position to compete for students. We also include in our framework the public reporting of school performance data because it is justified by government bodies as a way to assist families choose a school, and in market logic as a requirement for useful information to allow a market to operate effectively (Walberg and Bast, 2003). This same reporting of data can promote competition as schools compete for “good” students that will further enhance their reputation (Lubienski, 2005).
The basic idea underlying our theoretical framework is that when parents are given a chance to choose a school, and the differences between schools are qualitative and substantial (due to funding inequalities or to differing peer-effects, for example), many parents, and especially those with resources and incentive, will choose a school that they think is superior (OECD, 2014a; Yoon, 2020). Even parents who would otherwise prefer to send their child to their local public school may feel compelled to choose (Ball et al., 1996; Crozier et al., 2008). However, parents may feel less pressure or motivation to choose a non-local school if they do not perceive large differences between schools (Sahlberg, 2011).
We then anticipate that segregation is related to inequalities in educational opportunities and experiences. Specifically, our framework suggests that school socioeconomic composition may be positively related to school material and human resources, orderly classrooms, teacher instructional practices, teacher behaviors and expectations, and teacher–student relationships. Therefore, it is possible that schools that have a higher mean SES will have more positive learning environments than schools with lower mean SES, and that these differences are educationally significant. We also expect that they are related to the final dimension of the framework, equity of educational outcomes. Specifically, we expect that school social segregation is related to lower academic performance, especially for socially disadvantaged students.
Demographic indicators in Australia and Canada
The two countries selected for this study have similar geography, economies, public policies and societies (Callaghan, 2016; Kirchner, 2022; Stevens, 2009). Both are highly urbanized, multicultural immigrant countries with a Commonwealth heritage and a history of settler colonialism with immigration from similar countries and proportion of residents with an Indigenous background. Both countries have adopted policies that have promoted “the integration of diverse cultural groups in employment, language learning and shared liberal values” (Ghosh, 2018). Geographically, both countries have very large, sparsely populated land masses with small amounts of arable land. Both countries are blessed with numerous natural resources, which form a substantial part of their economies. The great majority of residents live in large cities along the borders, and their cities routinely are considered some of the most livable and desirable in the world (Economist Intelligence, 2021).
Both Australia and Canada also have high levels of development and prosperity. We provide detailed information about development in the two countries in Table 1, and also include data from the United States as a benchmark for readers not familiar with the Australian and Canadian contexts. Including data from the United States also highlights the similarity of our two case study contexts. As can be seen in the table, both Australia and Canada have better health outcomes than the United States, even though they spend a lower proportion of their gross domestic product (GDP) on healthcare. Their superior health indicators are likely due to their national insurance schemes and lower poverty rates. Australia and Canada have a similar welfare provision model (Shapira, 2012). All three countries spend approximately the same amount of GDP on education.
Social, economic, and demographic indicators.
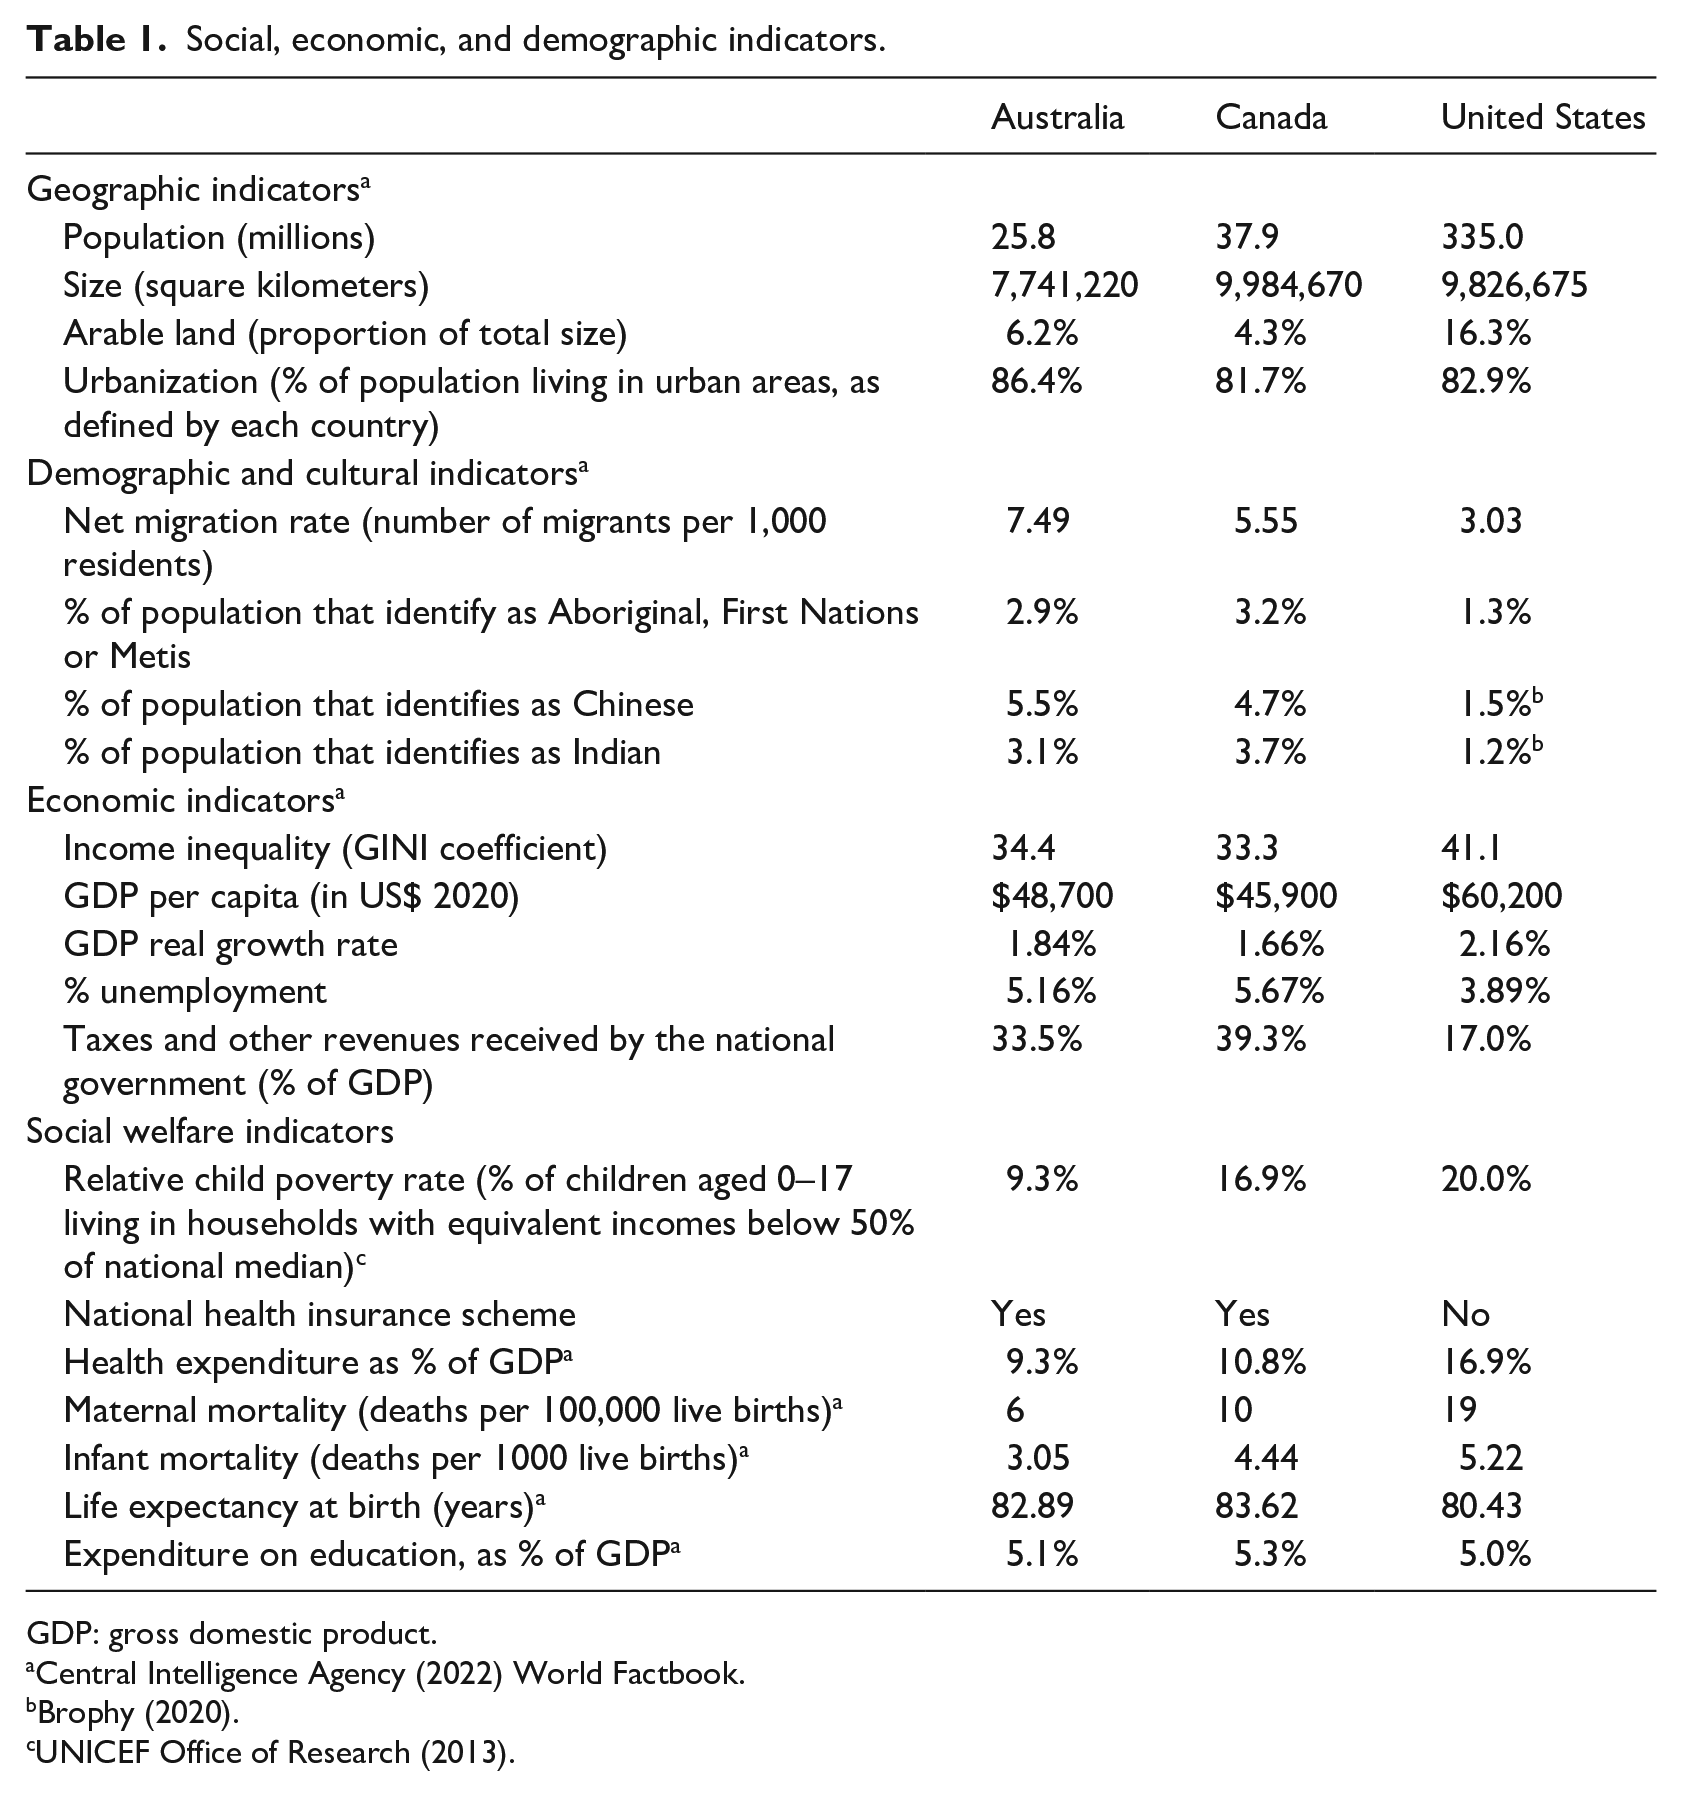
GDP: gross domestic product.
Central Intelligence Agency (2022) World Factbook.
Several indicators that are particularly relevant can be seen in Table 1. First, both Australia and Canada have very high levels of development, and on most economic and social indicators, score substantially better than the United States. Second, the cultural and demographic aspects of Australian and Canadian societies are similar, with comparable proportions of residents from Indigenous and Asian backgrounds (two groups that exhibit clear patterns with educational achievement (Ogbu and Simons, 2022; Sue and Okazaki, 2022)) and levels of immigration. Third, while Australia and Canada are very similar on many indicators such as GDP per capita and income inequality, Australia has slightly better outcomes on most of the social and economic indicators compared to Canada. One large difference between the countries is that Canada has two official languages (English and French) while Australia has none, although English is the de facto national and official language. We acknowledge this difference but also note that the literature does not suggest that it is relevant for our study or could lead to biased results.
Education systems and contexts
In both countries, states (Australia) and provinces (Canada) are the main providers of schooling, as mandated by their national constitutions (Sellar et al., 2021). Thus, neither country has a national system of education but rather a set of state/provincial systems of education. These regional jurisdictions are responsible for managing and funding public schools. While neither country has a national system of education, the federal government does play a significant role in Australia. The Australian Curriculum, Assessment and Reporting Authority (ACARA) is responsible for developing the national curriculum, administering national standardized achievement testing, and providing public reporting of school achievement (Savage and O’Connor, 2019). By contrast, Canada does not have a national curriculum, national standardized testing, a national reporting of school achievement, or even a national-level ministry or comparable authority for education (CICIC, n.d.).
In the following sections, we describe the educational landscape of each country as it relates to the marketization indicators included in our theoretical framework: choice, privatization, school funding, and public reporting of school performance data.
Australia
School choice is enacted via the public and private school sectors. Students are guaranteed a spot at their local public school but may apply for admission to a non-local public school. Schools generally accept out-of-area students if they have places available, although this is highly restricted in “over-subscribed” public schools in affluent communities. School choice is also enacted via Australia’s very large private sector, which enrolls more than 40% of all secondary school students (Australian Bureau of Statistics, 2020). The private sector is comprised mainly of religiously affiliated schools (e.g. Catholic and Anglican) but also includes non-denominational schools. Enrollments in public and private schools reflect patterns of student SES. On average, schools with the highest mean SES tend to be private Protestant schools, schools with the lowest mean SES are public, and Catholic schools are somewhere in between (Chesters, 2019; Connors and McMorrow, 2015).
Schools receive funding from a variety of sources. Public schools receive most of their funding from their respective state authority based on formulas that account for student characteristics and needs. Due to centralized funding, large between-school differences in funding within states between public schools are not common. All private schools receive public funds from the federal government, and usually from their state government as well. They also charge tuition fees. Fees can range from a few thousand dollars at a local Catholic school to over US$20,000 per year at an elite Anglican school. Even high-fee private schools receive substantial public funding. These funding policies have led to large disparities in per-pupil student resourcing between schools (Connors and McMorrow, 2015).
Both public and private schools are required to teach the national Australian curriculum and to participate in the National Assessment Program—Literacy and Numeracy (NAPLAN). NAPLAN is administered to all students nationwide in Years 3, 5, 7 and 9. School aggregate results are publicly reported through ACARA’s website (myschool.edu.au).
Canada
Canada’s K–12 education is organized in a federal system. Its 10 provinces govern their own systems, determining various educational policies, curriculum, staffing, and funding. Nationwide, 91% of students attend a public school (Statistics Canada, 2011). The provinces of British Columbia and Quebec have the highest proportions of students enrolled in private schools (13% and 10%, respectively), followed by Ontario and Manitoba (7% each).
In the public sector, most schools have catchment zones, and students who live within those zones get priority in enrollment. Pending provincial and district policies, schools may accept out-of-catchment students if they have vacancies or if they are schools of choice. Many public school districts offer specialized programs such as French immersion, STEM or the International Baccalaureate as a mechanism for increasing school choice (Yoon, 2016).
Furthermore, in three of the ten Canadian provinces (Alberta, Ontario, and Saskatchewan), there are separate public Catholic school boards. These schools are funded by taxation, and are generally unionized. These three provinces comprise approximately 54 percent of the Canadian population. Approximately 30 percent of all public school students in the largest province of Ontario attend a Catholic school (Van Pelt et al., 2005). In the rest of the seven Canadian provinces, Catholic schools are operated by independent (private) boards. Most of the Catholic schools receive partial funding for operating costs (e.g. up to 50% in British Columbia) from provincial authorities and charge tuition fees (OECD, 2011b).
The private school sector includes non-Catholic faith-based schools, as well as secular or alternative philosophy and curriculum-based schools. Historically, elite families from Britain in the late 19th and early 20th centuries established exclusive fee-based (single-sex) schooling for their children as a way to reproduce their class privilege, and these establishments continue to provide exclusive private schooling options (Barman, 1991). Most independent schools receive some public subsidies but also charge fees. Similar to Australia, in Canada, the average SES of students attending private or independent schools is higher than those who attend public schools (OECD, 2011a).
While Canada does not have a national curriculum, it does have a national standardized assessment, known as the Pan-Canadian Assessment Program (PCAP). The test is designed to compare how students are achieving in reading, mathematics, and science, and it is not used to compare individual schools. Provinces also administer their own standardized assessments, which are then used to varying degrees for public reporting of school performance. In some provinces, such as Ontario, school comparisons are fairly simple, such as the proportion of students who meet the minimum standard. Other provinces do not provide any public reporting of school performance. The Fraser Institute, a non-governmental organization whose motto is “a free and prosperous world through choice, markets and responsibility” (www.fraserinstitute.org), publishes an annual league table ranking of schools in the nation’s four most populous provinces.
Summary
In general, opportunities for practicing school choice in the public, secular school sector are similar in both countries. Likewise, school choice via Catholic schooling is widespread in both countries but may be limited to students from the Catholic faith. Options for practicing school choice within the private sector are more numerous in Australia than in Canada, simply because there are many more private schools from which to choose.
However, the infrastructure for enabling competition between schools appears to be significantly more developed in Australia than in Canada. School funding mechanisms in Australia create larger between-school disparities, the large number of fee-charging private schools creates a form of competition (and exclusion), and the sophisticated public reporting of school performance promotes competition between schools.
In terms of equity seeking groups, Canada and Australia are similar. The main students who suffer educational disadvantage in both countries are students from low SES backgrounds, students from Indigenous/First Nations background, and students who reside in rural and remote communities (Echazarra and Radinger, 2019; OECD, 2019b; Richards, 2020; Sullivan et al., 2018; Thomson et al., 2019). Immigrants in Australia and Canada come from similar backgrounds, with minimal achievement gaps between immigrant and native-born students in either country (Schleicher, 2006; Shapira, 2012).
Method
We use a causal-comparative research design for our study as it best meets the conditions of our data and research questions. As explained by Brewer and Kubn (2010), the causal-comparative research design is useful for examining cause-effect relationships when two or more groups of non-randomly assigned participants are compared and the variables are not possible to manipulate. A causal-comparative approach is useful for identifying possible causes for noted differences in an outcome variable between two groups (Fraenkel et al., 2012). In our study, we are interested in examining the causal effect of marketization policies on educational equity and effectiveness in two comparison groups (Australia vs Canada) and to offer explanations in PISA achievement scores between the two countries. Causal-comparative research cannot establish causality with the same confidence as an experimental study, but causal inference can be logically argued with a persuasive theoretical framework, similar to correlational research (Fraenkel et al., 2012). Another feature of the causal-comparative design is that descriptive statistics (especially cross-tabulations) are often used to compare group means of relevant variables (Fraenkel et al., 2012).
As is common in macro comparative sociological research (Bollen et al., 1993) and the field of comparative education (Manzon, 2011), we use the nation-state as our unit of analysis. With a careful attention to minimizing omitted variable bias by choosing cases that are similar on key dimensions, cross-national comparative research can be powerful for identifying broad theoretical insights (Ragin, 1987). Our rationale for using the nation as the unit of analysis is that educational policies, structures and institutions often vary more between countries than within them (Woessmann, 2016). This is certainly the case for Australia, although we acknowledge somewhat less so for Canada. And while it is true that neither Australia nor Canada has one national system of education, comparative analyses of educational phenomenon between the two countries are more frequently done at the national level rather than province/state/territory level. This is likely because conducting a comparative analysis of all jurisdictions and political divisions in the two countries would include 21 cases (eight political divisions in Australia and 13 in Canada), which is too large a sample for our research design to uncover meaningful patterns. It also would not allow us to control for key dimensions, such as poverty, as these vary across jurisdictions within each country, and would thus violate one of the requirements of case selection in a causal comparative study. Other studies could use different designs (and thus different research questions) using state/territory/province level data to shed further light on our findings.
Our analysis is guided by the theoretical framework outlined earlier. We use data from the Program for International Student Assessment (PISA), which has been administered every 3 years since 2000 by the Organisation for Economic Cooperation and Development (OECD). Rather than testing students’ knowledge of a taught curriculum, PISA measures 15-year-old students’ ability to solve problems in the domains of literacy, mathematics and science that individuals in economically developed countries would typically encounter in daily life. PISA uses a nationally representative sample for each country and all 34 OECD countries participate, along with several non-member countries. PISA is considered a high-quality data set for making cross-national comparisons. In addition to the academic proficiency variables, PISA also collects a wide range of information from students and school principals about items that may predict student academic achievement. We use data from multiple cycles of PISA, as this allows us to identify long-term trends. The PISA data sets for Australia and Canada are large. For example, the Australian data set for PISA 2009 includes 14,251 students and 353 schools and the Canadian PISA 2009 data set includes 23,207 students and 978 schools.
For the first part of our analysis, we show the extent of marketization policies in Australia and Canada. We use data from participating school principals about their school admission policies, the number of schools that compete for students in their area, and the proportion of students that attend a private school. These values are included in the PISA data tables that are annexed to the OECD reports.
We then report several measures related to the school sorting of students by SES. These include measures of social integration and isolation. A socially mixed or average school is operationalized in PISA as a school in which the mean SES of the school (i.e. the mean SES of all students in the school who participated in PISA) is within one standard deviation of the mean SES for participating students from the entire country. The SES variable in PISA is named economic, social and cultural status (ESCS) and comprises parental education, parental occupational status, and a wide range of educational, cultural, and material resources within the home.
Next, we conduct a secondary analysis of PISA 2009 and 2018 to examine the stratification of human and material resources between schools of varying socioeconomic compositions. Due to changes in underlying questions most indexes from 2009 are not directly comparable to indexes in 2018. We first calculated the mean socioeconomic composition (i.e. mean school SES) of each school by averaging the individual ESCS values for all participating students in the school. We then divide schools into quartiles by mean SES. For each school SES quartile, we calculate means for 14 indexes about students’ and principals’ perceptions of school resources, teachers and learning environments. PISA creates these indexes based on principals’ and students’ responses. All indexes are scaled within a range of −1 to 1, with the OECD mean at 0 and larger values indicating more positive responses. We used the school and student weights included in the PISA data set when calculating means for each index. Items for each index are listed in the Supplemental Appendices.
In addition to calculating means for each school SES quartile on the seven indexes related to learning environments, we also measure whether between-school differences in each country are educationally significant. We do this by converting the difference between the first and fourth quartile school means (for each index) into an effect size (by dividing the difference between the means by the standard deviation). As is the convention in reporting education treatments, we consider an effect size above .25 as at least small but substantial, with values around .5 as being a medium effect, and those in the area of .75 being a large effect (Slavin and Fashola, 1998). Slavin and Fashola (1998) argue that effect sizes of .25 and higher are “educationally significant,” meaning that they are large enough to warrant attention. This is especially the case when we conceptualize education as a complex ecosystem; small “ripples” here and there can accumulate and interact to create large impacts. Moreover, Kraft (2020) has shown that effect sizes in education are routinely much lower than in the clinical sciences, and concludes that effect sizes of .2 or higher are “large” in educational research.
Finally, we compare the mean reading performance score for student SES across four PISA cycles (2009, 2012, 2015, and 2018). These values are calculated by PISA and as such utilize the complex replicate weight and plausible values procedure required for estimating accurately student academic performance and standard errors (OECD, 2009). We chose reading performance as reading is a foundational skill that is essential for both active citizenship and learning across the entire lifespan (Farrell et al., 2022). We limited our analysis to reading performance, but note that the performance on PISA by student SES does not vary across the three main subject domains (Lee et al., 2019; OECD, 2010a). We also note that in Australia at least, between-school variance on PISA is greater for math than reading performance (Ainley et al., 2022), suggesting that our results may be more muted than they would have been if we had chosen math as the main outcome variable. Future research could test the robustness of our findings by conducting similar analyses with the other PISA domains of mathematics and science literacy.
Results
In this section, we present indicators for the four stages of our theoretical framework. Indicators from the first two stages (marketization and segregation) are presented in Tables 2 and 3.
Comparison of marketization indicators (school choice, competition, and privatization).
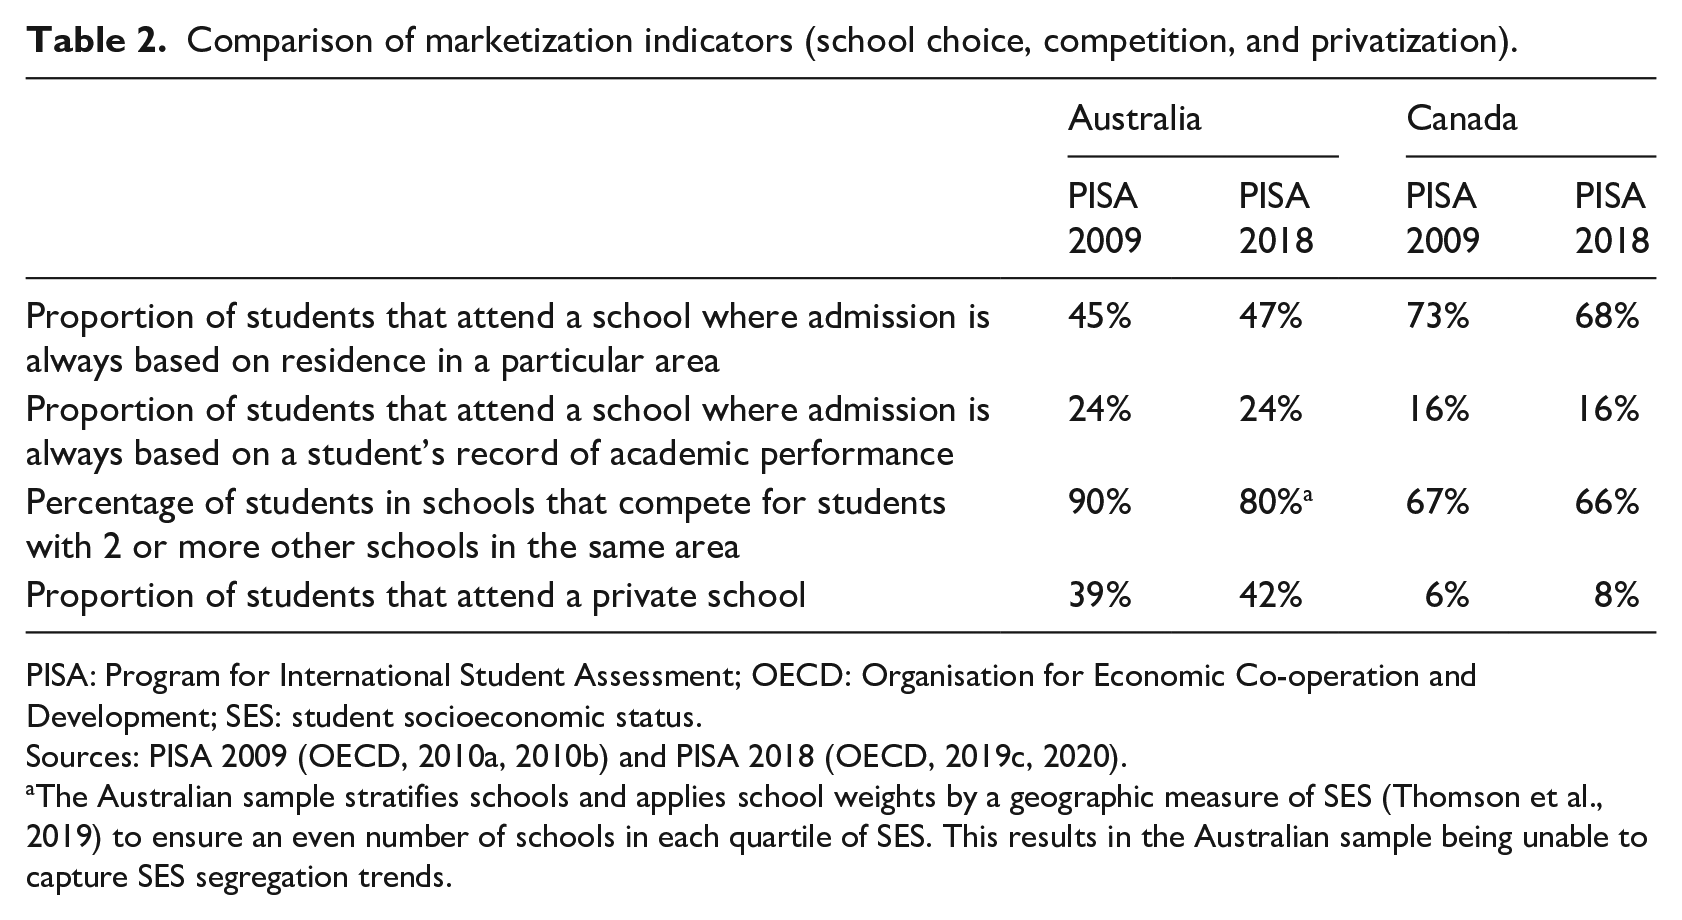
PISA: Program for International Student Assessment; OECD: Organisation for Economic Co-operation and Development; SES: student socioeconomic status.
Sources: PISA 2009 (OECD, 2010a, 2010b) and PISA 2018 (OECD, 2019c, 2020).
The Australian sample stratifies schools and applies school weights by a geographic measure of SES (Thomson et al., 2019) to ensure an even number of schools in each quartile of SES. This results in the Australian sample being unable to capture SES segregation trends.
School socioeconomic segregation and sorting of students.
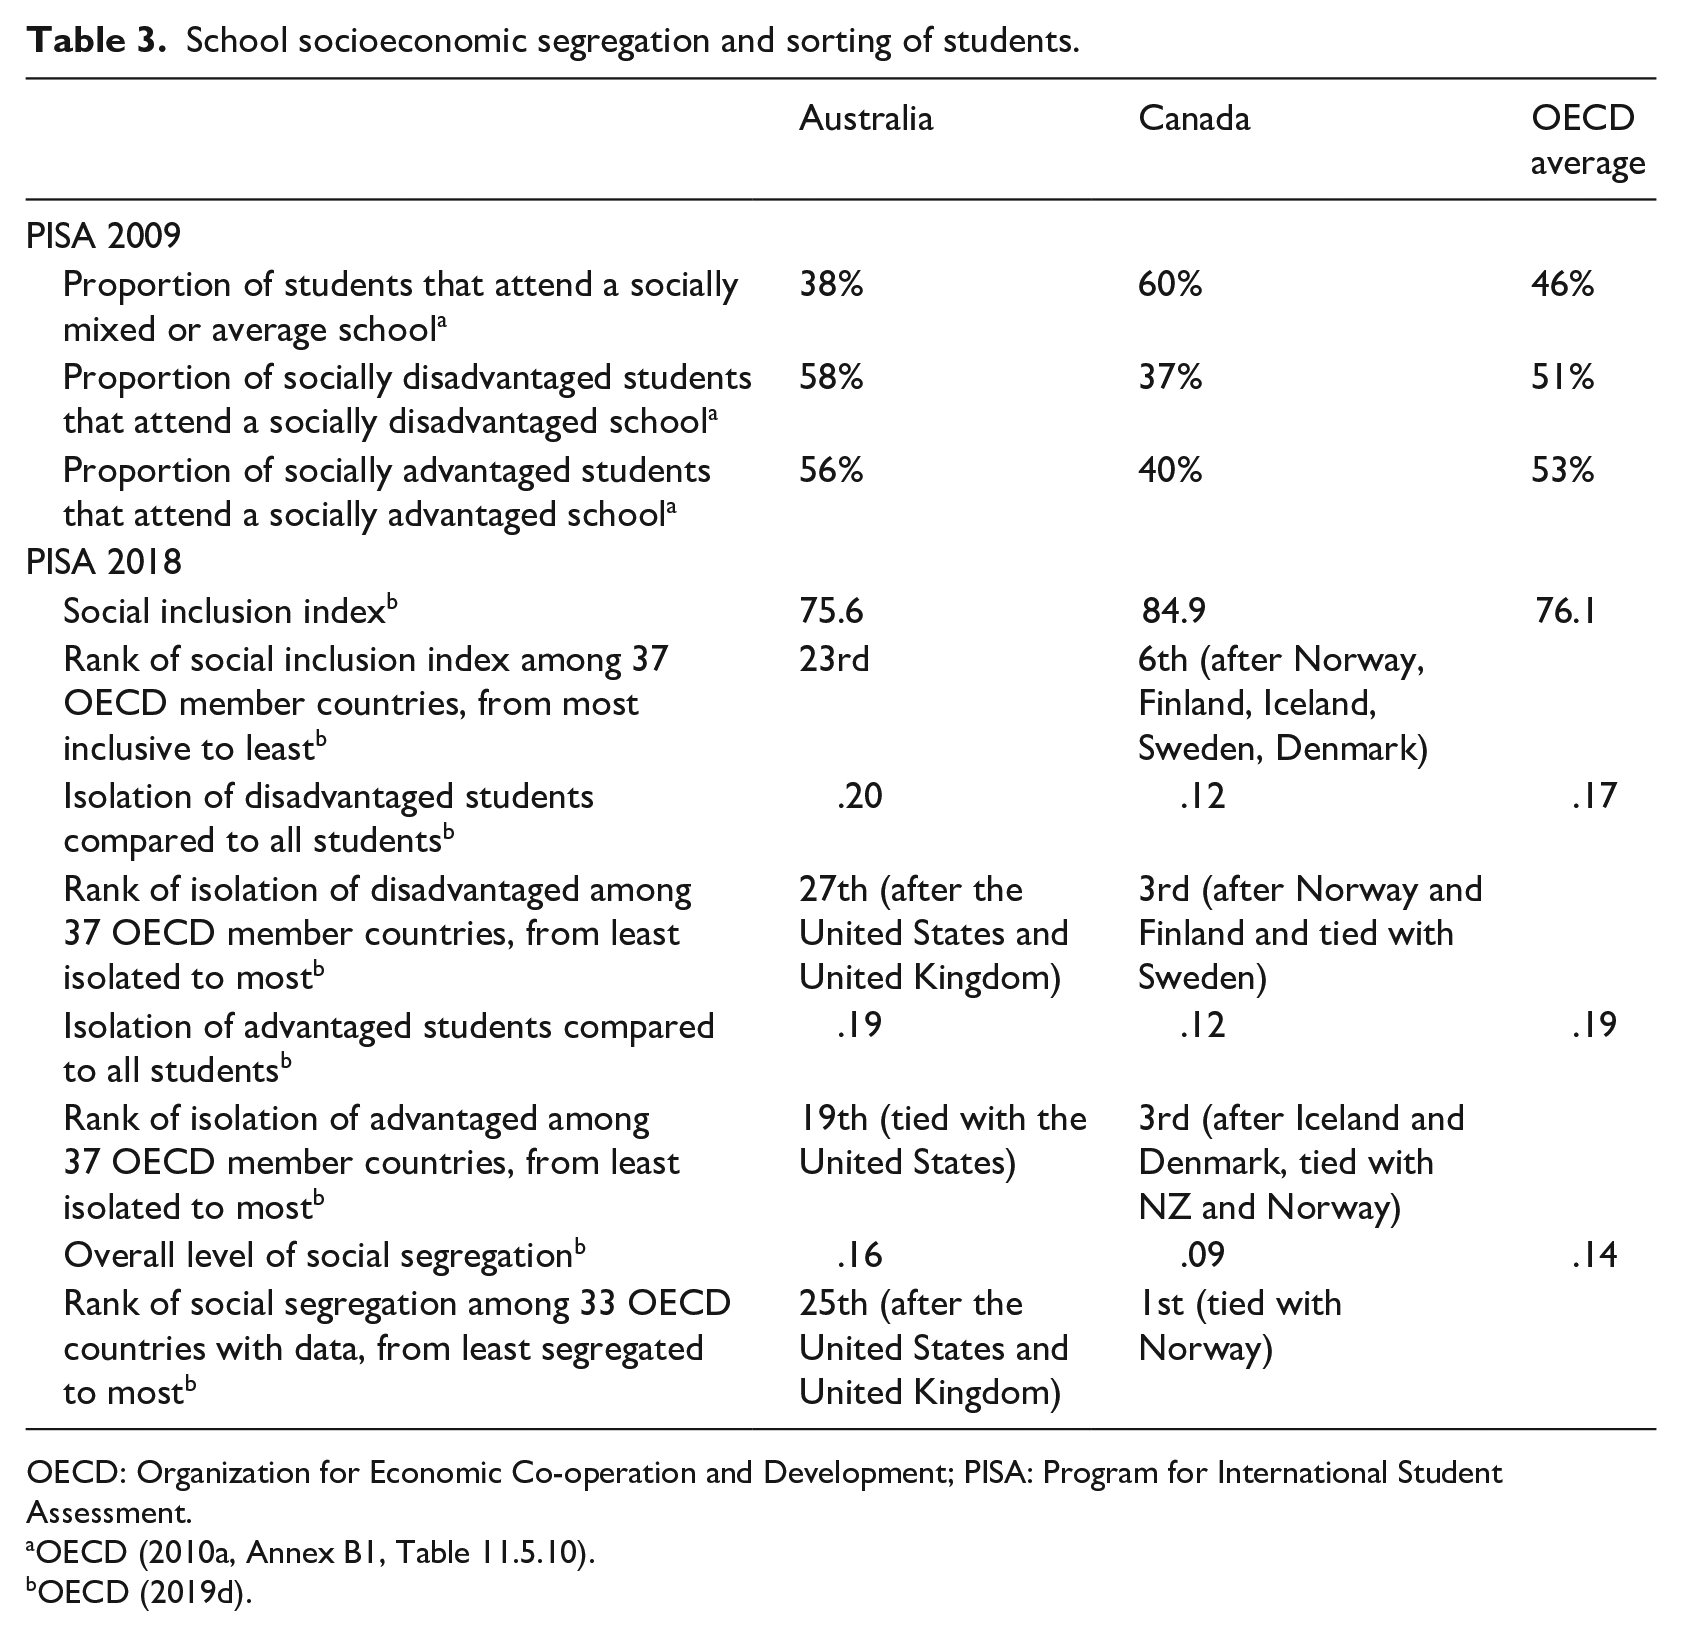
OECD: Organization for Economic Co-operation and Development; PISA: Program for International Student Assessment.
OECD (2010a, Annex B1, Table 11.5.10).
Insights about the degree to which school choice is available in Australia and Canada can be gained by examining whether school admission is based on local residence. In education systems where most schools only accept local students, opportunities to practice school choice are limited. As can be seen from the table, local residence requirements are much more common in Canada than in Australia, suggesting that opportunities for exercising school choice are fewer. This finding is probably because local residence is not a key admission criterion for private schools, and, as can also be seen in the table, the proportion of students attending private schools is substantially larger in Australia than Canada. Competition between schools for students is thus substantially higher in Australia than in Canada. In fact, it is the highest of any OECD member country (OECD, 2010b).
The second stage of our hypothesis is that marketization is positively related to school segregation. Specifically, our framework suggests that higher levels of school choice, competition and privatization are associated with higher levels of school socioeconomic segregation. As suggested by our theoretical framework and exploratory hypothesis, school segregation is higher in Australia than in Canada. These findings are presented in Table 3. In PISA, socially advantaged students are placed in the top quarter of ESCS in their country, and socially disadvantaged students are in the bottom quarter (OECD, 2019d). Similarly, socially advantaged and disadvantaged schools are those in the top and bottom (respectively) quarter of the distribution of the school-level ESCS in their country (OECD, 2019d). The index of social inclusion represents the intra-class correlation of ESCS and ranges from 0 to 1, with higher values representing greater inclusion (OECD, 2019d). The isolation index measures whether particular students (i.e. advantaged and disadvantaged students) are more concentrated in some schools. The index is related to the likelihood of these students to be enrolled in schools that enroll students of another type. It ranges from 0 to 1, with 0 corresponding to no segregation and 1 to full segregation. The overall level of segregation is an index calculated by PISA to measure socioeconomic diversity at the country level is mirrored at the school level (OECD, 2019d). It ranges from 0 (no segregation, an even distribution of students from ESCS quarters across schools) to 1 (full segregation, equating to no schools in a country enrolling students from different ESCS quarters).
Socially advantaged students are much more likely to attend a school with similarly advantaged peers in Australia than are their counterparts in Canada. Overall, students in Canada are nearly 1.6 times more likely to attend a socially mixed or average school than are those in Australia (60% vs 38%). Indeed, the proportion of students that attend a socially mixed or average school in Australia is one of the lowest among all OECD countries (OECD, 2010a). The measures from PISA 2018 show similar patterns, with Canada showing low levels of segregation compared to other OECD member countries, and Australia have average or higher than average levels of segregation.
We examine between-school inequalities in seven dimensions of school environments in Table 4. These dimensions are teacher behaviors, quality of educational resources, and teacher shortages from the 2009 cycle, and teacher behaviors, shortages of educational staff, shortages of educational materials, and student behaviors hindering learning from the 2018 cycle. We compare means for these seven dimensions for Australia and Canada, disaggregated by school SES. We also show whether inequalities between low and high SES school quartiles are educationally significant. As described earlier, an effect size of .25 or higher is considered substantive and therefore educationally significant.
Principal perspectives of school environments, by school socioeconomic composition.
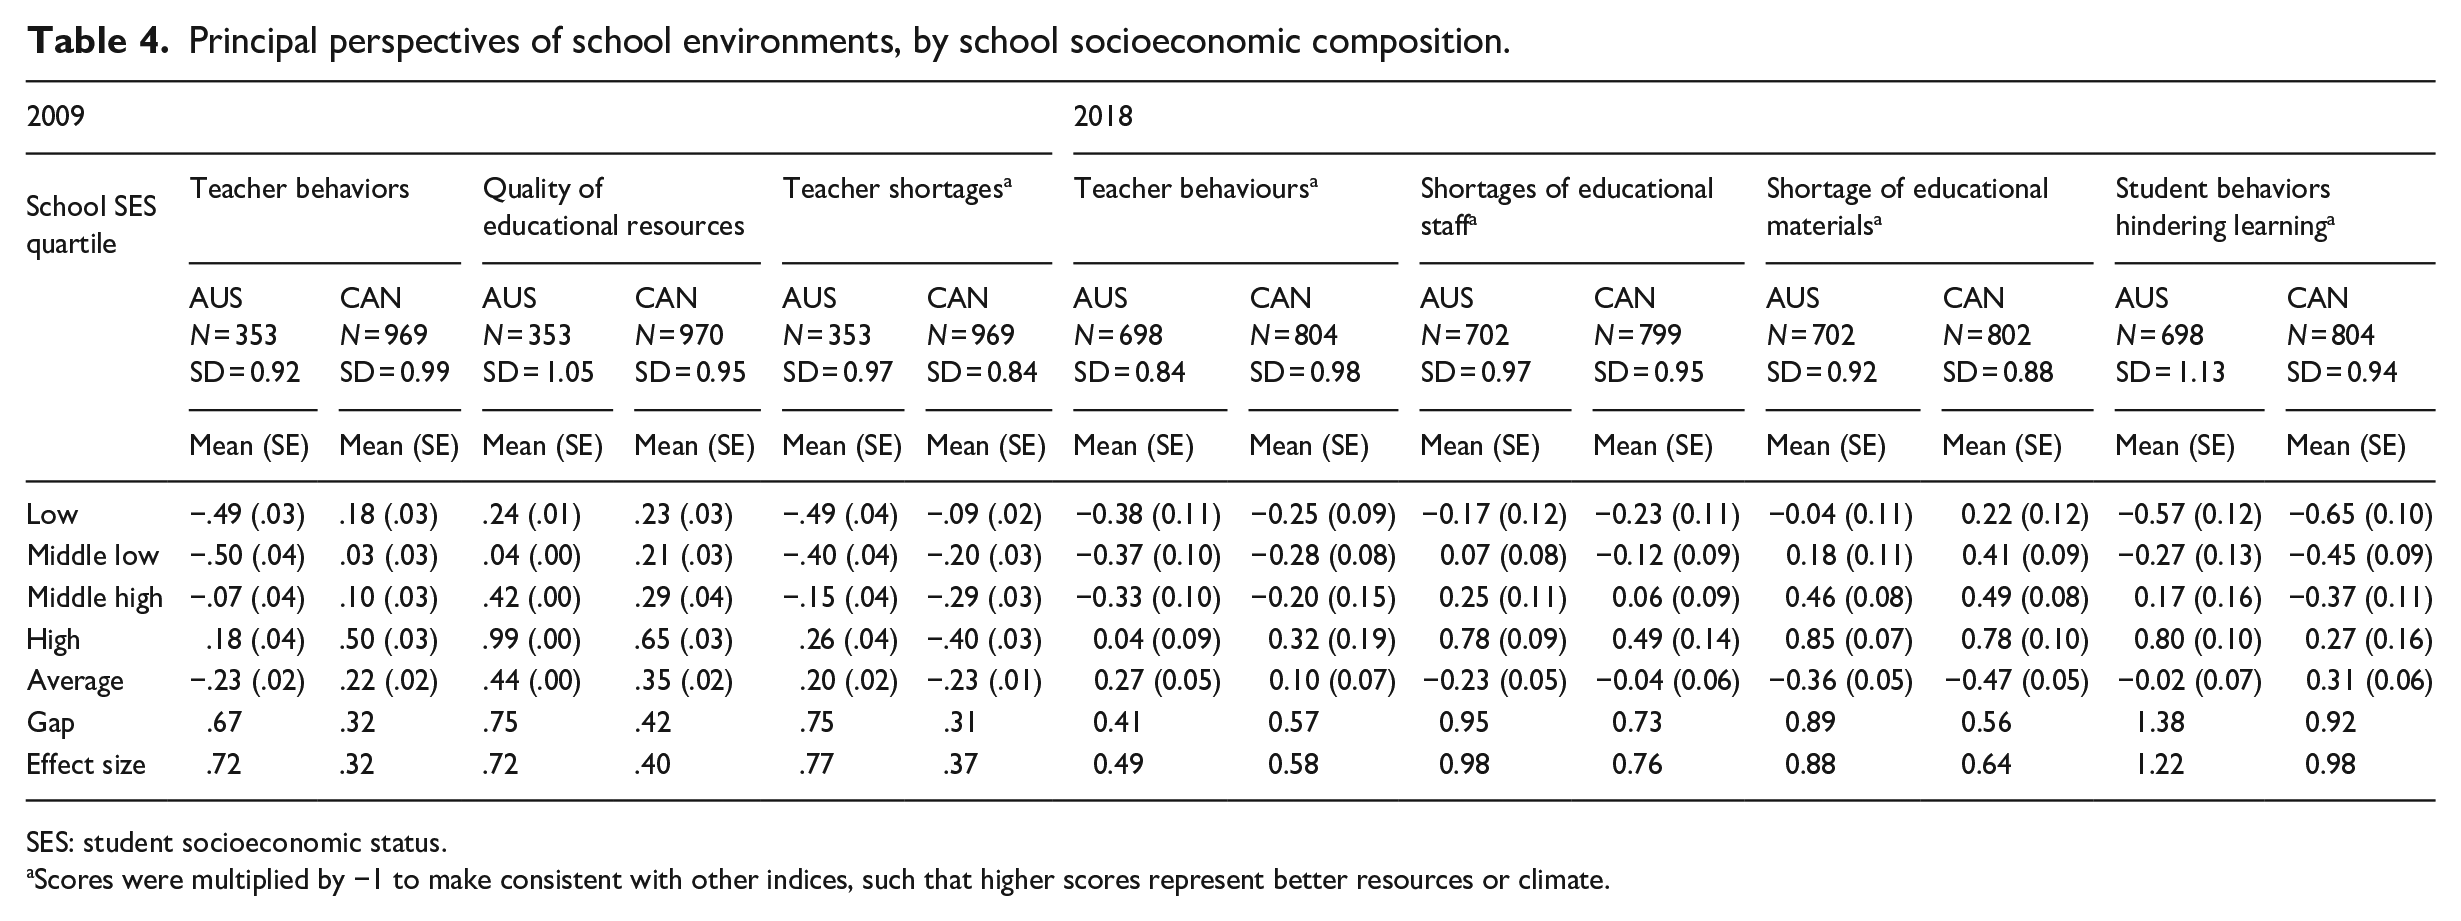
SES: student socioeconomic status.
Scores were multiplied by −1 to make consistent with other indices, such that higher scores represent better resources or climate.
Principals’ perspectives of their respective schools’ learning environments vary, as predicted, with lower SES schools having less positive school contexts and climates compared to higher SES schools. This relationship holds true in both countries. In six out of seven indexes, principals rated school contexts and climates more positively in Canada than in Australia. Differences between low and high SES school quartiles on all seven indexes are educationally significant in both countries with six instances being large. The between-school differences are especially large in Australia—effect sizes of .98 SD (shortages of educational staff, 2018) and 1.22 SD (student behaviors hindering learning) are enormous. The between-school differences are 1.2 to 2.3 times larger in Australia than in Canada. Notably, the largest difference between the two countries is the degree of teacher behaviors.
We next examine students’ perspectives of their teachers and classrooms, once again disaggregated by school SES. Table 5 reports means for the seven student-derived indexes. As expected, high SES schools mostly enjoy more positive contexts and climates than do low SES schools, though in most Canadian indexes there is a miniscule difference between high and low SES schools. On all seven indexes, low SES schools in Canada have more positive values than their counterparts in Australia. Between school differences are not educationally significant in Canada on any of the seven indexes, while in Australia they are educationally significant for four of the indexes.
Student perspectives of their teachers and learning environments, by school socioeconomic composition.
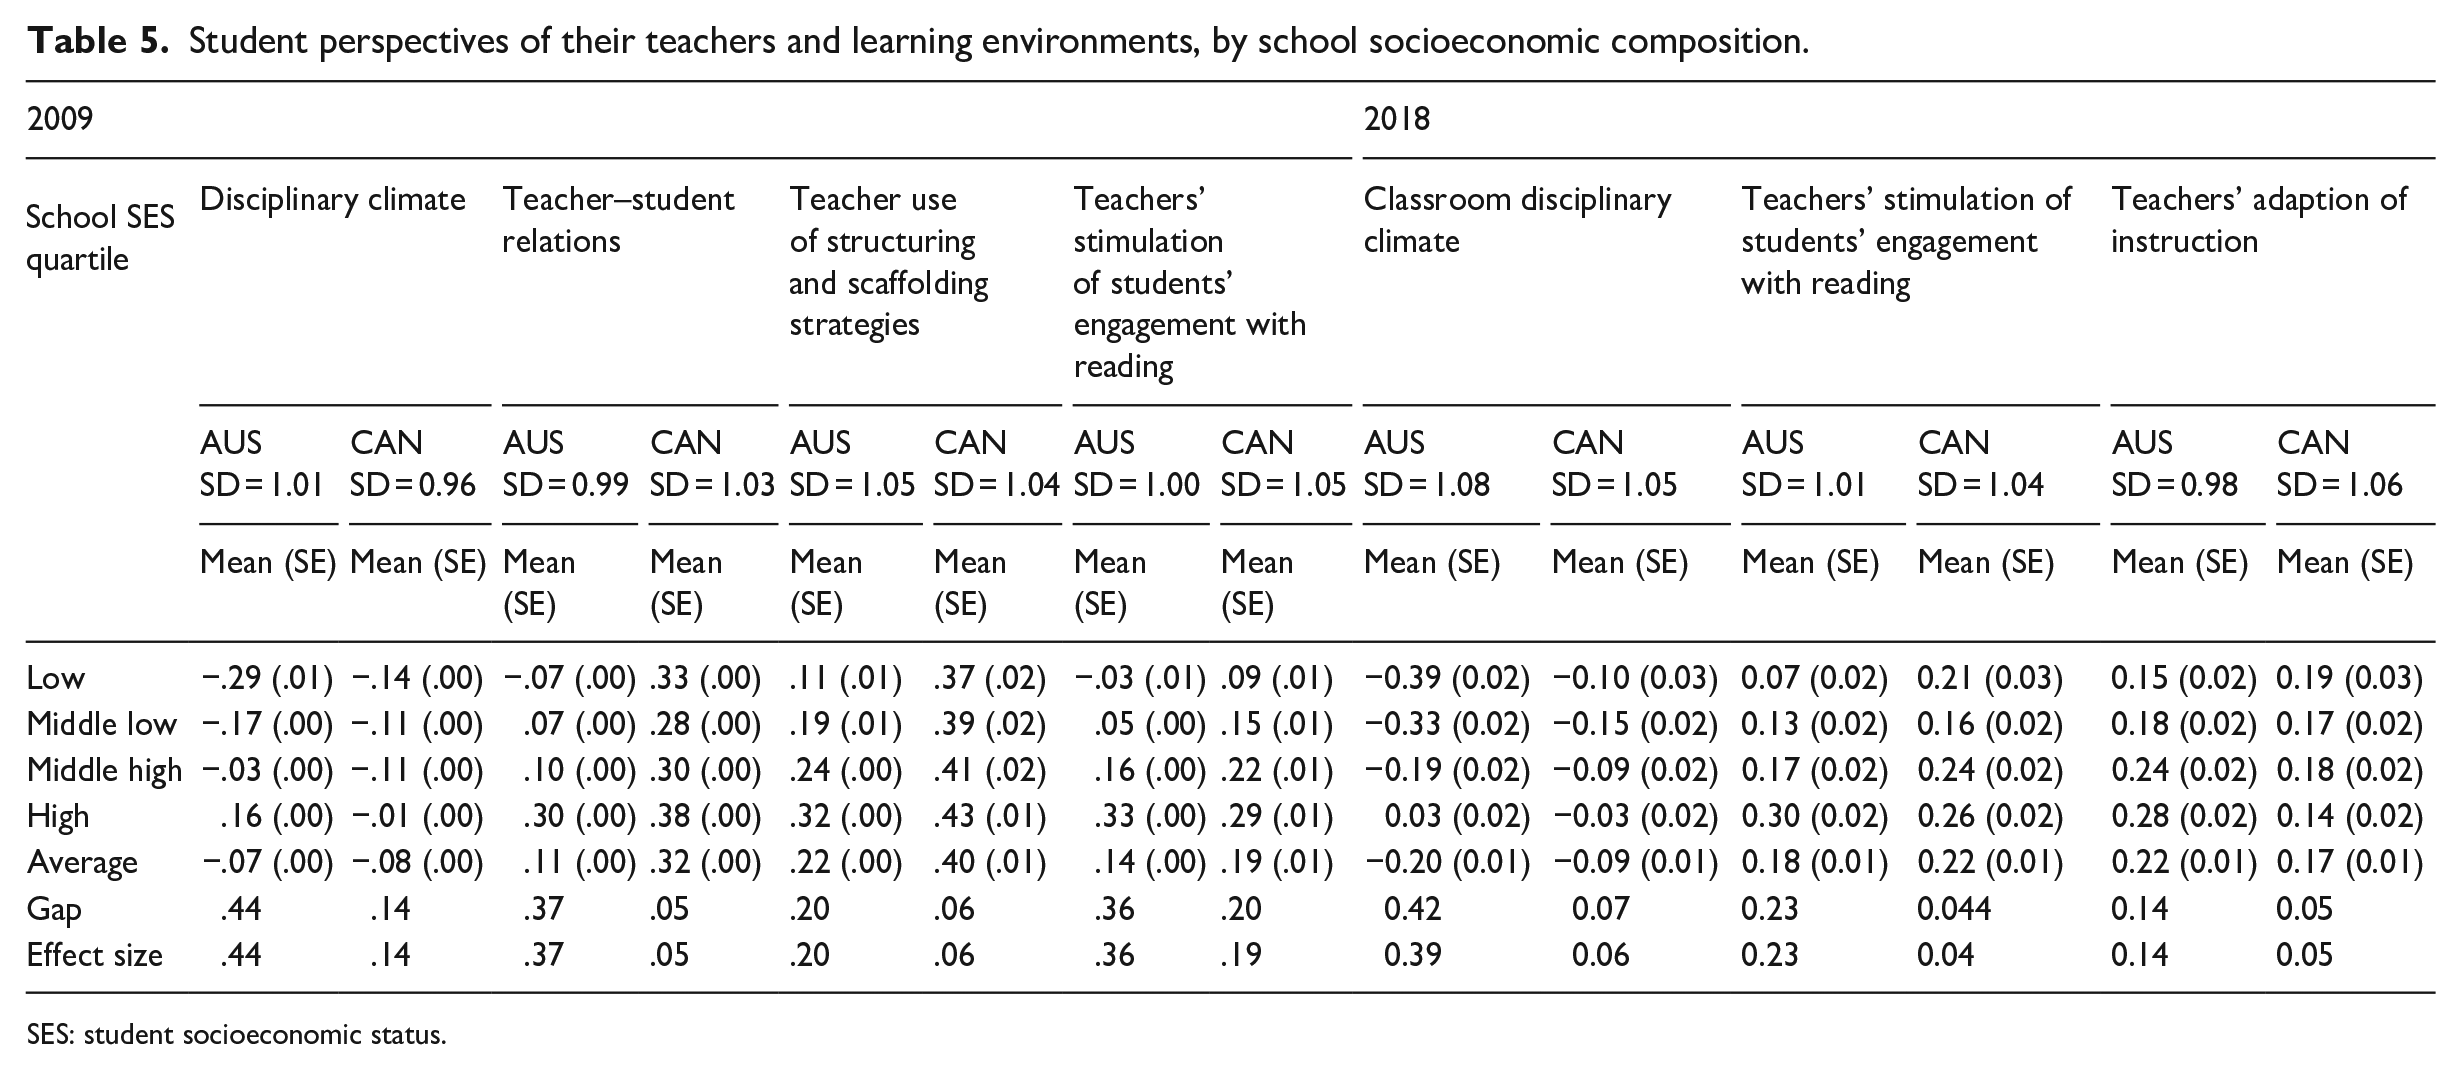
SES: student socioeconomic status.
For the final stage of our analysis, we compare average reading performance disaggregated by student SES quartile. We hypothesize that marketization is associated with higher levels of school segregation and resource stratification, which in turn is related to larger inequalities by student SES. Table 6 compares average reading performance on four PISA cycles, disaggregated by student SES. As can be seen in Table 6, reading performance is strongly related to student SES in both countries. The achievement gap between low and high SES students is large in both countries. PISA performance scores are scaled so that one standard deviation equals 100 points; this in turn is roughly equivalent to 2 years of schooling (Thomson et al., 2011). Thus, the student SES achievement gap represents approximately 1.3 school years in Canada and 1.8 school years in Australia.
Inequalities of reading performance by student SES.
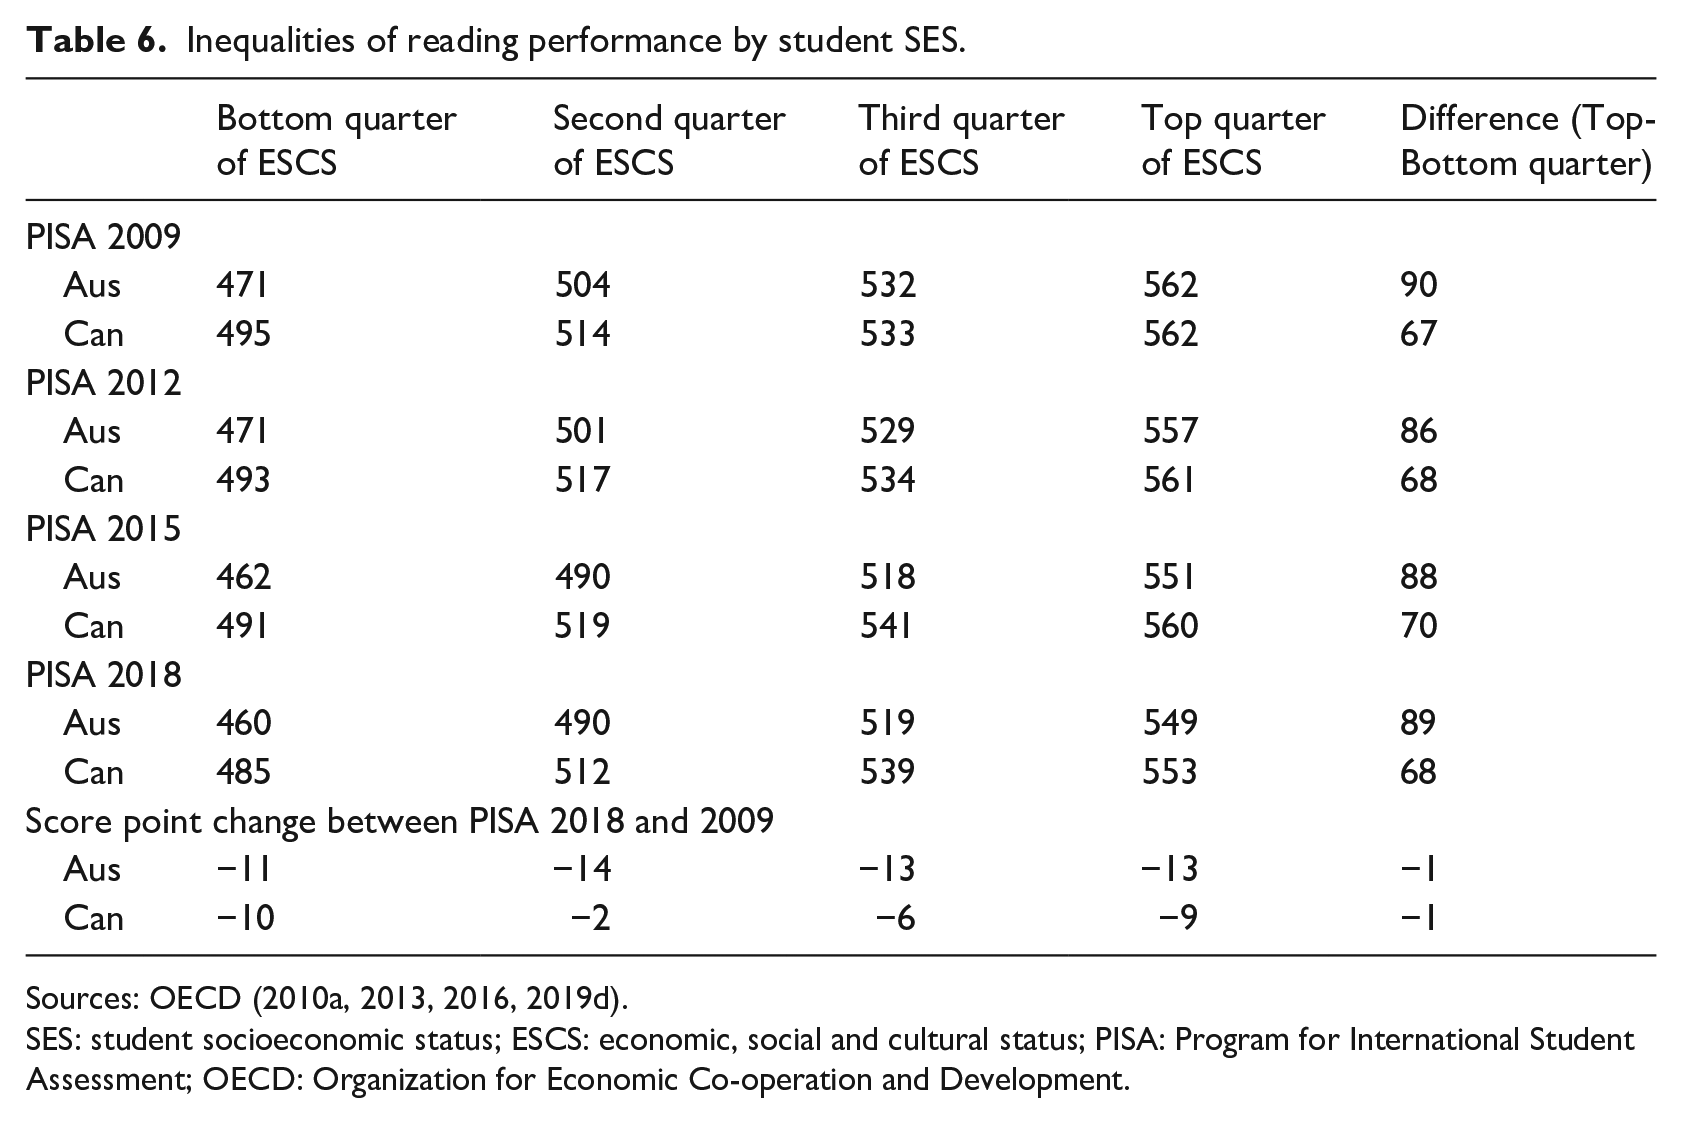
Sources: OECD (2010a, 2013, 2016, 2019d).
SES: student socioeconomic status; ESCS: economic, social and cultural status; PISA: Program for International Student Assessment; OECD: Organization for Economic Co-operation and Development.
The second finding of interest in this table is that the performance of middle-high and high SES students is the same in both countries, but the performance of low SES students is substantially higher in Canada. Across all four cycles, students in the bottom SES quartile score more than 20 points less in Australia compared to peers from a similar social background in Canada. This is a meaningful difference, as 20 score points is approximately an effect size of .2 and roughly equivalent to .5 to 1 year of schooling (OECD, 2019c). However, students in the highest SES quartile have very similar scores in the two countries. These two facts mean that the performance gap between low and high SES students is substantially larger in Australia than in Canada. This larger inequality is not off-set by a higher achievement for the most socially advantaged students. In other words, equity for the lowest SES students does not come at the cost of reduced achievement for the highest SES students. This is an important, and hopeful, finding.
Discussion and conclusion
This study draws upon a theoretical framework that posits a link between marketization policies and school social segregation, leading to inequalities of learning environments and outcomes. Using this framework, we examined education systems from two “like” countries. These two countries provide an ideal contrast for examining the impact of marketization on educational equity and efficiency.
Our findings suggest that marketization is indeed linked to higher levels of school segregation, which in turn are related to greater between-school stratification of human and material resources between schools. These in turn are related to substantially lower academic performance for socially disadvantaged students, but without any corresponding gain for socially advantaged students. We believe this is an important finding as it counters the argument that school social integration harms privileged students. Our findings suggest that this not be the case.
As we have shown, from these data, it does not appear that the lower performance of Australia’s socially disadvantaged students can be blamed on poverty or other societal or cultural factors. Compared to Canada, Australia has similar if not better indicators related to social and economic well-being. Similarly, both countries have been able to successfully integrate immigrants, with Australia perhaps even have an edge over Canada (Rajadurai, 2018). And while the rural-urban achievement gap on PISA is greater in Australia than in Canada (Sullivan et al., 2018), it is not due to social or cultural factors as the average SES of students who attend rural schools is similar in both countries (Sullivan et al., 2018). Nevertheless, the larger rural-urban achievement gap in Australia may be related to the tradition of many wealthy rural families to send their children to board at high-fee private schools in major cities (Beswick et al., 2022; Stokes et al., 2000), a phenomenon that is promoted via educational marketization with consequences for school segregation and stratification. It is also quite plausible that rural education markets have higher levels of school choice and competition in Australia than in Canada. In this scenario, the average SES of students who attend rural schools may be the same in both countries, but between-school socioeconomic segregation is greater in rural Australian communities due to higher levels of school choice and competition. Future research could test this hypothesis.
Rather than sociocultural factors, our findings in light of our theoretical framework suggest that the way in which education systems are organized and students are distributed across schools may very well be important considerations. Australia has the highest level of competition between schools of any OECD member country (OECD, 2010b), as promoted by a range of education policies. These policies include allowing families to apply to non-local public schools, providing private schools with public subsidies, allowing substantial funding disparities between schools, and providing public comparisons of school achievement data as a mechanism for informing parental choice. These policies enable and encourage the choice mechanism, but are also linked to large differences between schools. And when there are substantial qualitative differences between schools—for example, that some have better resourcing, facilities, teaching staff or “good” students—many parents feel compelled to choose a non-local school. This in turn appears to lead to higher levels of social segregation between schools, thereby perpetuating a negative spiral. Canada has also embraced school choice, but not to the same extent. Moreover, it has buffered the negative, segregating aspects of choice by generally avoiding policies that promote competition—that is, the impacts of choice may be exacerbated by inducing schools to compete for students, since they may use their autonomy to avoid serving certain students (Lubienski and Yoon, 2017). Canada does not have a national system of publicly reported school performance data used for consumer-style school shopping, nor does it use public funds in a way that allows substantial per-pupil funding differences across schools in any given province. The fact that Catholic schools are funded publicly and do not charge fees in some provinces may also be key and is worthy of further study.
It is possible that students from low SES backgrounds have higher achievement in Canada than in Australia in part because their teachers have superior skills and training. Data from PISA indicate the proportion of teachers with a Master’s degree is very similar between the two countries (18% in Canada and 19% in Australia; OECD, 2020). We note, however, that Australia has a 12 percent gap between high and low SES schools in the proportion of teachers with a Master’s degree, compared to no difference in Canada (OECD, 2020). Whether teachers in Canada are more effective than in Australia would be difficult to measure and to our knowledge has not been done empirically. The possibility cannot be ruled out entirely, although one might expect that any advantages of a more educated teaching force would not impact low SES students alone. Our findings about teachers’ instructional strategies suggest, however, that differences between Australian and Canadian teachers are not likely to be large. We also note that Master’s degree qualifications are not strongly related to teacher efficacy (Hanushek and Rivkin, 2004), and teacher “quality” is not a large predictor of PISA scores (Carnoy et al., 2016).
Rather than the quality or effectiveness of teachers, these data, in light of past research, suggest that lower SES students do better in Canada than in Australia because they are more likely to attend a socially integrated school. School socioeconomic composition is an even larger predictor of student academic achievement than individual SES (OECD, 2010a, 2013; Sirin, 2005), which in turn explains a much greater share of the variance in student achievement than do in-school factors (American Statistical Association, 2014; Lubienski and Lubienski, 2014). Our findings suggest that school social integration may be promoted by reducing qualitative differences between schools.
Certainly choice is now a part of the educational landscape, and few in these countries or in most countries of the world would argue that it should be turned back. And as noted by Sasiwuttiwat and Tangkitvanich (2019) in the case of the Netherlands, it can also be associated with educational effectiveness. The key policy insight is that school choice that is promoted via horizontal differentiation (e.g. curriculum offerings, programs or philosophies that vary between schools) rather than vertical stratification (e.g. large inequalities between schools in their resources and facilities) can co-exist with educational equity and effectiveness. But marketization policies that promote an inequitable distribution of human and material resources, as is done in Australia, are problematic from both an equity and effectiveness perspective.
Supplemental Material
sj-docx-1-cos-10.1177_00207152241227810 – Supplemental material for The impact of marketization on school segregation and educational equity and effectiveness: Evidence from Australia and Canada
Supplemental material, sj-docx-1-cos-10.1177_00207152241227810 for The impact of marketization on school segregation and educational equity and effectiveness: Evidence from Australia and Canada by Laura B Perry, Ee-Seul Yoon, Michael Sciffer and Christopher Lubienski in International Journal of Comparative Sociology
Footnotes
References
Supplementary Material
Please find the following supplemental material available below.
For Open Access articles published under a Creative Commons License, all supplemental material carries the same license as the article it is associated with.
For non-Open Access articles published, all supplemental material carries a non-exclusive license, and permission requests for re-use of supplemental material or any part of supplemental material shall be sent directly to the copyright owner as specified in the copyright notice associated with the article.