
Abstract
Against the background of the worldwide expansion of shadow education, research shows that students from high socio-economic status (SES) backgrounds participate more in shadow education than students from disadvantaged SES backgrounds. We relate these social inequalities in shadow education participation to institutional features of educational systems. More specifically, we argue that the effect of socio-economic background on participation in shadow education will be stronger in countries characterized by high-stakes testing. Using data from the Programme for International Student Assessment for the year 2012 (PISA 2012), we show that higher SES students participate more in shadow education. For three out of four indicators of shadow education, this relationship is stronger in countries that are characterized by high-stakes testing but only when accounting for unobserved country differences.
Introduction
The use of private, out-of-school educational activities has long been distinctive for East-Asian countries, such as Japan, Hong Kong, and South Korea, where the growth and monitoring of these educational activities took off after the Second World War (Hannum et al., 2019). More recently, participation in these educational activities has grown rapidly in countries all over the world—including low-income countries, such as Bangladesh, Cambodia, and Kenia; Eastern European and Central Asian countries; and North America and Western European countries (Bray, 2006; Silova, 2010). Private educational activities that occur outside formal education and that aim to enhance a student’s educational achievement are commonly referred to as “shadow education” (Mori and Baker, 2010; Stevenson and Baker, 1992). Shadow education (SE) may take on different forms, including cram schools, one-to-one private tutoring, and examination preparatory courses. Despite cross-national variation regarding its scale, nature, and (historical) dynamics, SE is increasingly a worldwide phenomenon (Bray, 2006; Mori and Baker, 2010).
The expansion of SE may increase social inequalities in education (Bray, 2011, 2013; Buchmann et al., 2010). In various countries, students from high socio-economic status (SES) backgrounds participate more in SE than low-SES students (e.g. Buchmann et al., 2010; Davies, 2004; Park et al., 2016; Smyth, 2009; Stevenson and Baker, 1992). Common explanations are that higher SES parents are not only better equipped to pay for these supplementary learning activities, but also have more knowledge on how educational institutions work and are more intensively involved in their children’s educational career (Buchmann et al., 2010; Park et al., 2016). Although prior research indicates that participation in SE has heterogeneous effects (Choi and Park, 2016) and its “effectiveness” depends on various factors—such as the quality of instruction, student motivation, and the national context (Bray, 2006)—SE generally improves a student’s future educational opportunities and performance (Dang and Rogers, 2008). Consequently, social stratification in SE participation can be expected to raise educational inequalities.
Besides family background, institutional characteristics of educational systems are connected to the emergence and prevalence of SE. In this regard, “high-stakes testing” is a crucial institutional characteristic. High-stakes tests (HSTs) are standardized and centrally administered examinations with a decisive influence at critical educational transition points (Bray and Kwok, 2003; Hannum et al., 2019; Stevenson and Baker, 1992). The use of national standardized instruments for student certification, tracking, and/or graduation is increasing worldwide (EACEA/Eurydice, 2009; OECD, 2012). As HSTs are accompanied by intense competition for educational opportunities, and tight linkages between student achievement and future educational and occupational opportunities, scholars argue that HSTs fuel the prevalence of SE (Baker et al., 2001; Baker and LeTendre, 2005; Hannum et al., 2019; Stevenson and Baker, 1992).
Nonetheless, findings on the relationship between HSTs and SE are not conclusive. While prior cross-national research indicates that there is no relationship between HSTs and average national SE participation (Baker et al., 2001), single country studies posit HSTs as one of the main determinants producing greater demand for SE (e.g. Bray and Kwok, 2003; Lee et al., 2010; Zhang, 2014). So far, however, most research failed to examine how cross-national differences in institutional characteristics are related to the magnitude of social inequalities in the use of supplementary education in countries (see for an exception the contribution by Entrich, 2020 in this special issue). Consequently, what remains unclear is whether the national presence of HSTs similarly affects the use of SE activities by students from different socio-economic backgrounds.
Against this backdrop, we study the potential moderating influence of HSTs on the relationship between a student’s socio-economic background and SE participation. More specifically, we expect that HSTs fuel the demand for SE among students from higher SES backgrounds. As higher SES parents may be more intensively involved in their child’s educational career and better informed regarding the importance of HSTs (Grodsky, 2010; Park et al., 2011; Smyth, 2009), we argue that the (expected) positive relationship between parental SES and SE participation will be stronger in national educational systems characterized by high-stakes testing. To the best of our knowledge, together with Entrich (2020), we are the first to empirically study the moderating role of HSTs on the relationship between SES and SE participation.
We use data from the Programme for International Student Assessment (PISA) 2012 for 54 countries to study relationships between parental SES, HSTs, and participation in various types of supplementary education. Our results demonstrate that higher SES students are more prone to participate in SE. We find that high-stakes testing amplifies the relationship between parental SES and participation in different types of SE but only when all unobserved country differences are captured by country fixed effects.
Theoretical background
Socio-economic status and participation in shadow education
Both rational action theory and social-cultural reproduction theory offer explanations for variation in participation in (shadow) education across students from different socio-economic backgrounds (Smyth, 2009). Rational action theory views social class differences in educational decisions as outcomes of class-dependent calculations of the costs and benefits associated with continued participation in education. One influential rational action perspective—the relative risk aversion (RRA) mechanism—proposes that students try to avoid downward social class mobility, and this largely determines their educational strategies. That is, all students take their parents’ social status as a reference for their own aspirations (Breen and Goldthorpe, 1997; Van De Werfhorst and Hofstede, 2007). As higher SES students have a higher reference level to ensure this goal of class maintenance, they are more likely to stay in the educational system than their low-SES counterparts with similar educational abilities. Class differences in the relative monetary costs of (shadow) education and in average academic performance levels—and, consequently, in expectations of educational success—further widen class differences in educational attainment (Breen and Goldthorpe, 1997). Although the costs of SE activities vary considerably across countries, SE participation is generally expensive. Lower SES families are often not able to invest in (good quality) SE (Bray, 2013; Smyth, 2009). In addition, lower SES families may be more likely to expect that their children will never get far enough in the educational system to benefit from initial investments at a later stage (Bray, 2006), making investments relatively more costly.
Socio-cultural reproduction theories focus on the unequal distribution of economic, social, and cultural resources across social classes, transmitted over generations (Bourdieu, 1977). With the process of educational expansion promoting social mobility (Breen, 2010), people from high social class backgrounds have to play a more active role in their children’s educational careers to maintain social group boundaries. The use of SE may be one possible strategy for status maintenance among parents from high social class backgrounds (Lynch and Moran, 2006; Smyth, 2009).
More specifically, besides the financial ability to pay for it, participation in SE requires parents to gather information, to choose between various types and providers, and to monitor their children’s progress (Park et al., 2011). Higher SES parents generally have more knowledge on the educational system, and, relatedly, the possibilities and potential benefits of supplementary learning activities (Buchmann et al., 2010). This makes them not only better equipped to make decisions regarding SE than low-SES parents, but they may also attach more value to this type of educational investments (Buchmann et al., 2010; Park et al., 2016; Smyth, 2009).
In this line of thought, SE investments can be seen as part of a wider strategy of “intensive parenting” or “concerted cultivation” (Lareau, 2003); a way of upbringing that is focused on the enhancement of children’s educational success that is typically more found among families from high social class backgrounds (Buchmann et al., 2010; Byun et al., 2018; Park et al., 2016). Higher SES parents attach greater importance to academic performance, value a cognitive environment for their children, and closely monitor their children’s activities, both in and outside school (Bray, 2013; Davies, 2004). They tend to structure their children’s extracurricular activities (e.g. sports, arts, music) in educationally meaningful ways. This parenting style may extend to parental involvement in their children’s supplementary education. In this way, the use of SE constitutes a form of cultural capital (Buchmann et al., 2010; Park et al., 2016).
While the rational action and the socio-cultural reproduction perspectives focus on different mechanisms for socio-economic inequalities in education, they both lead to the prediction that SES is positively related to students’ SE participation. Prior empirical research finds support for this relationship in various countries (e.g. in the United States (Buchmann et al., 2010), Canada (Davies, 2004), the United Kingdom (Ireson and Rushforth, 2005), Ireland (Smyth, 2009), Japan (Stevenson and Baker, 1992), South Korea (Kim and Lee, 2010), Vietnam (Dang, 2007), Hong Kong (Bray et al., 2014), China (Liu and Bray, 2016), Turkey (Tansel and Bircan, 2006), Georgia (Bregvadze, 2012), and various Eastern European and Central Asian countries (Silova, 2010)).
Hypothesis 1. Parental SES is positively associated with a student’s participation in SE.
The role of high-stakes testing
Prior research links the presence of HSTs in the education system to the emergence and prevalence of SE (Baker et al., 2001; Bray, 2009, 2011; Buchmann et al., 2010; Hannum et al., 2019; Stevenson and Baker, 1992; Zhang, 2014). Scholars argue that HSTs enhance competitive behavior and the pressure to perform in education, and tighten the linkages between educational performance and labor market outcomes (Baker et al., 2001; Stevenson and Baker, 1992). An extreme form of these linkages is “diploma disease”: that is, employers relying heavily on degrees as an (indirect) signal of skills, causing educational certificates to have a large impact on hiring procedures. In this way, HSTs function as “public gatekeeper to education and labor market opportunities” (Baker et al., 2001: 3). Families are theorized to respond to the competitive pressures induced by the exam-oriented culture of high-stakes testing by seeking privilege for children outside of the formal education system, fueling the prevalence of SE (Hannum et al., 2019).
Empirical evidence on this hypothesized relationship between HSTs and SE at the national level is still mixed. One cross-national study, using cross-sectional data from the Trends in International Mathematics and Science Study (TIMSS) finds no relationship between high-stakes testing and the prevalence of SE among 12–14 years old children (Baker et al., 2001). However, national case studies suggest that high-stakes testing is one of the main mechanisms fueling the demand for private tutoring and other supplementary learning activities (Bray and Kwok, 2003; Lee et al., 2010; Zhang, 2014).
We propose that the competition that high-stakes tests induce may not work similarly for all students. Using insights from the socio-cultural reproduction framework, we argue that HSTs will especially bolster the use of SE among students from higher SES backgrounds. As outlined in the previous section, higher SES parents have more knowledge on the educational system (e.g. Smyth, 2009), and are actively involved in structuring their children’s educational and extracurricular activities in order to ensure their academic success (Buchmann et al., 2010; Park et al., 2016, 2011). This may manifest itself, among other things, in more knowledge on the decisive influence of HSTs on students’ future educational opportunities and life chances, and stronger beliefs about the presumed benefits of SE enrolment for boosting performances on HSTs (Buchmann et al., 2010).
Consequently, SE investments may be a more important strategy for parents from higher social class backgrounds to secure educational opportunities for their children (e.g. placement in highest tracks or elite schools) in a competitive educational environment in which test stakes are high than in an educational environment where test stakes are low. When test stakes are lower, incentives for high-SES parents to invest in SE for competitive advantage motives may be lower (Entrich, 2020). In contrast, parents from lower social class backgrounds may be less aware of the decisive role of high-stakes tests at educational transition points, and their SE investments are, therefore, expected to be less conditional on the presence of HSTs in the country.
Therefore, we expect differences in SE participation between students from socially advantaged and disadvantaged backgrounds to be larger in systems characterized by high-stakes testing, compared to systems without such testing.
Hypothesis 2. The positive relationship between SES and participation in SE will be stronger in national educational systems characterized by high-stakes testing.
Context
Despite the worldwide growth of SE, there are large cross-national variations in the prevalence and features of SE. First, the supply of SE varies across countries with respect to the following: (1) the class size—from personal tutoring to mass lectures, (2) the ages and qualifications of tutors—from formal teachers to students without formal training, and (3) the location and the use of (digital) technologies (Bray, 2006).
Second, countries differ in the relationship between SE and formal education. In some countries, such as Indonesia and Kazakhstan, semi-compulsory private tutoring is widespread; mainstream teachers pressure students to pay for out-of-school-time private lessons by educating only part of the formal curriculum in official school hours and the remaining part in supplementary lessons. This practice may be due to low wages of teachers in public education and/or relatively high levels of corruption in the country (Bray and Kwok, 2003; Silova, 2010; Zhang, 2014). Finally, participation in SE can fit either a “remedial” or “enrichment” user strategy, and the primary role that SE plays differs across countries. In most countries, SE has a “remedial” user strategy, implying that especially low-performing students participate in SE to eliminate achievement lags. In other countries, SE has an “enrichment” strategy, with a majority of above average performing participants; or is characterized by a combination of both strategies (Baker et al., 2001; Wolf, 2002). The enrichment strategy is primarily found in East-Asian countries such as South Korea (Byun et al., 2018; Choi and Park, 2016; Kim and Lee, 2010).
Data and methods
Data
PISA is an internationally standardized survey developed by the Organisation for Economic Co-operation and Development (OECD) that aims to measure educational performance in mathematics, reading (language), and science of 15-year-old students every 3 years. PISA 2012 focuses on mathematics performance, with reading and science as minor areas of assessment. We chose PISA 2012 as this wave covers a wider range of countries than previous rounds, and includes various items on SE, among which one indicator that allows us to identify fee-paying classes (see for more information, “Measures” section). Other PISA rounds do not include a measure that explicitly asks students about the usage of paid supplementary learning activities. Approximately, 510,000 students from 65 countries—including 34 OECD member countries and 31 partner countries—participated in PISA 2012 (OECD, 2014a). All countries, except for the Russian Federation, used a two-stage stratified sampling design. First, schools were sampled from a national sampling frame with probabilities proportional to the estimated number of 15-year-old students enrolled. Second, students were selected within schools with equal probability.
We exclude cases from the United Arab Emirates, Kazakhstan, Macau (China), Shanghai (China), Liechtenstein, Qatar, Perm (Russia), Serbia, and Tunisia due to missing internationally comparable information on country-level variables. Furthermore, we exclude Albania and Colombia due to the high shares of missing values on student-level variables. 1 The final sample includes 416,427 students from 54 countries. Depending on the proportion missing values on the dependent variable—primarily due to the survey’s rotated design—final sample sizes vary from N = 237,737 to N = 260,634 (54 countries).
We use sample weights to provide unbiased population estimates. 2 We normalize student weights at the country level, such that (1) the sum of weights across all countries is equal to the number of observations, (2) cases maintain the same proportional weights within each country, and (3) each country’s contribution to the analyses is equal (OECD, 2009: 219).
Measures
Dependent variables
We measure participation in SE with four indicators from the PISA 2012 Student Context Questionnaires. The first two measures represent whether a student attends out-of-school-time lessons (OSL) in (1) language and (2) mathematics. Students provided the number of hours in OSL a week on a 5-point scale ranging from “no hours” to “6 or more hours a week.” Students also reported the number of hours they attend OSL in science and other subjects. We do not use these items, as science is often optional and the category “other subjects” is very broad, potentially causing (cross-national) variation in the question interpretation. The third SE indicator refers whether a student works with a personal tutor, paid or not. Finally, the fourth indicator measures whether a student attends out-of-school classes organized by a commercial company, paid for by his or her parents. These last two indicators are based on open-ended questions, where students indicated the number of hours a week they spend on these activities (range 0–30). For every measure, we recode the original responses into a dichotomous variable denoting whether a student participates at least some time in SE (1) or not (0). We also estimated models for the use intensity of SE (i.e. number of hours a week). These results are reported in Appendix 1 and are largely consistent with the main results. 3
Note that only the fourth indicator makes the financial aspect of SE explicit—that is, “out of school classes organized by a commercial company, and paid for by parents” (OECD, 2013b: 233, emphasis added). These fee-paying classes are also referred to as the “high form” of SE (see Byun et al., 2018; Entrich, 2020). Although our other indicators (OSL and private tutoring) may also partly capture public learning activities outside formal education, we believe it is important to also analyze these indicators, as children may not always know whether/that their out-of-school-time classes are paid for. Hence, if we would solely focus on measures that explicitly capture “high forms” of SE, we may underestimate possible social inequalities in SE. Moreover, SE may at times be implicitly paid for. For example, there might be (private) schools who offer OSL or personal tutors, yet who also request higher tuition fees. All in all, it is likely that participation in OSL and private tutoring is also stratified (see Byun et al., 2018). Hence, we conduct separate analyses for the different SE indicators. In this way, we can indicate potential differences between broad indicators (OSL and personal tutoring) and narrow indicator (commercial company classes). In addition, we use prior research to interpret the results in a more comprehensive way.
The PISA 2012 Student Context Questionnaires have a “rotated design.” This implies that the SE measures are only asked to two-third of the students, and one-third of the observations within each country is missing by design (N/A) (OECD, 2014b: 58–61). For all countries, we examine the share of observations not missing by design (invalid/missing). The share of invalid/missing values on OSL mathematics and OSL language generally does not exceed 4 percent, except for eight countries that have 4–6 percent missing/invalid observations. Compared to the first two indicators, the share of missing/invalid values on personal tutor and commercial company lessons is generally higher, especially in some South-American and Asian countries (e.g. Argentina, Brazil, Peru, Indonesia, Jordan, and Turkey; ⩾10% of all observations). However, we do not impute missing values on the dependent variable as this can add noise to the estimates (Von Hippel, 2007).
Independent variables
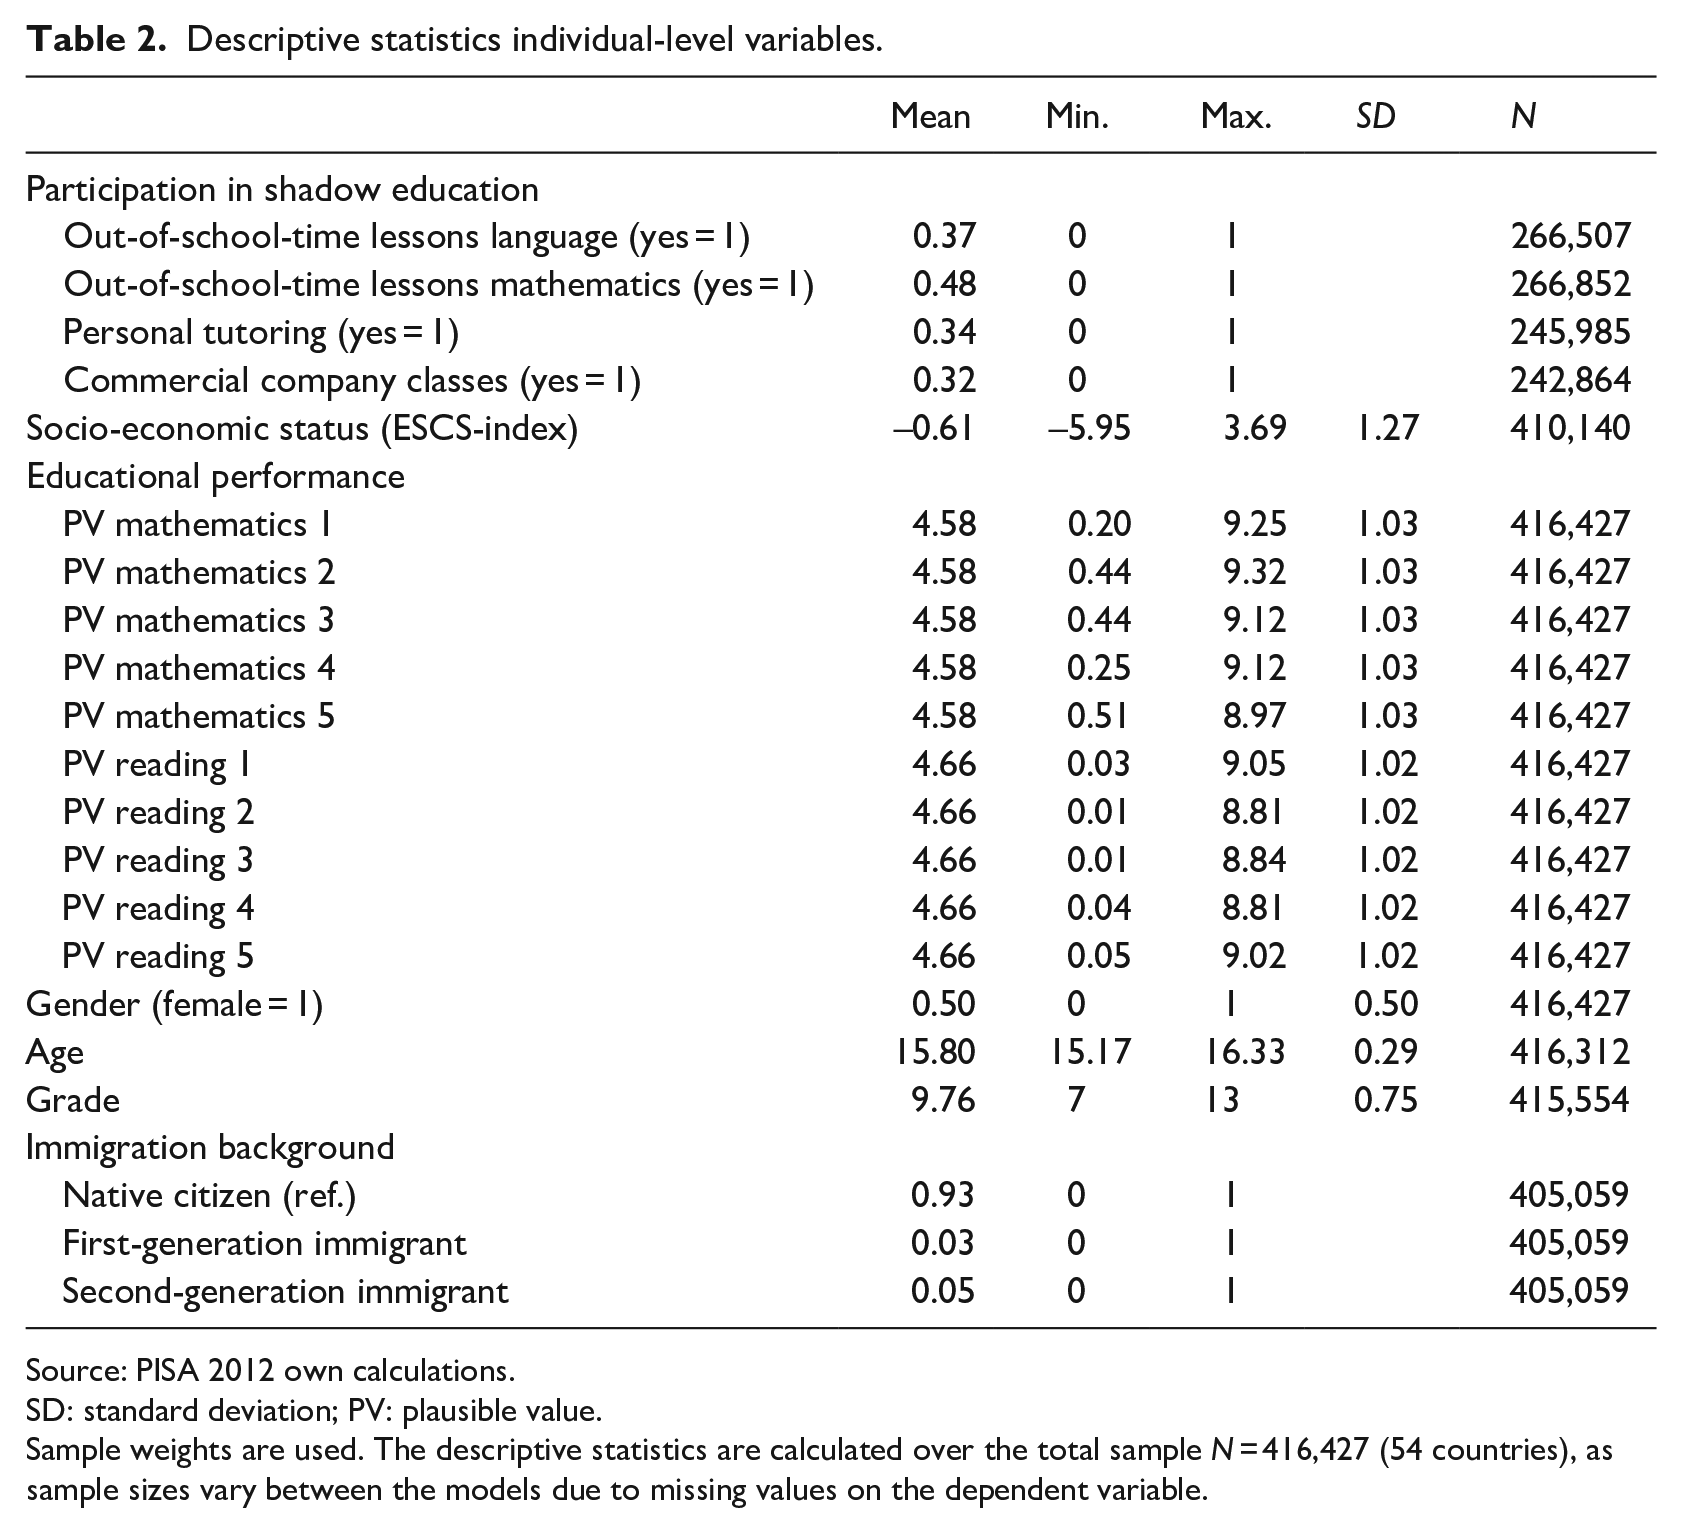
The independent variable of primary interest at the student level is socio-economic status. We measure SES with the “PISA index of Economic, Social and Cultural status” (ESCS). This verified index combines indicators for parental occupation, parental education, and home possessions. The latter includes items on family wealth possessions, cultural possessions, home educational resources, and the number of books at home. The ESCS-index is standardized such that the mean of OECD member countries equals 0 and the SD equals 1 (OECD, 2014b). 4
To operationalize high-stakes testing, we focus on central examinations with Bishop’s (1997) definition of “Curriculum-based External Exit Examinations” (CBEEEs) (cf. Baker et al., 2001; Entrich, 2020). The use of nationally standardized exams with a decisive influence at educational transitions is an important indicator of a culture of high-stakes testing. Bishop distinguishes five characteristics of CBEEEs: (1) the exam produces signals of student achievement that have real consequences for students, (2) student achievement is defined relative to an external standard, (3) the exam is organized by discipline, (4) it signals multiple levels of achievement in the subject (not pass/fail), and (5) it is administered to almost all secondary school students (Bishop, 1997).
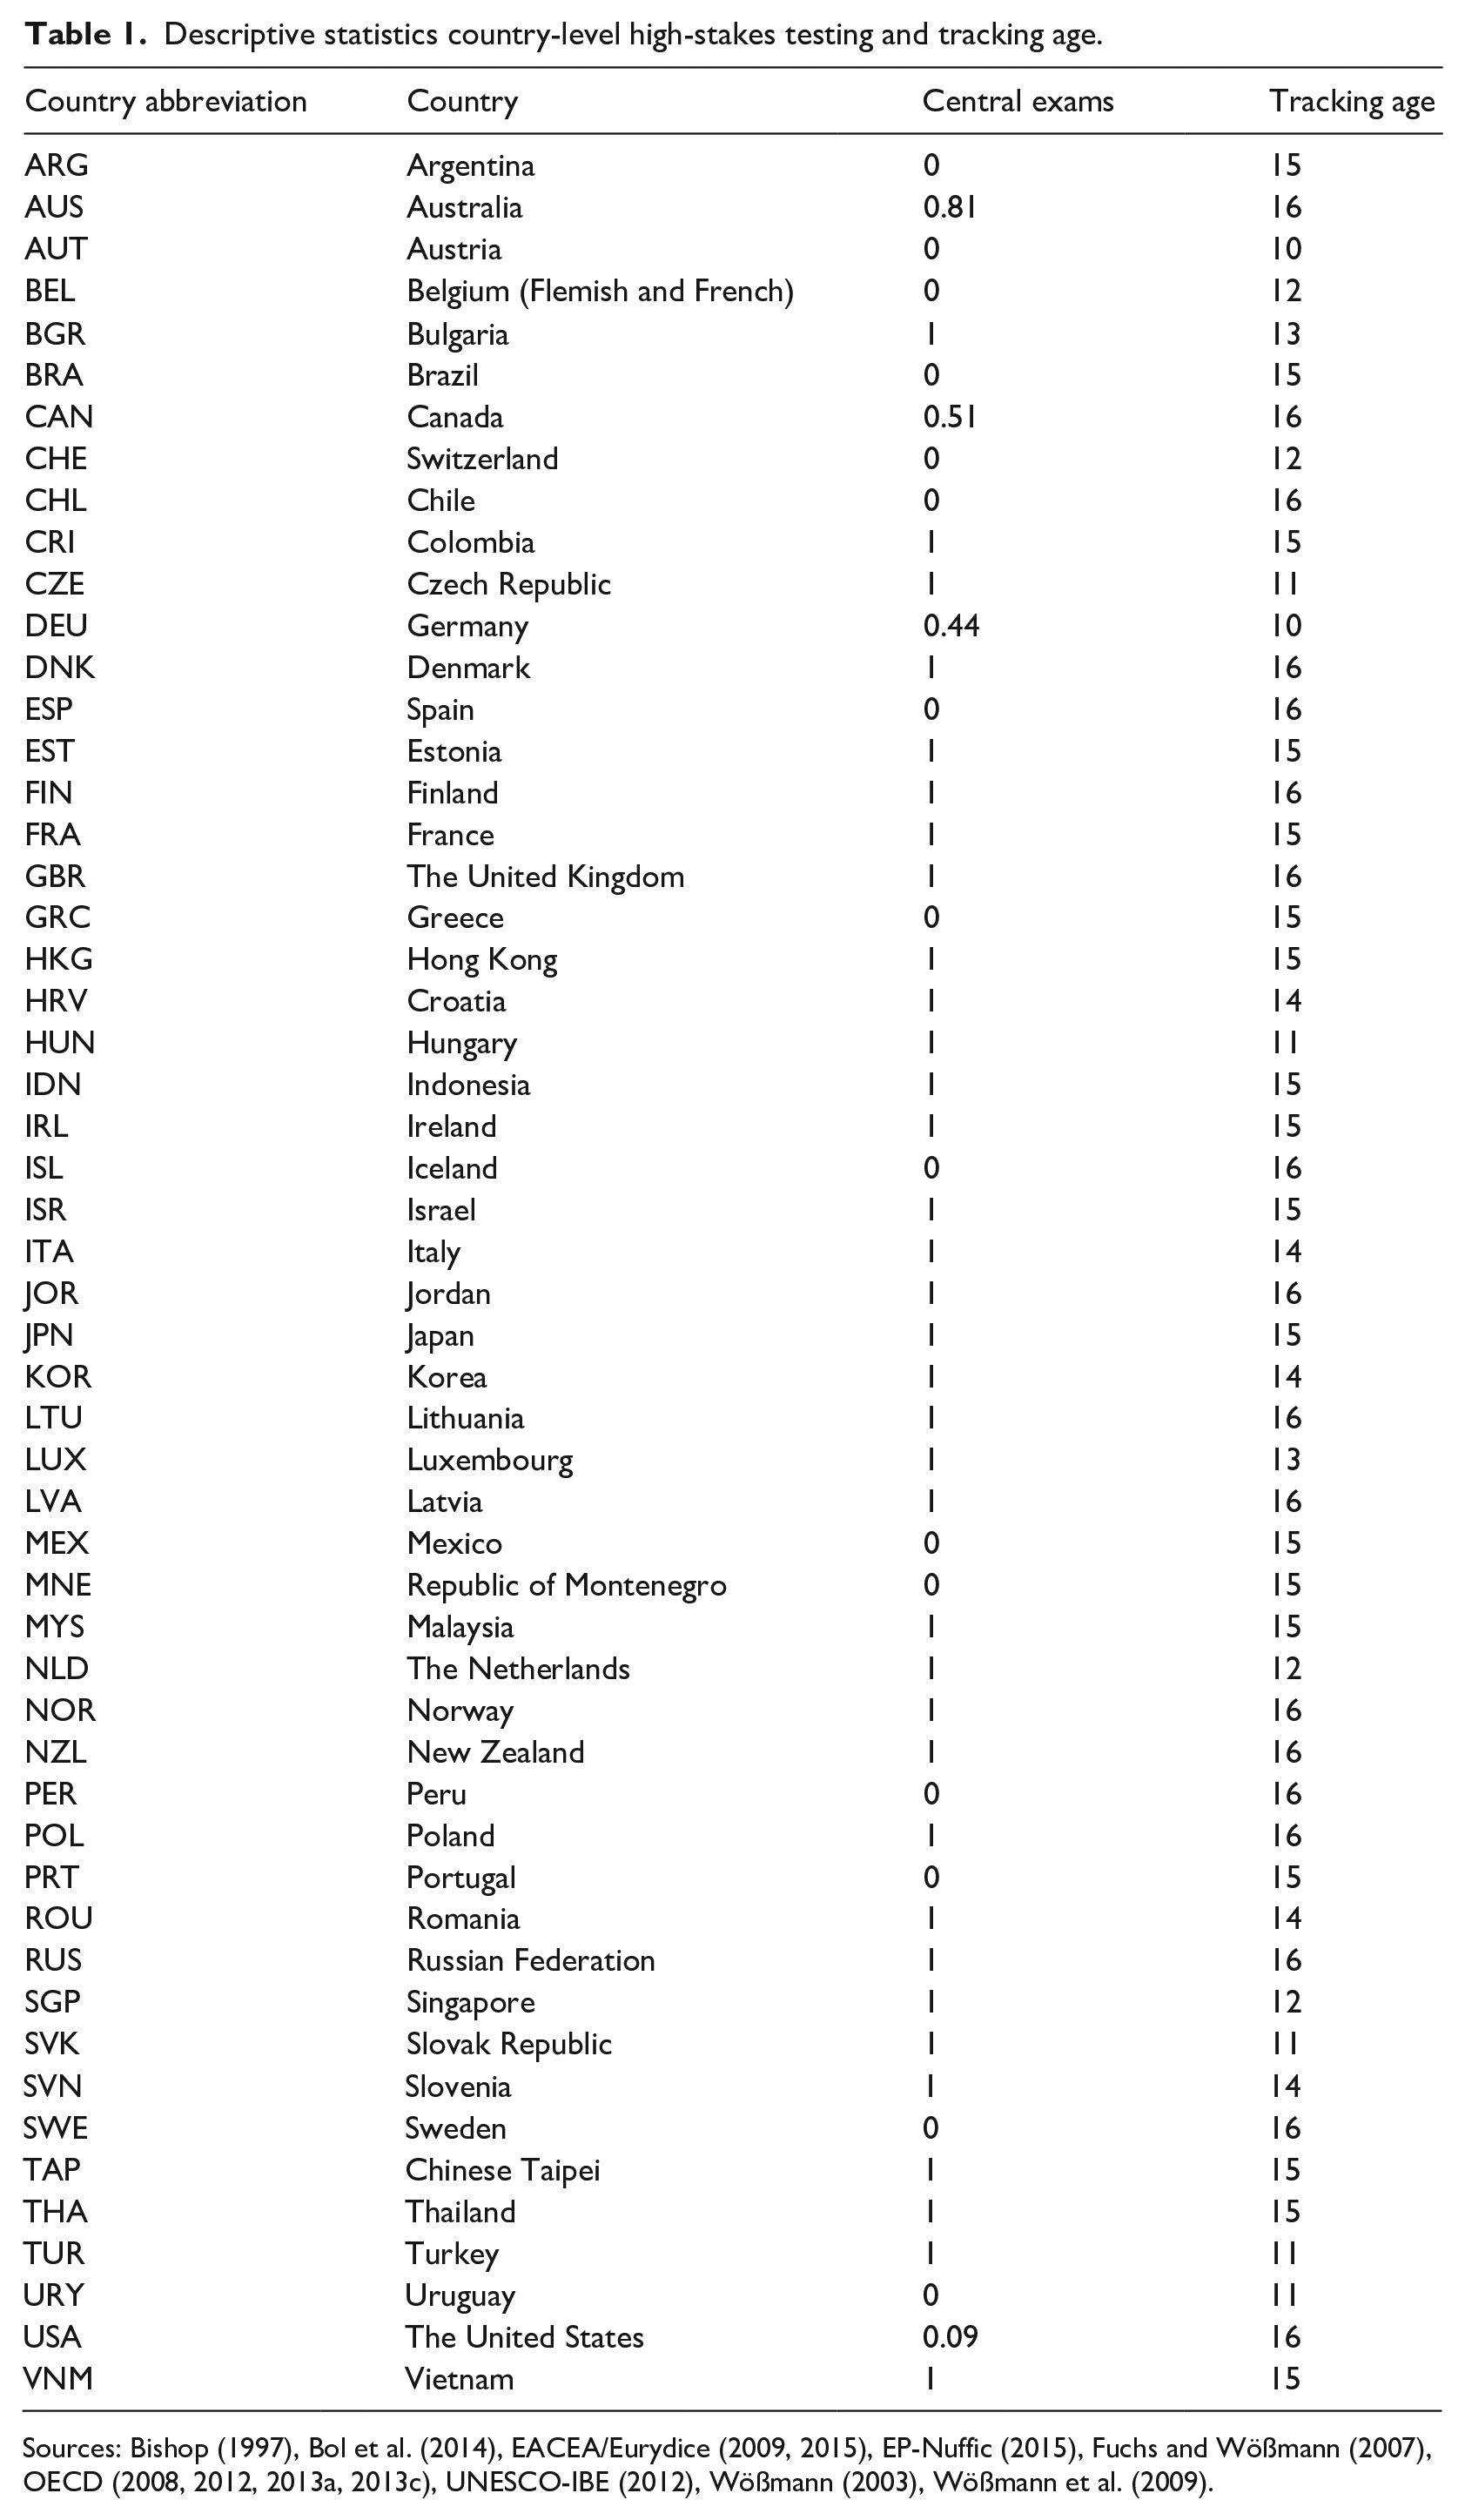
We derive this indicator from previous research (Bishop, 1997; Bol et al., 2014; Fuchs and Wößmann, 2007; Wößmann, 2003; Wößmann et al., 2009) and supplement and update it with other data sources (EACEA/Eurydice, 2009, 2015; EP-Nuffic, 2015; OECD, 2008, 2012, 2013c; UNESCO-IBE, 2012). The vast majority of countries scores either 0 (no central exams) or 1 (central exams) on this variable. However, in four countries—Australia, Canada, Germany, and the United States—there are no nationally centralized examinations. These countries score 0.81, 0.51, 0.44 and 0.09, respectively, representing the proportion of subnational regions where these examinations are present (see Bol et al., 2014; Wößmann et al., 2009, for a similar approach). Table 1 summarizes country-level scores on CBEEEs.
Descriptive statistics country-level high-stakes testing and tracking age.
Control variables
At the student level, we control for a number of socio-demographic factors and educational performance that potentially confound the relationship between parental SES and student participation in SE (e.g. Byun et al., 2018; Park et al., 2016).
More specifically, we control for the student’s age, as the age of PISA’s target population varies between 15 years and 3 months and 16 years and 2 months at the start of the testing period (OECD, 2014b: 460). Students’ ages systematically vary across countries, and students’ age may also impact their educational performance, and therefore, their SE participation. We also account for the student’s migration background. We use the PISA index of immigrant background and distinguish between (1) native citizens (students who have at least one parent born in the country of assessment), (2) first-generation immigrants (students born outside the country of assessment whose parents were also born in another country), and (3) second-generation students (students born in the country of assessment whose parent(s) were born in another country; OECD, 2014b: 307). We also include the student’s gender (female = 1) and grade (years of formal education).
In addition, we control for students’ educational performance, as performance is related to a student’s social background as well as to his or her motivation to make us of SE activities (remediation vs enrichment). We measure student’s educational performance with plausible values (PVs). During PISA’s computer-based assessments, students answer a subset of test items on mathematics, reading (test language) and science, rather than all items. Instead of obtaining a point estimate to measure the student’s educational performance levels, a posterior probability distribution based on the student’s item responses is estimated. PVs are randomly drawn values from this distribution. Hence, PVs are a representation of “the range of abilities that a student might reasonably have, given the student’s item responses” (Wu, 2005: 115). For each educational domain—language, mathematics, and science—PISA 2012 includes five PVs (OECD, 2009; Wu, 2005). Following the PISA Data Analysis Manual (OECD, 2009), we compute our statistical models separately for each PV, and use Rubin’s combination rules to average these estimates, and to obtain the final mean estimates and corresponding standard errors (OECD, 2014b; Wu, 2005). As PVs are ranging from circa 0 to 900, we divided them by 100 to ease interpretation of the coefficients.
At the country level, we control for tracking age. National educational systems differ in multiple ways, and these institutional features relate to educational inequalities by socio-economic background. Two main features that relate to such inequalities are (1) the level of national standardization (among which the standardization of output, by means of central exams) and (2) the level of differentiation (Van De Werfhorst and Mijs, 2010). The latter often refers to between-school tracking—that is, the selection and allocation of students into separate ability tracks or streams (e.g. vocational and academic) (LeTendre et al., 2003). 5 In this respect, prior research demonstrated that educational equalities by SES are larger in highly differentiated educational system, versus comprehensive systems, especially when tracking occurs at a younger age (Bol et al., 2014; Brunello and Checchi, 2007; Hanushek and Wößmann, 2006; Van De Werfhorst and Mijs, 2010). We measure the level of between-school tracking in a country by the first age of selection (tracking age) (cf. Hanushek and Wößmann, 2006). We obtain this information from the OECD (2013a; see Table 1). Tracking age ranges in our data between 10 years and 16 years. In the statistical models, the variable is mean-centered to ease interpretation of the results.
Furthermore, we control for a cross-level interaction between tracking age and a student’s socio-economic background. Similar to central exams, between-school tracking may especially fuel the demand for SE among high-SES students (see also Entrich, 2020). Students’ track allocation strongly determines students’ future educational pathways and tracking thus raises the stakes of educational transitions. Especially, higher SES parents may have the financial resources and cultural knowledge to “navigate” these educational institutions. Consequently, they are more likely to invest in SE around critical transition points in order to improve their child(ren)’s performance, and to influence track allocation. In contrast, countries with lower levels of differentiation may offer less opportunities to gain competitive advantages through supplementary educational activities in allocation processes (Entrich, 2020). Hence, we want to make sure that the interaction between central exams and a student’s SES holds after accounting for the interaction between tracking age and a student’s SES.
Summary statistics for all student-level variables are presented in Table 2. Only 3.5 percent of the sample has (a) missing value(s) on one or more of the student-level predictors. We exclude these cases from analysis.
Descriptive statistics individual-level variables.
Source: PISA 2012 own calculations.
SD: standard deviation; PV: plausible value.
Sample weights are used. The descriptive statistics are calculated over the total sample N = 416,427 (54 countries), as sample sizes vary between the models due to missing values on the dependent variable.
Methods
PISA 2012 data have a hierarchical structure, with students i nested in schools j, and schools nested in countries k. Three-level random effects linear probability models (LPMs) are used to correct standard errors for this clustering (Hox, 2010; Rabe-Hesketh and Skrondal, 2005). For each of the four SE indicators, we estimate similar models. 6
First, we report the intercept only model (Model 0), and calculate school-level and country-level intraclass correlations (ICC). Model 1 presents the analysis of the effects of SES (Hypothesis 1), the student-level sociodemographic control variables, and central exams on participation in SE (0 = no, 1 = yes). Models 2–5 include the cross-level interaction between SES and central exams (Hypothesis 2). The model specification for Model 2 is as follows:
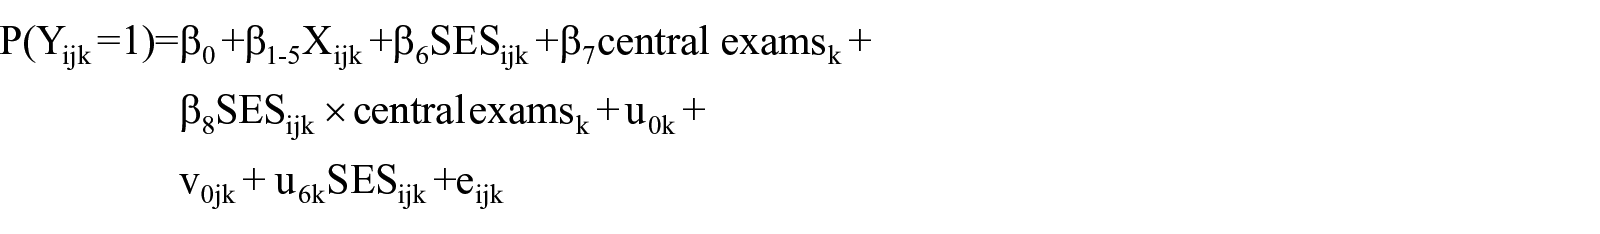
With
We build on Model 2 in several ways. In Model 3, we add the PVs to assess whether the findings hold when controlling for performance. In the models predicting participation in OSL mathematics, personal tutoring, and commercial company lessons, we include five PVs measuring the student’s performance in mathematics; in the models predicting OSL language, we use PVs measuring performance in reading (language). While it is important to control for the student’s educational performance, we acknowledge that performance may be endogenous on SE participation. As we use cross-sectional data, it is impossible to include a measure of performance prior to SE participation. Consequently, observed performance can be both a driver and a consequence of SE participation. For this reason, we add performance separately to the model, and abstain from drawing strong conclusions about the effect of student performance on SE participation based on our analysis.
In Model 4, we assess whether including the age at which students are tracked alters the results. We add both the main effect of tracking age and a cross-level interaction between SES and tracking age. Next to the level of between-school tracking, countries vary in other (un)observed ways that may alter the relationship between SES and SE participation. It is difficult to measure all potentially relevant factors for the relationship between SES, central exams, and supplementary education with country-level indicators. Therefore, we use a fixed effects approach in Model 5 to assess the cross-level interaction between SES and central exams. Rather than estimating a country-level random intercept, we estimate a two-level LPM with students i clustered in schools j and include country fixed effects to control for all between-country unobserved heterogeneity (see for a similar approach, Bol et al., 2014). This model is specified as follows:
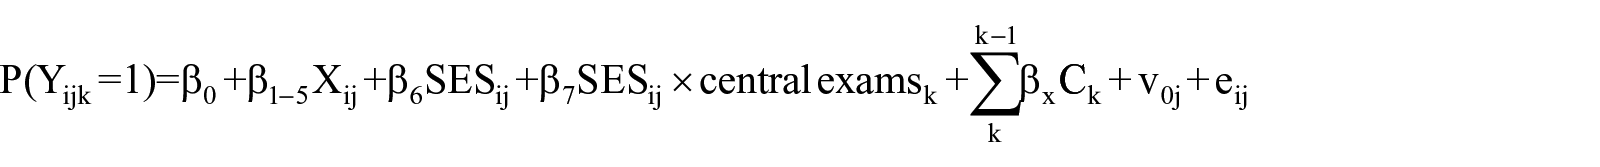
In this model specification, all country variance is captured by the country fixed effects (denoted by
Results
Descriptive results
Figure 1 summarizes national descriptive statistics of the proportion of students participating in different forms of SE, and the average number of hours a week that students spend on these activities. The figures show large cross-country differences in participation in SE activities, in particular, personal tutoring and commercial company lessons. We also find differences between forms of SE: in most countries, national participation in OSL mathematics is high compared to participation in other SE activities. We want to emphasize that we can make no distinction between OSL lessons provided by public schools and those provided by private institutions.
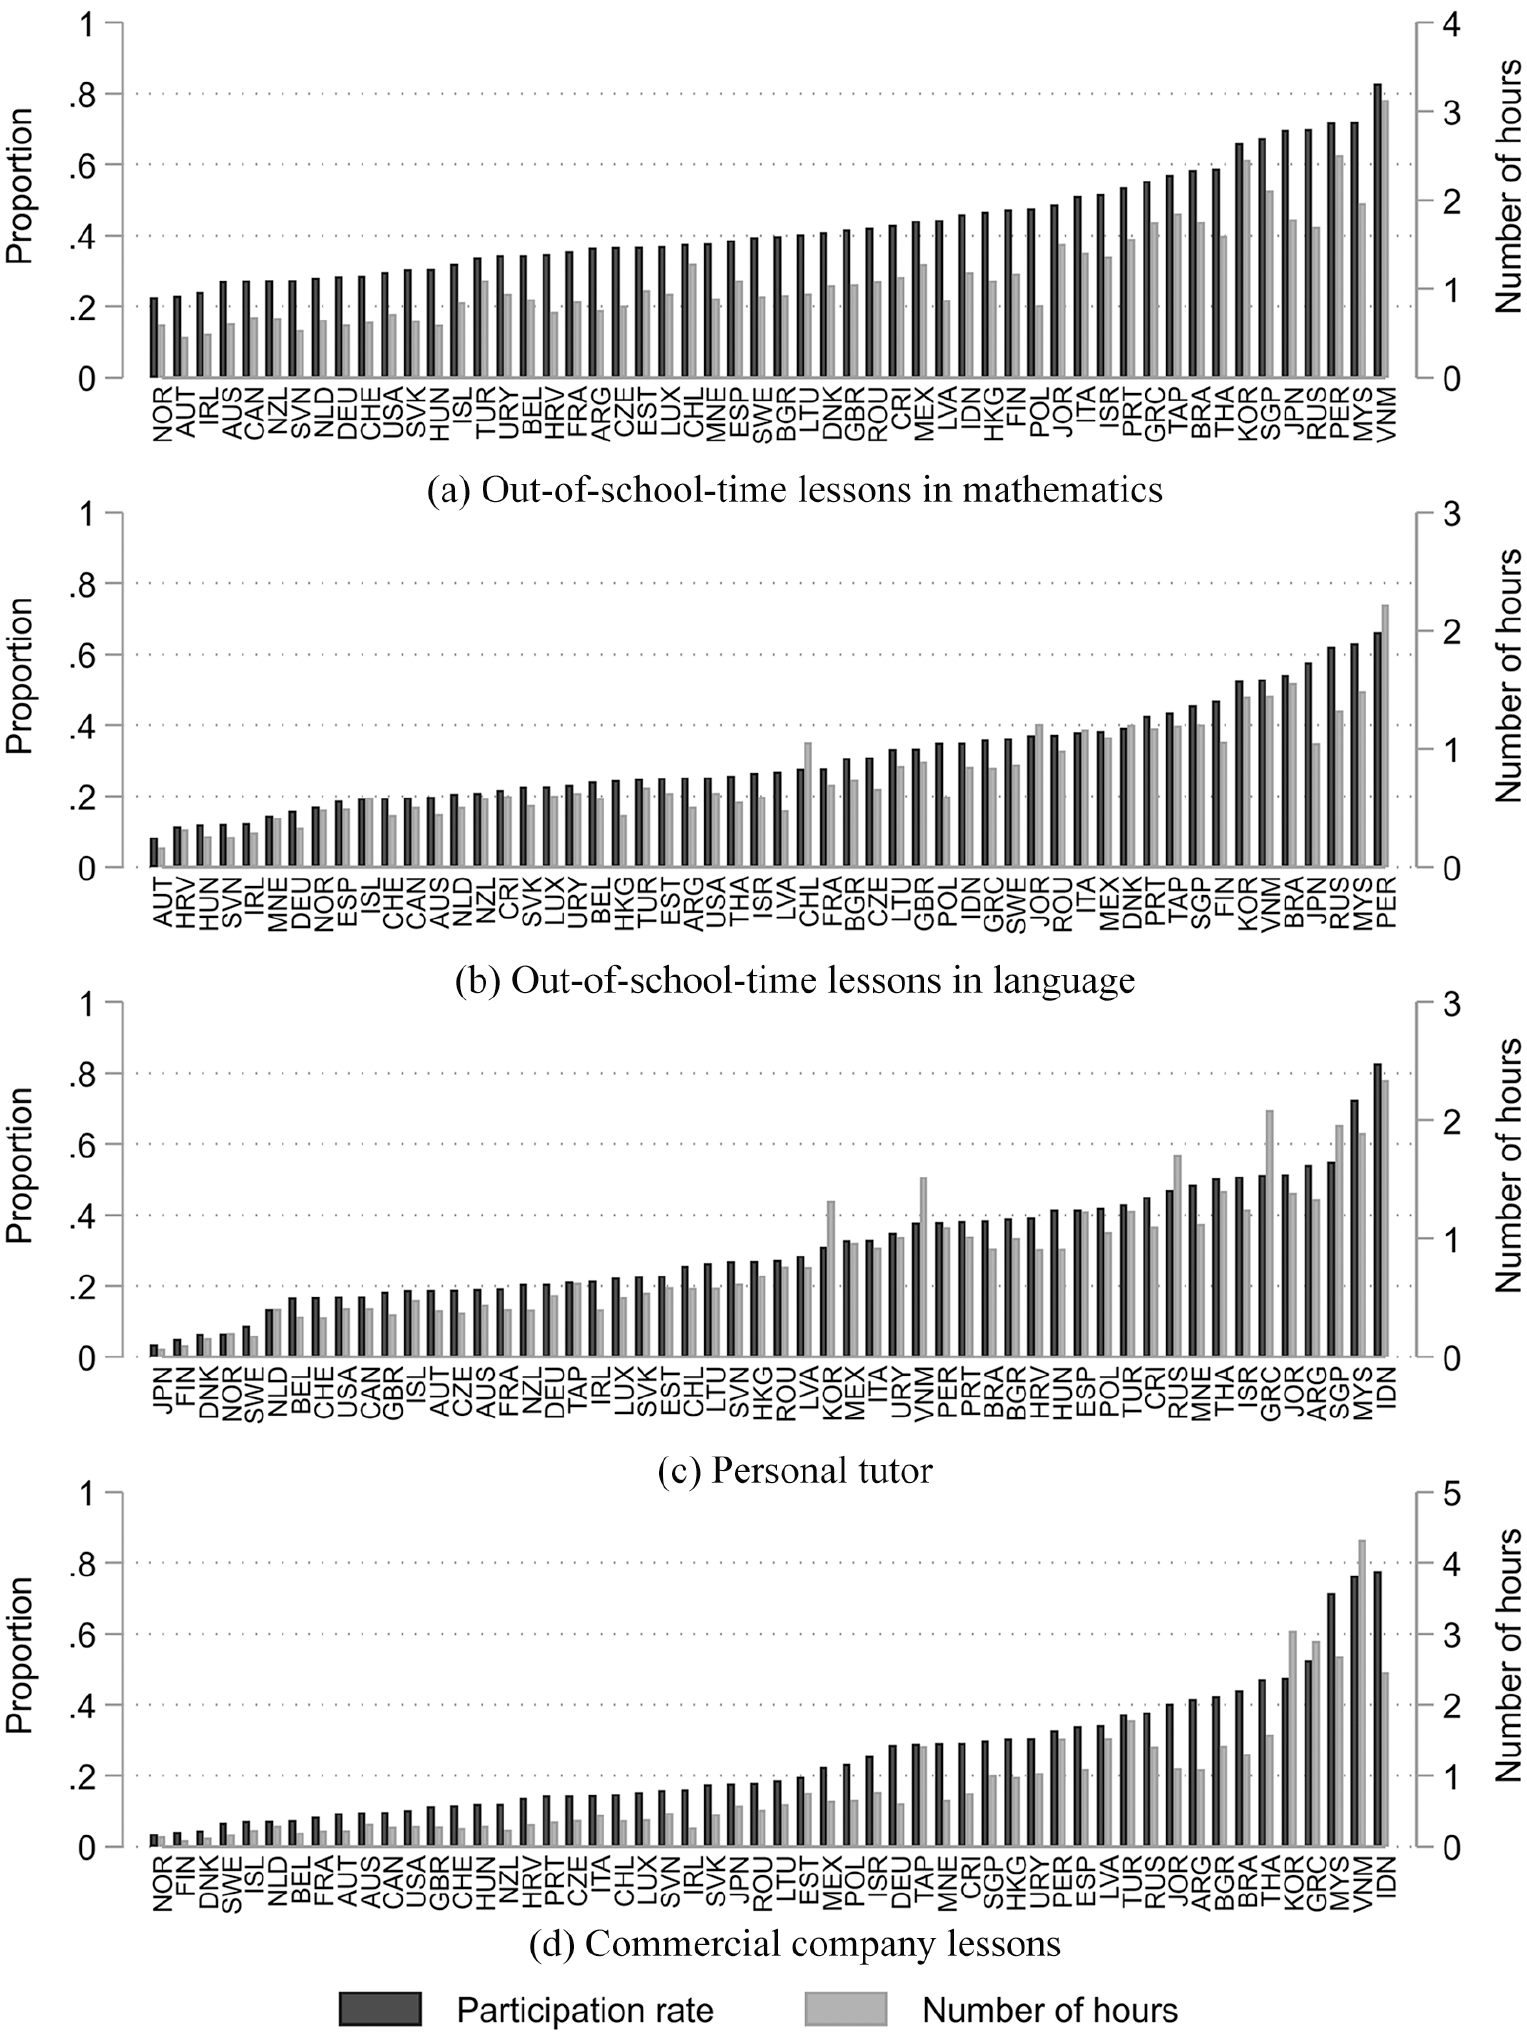
National proportions of students participating in shadow education (left axis), and the number of hours a week students on average spend on these lessons (right axis), countries in ascending order. (a) Out-of-school-time lessons in mathematics. (b) Out-of-school-time lessons in language. (c) Personal tutor. (d) Commercial company lessons.
There appears to be a correlation between different SE measures at the country level. In countries where students’ enrolment in OSL is relatively low (e.g. Austria, the Czech Republic, or Norway) or high (e.g. Vietnam, Peru, or Tunisia), participation rates in personal tutoring or commercial company classes are also low or high, respectively. However, not every country takes a similar position on the different rankings. This may be due to cross-national variation in the supply of SE and/or the interpretation of PISA questions (Bray and Kobakhidze, 2014). For instance, Japanese participation rates in OSL are far above average but this country has the lowest participation rate in personal tutoring. While the use of SE is widespread in Japan, one-to-one tutoring is less common than large cram schools (e.g. Bray, 2006; Stevenson and Baker, 1992). In addition, Denmark has one of the lowest participation rates in personal tutoring and commercial lessons, while taking a high centrist position on the country rankings of OSL in mathematics/language. Possibly, OSL in Denmark include supplementary lessons that the public education system offers free of charge. Finally, the high prevalence of personal tutoring and commercial lessons in Indonesia is slightly counter-intuitive. Despite the fact that quite a lot of Indonesian students tend to participate in supplementary lessons supplied by their own teachers after regular school hours (Kim and Lee, 2010), Indonesia is not known for a very high prevalence of SE. These patterns support the importance of conducting separate analyses for the different indicators of SE. 7
Multilevel regression results
Tables 3 to 6 show the results of the multilevel regression models for the different SE indicators. Model 0 indicates that the proportion of variance at the school level varies between 5.6 percent (personal tutoring) and 6.6 percent (OSL language). The ICCs at the country level are higher: between 8.3 percent (OSL mathematics) and 15.0 percent (commercial company lessons) of the variance in the dependent variable is at the country level. 8
Results multilevel regression models out-of-school-time lessons in mathematics.
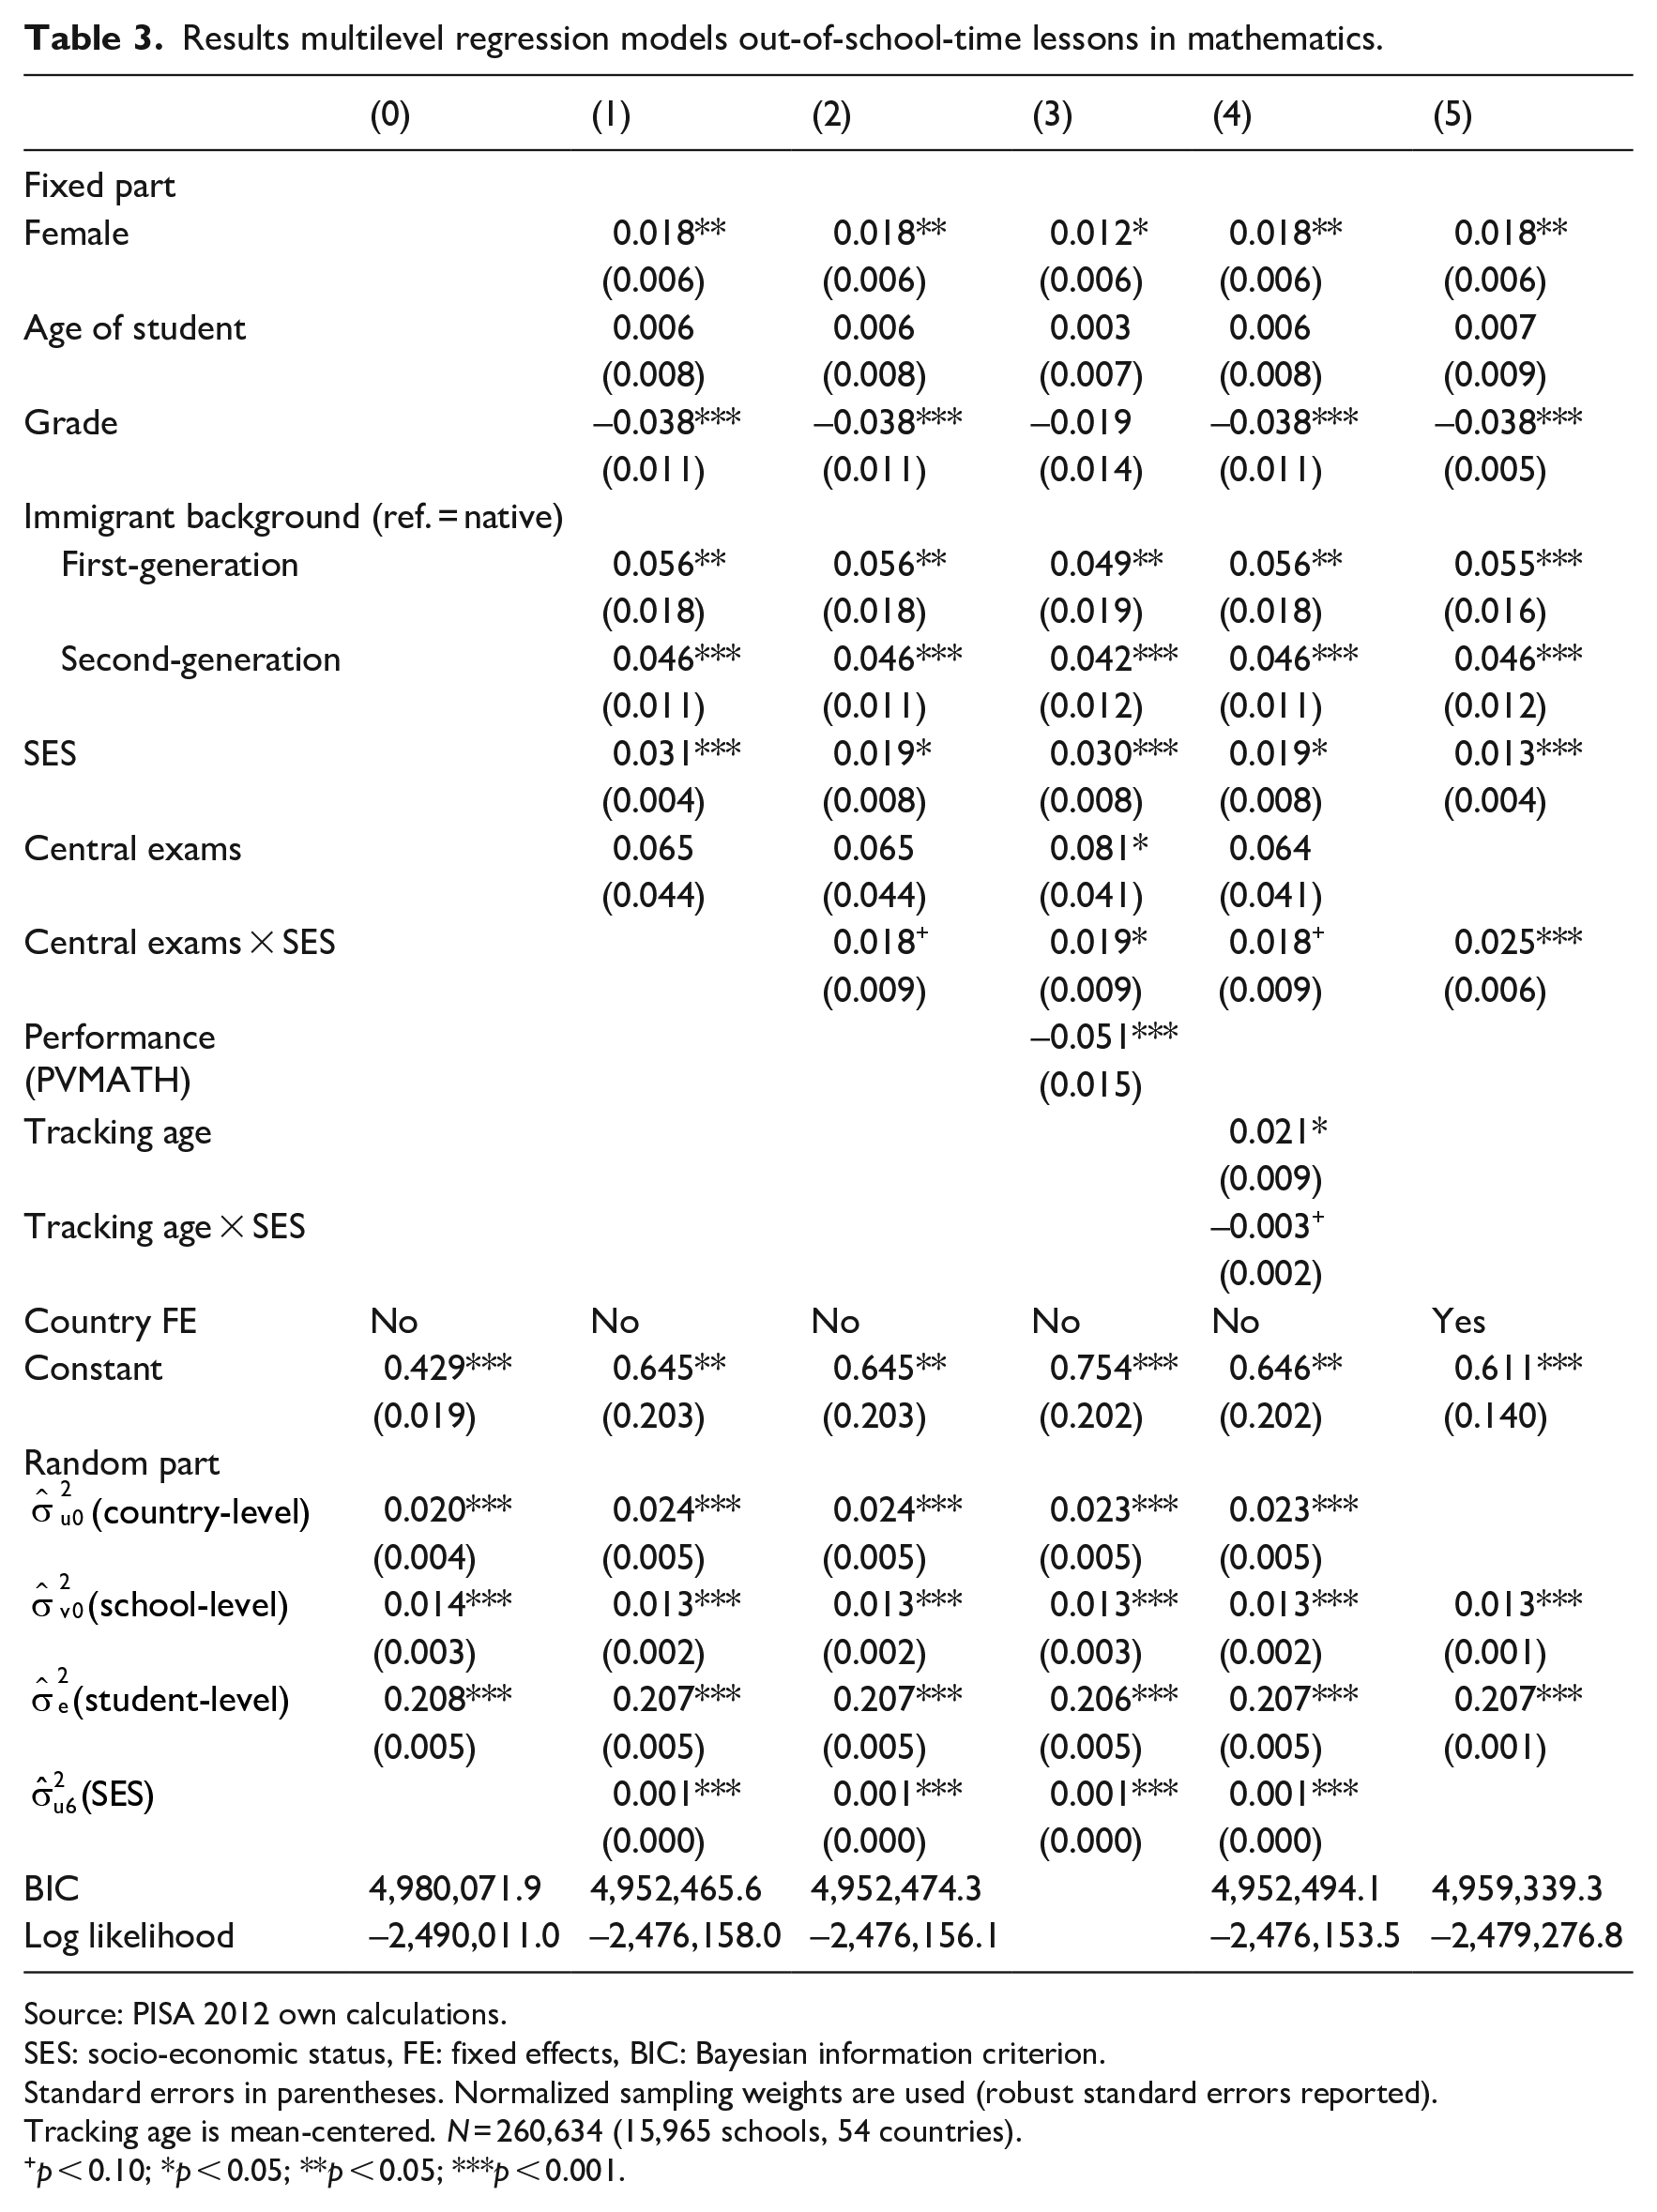
Source: PISA 2012 own calculations.
SES: socio-economic status, FE: fixed effects, BIC: Bayesian information criterion.
Standard errors in parentheses. Normalized sampling weights are used (robust standard errors reported).
Tracking age is mean-centered. N = 260,634 (15,965 schools, 54 countries).
p < 0.10; *p < 0.05; **p < 0.05; ***p < 0.001.
Results multilevel regression models out-of-school-time lessons in language.
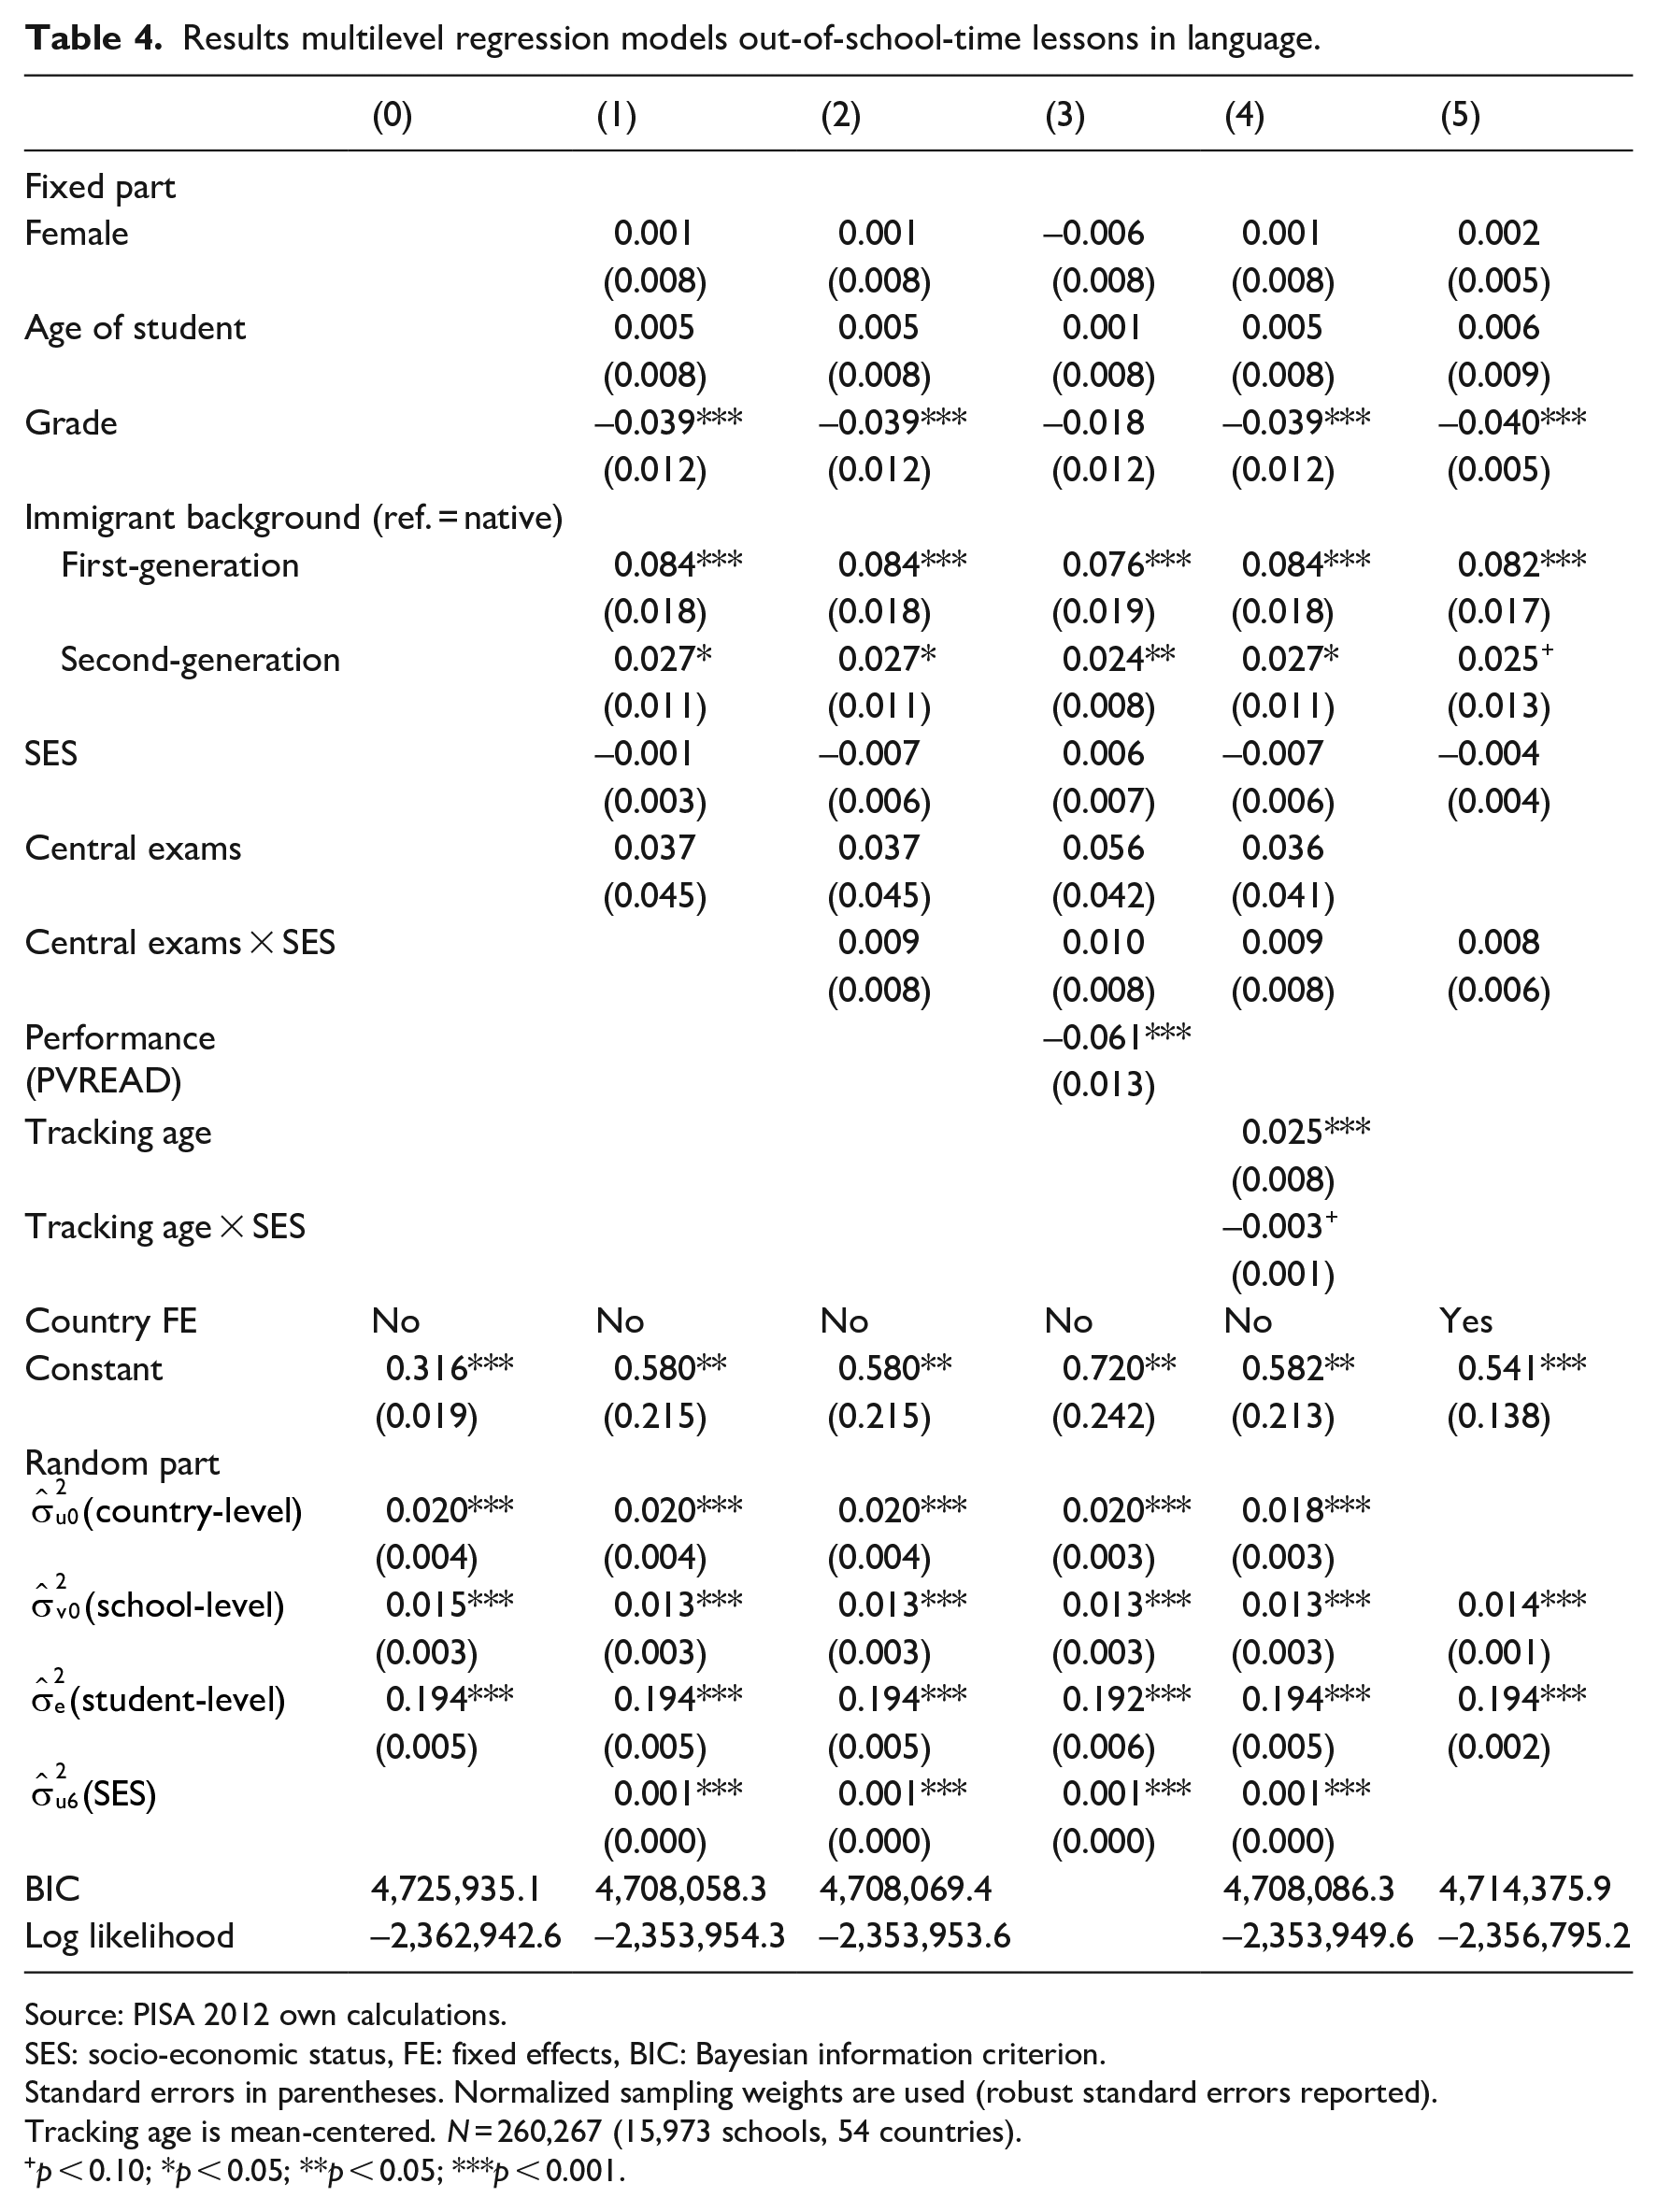
Source: PISA 2012 own calculations.
SES: socio-economic status, FE: fixed effects, BIC: Bayesian information criterion.
Standard errors in parentheses. Normalized sampling weights are used (robust standard errors reported).
Tracking age is mean-centered. N = 260,267 (15,973 schools, 54 countries).
p < 0.10; *p < 0.05; **p < 0.05; ***p < 0.001.
Results multilevel regression models personal tutor.
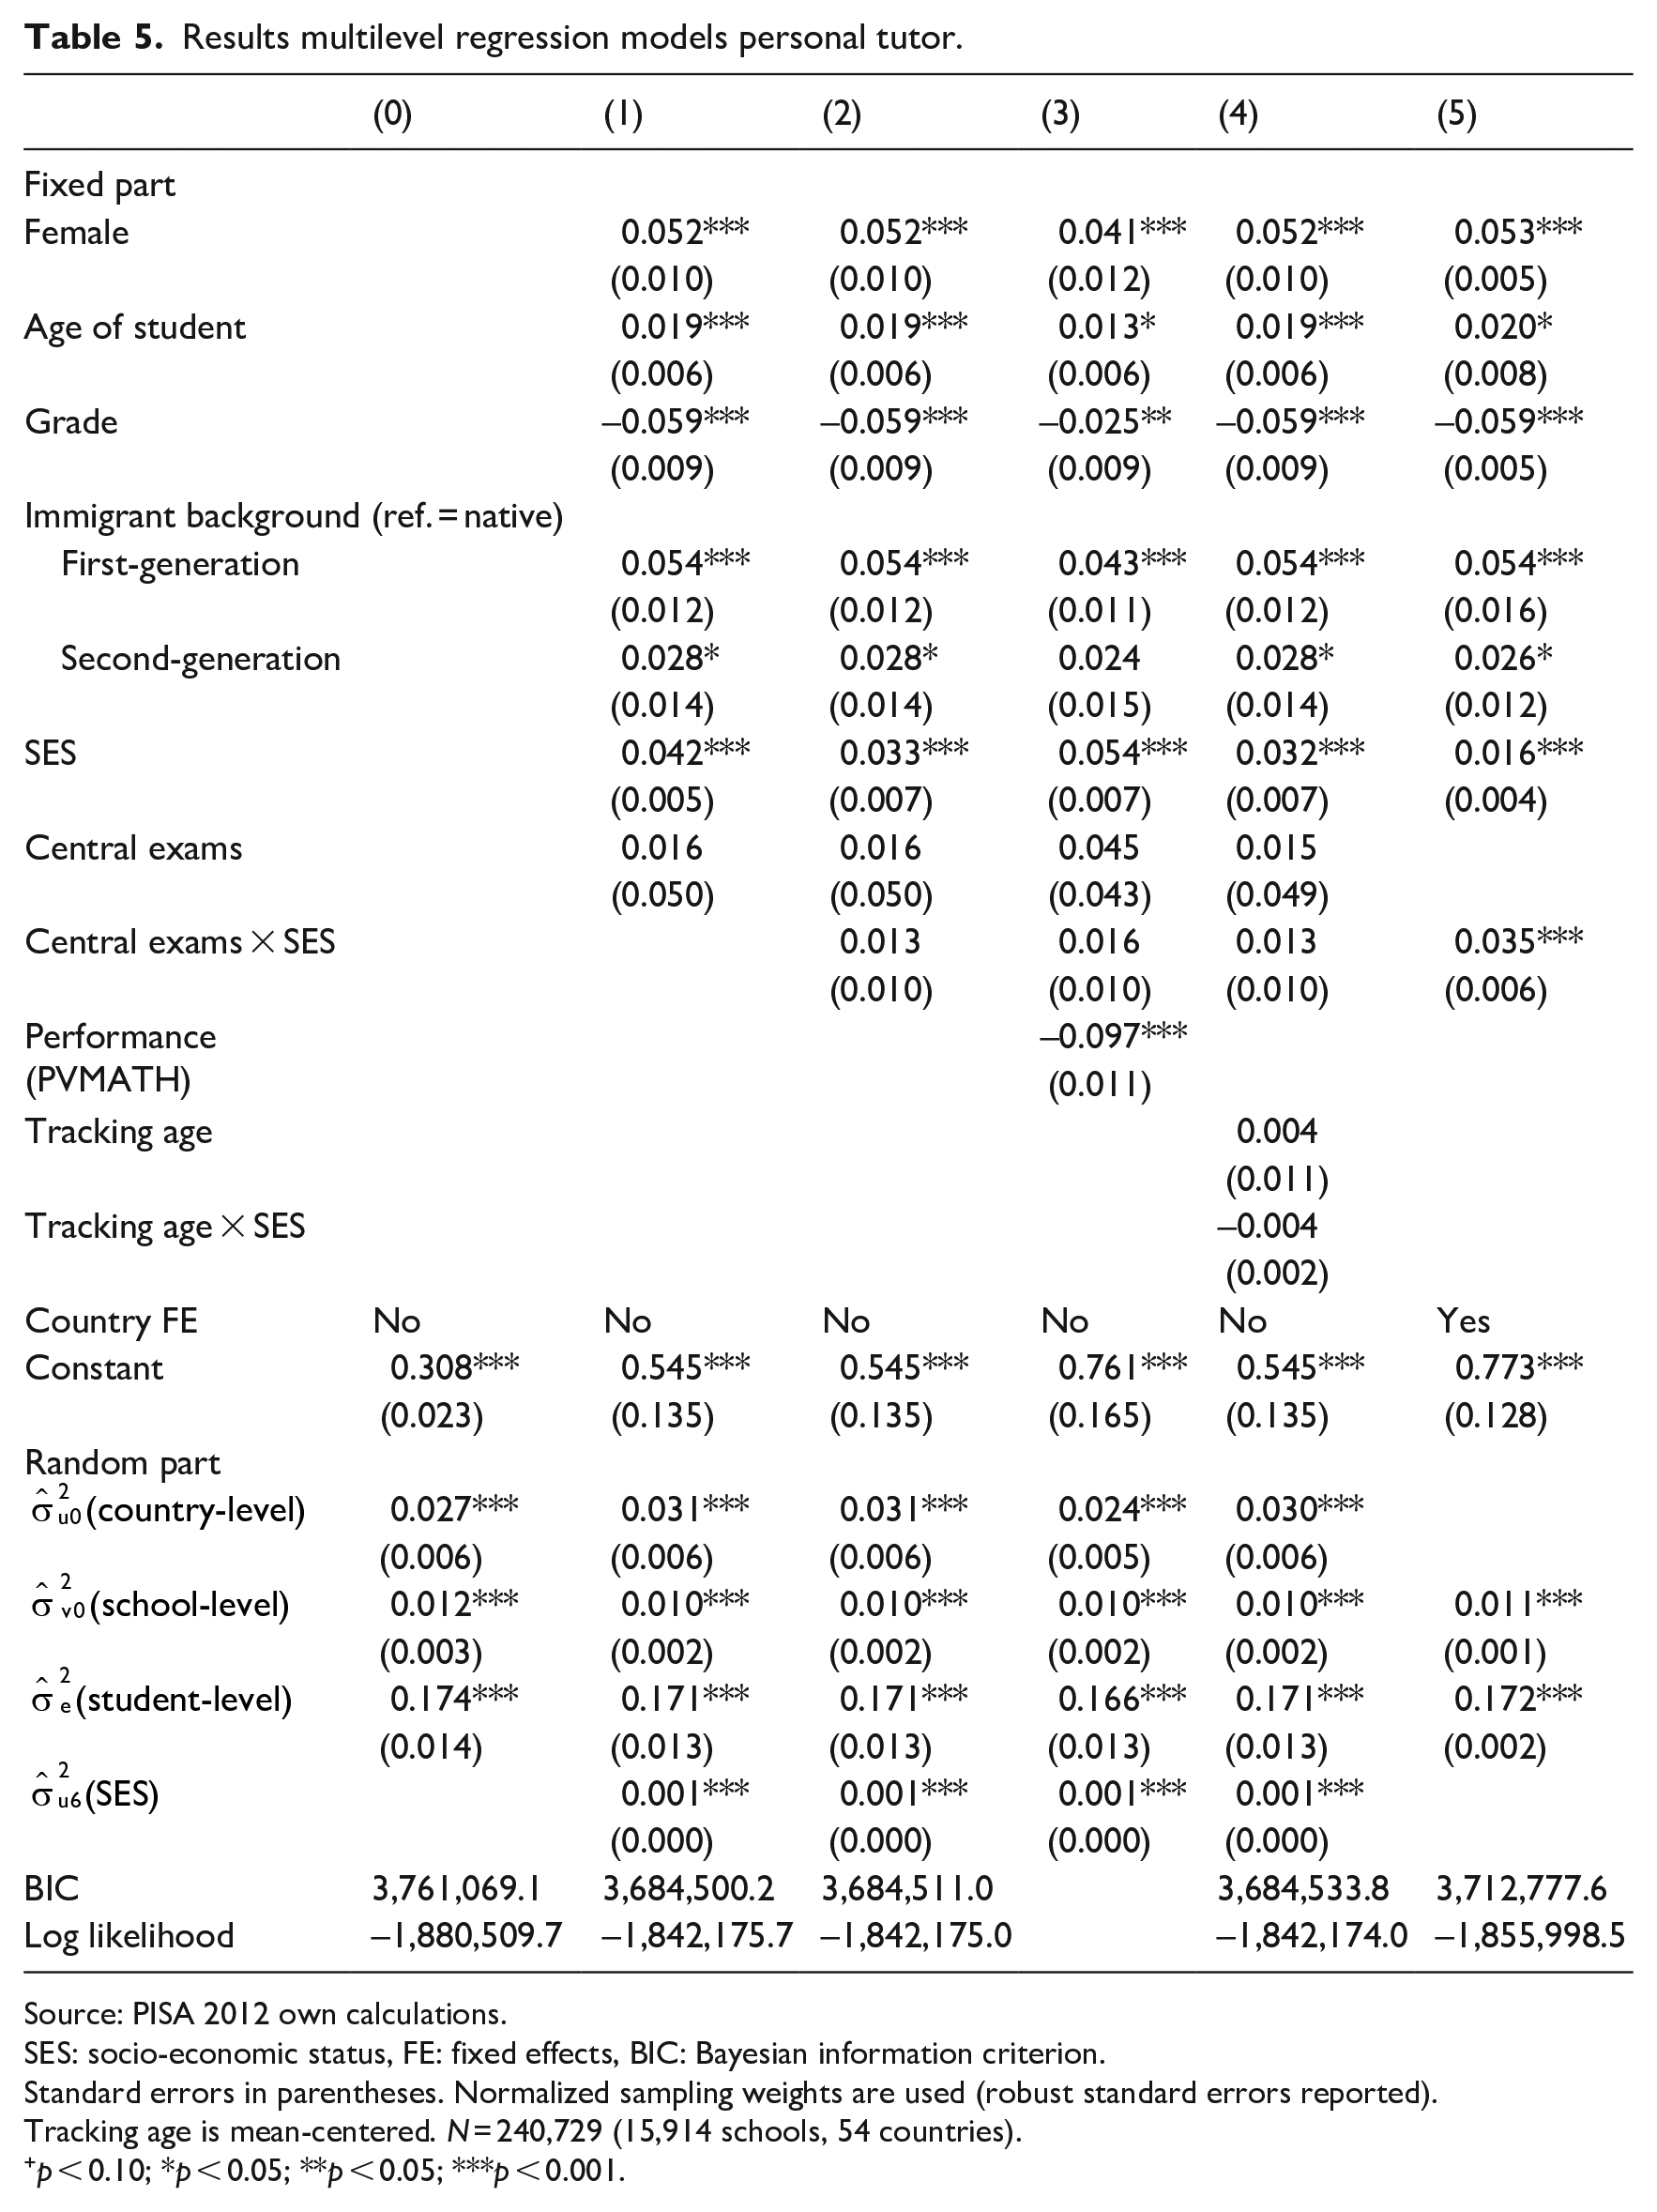
Source: PISA 2012 own calculations.
SES: socio-economic status, FE: fixed effects, BIC: Bayesian information criterion.
Standard errors in parentheses. Normalized sampling weights are used (robust standard errors reported).
Tracking age is mean-centered. N = 240,729 (15,914 schools, 54 countries).
p < 0.10; *p < 0.05; **p < 0.05; ***p < 0.001.
Results multilevel regression models commercial company lessons.
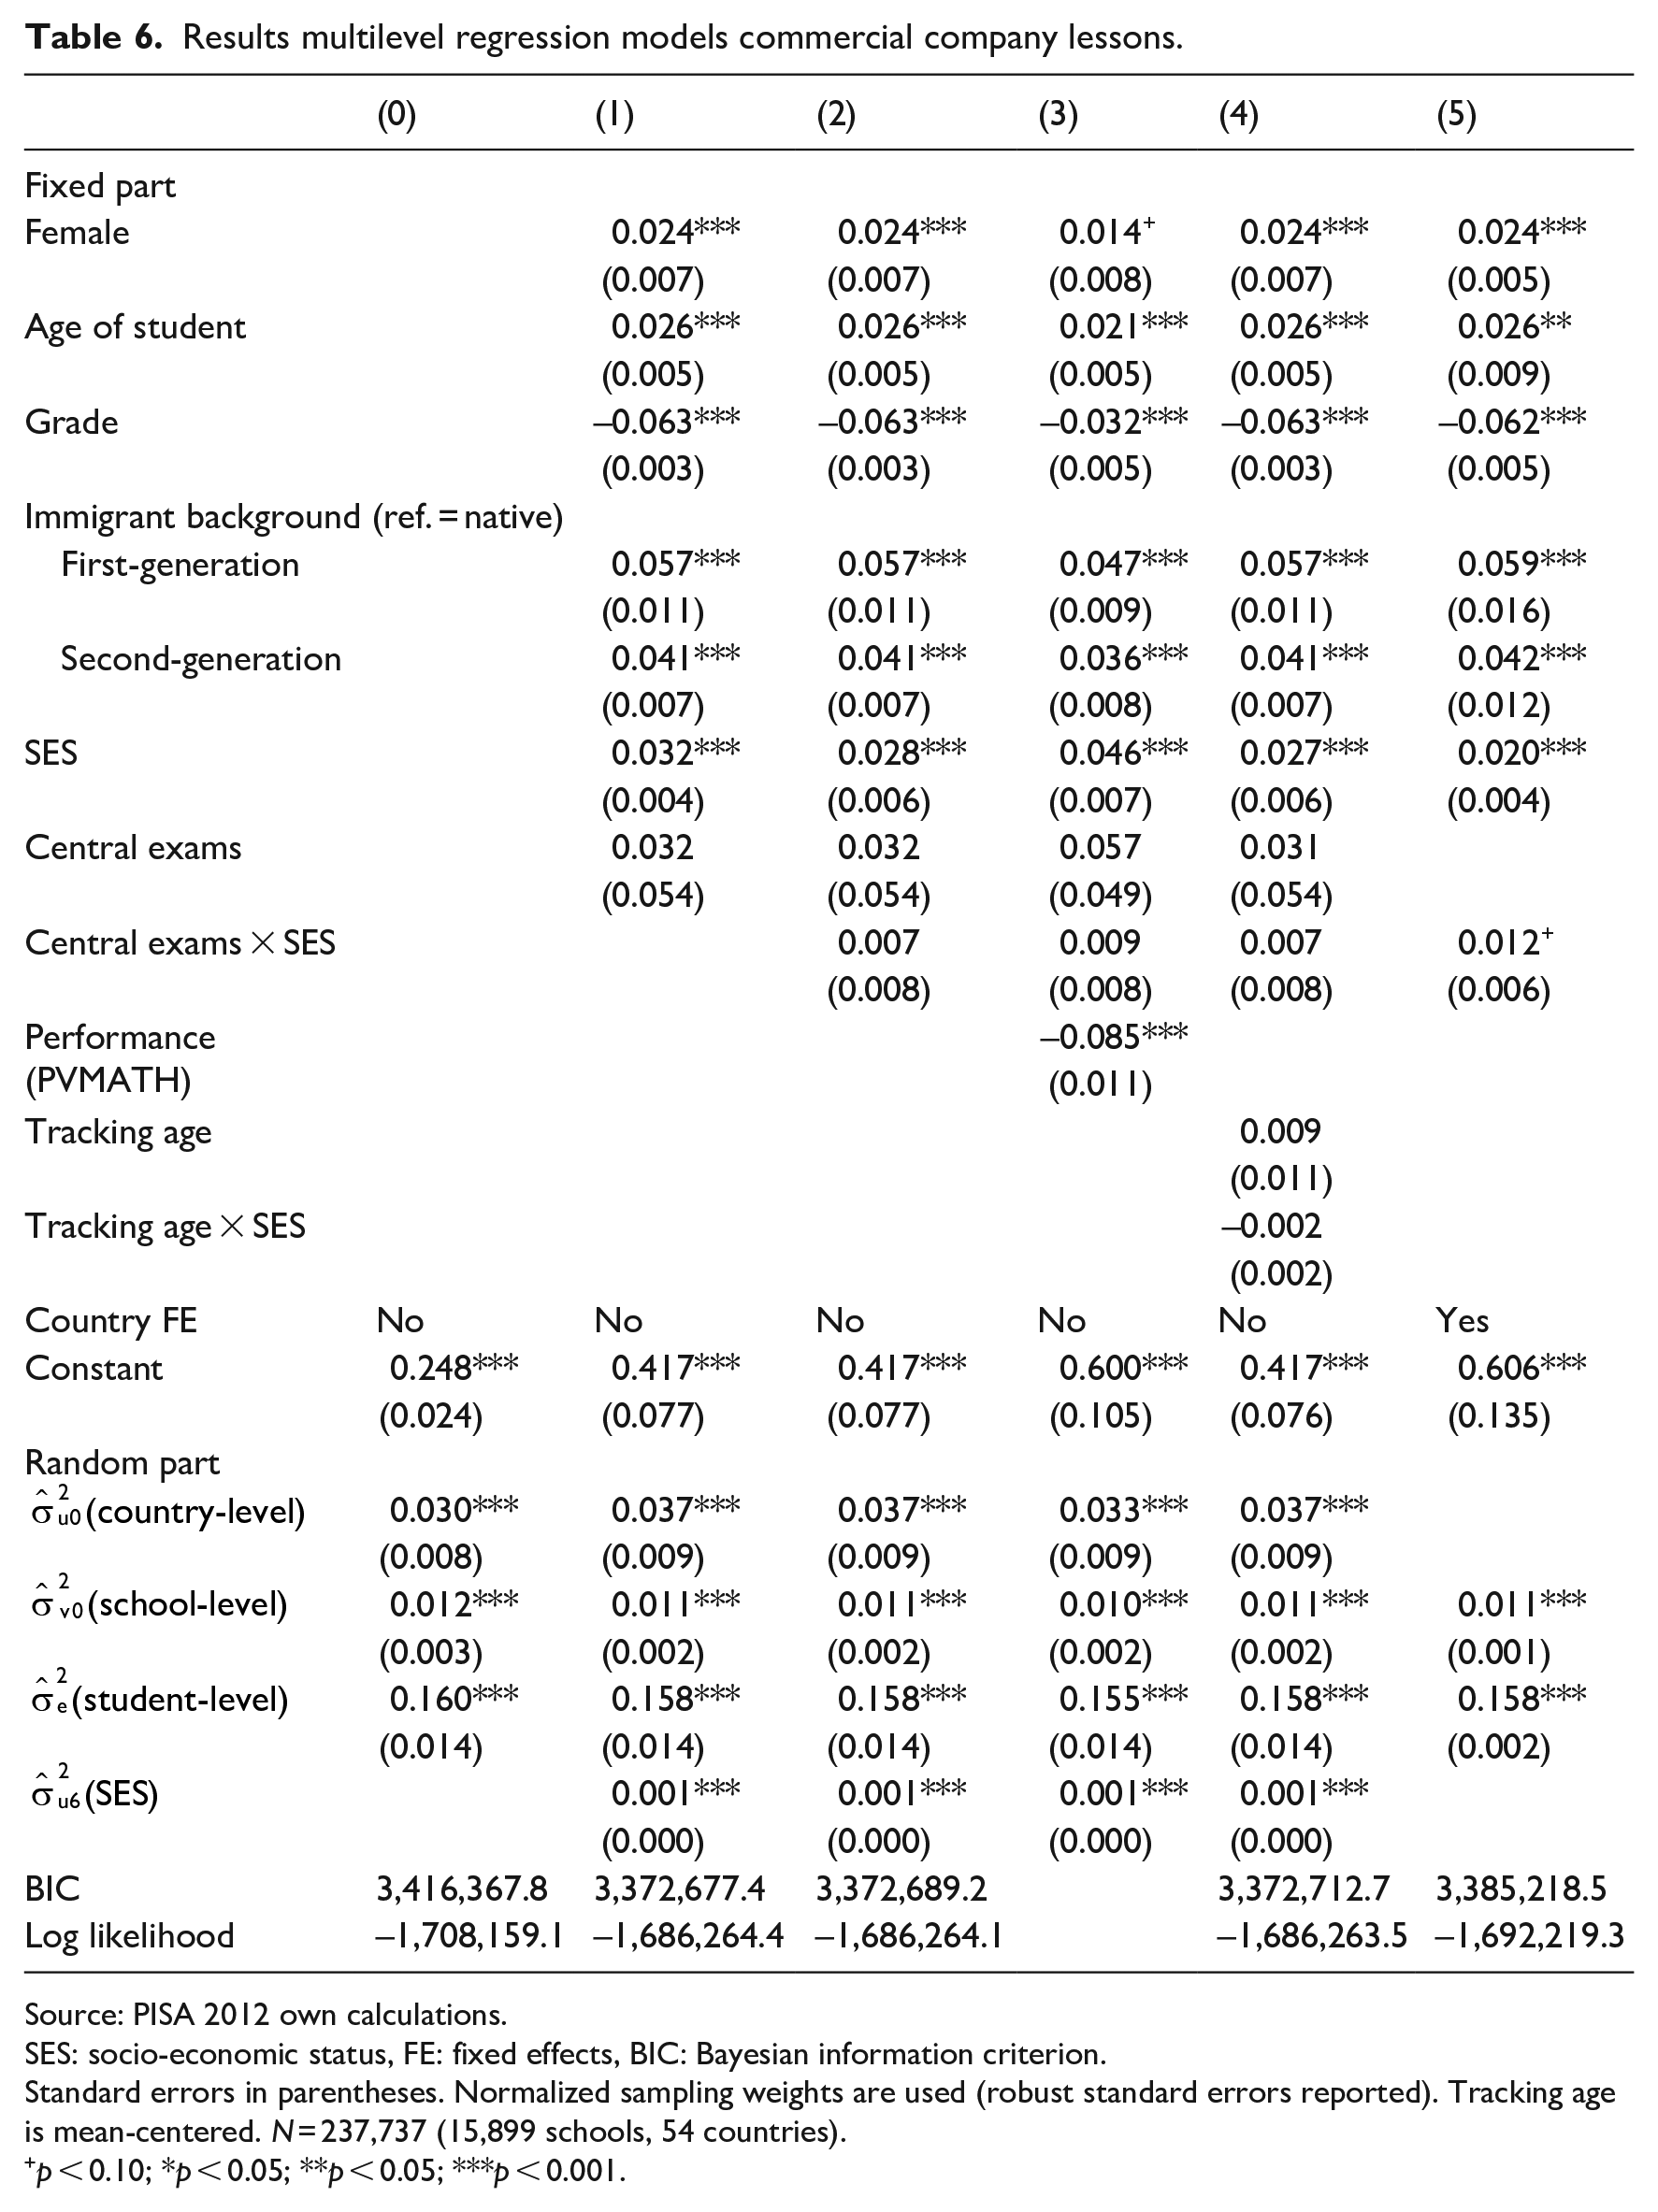
Source: PISA 2012 own calculations.
SES: socio-economic status, FE: fixed effects, BIC: Bayesian information criterion.
Standard errors in parentheses. Normalized sampling weights are used (robust standard errors reported). Tracking age is mean-centered. N = 237,737 (15,899 schools, 54 countries).
p < 0.10; *p < 0.05; **p < 0.05; ***p < 0.001.
In Model 1, we estimate the coefficients of SES, central exams (i.e. indicator of high-stakes testing), and the socio-demographic student-level variables. First, we find a positive association between parental SES (ESCS-index) and three out of four measures of SE. In line with our expectation (Hypothesis 1), high-SES students are more likely to participate in SE activities than low-SES students. For every one-unit (i.e. one SD) increase on the (mean-standardized) ESCS-index, predicted chances to participate in OSL mathematics, personal tutoring and commercial company lessons on a weekly basis increase by 3.1, 4.2, and 3.2 percentage-points, respectively. The relationship between SES and OSL language is not significantly different from zero. Although these social background effects on SE participation do not appear to be very large at first glance, our estimates can be interpreted as relatively conservative, given the inability to distinguish between paid and unpaid supplementary education for OSL and personal tutoring.
This model also shows that the use of central exams is not significantly associated with any of the four indicators of SE. Consistent with prior cross-national comparative work (Baker et al., 2001; Entrich, 2020), this implies that the general demand for SE does not seem to be larger in countries characterized by high-stakes testing, compared to countries not using such testing. Moreover, this result is consistent across the various SE measures, from broad indicators potentially partly capturing public supplementary learning activities provided by schools to “high forms” of SE (i.e. commercial company lessons), explicitly capturing the financial costs of participation.
Regarding the sociodemographic control variables, both first- and second-generation immigrants tend to have a higher probability to participate in SE than native students. Furthermore, female students have a higher probability of participating in OSL mathematics, personal tutoring and commercial company lessons, compared to male students. We find a negative association between a student’s grade and SE participation, though this association loses statistical significance for OSL mathematics and language when including educational performance (see Model 3). Finally, there is a positive relationship between a student’s age and participation in personal tutoring and commercial company lessons.
While there does not appear to be a general association between central exams and SE enrolment, high-states testing may still bolster SE participation among high-SES students. We test Hypothesis 2 by including a cross-level interaction between SES and central exams in Models 2–5. The results for Model 2 show that the positive relationship between SES and OSL mathematics is stronger in countries with central exams (0.019 + 0.018 × central exams), compared to countries without central exams (see Table 3, Model 2). Note, however, that this effect is only borderline statistically significant (p = 0.06). In the models for OSL language, personal tutoring, and commercial company lessons, the coefficients for the SES × central exams interaction term are in the expected direction but do not reach statistical significance (see Tables 4 to 6). So far, the results in Model 2 show no convincing evidence for our expectation that the positive relationship between SES and participation in shadow expectation is stronger in HSTs-characterized countries (Hypothesis 2). Note, however, that some relevant factors (e.g. student performance, tracking age, and other country differences) are not accounted for in this model specification yet.
In Model 3, we include educational performance to Model 2. We generally find a negative relationship between educational performance and participation in various SE activities. With every one unit (= 100 points on PVs) increase in educational performance, predicted chances to participate in SE decrease with 5.1 (OSL mathematics), 6.1 (OSL language), 9.7 (personal tutor), and 8.5 (commercial company lessons) percentage-point. After the inclusion of educational performance, the positive association between SES and the different measures of SE becomes somewhat stronger. This is possibly due to the positive correlation between SES and educational performance (r = 0.48, p < 0.01), and negative association between educational performance and SE, causing the relationship between SES and SE to be suppressed when performance is not included in the model. The results for the cross-level interactions between SES and central exams are similar to those in Model 2. Again, the interaction term SES × central exams is significantly positive in the models of OSL mathematics (b = 0.019, p < 0.05). Furthermore, we find no statistically significant cross-level interaction between SES and HSTs for OSL language, personal tutoring, and commercial company lessons.
Model 4 includes tracking age (i.e. the first age of selection). The results indicate that the higher the first age of selection, the higher predicted chances of participation in OSL mathematics and language. This relationship seems to be slightly weaker among students from higher socio-economic backgrounds, though interaction terms between tracking age × SES are very close to zero and statistically significant at p = 0.10. More importantly, including tracking age and its cross-level interaction with SES do not alter the results for the moderating role of central exams in the models for OSL in mathematics. Tracking age is not significantly associated with personal tutoring and commercial company lessons.
Finally, Model 5 includes country fixed effects. When statistically controlling for all between-country variance, cross-level interaction terms between SES and central exams are positive and statistically significant for three out of four measures of SE. The positive relationship between SES and SE participation is stronger in countries with central exams for OSL mathematics (0.013 + 0.025 × central exams), personal tutoring (0.016 + 0.035 × central exams), and commercial company lessons (0.020 + 0.012 × central exams). Note, however, that the cross-level interaction between SES and central exams for commercial company lessons is only borderline statistically significant (p = 0.06). For OSL language, both the estimated main effect of SES and the interaction between SES and central exams do not significantly differ from zero. 9
Figure 2 summarizes the results of the country fixed effects models (Model 5) by showing average marginal effects (AMEs) of SES on participation in different forms of SE in countries with and without central exams. In comparison with the results presented in Models 2–4, the results in the country fixed effects models provide more support for Hypothesis 2. The figure illustrates that the positive effect of SES on the predicted probability of SE enrolment is stronger in countries characterized by central exams, compared to countries without central exams, for OSL mathematics, personal tutoring, and commercial company lessons. This suggests that social inequalities in different types of SE are more pronounced in countries characterized by central exams. Unobserved cross-country differences may have suppressed the moderating role of central exams for some types of supplementary learning (i.e. commercial company, private tutoring) in the previous models.
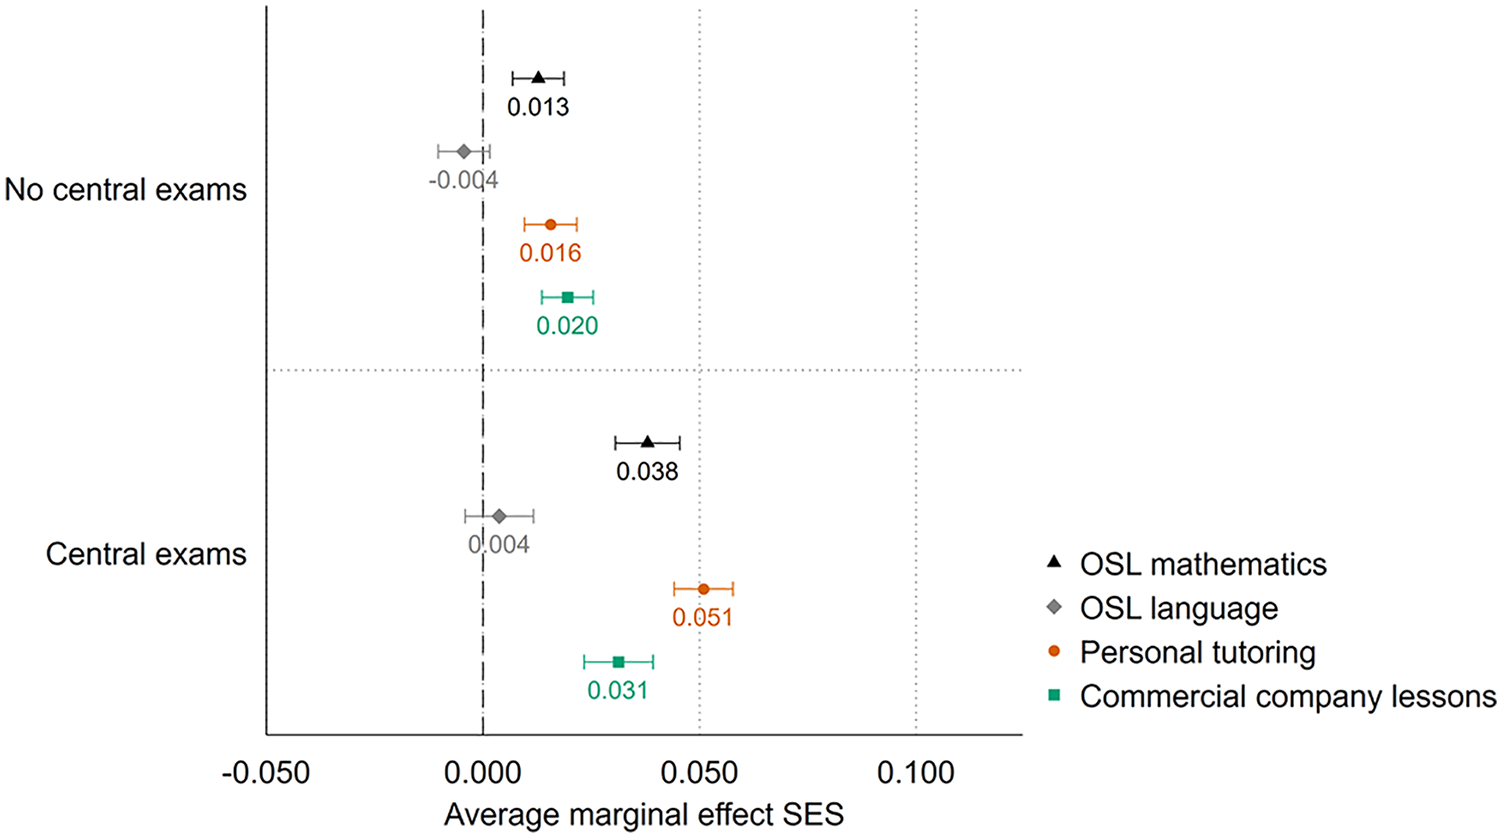
Average marginal effects SES on participation in different types of shadow education in countries with and without central exams.
Conclusion and discussion
The worldwide expansion of SE may have far-reaching implications for educational systems in terms of social inequalities. Prior research in various countries demonstrated that high-SES students are more prone to participate in SE (e.g. Buchmann et al., 2010; Davies, 2004; Kim and Lee, 2010; Silova, 2010). An institutional characteristic that is often connected to the emergence and prevalence of SE is high-stakes testing (Baker and LeTendre, 2005; Buchmann et al., 2010; Stevenson and Baker, 1992). However, so far, no studies have examined whether HSTs moderate the relationship between students’ socio-economic background and SE participation. Using data from PISA 2012, we studied the extent to which students from higher SES backgrounds participate more in SE, and whether this relationship is strengthened by the presence of HSTs.
Confirming previous studies (e.g. Buchmann et al., 2010; Entrich, 2020; Smyth, 2009; Stevenson and Baker, 1992), our results showed that higher SES students generally participate more in various SE activities. However, also note the findings by Entrich (2020) in this special issue, demonstrating that in some countries no social inequality or even a reversed SES gap in SE enrolment exists. Social inequalities in SE may translate into inequalities in educational performance and attainment. While the strength and direction of the association between SE enrolment and educational outcomes depends on students’ background characteristics, the type and use intensity of SE, and the national context, SE participation generally improves a student’s future educational outcomes (Choi and Park, 2016; Dang and Rogers, 2008; Smyth, 2009).
In line with other comparative work (Baker et al., 2001; Entrich, 2020), the presence of central exams (indicative of a culture of high-stakes testing) was not related to students’ SE participation in general. However, and in line with our expectation, we found evidence—when accounting for unobserved country differences—that in countries characterized by high-stakes testing, social inequalities are more pronounced in OSL in mathematics, personal tutoring, and commercial company lessons.
In a related study using PISA 2012 data in this special issue, Entrich (2020) found no evidence for higher social inequalities in commercial company lessons and personal tutoring in countries characterized by high-stakes testing. While these findings may seem at odds with our findings, similar to Entrich (2020), we also found no support for the moderating effect of HSTs on the relationship between SES and commercial company lessons or personal tutoring in models in which we did not account for unobserved country differences (i.e. models without country fixed effects). Possibly unobserved economic, cultural, and/or institutional characteristics of countries are related to both the absence (or presence) of HSTs in a country, as well as the presence (or absence) of socio-economic inequalities in SE. Not accounting for these unobserved country differences may then suppress the moderating role of HSTs on socio-economic inequalities in SE. Note that these factors are likely to be different from those included in the study by Entrich (2020) (e.g. world region, level of income inequality, education enrolment rates, and national institutionalization of SE). Future research should further examine how high-stakes testing—and the accompanying incentives to gain comparative advantages through SE participation—relate to the magnitude of social inequalities in the use of supplementary education.
Our study has some limitations. As mentioned earlier, some of our SE measures are broad, and do not distinguish paid from unpaid supplementary education. PISA questions about out-of-school-time classes and personal tutoring are modified almost every cycle. The latest PISA assessments (2015 and 2018) include (different) questions on participation in various types of “additional instruction” in the “Education career questionnaire.” Unfortunately, only part of the countries participated in these optional surveys. Moreover, these rounds do not make the fee-paying nature of SE explicit. The worldwide expansion of SE makes it increasingly relevant for international surveys on education such as PISA to further develop and specify questions about SE. Although researchers will always have to account for cross-national variations in the characteristics of SE and potential country differences in the interpretation of survey items, this will enhance the possibilities for cross-national research on SE.
Another data-related issue is that the PISA sample is limited to 15-year-old students, while HSTs usually take place at the end of secondary education when students are approximately 17–19 years old (OECD, 2012). Hence, for students in the PISA sample—with either a lower or higher SES—the presence of high-stakes tests may not yet affect their SE participation, as they may not have to take these tests in the near future. If feasible, future research should focus on a slightly older sample of students, and develop a more fine-grained operationalization of high-stakes testing (i.e. number of years to the test 10 ).
Furthermore, due to the cross-sectionality of our data, we cannot draw any causal conclusions based on our findings. Ideally, we should have used a longitudinal design to examine our research question. However, there were insufficient changes in the extent to which countries use central exams in the period for which cross-nationally comparative data on HSTs and SE is available. Moreover, items on SE have changed almost every PISA-cycle, impeding the longitudinal analyses of SE with PISA data.
Relatedly, we controlled for educational performance in some of our models. While recognizing that performance may be endogenous on SE participation, performance is also known to be an important determinant of SE enrolment. Hence, leaving this confounder out of the regression equation can result in omitted variable bias. We find that performance is negatively associated with participation in SE activities, suggesting that SE has a remedial purpose for most students. Note, however, that the relationship between performance and SE can differ between countries. In this regard, prior research showed that in some countries, especially in Eastern Asia, the enrichment strategy (i.e. high-performing students are more likely to use SE than low-performing students) is dominant (Baker et al., 2001; Byun et al., 2018). Furthermore, the magnitude of social inequalities in SE is found to be related to incentives for higher-performing students to use SE (Entrich, 2020), which may be higher in competitive systems characterized by high-stakes testing.
If longitudinal information on performance and SE is available, an interesting avenue for future research would therefore be to further examine the relationship between SES, performance, HSTs, and SE participation. It may, for instance, be that social disparities in SE are especially pronounced among high-performing students: when test stakes are high, higher SES parents may invest in SE, independent of their children’s performance. In contrast, investments in SE of low-SES parents may be more conditional on performance; they may only invest in SE when their children’s performance is low, not when it is relatively high.
Despite these limitations, this study has, again, called attention to the social inequalities in participation in SE. Furthermore, we have contributed to comparative work on the role of institutional characteristics—in specific, high-stakes testing—on these social inequalities.
Footnotes
Appendix 1
Funding
The author(s) disclosed receipt of the following financial support for the research, authorship, and/or publication of this article: This study was made possible through a Vici-grant awarded to Herman G. van de Werfhorst by the Netherlands’ Organisation for Scientific Research (NWO), grant number 453-14-017 and a Veni-grant awarded to Sara Geven by the Netherlands’ Organisation for Scientific Research (NWO), grant number 016.Veni.195.125.