
Abstract
In construction machinery, constructing an actual working cycle is of great significance for the research of construction machinery control strategy. This paper proposes a novel method for constructing a bulldozer’s working cycle load spectrum, using Improved Crested Porcupine Optimizer (ICPO) to improve the K-means clustering algorithm and cluster the actual working data of bulldozers. The ICPO is obtained by incorporating the Grey Wolf Optimizer and Ant Colony Optimizer into the first and third defense strategies of the Crested Porcupine Optimizer, respectively, and the convergence speed and accuracy of the ICPO are significantly improved. The K-ICPO clustering algorithm is developed by optimizing the K-means clustering algorithm using ICPO. The K-ICPO clustering algorithm achieves an average accuracy of 90.1%, representing an improvement of 2.42%. Using the K-ICPO clustering algorithm, a typical working cycle of pure electric bulldozers is constructed, and the load spectrum constructed is highly similar to the “load change rate” distribution of the original data, proving the accuracy of the load spectrum construction method proposed in this paper.
Introduction
Construction machinery can significantly improve the efficiency of engineering operations while ensuring the quality of work and is therefore widely used in fields such as construction, water conservancy, and agriculture. However, the working environment of construction machinery is complex, with drastic load changes, high energy consumption, and severe pollution.1,2 Currently, countries have introduced stricter emission regulations, and the development of energy-saving and environmentally friendly new energy products has become a new trend for modern construction machinery to achieve sustainable development. Due to the complex operation of construction machinery, key technical issues such as battery management, power matching, and control optimization need to be addressed for new energy construction machinery. The load spectrum of the working process is an essential external load parameter for construction machinery, which is of great significance for the analysis and research of power matching and overall control strategies of construction machinery.
The construction of traditional load spectra primarily relies on simplified assumptions, without considering loads’ complexity and nonlinear characteristics in actual operating conditions. To address this issue, in recent years, more researchers have started using measured load data and advanced data processing methods to improve the accuracy and reliability of load spectrum construction. Wang et al. 3 proposed a non-stationary load spectrum acquisition method based on an on-site testing system, which converted complex random load signals into steady-state load signals through step-by-step data processing, and successfully constructs the load spectrum required for fatigue analysis of complex machinery. Zhu et al. 4 developed a new type of sensor, combined with the rain flow counting method and Weibull distribution, to generate the wear load spectrum of concrete pump bearings, which could effectively avoid the errors caused by traditional assumptions and improve the accuracy of wear prediction. Junhua et al. 5 proposed a testing device for excavator flow recovery characteristics based on measured load spectra and verified the method’s feasibility through the AMESim model. The combination of machine learning and data-driven methods for predicting load spectra in complex dynamic systems has gradually attracted the attention of researchers. Chen et al. proposed a load spectrum prediction method based on historical data by combining machine learning and experimental data. By optimizing data preprocessing and learning strategies, accurate prediction of load spectra in complex engineering systems such as high-speed railways was achieved. 6 Shao et al. proposed a mixed Gaussian Weibull distribution model for the dynamic stress spectrum of tractor front wheel drive axles. They improved the estimation accuracy of the stress spectrum by optimizing parameter identification through a genetic algorithm. 7
With the development of calculation methods and data processing techniques, the accuracy and efficiency of load spectrum construction have been effectively improved. Lu et al. 8 used Support Vector Regression (SVR) to model the load spectrum of cranes, improving the accuracy and robustness of load spectrum prediction. When designing the load spectrum calculation software for wheeled cranes, Zhu et al. 9 proposed a batch database creation method that could achieve fast and efficient load spectrum calculation for large-scale data tables and field processing. Wen et al. 10 employed deep learning techniques to identify high-intensity tractor load segments using the MHA ConvLSTM network model, which could analyze and classify large-scale load spectrum data with high accuracy and efficiency.
K-means is a clustering algorithm commonly used to construct load spectra. Still, it was sensitive to the selection of initial clustering centers and prone to getting stuck in local optima. 11 Researchers widely use metaheuristic algorithms to improve the stability and clustering performance of the k-means algorithm. For example, Li et al. 12 used the Adaptive Particle Swarm Optimization (ALPSO) algorithm to design an improved k-means algorithm (KM-ALPSO), which overcame the problem of strong initial centroid dependence in traditional algorithms and has been validated on various practical datasets. Genetic algorithm (GA) and ant colony optimization (ACO) also played a role in optimizing the K-means algorithm. Genetic algorithm improved the convergence speed of the algorithm by reducing the iteration steps. 13 At the same time, ant colony optimization enhanced the clustering process by making it more dynamic and accurate, as it calculated the probability of selecting and discarding data items. 14 The global optimization capability of the simulated annealing algorithm (SA) can effectively enhance the K-means algorithm. Dong and Qi 15 found that the strategy of combining split k-means with simulated annealing can significantly improve the efficiency and global search ability of the algorithm. These studies provide various innovative ideas for solving the local optimization problem of the k-means algorithm and expanding its application scope in complex scenarios.
From the above research, it can be seen that researchers have conducted extensive studies on load spectrum prediction and reliability analysis of various construction machinery. However, traditional load spectrum generation methods rely on classical distribution models or empirical formulas, which make it challenging to reflect the actual loads in complex and changing environments. The efficiency and accuracy of load spectrum construction still need further improvement. Based on the above problems, this paper proposes a novel method to construct the load spectrum of a pure electric bulldozer under typical working conditions, in which the ant colony algorithm and gray wolf algorithm are used to improve the Crested Porcupine Optimizer, and the enhanced optimization algorithm is used to strengthen the k-means clustering algorithm. The improved clustering algorithm has high accuracy and calculation efficiency in constructing the load spectrum of a pure electric bulldozer under typical working conditions.
Pure electric bulldozer data acquisition and processing
Data acquisition and processing
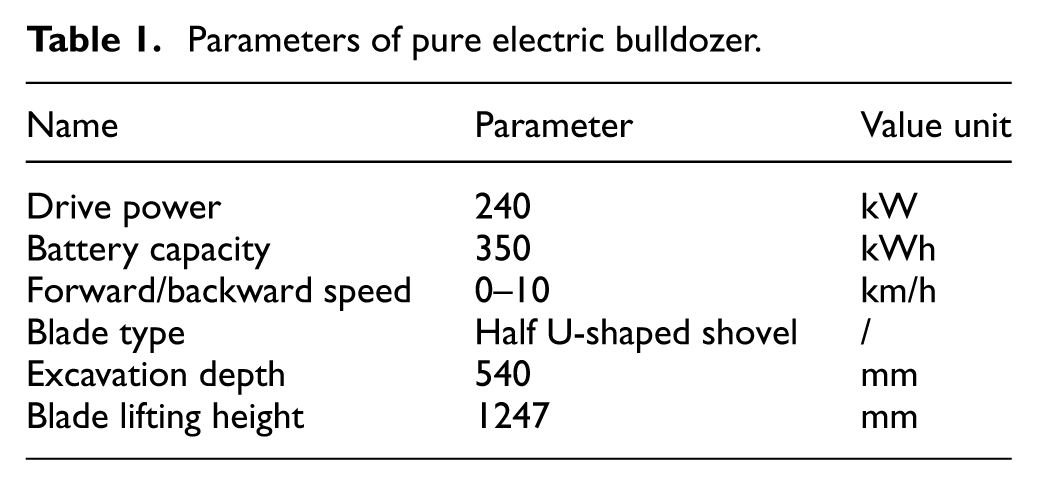
The data collection is conducted at the testing site. The bulldozer selected is a pure electric tracked bulldozer DE26-X2 produced by a specific manufacturer. The power source of this bulldozer model is a 350 kWh lithium-iron-phosphate power battery. The movement and steering of the bulldozer are driven by left and right walking motors, and the lifting, lowering, left tilting, right tilting, and other actions of the shovel are driven by hydraulic motors. The bulldozer is equipped with three power modes: energy-saving mode, standard mode, and power mode, which allow for a balanced match between power and economy according to load requirements. During data collection, the driver operates the bulldozer in three power modes to perform low, medium, and high load operations. The relevant parameters of the pure electric bulldozer involved in data collection are shown in Table 1.
Parameters of pure electric bulldozer.
When a bulldozer was working, it included the following processes: idling, cutting soil, collecting soil, transporting soil, unloading soil, and reversing. 16 The driving load of a bulldozer mainly depends on the working state of the shovel. The deeper the soil cutting depth, the greater the load on the bulldozer. The hydraulic load of the shovel will ultimately be reflected in the driving resistance. Therefore, recording the load of the left and right driving motors during the operation of the bulldozer can calculate the load of the bulldozer at different working stages.
The output power of the left and right walking motors is:
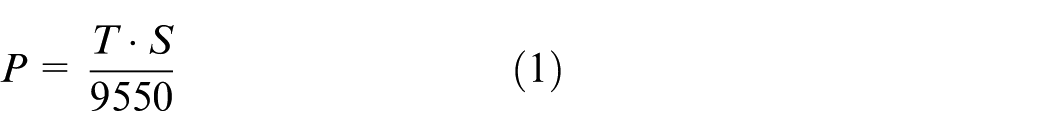
In the formula,
The driving speed of the bulldozer is:
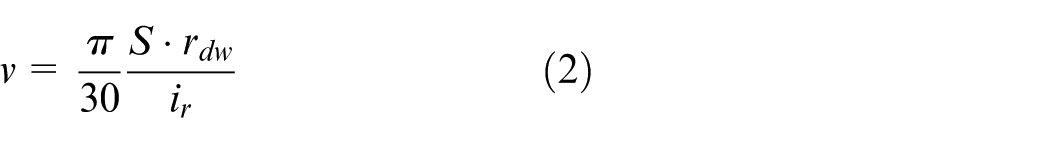
In the formula,
The driving load of a bulldozer (kN) is the sum of the driving loads of the left and right drive wheels:
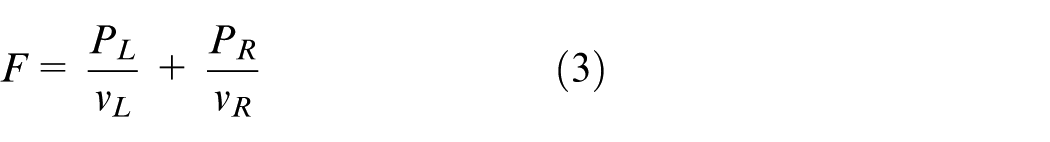
In the formula, subscripts L and R represent the left and right drive wheels, respectively.
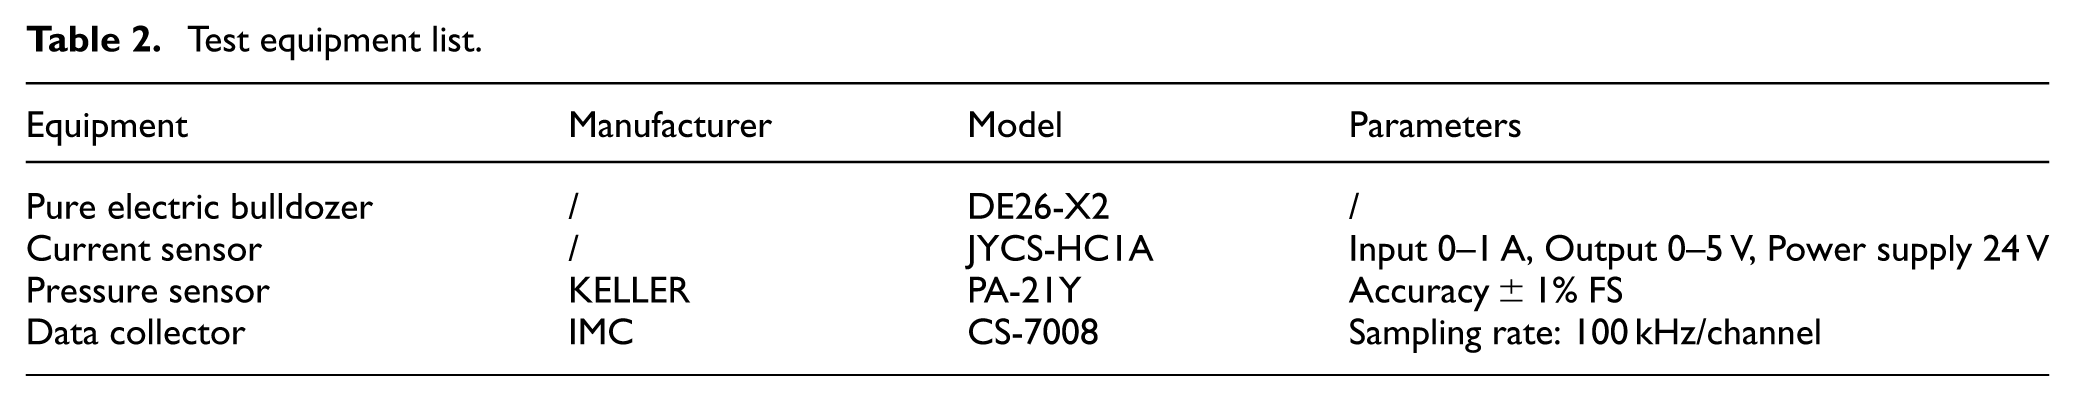
When data collection is performed, the driver drives the bulldozer to repeat the work processes of low load, medium load, and high load. The equipment used for data collection is a USBCAN-OBD analyzer, model imc-cs-7008, which collects data through the Controller Area Network (CAN) on the vehicle connected to the OBD interface, as shown in Figure 1. The collected data included the speed and torque of the hydraulic motor of the dozer, the speed and torque of the left and right travel motors, and the hydraulic pressures of the four movements of the shovel blade: lifting, lowering, left tilting, and right tilting, and an example of the collected data under high load in power mode is shown in Figure 2. The equipment used for data collection and its main parameters are shown in Table 2. The flowchart for transmitting experimental data is shown in Figure 3.
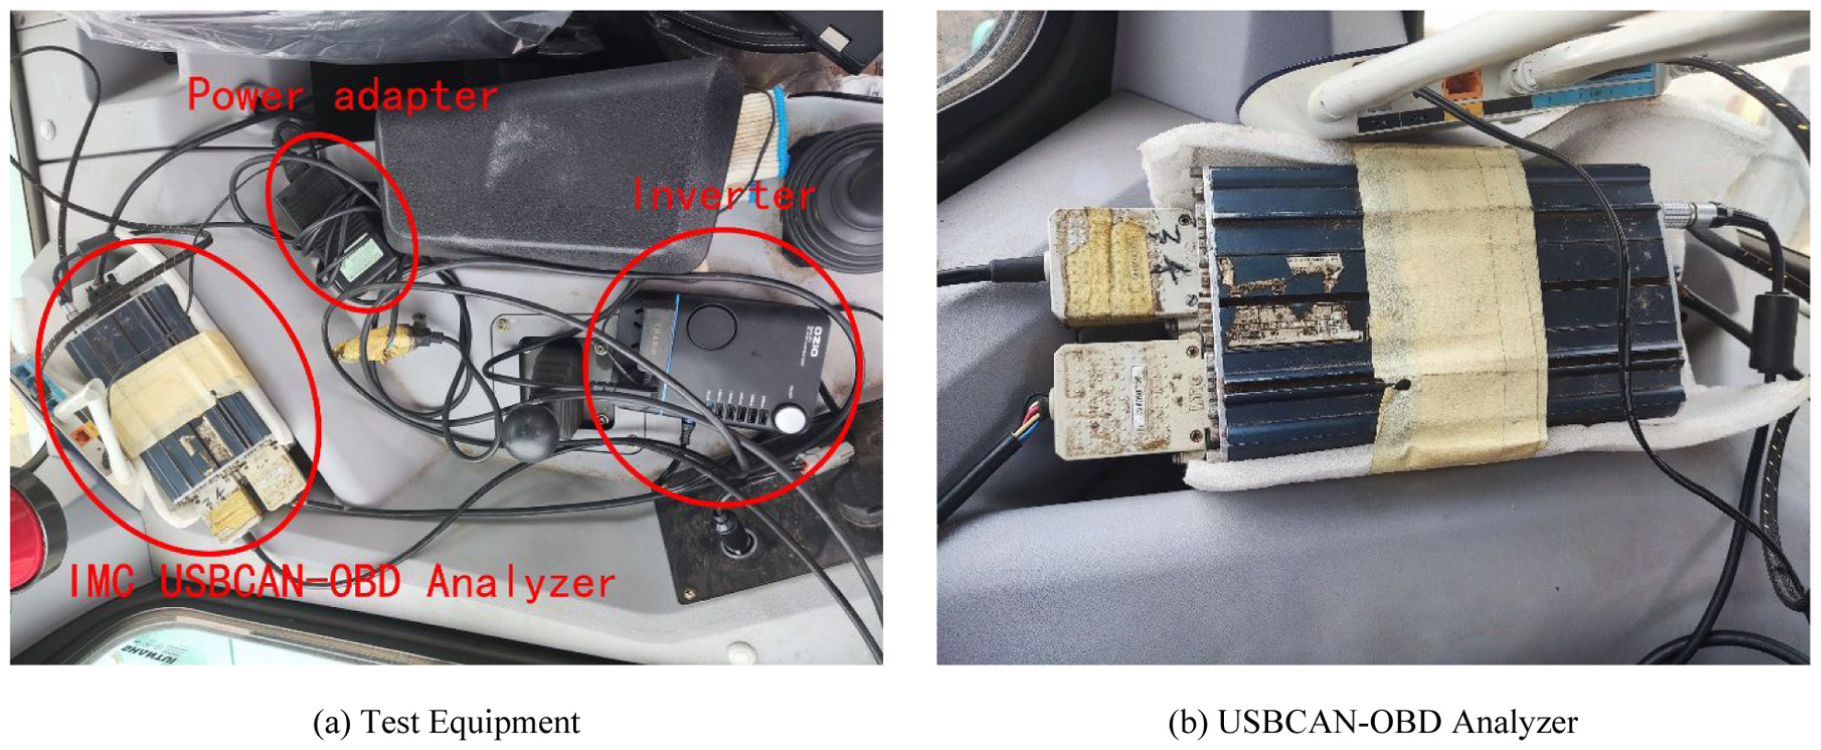
Test equipment and USBCAN-OBD analyzer: (a) test equipment and (b) USBCAN-OBD analyzer.
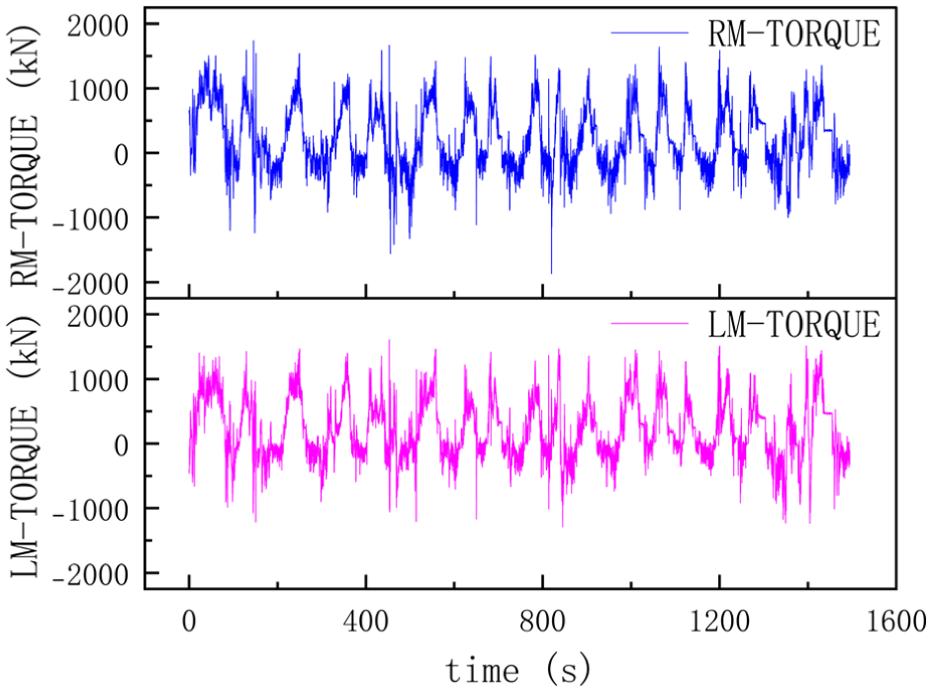
Example of data acquisition of left and right drive motor torque of bulldozer under high load in power mode.
Test equipment list.
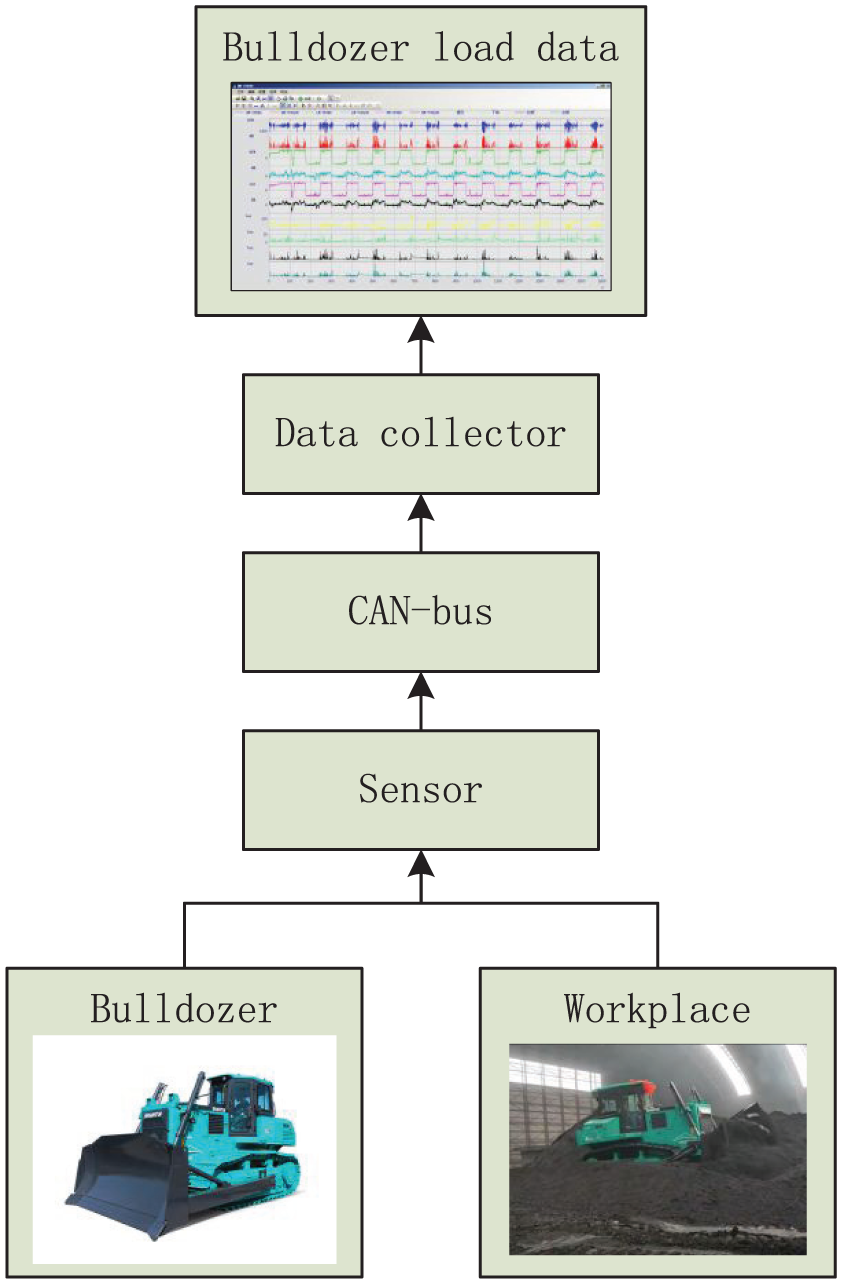
Experimental data transmission flowchart.
Summarize the data collected from multiple experiments, calculate the load using formulas (1)–(3), and obtain the original data graph of the load variation over time (Figure 4).
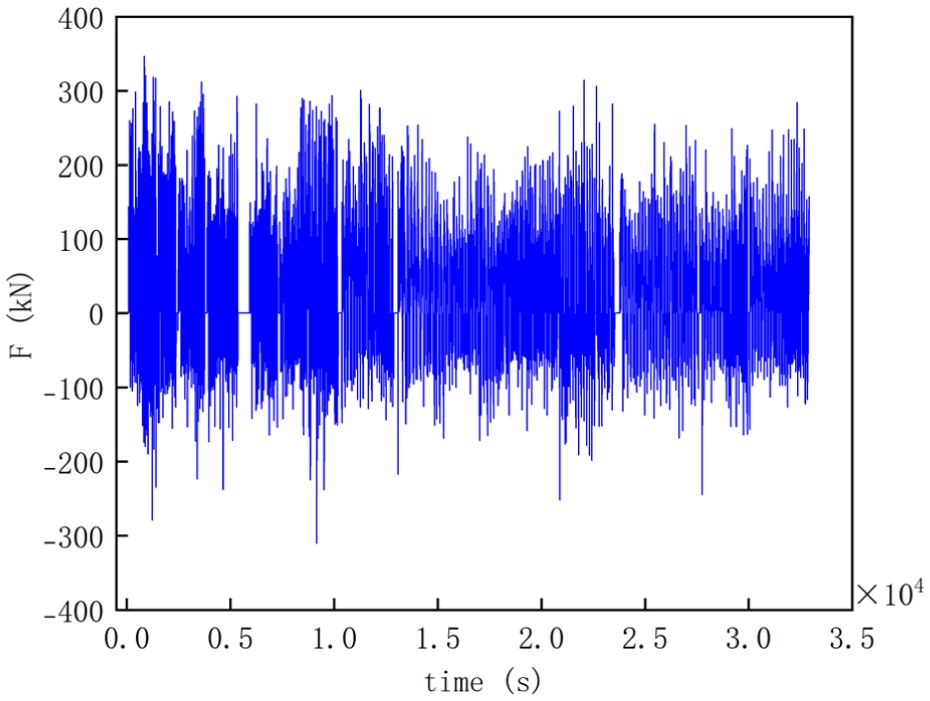
Raw data of bulldozer load.
Data processing and PCA
Before clustering the data, two aspects of processing are required: on the one hand, due to errors in the experimental equipment, road bumps, driver operations, and other factors during the experimental process, there may be some abnormal experimental data that needs to be processed on the original data; On the other hand, before constructing the load spectrum through clustering, it is necessary to divide the data into many individual work cycle segments according to the bulldozer work cycle. While working on this research, we simultaneously process both aspects of the data.
As mentioned earlier, during the operation of a bulldozer, a work cycle includes several processes, such as idle, cutting, collecting, transporting, unloading, and reversing. When dividing the data into segments, it is necessary to ensure that each segment is a work cycle that includes all work segments. Therefore, the following screening principles are adopted:
(1) Using bulldozer driving speed recognition loop segments, divide the segments into “stop -forward – stop – backward–stop”;
(2) Each segment consists of two sub-segments, “forward” and “backward,” with a duration of no less than 5 s for each sub-segment;
(3) Discard the parking segment during data collection.
Finally, 203 bulldozer cycle segments are processed and filtered, and the load time of all segments is plotted in Figure 5.
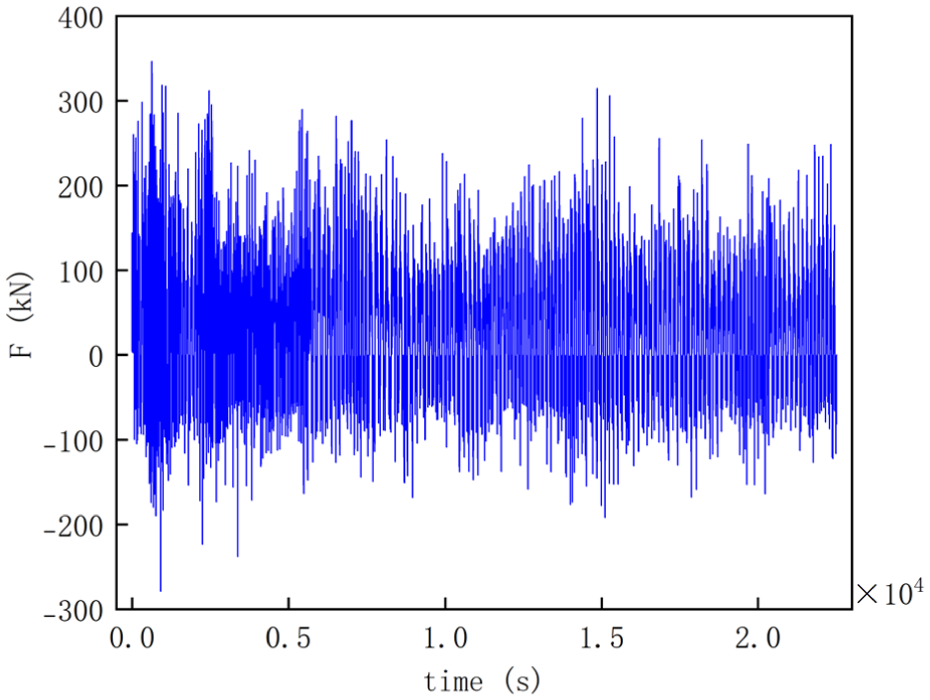
Load of cycle segments.
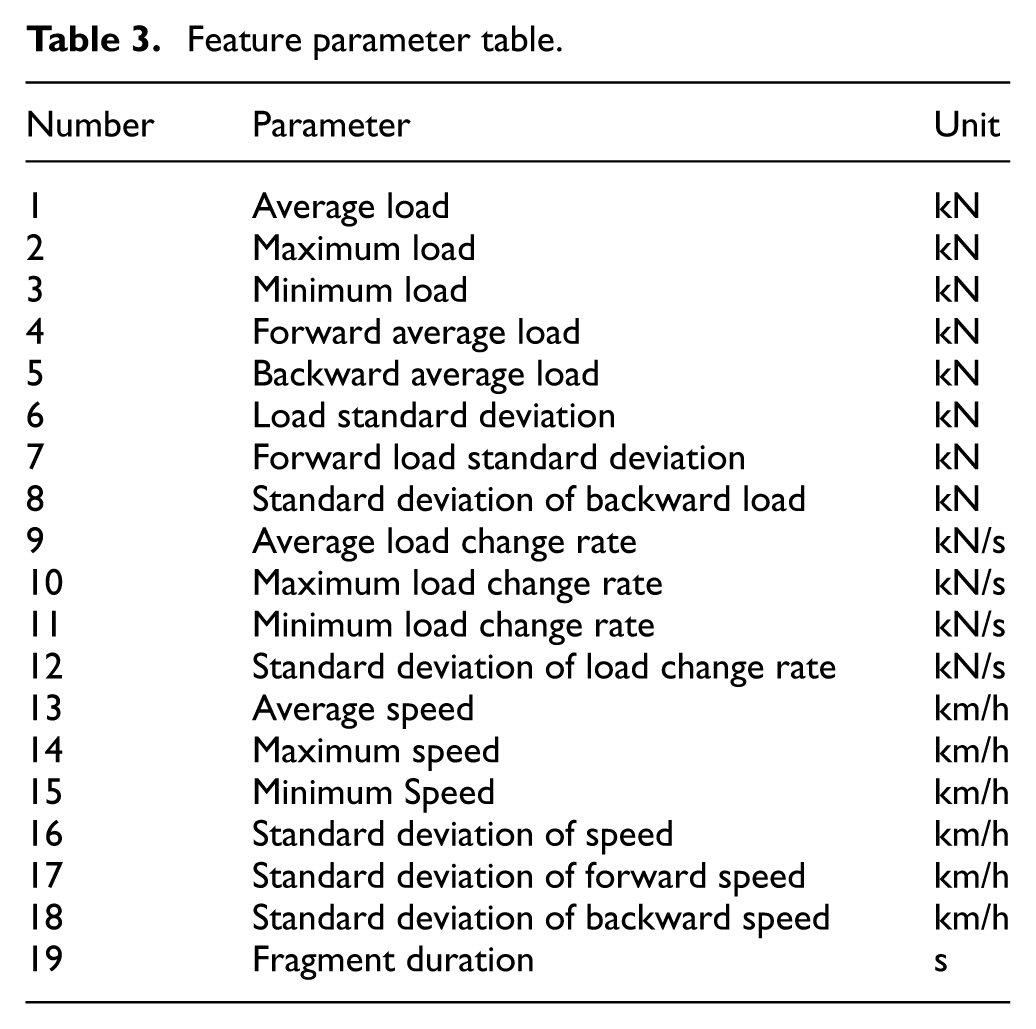
Due to the large number of characteristic parameters that affect the load of bulldozers, PCA (principal components analysis) 17 is needed to reduce the dimensionality of the data. The load spectrum segments are described using 19 characteristic parameters that reflect bulldozer operation, as listed in Table 3.
Feature parameter table.
Firstly, 19 characteristic parameters of different orders of magnitude are standardized to obtain the matrix
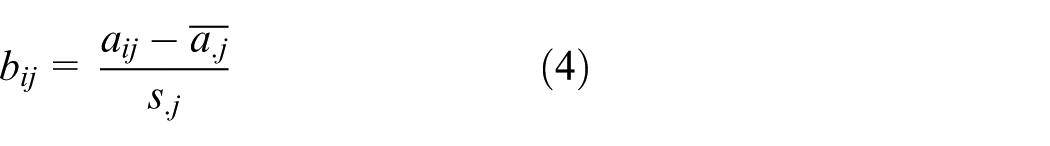
Where
The correlation coefficient matrix
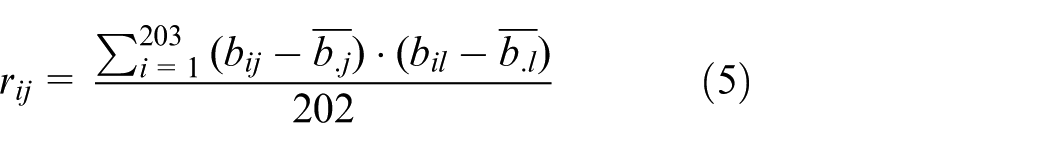
Where
After calculation, the cumulative contribution rate of the first seven principal components in the matrix
Improved intelligent algorithms and clustering algorithms
Improved Crested Porcupine Optimizer (ICPO)
GWO and ACO are integrated
The Crested Porcupine Optimizer (CPO) 18 was a metaheuristic algorithm inspired by the defensive behaviors of crested porcupines. It simulated four defensive strategies: vision, hearing, olfaction, and physical attack. Among these, the first two strategies correspond to the exploration phase of the algorithm, while the latter two represented the exploitation phase. The CPO can avoid local optima to some extent and accelerate convergence in the late optimization stages.
Integration of the Grey Wolf Optimizer
Although the Crested Porcupine Optimizer exhibits outstanding performance, it suffers from slow search speed during the early exploration phase and is prone to getting trapped in local optima. On the other hand, the Grey Wolf Optimizer (GWO) 19 performed excellently in global search stages, with its leader-follower mechanism facilitating faster convergence and reduced computation time. This section integrates the GWO’s encircling and hunting processes into the first defensive strategy of the CPO. By combining the group collaboration mechanism of GWO with the individual exploratory behavior of the CPO, the algorithm achieves improved solution diversity, avoids premature convergence, and enhances stability.
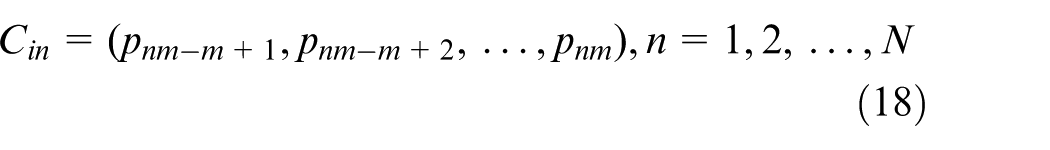
The first strategy of the Crested Porcupine Optimizer is to start from the current position
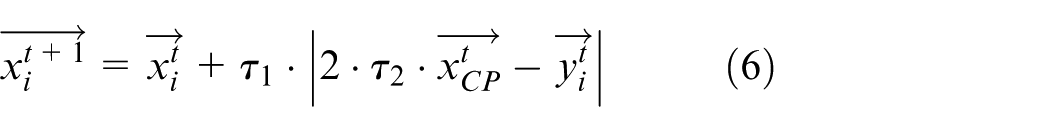
The mathematical formula for
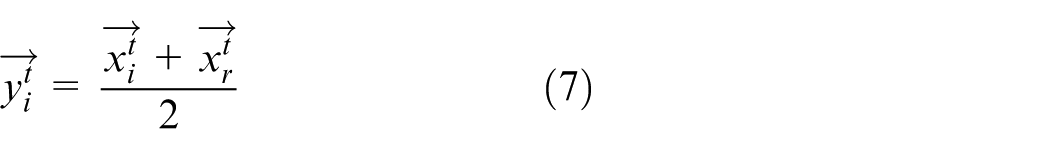
The updated formula for the first defense mechanism after integrating the Grey Wolf Optimizer is:
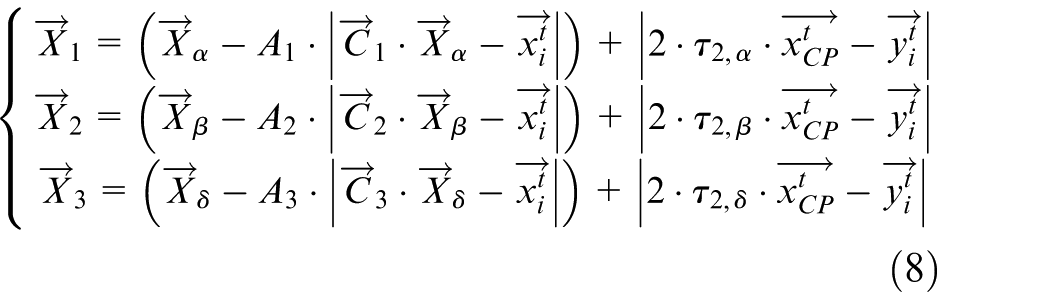
In the formula,
Integration of the Ant Colony Optimizer
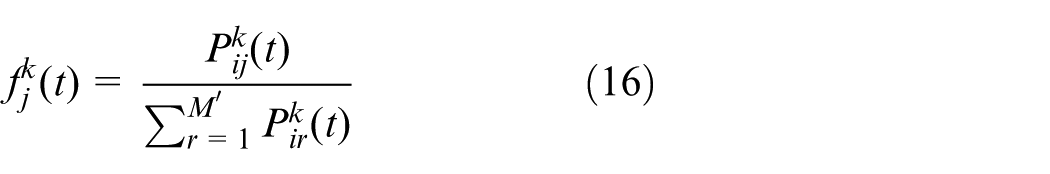
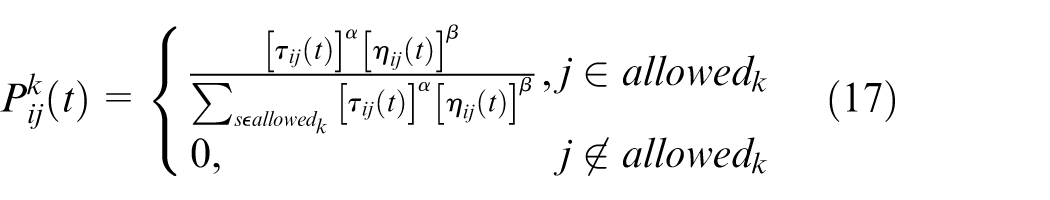
Ant Colony Optimizer (ACO) 20 could effectively handle complex optimization problems such as high-dimensional, nonlinear, and non-convex problems, and has been widely applied in various fields such as path planning, combinatorial optimization, and machine learning. We introduce the path optimization of Ant Colony Optimizer into the third defense mechanism of Crested Porcupine Optimizer to improve the odor diffusion factor. The fitness value in the odor diffusion factor is improved by utilizing the maximum transition probability obtained through optimization of the optimal path in the Ant Colony Optimizer. The fitness value in the odor diffusion factor is combined with pheromones, so that when selecting a new location, porcupines not only consider their own fitness, but also the concentration of pheromones. Specifically, by using the roulette wheel betting method to select paths with high pheromone concentration and good fitness for movement, the algorithm’s global search capability is enhanced.
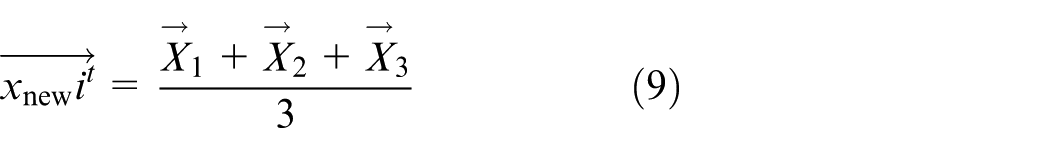
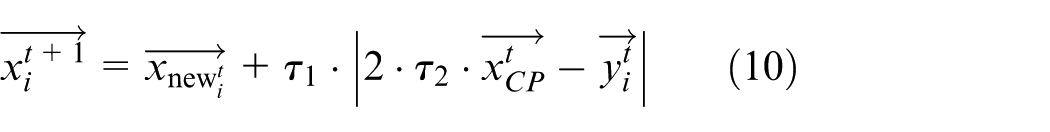
The simulation of the third defense strategy for Porcupine involves the diffusion of odors to the surrounding area to prevent predators from approaching. The odor diffusion factor can prevent the algorithm from getting stuck in local optima. The formula for the third defense strategy 18 is as follows:
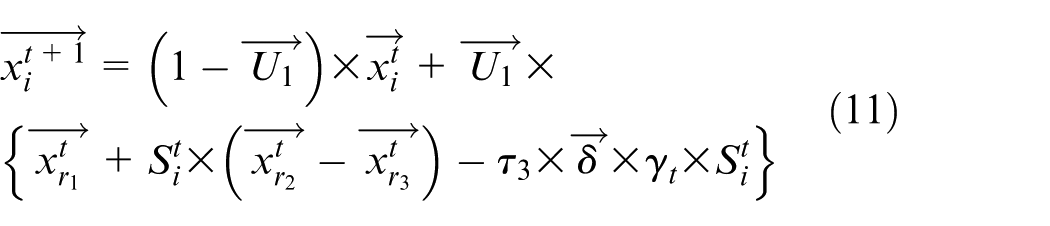
The relevant definitions of the third defense strategy are as follows:
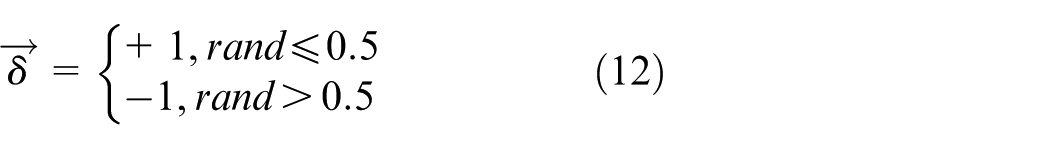
The optimized odor diffusion factor 18 is:

Where,
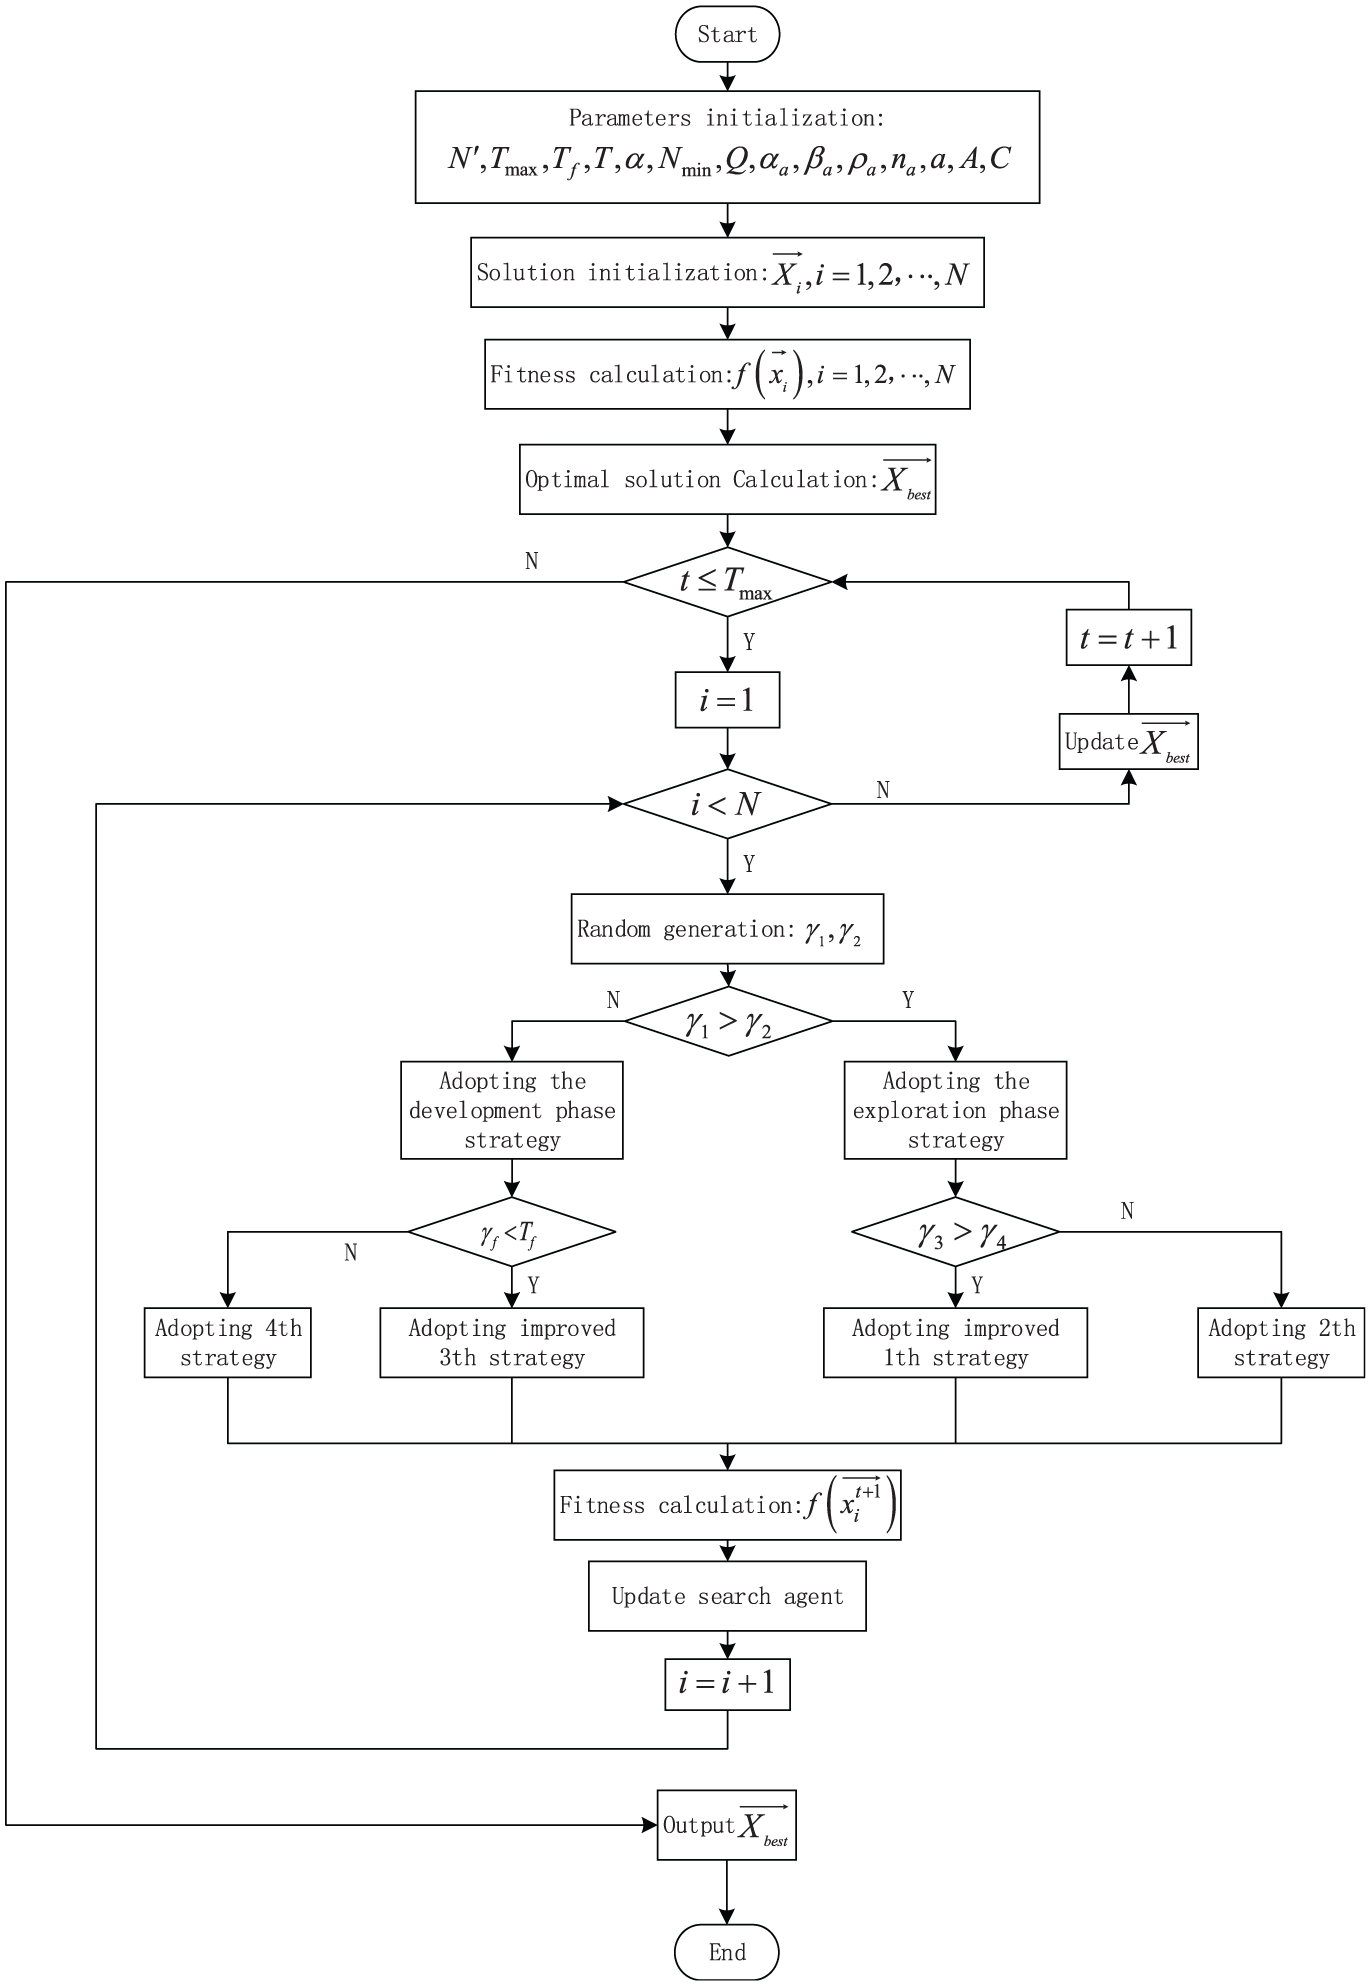
The flowchart of ICPO.
Performance verification of ICPO
Benchmark test function
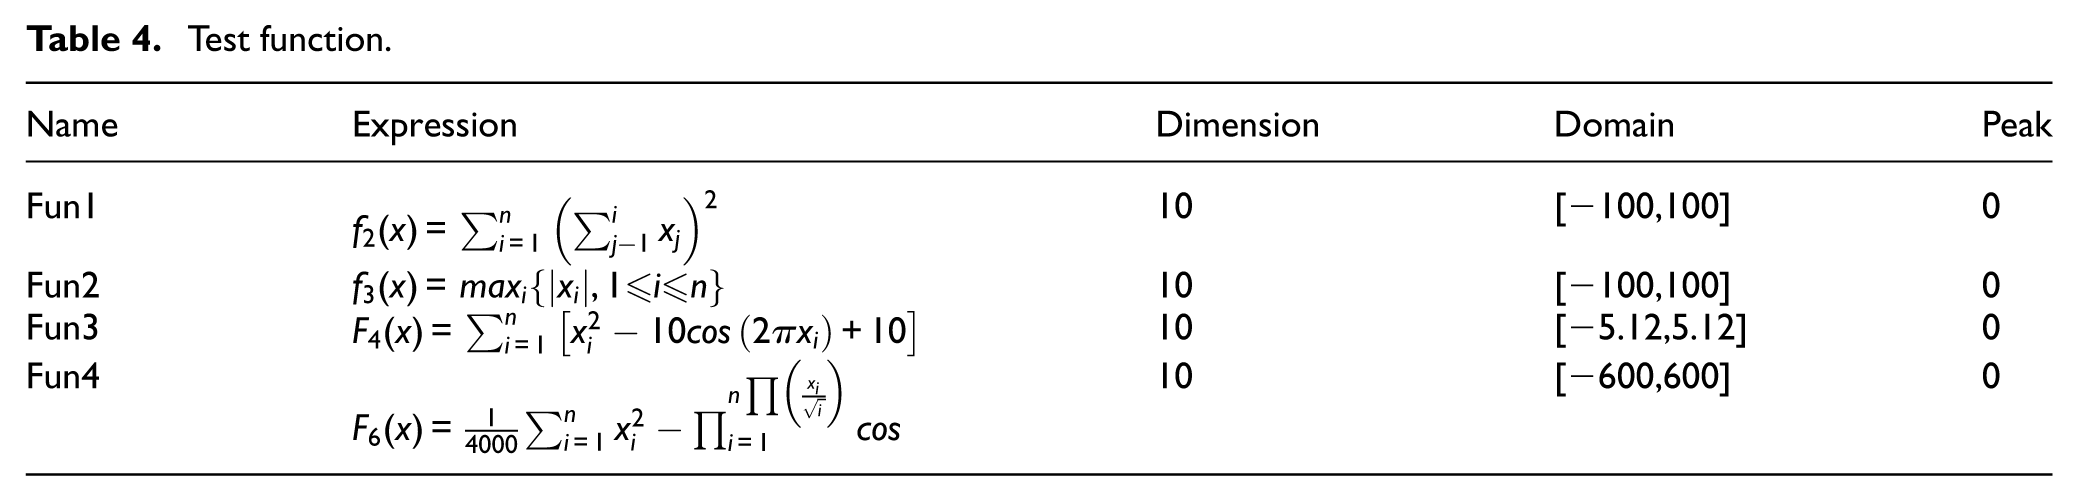
To verify the effectiveness of the ICPO, ACO, CPO, GWO, sine cosine algorithm (SCA) and whale algorithm (WOA) are selected for comparative analysis with the ICPO proposed in this paper. These six algorithms are used to perform extreme value optimization calculations on four classic multivariate benchmark test functions.21,22 The definitions and plots of benchmark functions Fun1-Fun4 are shown in Table 4 and Figure 7.
Test function.
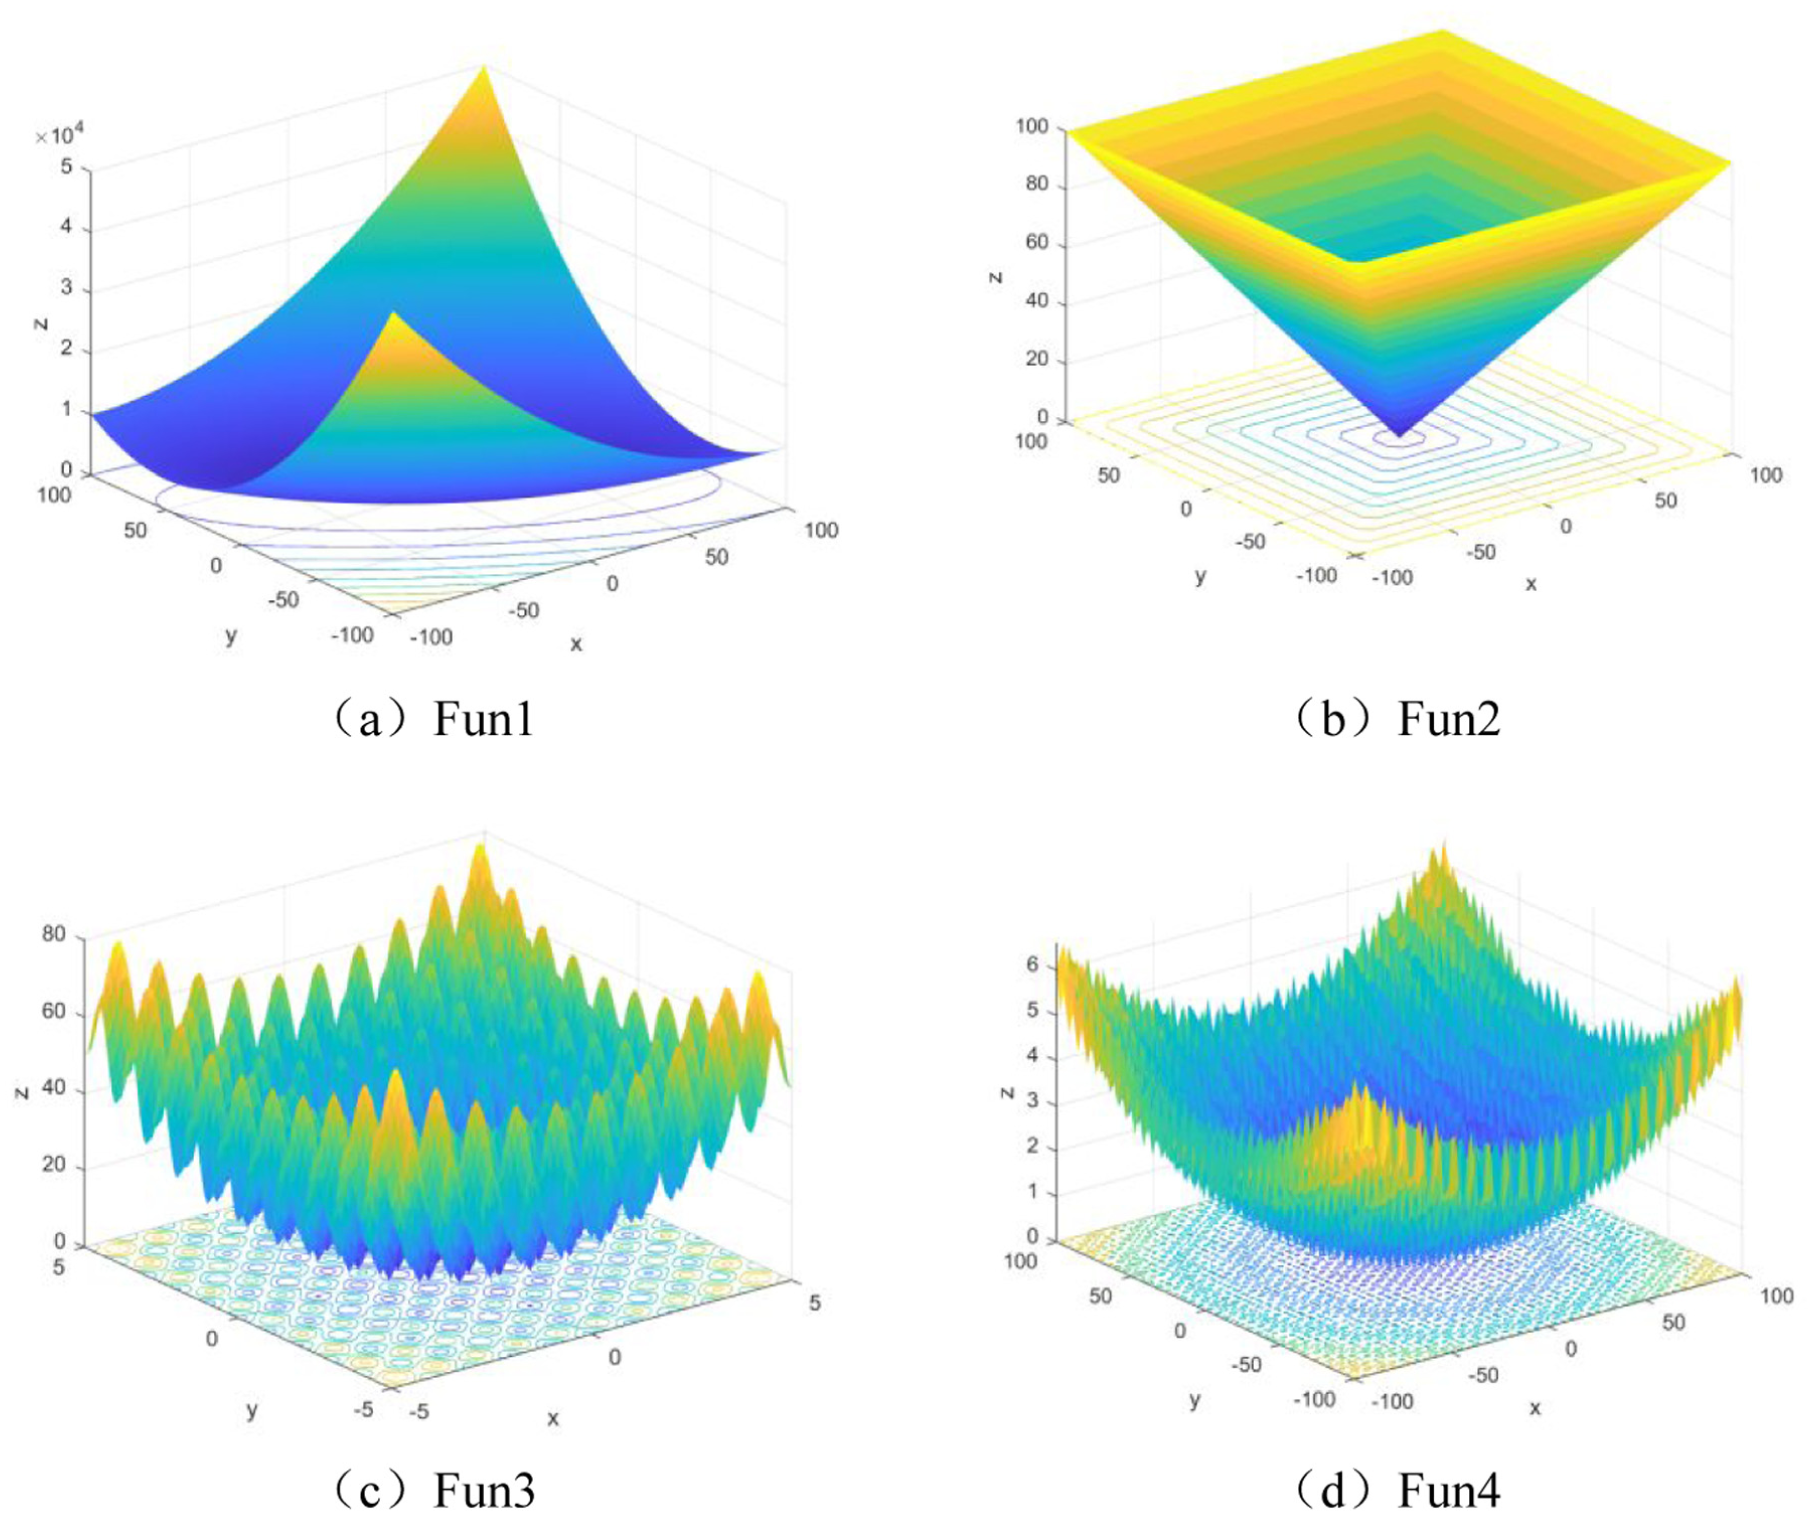
Test function image: (a) Fun1, (b) Fun2, (c) Fun3, and (d) Fun4.
Comparative analysis of performance tests
The hardware and software parameters used for algorithm performance testing are: Intel(R) Core(TM) i7-4790 CPU @ 2.30 GHz, Windows10, MATLAB (2020a), The maximum number of iterations is set to 200, and the number of search agents is 30. Perform 30 rounds of optimization using the algorithm to be tested for each test function, and record the optimal solution, worst solution, average, and standard deviation as shown in Table 5.
Comparison of test function results.
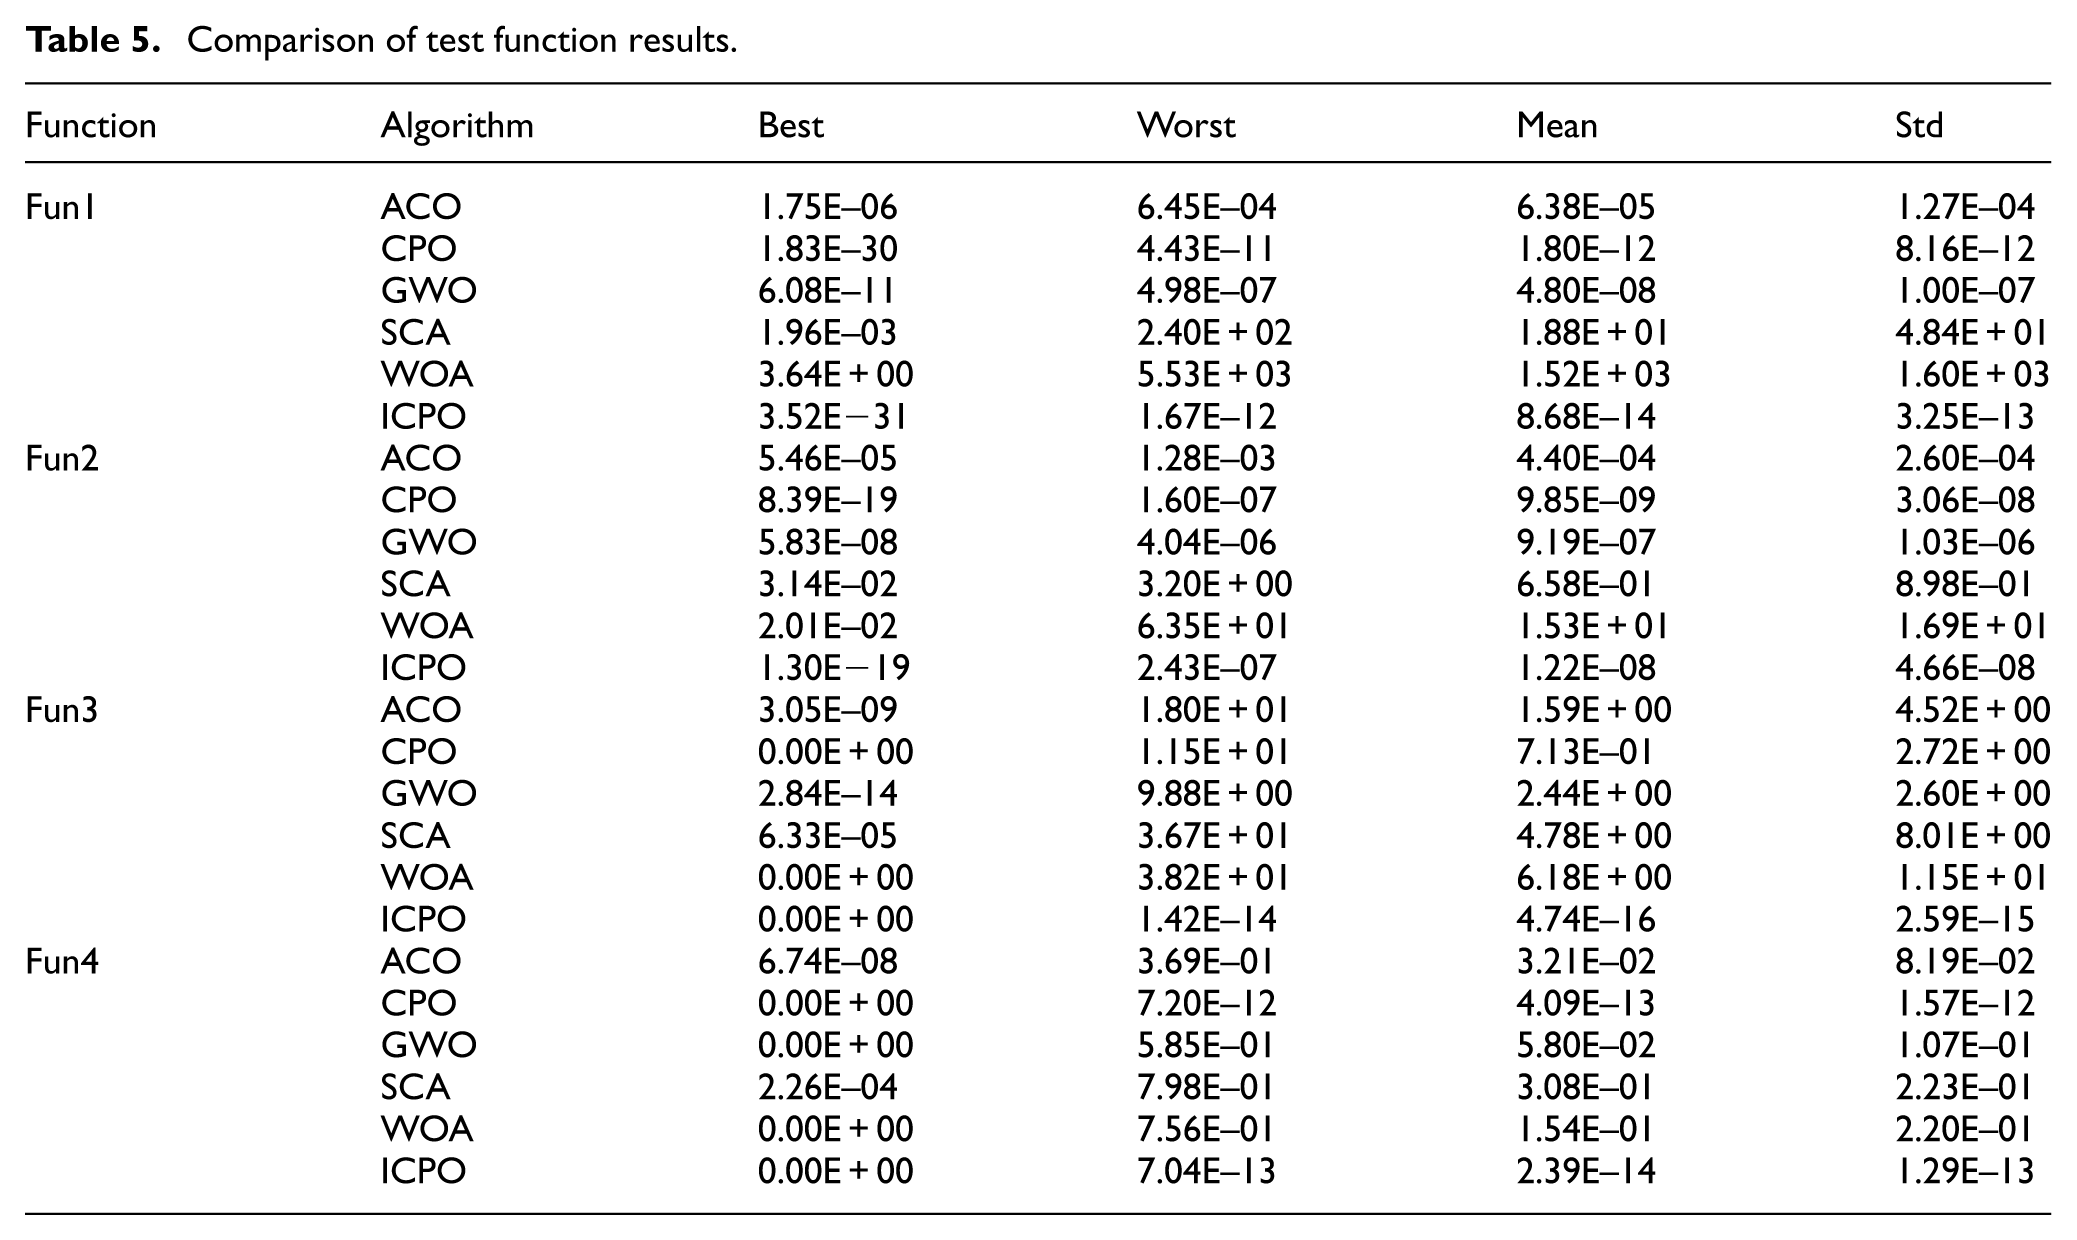
The results show that the optimal solution, worst solution, mean, and standard deviation of CPO and ICPO are far ahead of other algorithms in Fun1 and Fun2, with the maximum order of magnitude lead of the optimal solution being 31 and 17, respectively. On these two test functions, the ICPO algorithm outperforms the CPO by 0–1 orders of magnitude in the test of fun1. In the test results of fun2, the ICPO outperforms the CPO in the optimal result, while the ICPO is close to the CPO in other results. In optimizing Fun3 and Fun4, CPO and ICPO reduce their lead compared to other algorithms, with a maximum difference of 14 and 8 orders of magnitude in the optimal solution, respectively. This indicates that local optima are a significant challenge for optimization algorithms. Compared to CPO, ICPO performs better in the worst solution, with a difference of 15 orders of magnitude in the worst solution on Fun3. This suggests that the improved Crested Porcupine Optimizer has a significant advantage in avoiding falling into local optima.
The convergence process of algorithm optimization is shown in Figure 8. It can be seen that the Grey Wolf Optimizer (GWO) has a significant advantage in convergence speed in the early stage, and even outperforms ICPO in steps 40–150 of Fun2’s testing process, indicating that it is reasonable to use GWO to accelerate the convergence of the CPO algorithm. However, the convergence curve of GWO gradually flattens, and the convergence speed decreases during the later optimization stage. In contrast, the slope of the convergence curve of ACO does not change much when testing the four functions, indicating that compared with other algorithms, ACO has an advantage in convergence speed in the later stage. Therefore, integrating ACO can improve the algorithm’s later performance. From the figure, the convergence speed and final results of the improved ICPO are slightly improved compared to CPO on Fun1 and Fun2, while the advantages of ICPO begin to emerge on Fun3 and Fun4. Considering the characteristics of the latter two functions, it indicates that the improved ICPO has significant benefits in facing local optimal problems.
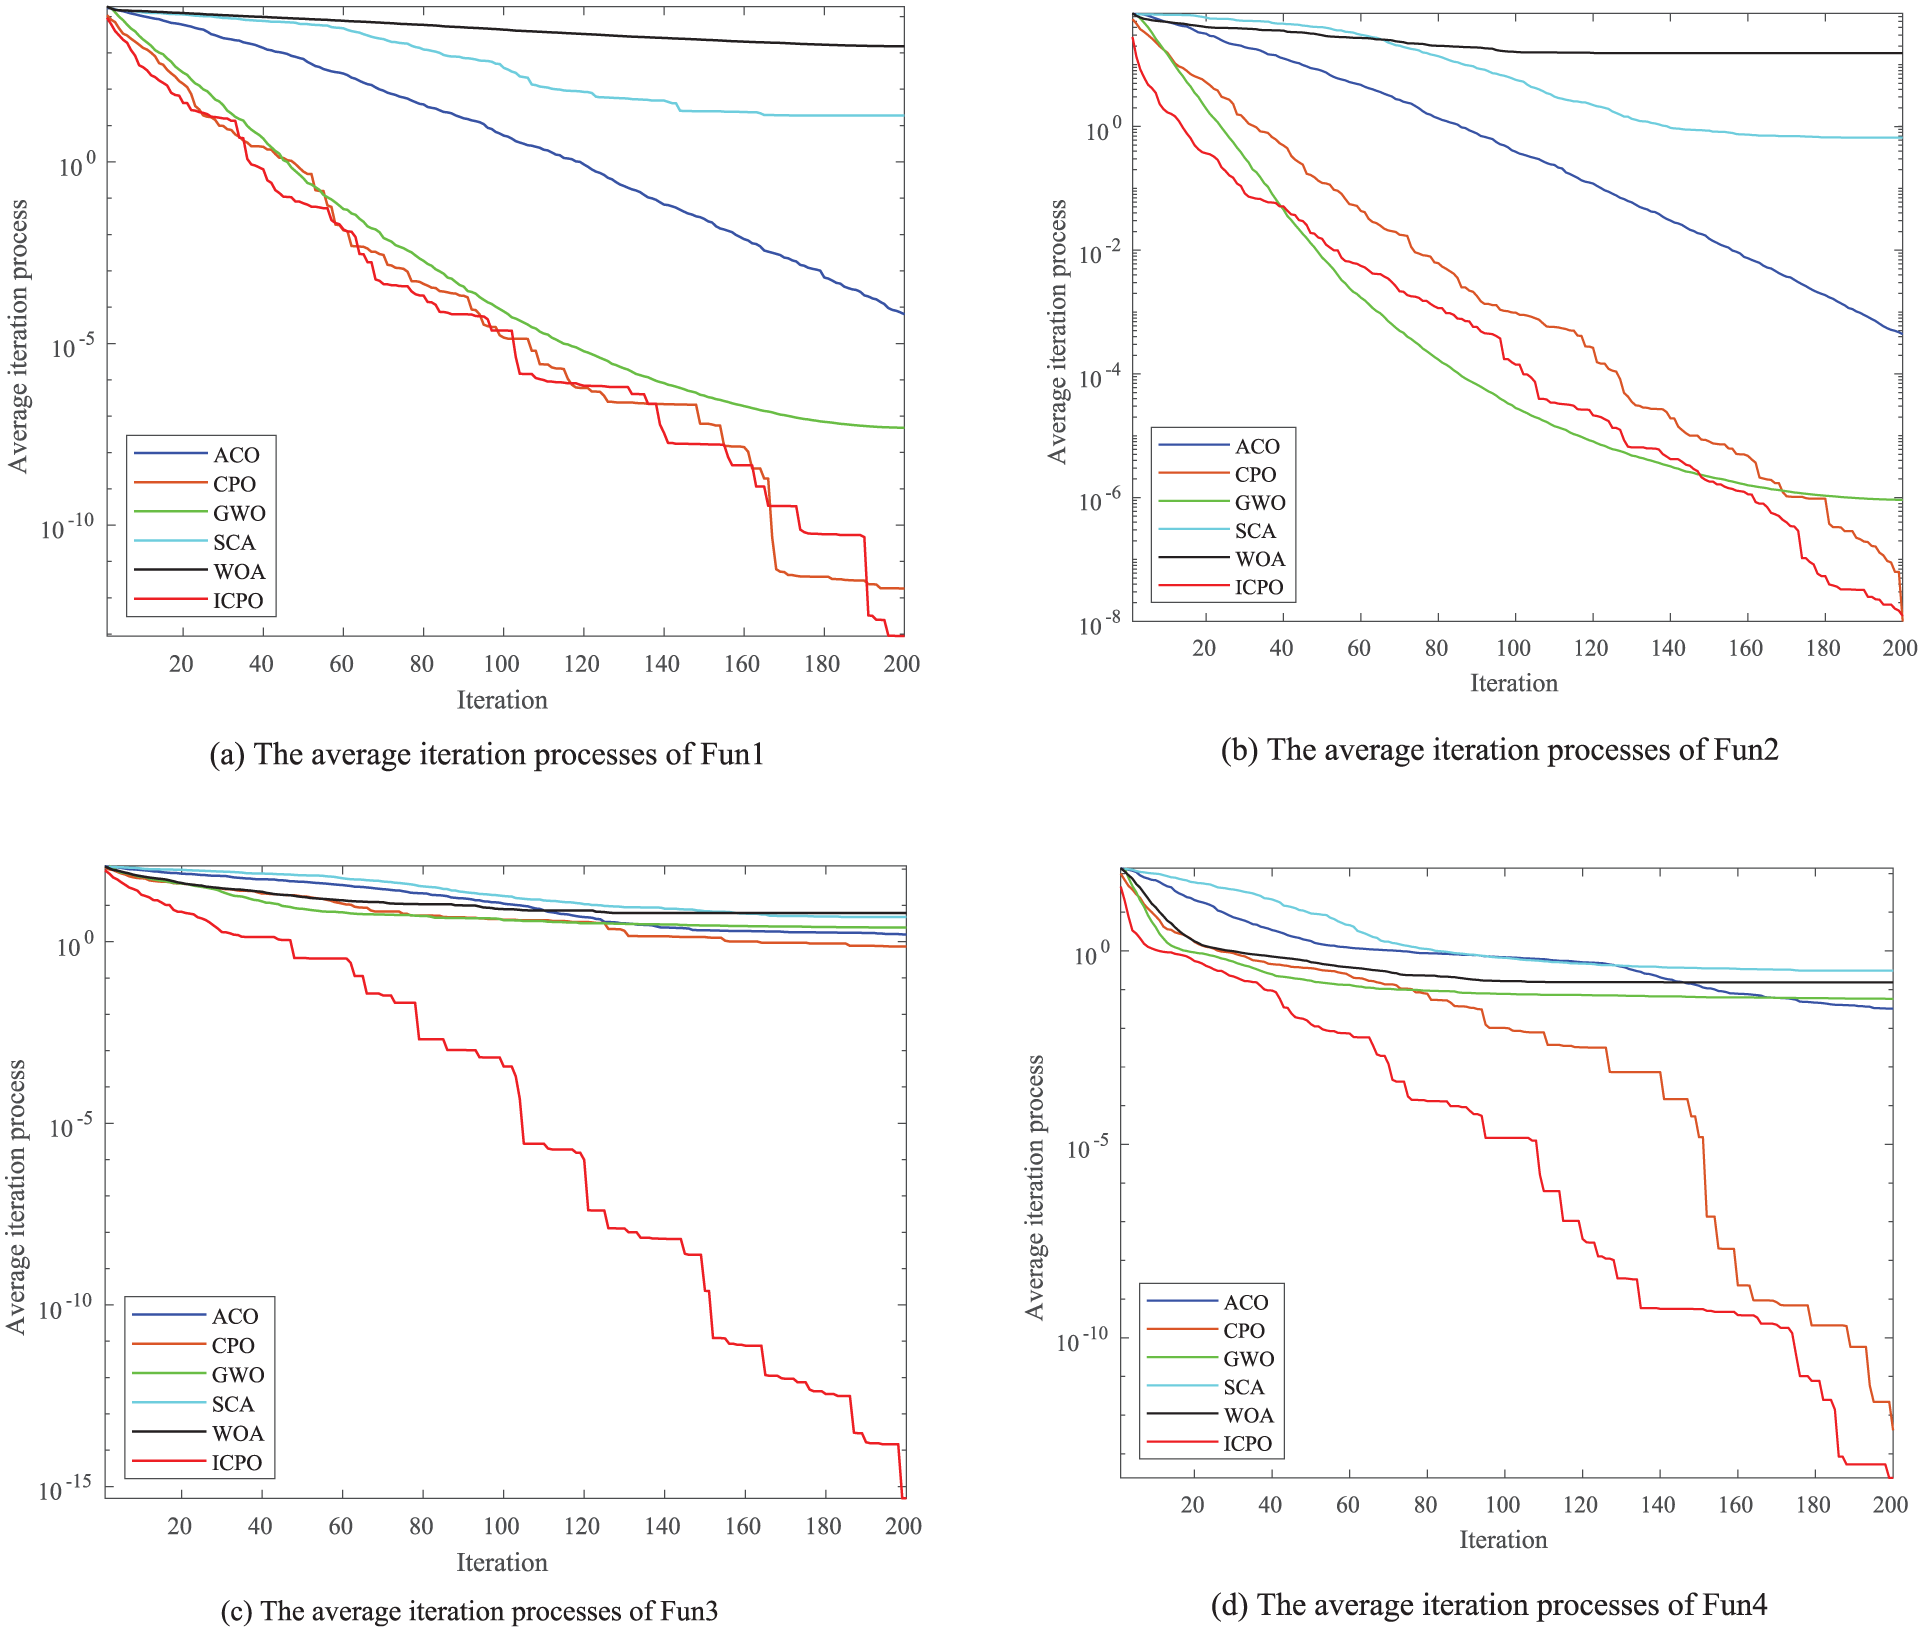
The average iteration processes: (a) the average iteration processes of Fun1, (b) the average iteration processes of Fun2, (c) the average iteration processes of Fun3, and (d) the average iteration processes of Fun4.
From the above analysis, the improvement of the ICPO algorithm is successful and can be applied to subsequent load spectrum clustering optimization.
Improved clustering algorithm (K-ICPO)
K-ICPO clustering algorithm
The basic principle of K-ICPO is: sample set
Randomly initialize the ICPO algorithm. If the number of clusters is
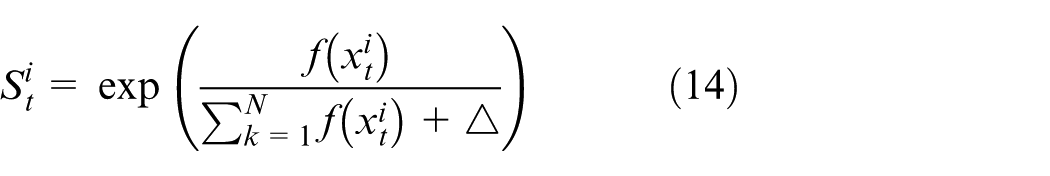
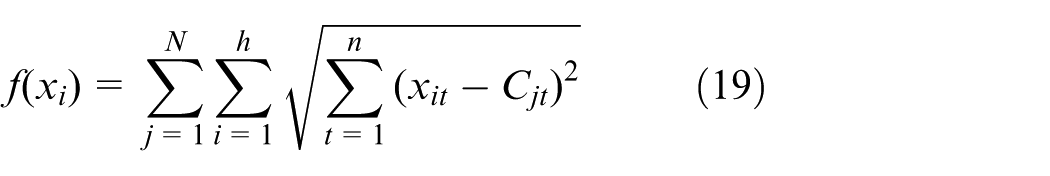
The fitness value
Euclidean distance is:
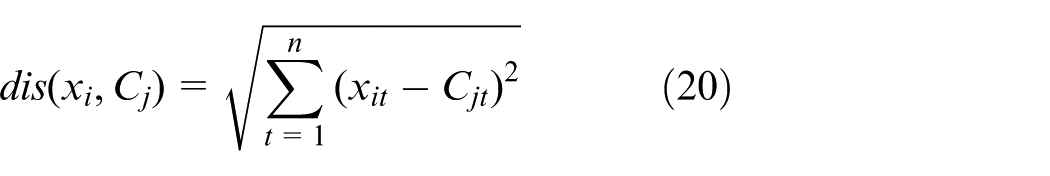
Where
Then, the K-ICPO clustering algorithm is obtained by replacing the clustering centers in the iteration process of K-means algorithm with n optimization results of ICPO. The cluster obtained by clustering is divided into
Where,
Performance verification of K-ICPO clustering algorithm
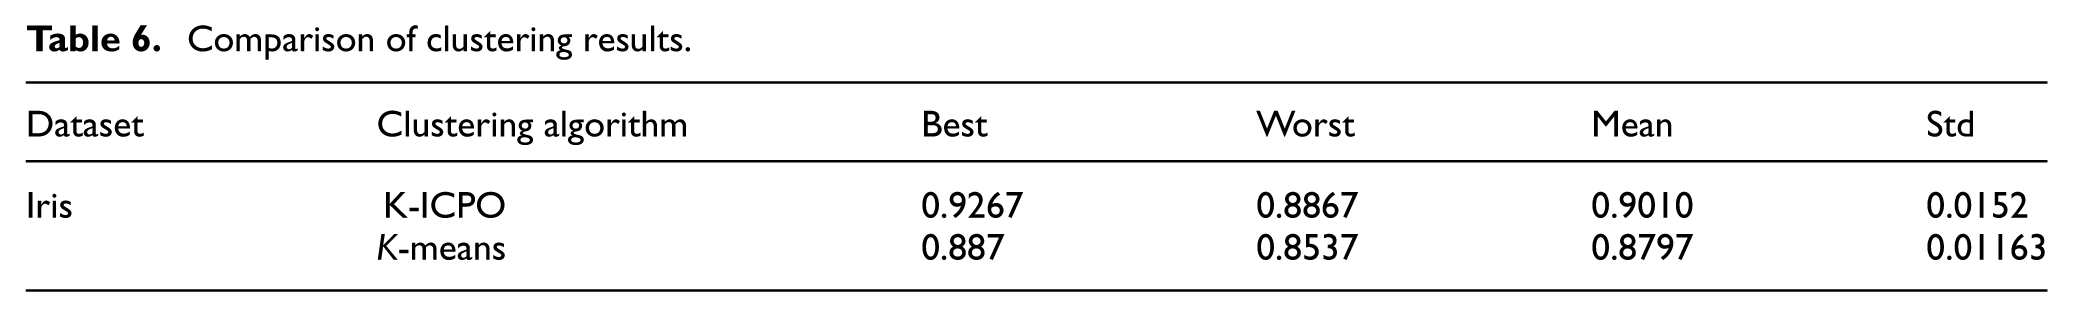
The iris dataset in the UCI standard database is used to verify the effectiveness of the K-ICPO clustering algorithm. The Iris dataset contains 150 groups of samples. The dimension of the data is 4. The actual classification of the data is into three categories. The comparison of the K-means algorithm and the improved K-ICPO clustering results is shown in Table 6. It can be seen that the improved algorithm K-ICPO has a better optimal value and mean value. Compared with the K-means algorithm, the average accuracy is 90.1%, an increase of 2.42%. Therefore, we use the optimized ICPO algorithm to improve the K-means clustering algorithm, which is successful.
Comparison of clustering results.
Load spectrum construction and verification
Due to the different working stages and spatial positions, bulldozers have vastly different working states. For example, under high load conditions, bulldozers have a greater depth of soil cutting, are subject to more excellent soil resistance, and have higher driving loads for pushing and transporting soil. The load changes dramatically after tilting the soil. This section uses the K-ICPO and K-means algorithm to cluster the 203 kinematic micro-travels that were previously divided.
The sum of the squared Euclidean distances between the normalized three types of load spectrum fragments and cluster centers, denoted as
The clustering center is used as the typical working cycle load spectrum of bulldozers, and a total of three categories are divided into high, medium, and low loads, as shown in Figure 9.
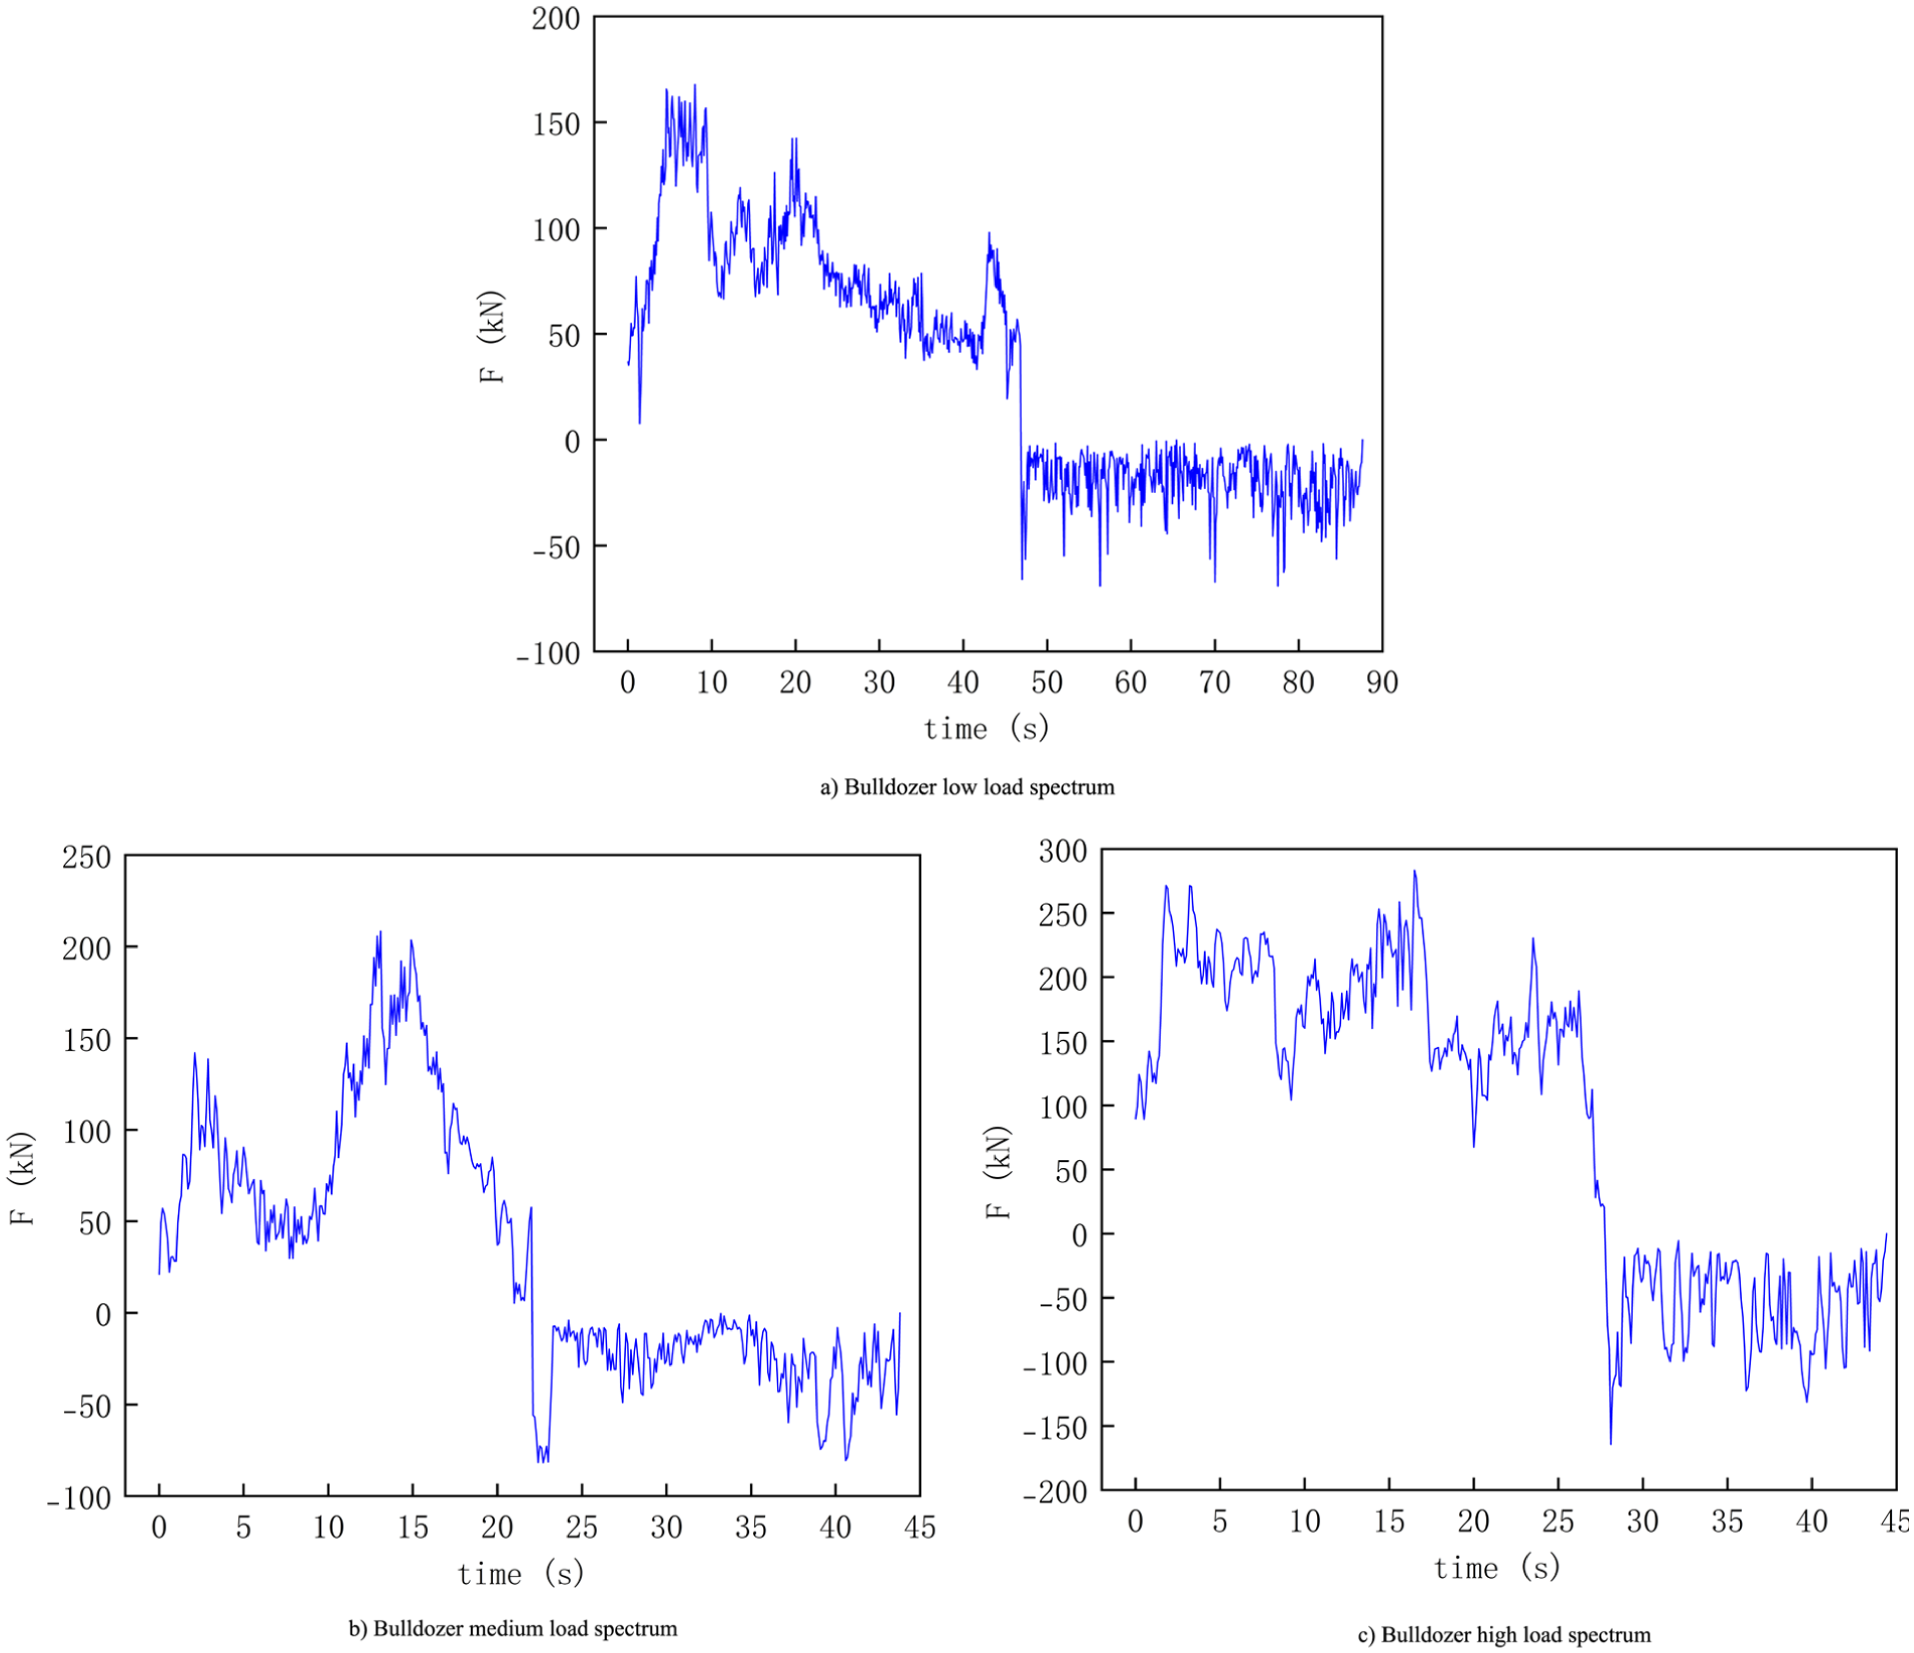
Typical working load spectrum of bulldozers under different loads: (a) bulldozer low load spectrum, (b) bulldozer medium load spectrum, and (c) bulldozer high load spectrum.
From the figure, it can be seen that the clustering results of the K-ICPO clustering algorithm can clearly reflect the load characteristics of bulldozers under different loads. When a bulldozer works, the forward time and backward time are basically equal. When moving forward, the bulldozer performs soil cutting, soil collection, and soil transportation with a positive load; When the bulldozer moves backwards, the load is negative, indicating that the bulldozer is moving backwards. Moreover, when the bulldozer retreats without load, the working road surface becomes uneven, and the load fluctuation during the bulldozer’s retreat significantly increases. Figure 9(a) represents the low load condition of the bulldozer, where the depth of soil cutting is small, the road resistance is low, the bulldozer travel speed is low, and the load and load change rate are small. The maximum forward load of the low load spectrum is 168 kN, and the maximum backward load is 69 kN. Figure 9(b) represents the medium load condition of the bulldozer. Under this condition, as the depth of soil cutting increases, soil conditions deteriorate and road resistance increases. The bulldozer maintains a medium driving speed, and the load and load change rate are moderate. The maximum forward and backward loads of the bulldozer under this working condition are 208 and 82 kN, respectively. Figure 9(c) represents the high load condition of the bulldozer, where the bulldozer cuts the soil to the maximum depth, the soil is soft, the driving resistance is the highest, and the bulldozer’s driving speed is the highest among the three conditions, with the highest load and load change rate. The maximum forward and backward loads of the bulldozer are 283 and 164 kN, respectively.
By combining the load spectra of the three types of loads mentioned above, a typical working load spectrum of a pure electric bulldozer, encompassing high, medium, and low loads, can be constructed (Figure 10).
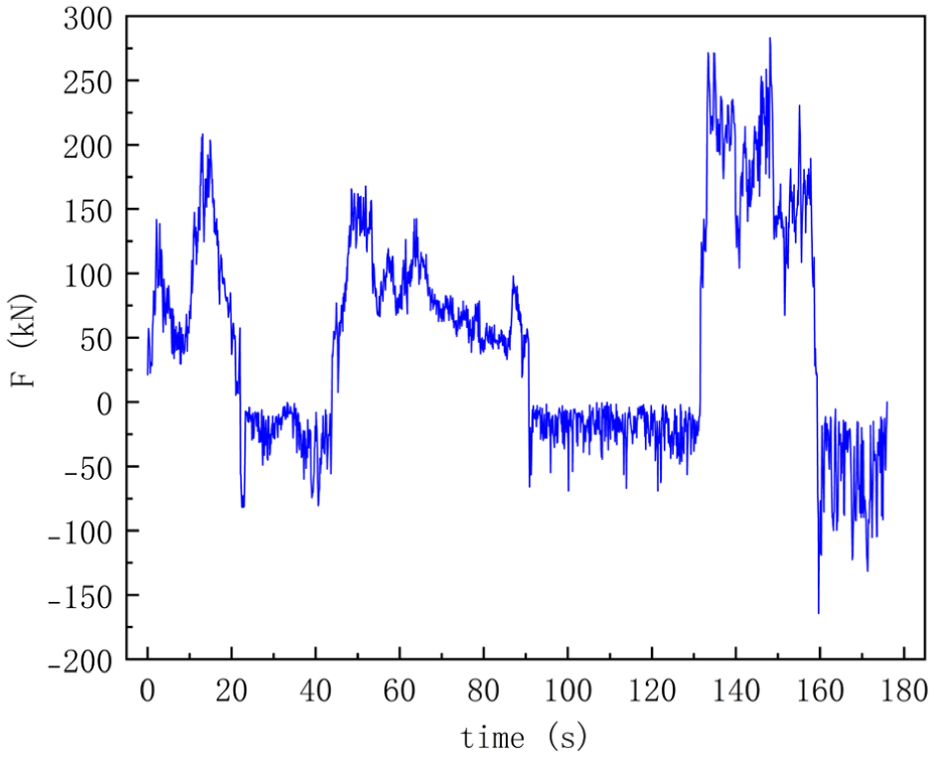
Typical working load spectrum of a bulldozer.
To further validate the effectiveness of the constructed load spectrum, Figure 11 was used to compare the load distribution of bulldozers before and after clustering. Figure 11(a) is the scatter plot of the “load change rate” for the original work cycle segment, and Figure 11(b) is the scatter plot of the “load change rate” for the load spectrum constructed by clustering. It can be seen that the load distribution of the two is highly similar, and the clustering degree of the scattered points in the constructed load spectrum is higher, indicating that the load spectrum can effectively reflect the typical characteristics of pure electric bulldozer operation.
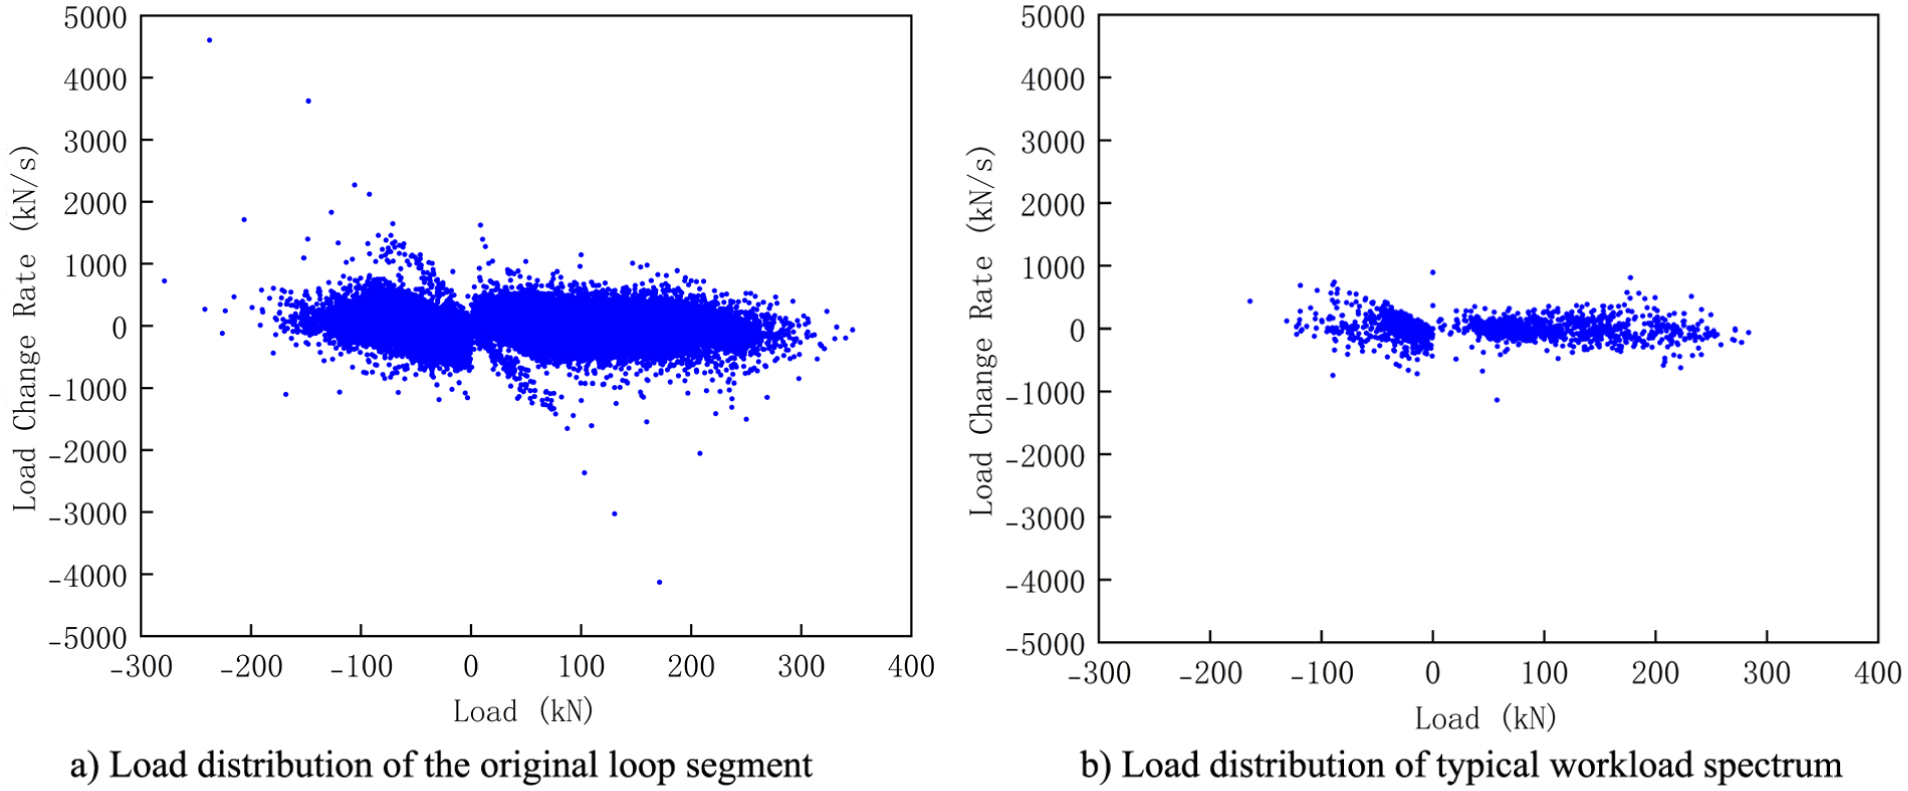
Scatter plot of load distribution between load spectrum and raw data: (a) load distribution of the original loop segment and (b) load distribution of typical workload spectrum.
Conclusion
Improving the efficiency and accuracy of load spectrum construction is crucial for the research on power matching and overall control strategies of bulldozers. This article proposes a novel method for constructing a typical working cycle of pure electric bulldozers, which relies on using an optimized clustering algorithm K-ICPO to cluster the working cycle segments of bulldozers. First, the grey wolf algorithm and ant colony algorithm are introduced into the first and third defense mechanisms of Crested Porcupine Optimizer respectively, and an improved Crested Porcupine Optimizer (ICPO) is proposed. In the optimization calculation tests of four classic multivariate benchmark functions, ICPO showed better efficiency and accuracy than ACO, CPO, GWO, SCA, and WOA. Secondly, the fusion of ICPO and k-means algorithm resulted in the K-ICPO clustering algorithm. When validating the K-ICPO clustering algorithm using the Iris dataset in the UCI standard database, it is found that the improved algorithm K-ICPO had better optimal values and means. Compared with the K-means algorithm, its average accuracy is improved by 2.42%. Finally, the K-ICPO clustering algorithm is applied to construct pure electric bulldozers’ typical working cycle load spectrum. The “load change rate” of the constructed typical load spectrum is highly similar to the original data, indicating that the constructed load spectrum can effectively reflect the working characteristics of pure electric bulldozers. In summary, the novel method proposed in this article for constructing a typical working cycle of pure electric bulldozers is feasible and effective.
Footnotes
Acknowledgements
The authors would like to express their sincere gratitude to Shantui Construction Machinery Co., Ltd. for providing the working data of the pure electric bulldozer.
Ethical considerations
This research did not involve any human or animal subjects and therefore did not require ethical approval.
Consent for publication
Not applicable. This study does not involve human participants or patient data.
Funding
The author(s) disclosed receipt of the following financial support for the research, authorship, and/or publication of this article: China Shandong province Key Research and Development Program (Major Scientific and Technological Innovation Project) (Grant No. 2023CXGC010210), China Shandong Province Engineering Machinery Intelligent Equipment Innovation and Entrepreneurship Community Project (Grant No. GTT20240101), China Shandong Provincial Key Laboratory of Earthmoving Machinery Intelligent Construction Technology (Grant No. PKL2024F13).
Declaration of conflicting interests
The authors declared no potential conflicts of interest with respect to the research, authorship, and/or publication of this article.
Data availability statement
The data supporting this study’s findings are available on request from the corresponding author.
Trial registration number/date
Not applicable. This study does not involve a clinical trial.