
Abstract
This study aims to develop an effective solution for detecting insulation faults in power transmission systems, which helps to ensure a stable power supply and minimize power supply disruptions and financial losses due to faults. The proposed research method combines deep learning with object detection models and Graph Neural Networks (GNNs). This method applies transfer learning to optimize the detection process, and GNN is used for multi-object tracking (MOT), detecting and linking data from Unmanned Aerial Vehicle (UAV) images. The research results show that the method combining the You Only Look Once (YOLO-v10) model with GNN gives optimal results in detecting insulation images in forest environments, with the following achieved indices: Accuracy 0.62, MOTP 0.61, MOTA 0.73, and IDF1 0.67. The SSD combined with GNN and Particle Swarm Optimization (PSO) combined with GNN methods gave lower results, respectively, Accuracy 0.56 and 0.53, MOTP 0.57 and 0.53, MOTA 0.69 and 0.65, and IDF1 0.61 and 0.57. The value of the study is to provide a robust and accurate solution for detecting and monitoring insulation wire faults in complex background environments, ensuring reliable detection even under difficult conditions.
Introduction
These Insulators are critical components in overhead power transmission systems, serving the dual role of providing electrical insulation and mechanical support. Originally mounted on power poles, modern insulators have evolved into disk-shaped designs, typically made from glass or ceramics, and are suspended from transmission towers on high-voltage lines. 1 These components play a pivotal role in enabling long-distance transmission and minimizing line capacitance. However, insulators are vulnerable to damage caused by prolonged exposure to intense electric fields and adverse environmental conditions, which can lead to issues such as self-explosion, physical damage, and leakage currents. 2
The most frequent problems with insulators include physical damage and surface defects, often resulting from pollution flashovers. Physical damage may stem from manufacturing defects or mechanical stress, while surface defects are caused by partial discharges during flashovers. 3 These discharges occur when pollutants accumulate on the insulator’s surface and, under moist conditions, form a conductive layer that degrades the insulator’s electrical properties, increasing leakage currents. Such defects are a significant concern, accounting for more than half of power grid failures. 4 This highlights the urgency of prompt detection and repair to prevent widespread power outages, economic losses, and customer dissatisfaction. Regular inspections are thus essential to maintaining the safety, reliability, and efficiency of power delivery systems.
Unmanned Aerial Vehicles (UAVs) have emerged as a game-changer in power line inspection, replacing labor-intensive manual patrols with a more systematic, efficient, and cost-effective approach. 5 UAVs capture aerial imagery and videos of insulators, enabling power companies to plan maintenance operations effectively while reducing costs. However, accurate identification of insulators within these images is vital for automated inspection and smart diagnostics. 6 The task is complicated by the variety of insulator types, viewing angles, lighting conditions, image occlusions, and the complexity of backgrounds. High-resolution UAV imagery further intensifies the challenge by introducing intricate details that demand advanced processing.
Advancements in deep learning and computational technologies have paved the way for highly adaptable object detection algorithms capable of addressing these challenges. This paper introduces a robust method for detecting faulty insulators in aerial images, a crucial aspect of power transmission line inspections. Our approach integrates a state-of-the-art object detection model with Graph Neural Networks (GNNs), 7 creating an effective system for identifying and classifying insulator defects.
The proposed system utilizes transfer learning principles to fine-tune an object detection framework. Initially, the Common Objects in Context (COCO) model 8 is adapted using a diverse dataset of aerial insulator images captured in varying environmental contexts. Subsequently, the model undergoes additional fine-tuning with specific defect types, enhancing its accuracy and robustness. Once trained, this model allows power companies to bypass the initial data preparation phase, focusing instead on localized fine-tuning tailored to their unique operating environments. GNNs are employed for simultaneous multi-object detection and data correlation in UAV imagery. These networks excel at modeling spatial and temporal relationships between objects, enabling the system to extract unique features for accurate defect detection and association. This capability is crucial for analyzing inter-object relationships in complex settings, such as clusters of insulators amidst challenging backdrops.
The integration of YOLOv10 (You Only Look Once version 10) 9 with GNNs for faulty insulator classification follows these steps: (1) Data Preprocessing: Collect insulator images, including both normal and defective samples, and label them into categories such as “normal” and “defective.” (2) Training YOLOv10: Train the YOLOv10 model on the labeled dataset to detect and locate insulators, and classify them as normal or defective. (3) Feature Extraction: Extract features (such as size, shape, color) from detected regions (bounding boxes) as input for the GNN. (4) Graph-Based Analysis: Create a graph from the extracted features, where nodes represent insulators and edges denote relationships (such as proximity, interactions). Train the GNN on this graph to classify insulators.
In this work, we introduce a domain-aware graph construction strategy tailored for aerial insulator inspection, where edge relations incorporate transmission-line geometry, defect-sensitive visual embeddings, and UAV-motion priors. We further establish a unified embedding interface between YOLOv10 and the GNN, enabling implicit joint optimization between detection and association rather than post-hoc linkage. A defect-oriented augmentation and two-stage fine-tuning pipeline are developed to address rare fault cases and enhance robustness under diverse environmental conditions. Building on these components, we design an integrated architecture that combines YOLOv10 detection, graph-based temporal modeling, and lightweight identity propagation into a cohesive MOT framework. Extensive experiments across multiple terrains demonstrate that these contributions significantly improve both detection accuracy and tracking consistency compared to existing approaches.
The main contributions of this study can now be clearly identified as follows.
(1) We introduce a novel YOLOv10–GNN hybrid framework that leverages multi-scale feature extraction and graph-based relational reasoning to enhance insulator defect detection in complex UAV environments. This combination surpasses traditional image-processing or optimization-based approaches.
(2) Unlike previous AI-driven defect detection studies, such as chaotic connectivity analysis in orthodontic imaging, AI-based filtering for steel surface defects, or optimization-enhanced deep models for solder paste inspection, our method focuses on structural dependencies among insulator components, addressing a unique gap in the power-transmission domain.
(3) The study also contributes an up-to-date experimental validation using diverse real UAV images, reinforcing the robustness and generalization capability of the proposed architecture.
This combined approach leverages the object detection capabilities of YOLOv10 and the relationship-analyzing strengths of GNNs to achieve superior classification accuracy for faulty insulator images. The methodology enables precise and efficient detection of porcelain and composite insulators in complex scenarios, significantly enhancing reliability, efficiency, and robustness. Our experiments validate the effectiveness of the proposed method in detecting insulator defects. The system demonstrates marked improvements in accuracy and efficiency compared to existing methods. A detailed comparison of various approaches, including their datasets, classification accuracy, limitations, and potential improvements, is summarized in Table 1.
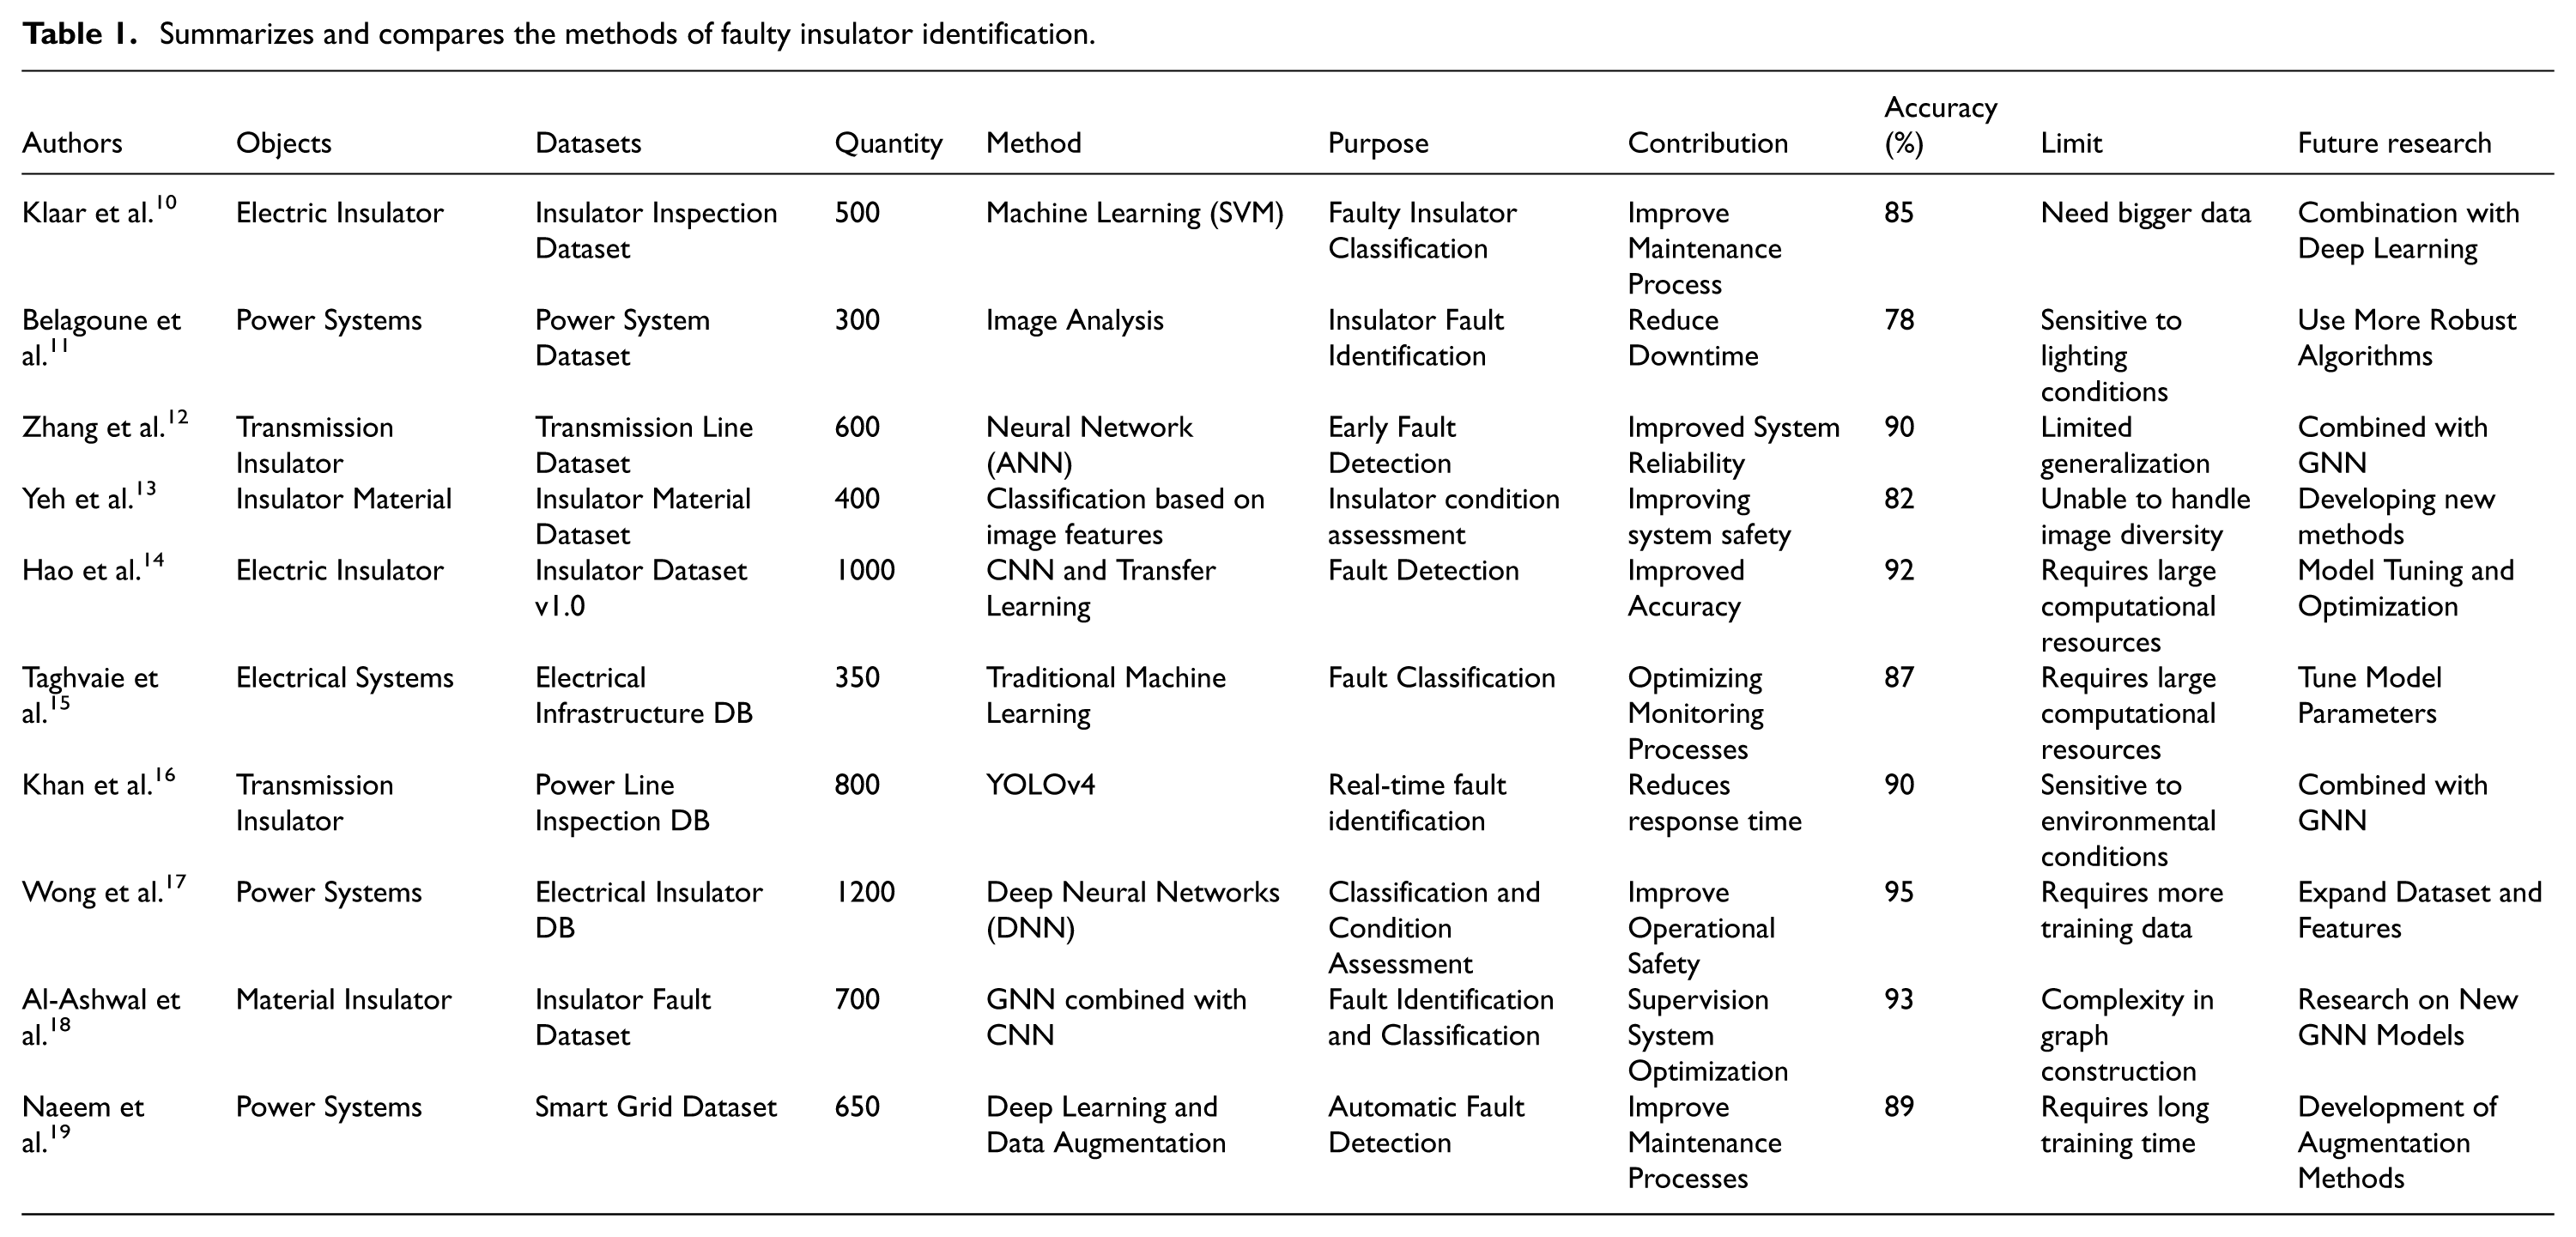
Summarizes and compares the methods of faulty insulator identification.
The remainder of the paper is organized as follows: Section II reviews related work in the field of insulator fault detection. Section III describes the proposed method in detail. Section IV presents experimental results and analysis. Section V concludes the study and outlines future research directions. By combining advanced deep learning models and GNNs, this research offers a powerful solution for automated insulator defect detection, ensuring the reliability and stability of power transmission systems amidst diverse environmental challenges.
Related works
Detecting insulator defects in power transmission systems is vital for ensuring a stable and reliable electricity supply. Traditional inspection methods, such as helicopter-manned patrols and on-site field assessments, are resource-intensive and face challenges due to the complex structure of transmission lines. These methods also involve significant risks and costs, making them less practical for frequent inspections. 20 In recent years, Unmanned Aerial Vehicles (UAVs) have emerged as a transformative solution for inspecting power lines, offering greater efficiency, lower costs, and improved safety (Figure 1). However, analyzing UAV-acquired imagery presents unique challenges, such as dealing with complex backgrounds, varying lighting conditions, and the difficulty of identifying small defect targets amidst other objects. 21
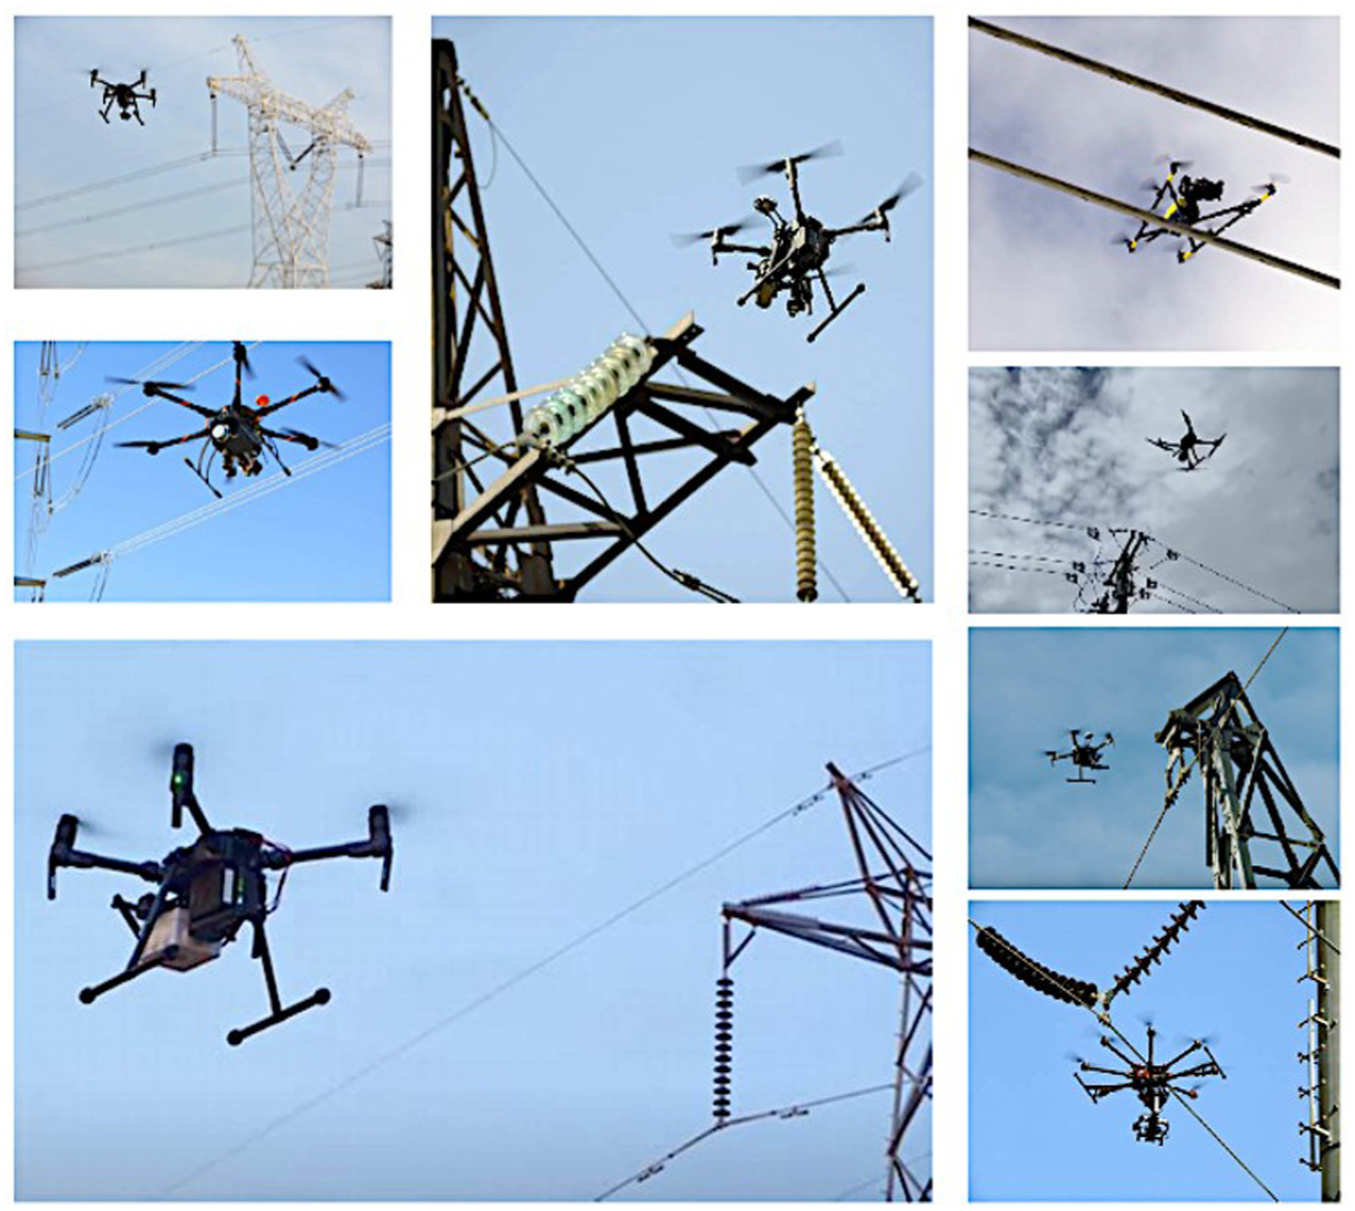
Transmission line inspection with UAVs.
Deep learning algorithms have revolutionized object detection by providing superior generalization, adaptability, and scalability across diverse environments. For instance, YOLOv7, introduced in 2022 by Wang et al., 22 demonstrated state-of-the-art performance on the COCO dataset in terms of speed and accuracy. Its trainable architecture is highly adaptable, making it suitable for deployment on a range of platforms, from mobile Graphics Processing Units (GPUs) to edge-to-cloud systems. Despite its promising potential, the application of YOLOv7 to insulator-defect detection remains underexplored, particularly for scenarios involving intricate backgrounds and small targets. 23
Researchers have also worked to augment deep learning models for enhanced performance in specialized tasks. Wang et al. 24 proposed augmented training strategies to improve the robustness and generalization of Convolutional Neural Networks (CNNs). Similarly, Jin et al. 25 showcased the efficacy of transfer learning in addressing small datasets for disease screening. Zhao et al. 26 leveraged multi-channel CNNs and an improved frame difference method for meteorological photo classification, achieving strong results even on resource-constrained embedded systems. These studies underscore the potential of combining advanced neural networks with tailored optimization strategies to solve complex problems.
In the context of power grid digitalization, as illustrated in Figure 2, deep learning has become an indispensable tool for extracting meaningful insights from large datasets. Insulator-defect detection systems based on neural networks fall into two primary categories: Two-Stage Object Detection Models: These methods involve separate stages for region proposal and classification. Examples include Region-based Convolutional Neural Networks (R-CNNs), 27 Fast R-CNNs, 28 and Faster R-CNNs. 29 Lu et al. 30 enhanced Faster R-CNN by optimizing anchor box selection, achieving high accuracy for insulator detection. However, their model was limited to processing three images per second, making it unsuitable for real-time applications. Similarly, Liao et al. 31 combined Faster R-CNN with ResNet101 32 to improve detection precision but faced computational overheads that hindered real-time deployment. One-Stage Object Detection Models: These models perform detection and classification in a single step. Examples include You Only Look Once (YOLO) and Single Shot Multi-Box Detector (SSD). Feng et al. 33 proposed an automatic insulator detection system using YOLOv5, achieving a maximum accuracy of 86.8%. Wu et al. 34 developed an end-to-end detection framework based on Center Net, which improved accuracy using an attention mechanism but struggled with suboptimal detection speeds. Liu et al. 35 introduced the MTI-YOLO network, incorporating multi-scale feature detection and spatial pyramid pooling to enhance accuracy. However, their method was limited to detecting normal insulators and lacked a focus on defective cases.
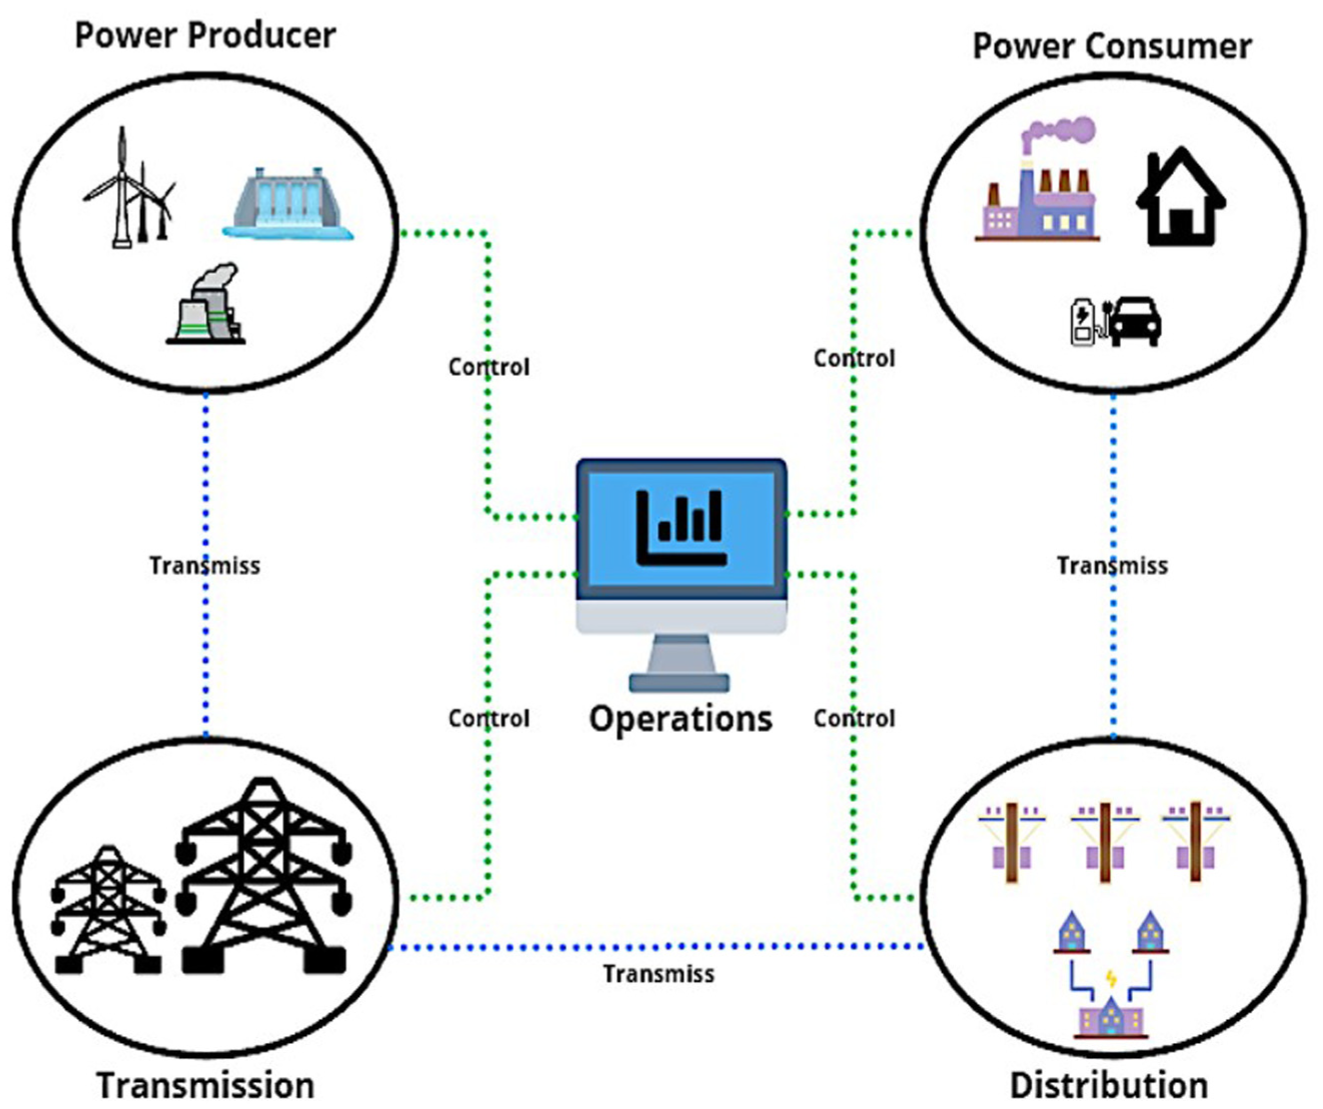
Smart grid control.
To address the challenges of detecting insulator defects in complex environments, we propose a novel approach that integrates object detection models with Graph Neural Networks (GNNs). The proposed framework incorporates an augmented fine-tuning process based on transfer learning principles. Step 1: Augmented Fine-Tuning of Object Detector: The object detection model, initially pre-trained on the COCO dataset, is fine-tuned using a diverse set of aerial insulator images containing various backgrounds and defect types. This step enhances the model’s adaptability to real-world conditions. Specific defect types and situations are later used to refine the model further, boosting its accuracy and robustness for insulator-defect detection. Step 2: Integration of GNNs for Multi-Object Detection and Association: GNNs are used to model relationships between objects of variable sizes and across spatial and temporal dimensions. By constructing a graph where nodes represent insulators and edges represent relationships (such as proximity, similarity), GNNs update node and edge features using aggregation mechanisms. This approach allows the system to capture contextual relationships, improving detection precision and robustness. Recent advancements in GNNs have demonstrated their effectiveness in modeling complex inter-object interactions. Specifically, for Multi-Object Tracking (MOT), 36 GNNs have been used to frame data association as an edge classification problem, linking detections with tracklets based on similarity measures. Our approach extends this concept by employing GNNs for both detection and association, leading to a unified and efficient solution.
Unlike previous methods that use GNNs solely for data association, our approach leverages the relational modeling capabilities of GNNs in both the detection and association branches. This joint optimization process improves the overall performance, ensuring accurate and reliable detection even in scenarios with intricate backgrounds and occlusions. By combining YOLOv7’s efficient detection capabilities with the relational strengths of GNNs, our framework offers a robust solution for insulator-defect detection. Experimental results validate the effectiveness of the proposed method in detecting insulator defects across challenging environments. The integration of GNNs significantly enhances the system’s ability to handle small defect targets and complex backgrounds, outperforming existing methods in terms of accuracy and robustness. This advancement contributes to safer and more reliable power transmission systems, aligning with the growing need for smart grid digitalization and automated infrastructure monitoring. Our work provides a comprehensive and scalable framework for insulator-defect detection, paving the way for future research into integrating advanced deep learning models with graph-based relational analysis for power system maintenance and reliability.
Furthermore, to provide a more complete coverage of neural network applications in engineering, additional references have been incorporated. Recent studies have demonstrated the effectiveness of metaheuristic-assisted neural optimization, fractal-based feature extraction, and AI-driven defect detection across various industrial domains. These include metaheuristic optimization using chaotic functional connectivity matrices for medical-growth assessment, AI-based filtering approaches for surface defect detection in manufacturing, and optimization-guided deep-learning models for solder paste inspection. Incorporating these works strengthens the methodological foundation of our study and situates our contributions within a broader engineering context.
Proposed method
As illustrated in Figure 3, our deep learning-based architecture is structured into three main components: image preprocessing, model training, and real-time faulty insulator detection. This comprehensive framework leverages aerial imagery captured by Unmanned Aerial Vehicles (UAVs) during power line inspections and combines advanced object detection with Graph Neural Networks (GNNs) for enhanced performance.
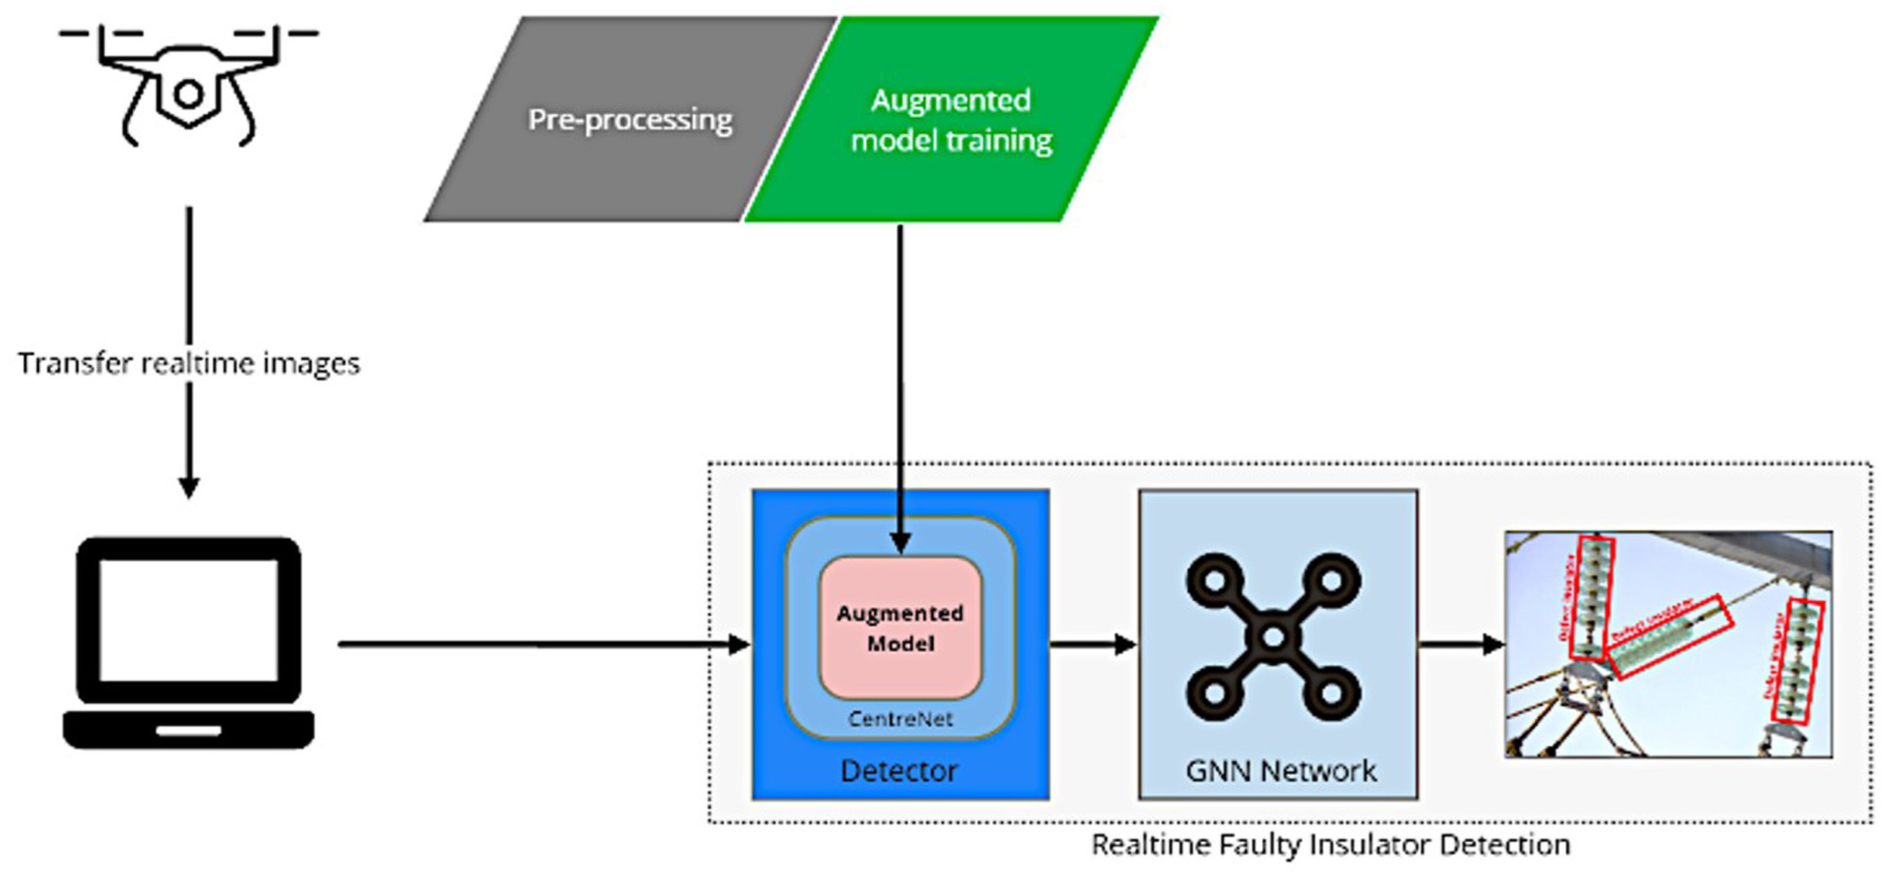
Overview of the proposed method.
The first step involves collecting high-resolution aerial images from UAVs during transmission line inspections. These raw images undergo preprocessing to prepare them for model training. The preprocessing pipeline includes the following steps: Resizing: Standardizing image dimensions to maintain uniformity across the dataset. Cropping: Removing unnecessary parts of the image, focusing on regions containing insulators. Labeling: Manually annotating images to classify insulators as “normal” or “faulty” and tagging other critical features for supervised learning. The goal of preprocessing is to convert raw UAV imagery into a clean, standardized dataset suitable for training the detection model. This step is critical for ensuring consistency and accuracy in the subsequent stages of the framework.
The second stage focuses on training the insulator detection model using the preprocessed dataset. Unlike conventional deep learning approaches, our framework employs an augmented fine-tuning procedure to improve accuracy and robustness: Base Model Initialization: The model is initialized using weights pre-trained on the COCO dataset, 37 enabling it to generalize well across diverse environments. Fine-Tuning for Specific Use Cases: The model is then fine-tuned using a custom dataset of aerial insulator images, including variations in background, lighting, and defect types. This two-step process ensures the detection model is both adaptable and precise.
The enhanced model demonstrates superior performance in identifying faulty insulators, even in complex and cluttered backgrounds, setting it apart from traditional object detection models. Once trained, the model is deployed for real-time faulty insulator detection. UAVs equipped with cameras continuously capture aerial images or video footage during inspections. The trained model processes these inputs in real-time to identify and classify insulators as “normal” or “faulty.” To address the challenges of tracking multiple insulators in dynamic settings, the architecture incorporates Graph Neural Networks (GNNs) for multi-object detection and association. The integration of GNNs significantly enhances the detection framework by modeling relationships between objects across spatial and temporal dimensions.
At time frame Ft−1, aerial images It−1 are processed to generate tracklets R t −1 = {R1t−1, R2t−1,…, RNt−1}, representing tracked insulators. At the subsequent time frame F t , images I t are used to detect insulators St = {S1t, S2t,…, SMt}. Here: N: Number of track-lets at frame Ft−1. M: Number of detections at frame F t . The process involves associating detections S t with track-lets Rt−1 to decide whether to: Extend existing track-lets for detected insulators. Terminate track-lets for objects no longer visible. Initiate new track-lets for newly detected insulators.
This association is iteratively performed for every frame in a video sequence, generating complete track-lets that represent insulator trajectories over time. To enhance multi-object tracking (MOT) capabilities, our framework integrates the following components: Object Detection Module: The augmented fine-tuned detection model (such as a YOLO-based architecture) identifies insulators and their states (normal or faulty). Re-Identification (Re-ID) Module: A Re-ID module is included to uniquely identify insulators across frames, ensuring accurate tracking even in cases of occlusion or partial visibility. Graph Neural Networks (GNNs): GNNs model the relationships between detected objects. For example, Nodes represent detected insulators. Edges represent spatial or temporal relationships, such as proximity or movement patterns.
Through processes like node feature aggregation, GNNs update node and edge attributes, capturing the contextual relationships between insulators. This relational modeling enhances both detection and association, improving the robustness of MOT. The proposed architecture offers several advantages: Enhanced Real-Time Performance: By integrating GNNs, the system can detect and track insulators simultaneously, achieving high accuracy even in complex environments. Scalability: The modular design allows easy adaptation to new datasets or inspection scenarios without retraining the entire model. Robustness: The combination of deep learning and GNNs ensures reliable detection across diverse conditions, including varying backgrounds, lighting, and motion. Cost-Effectiveness: Automating inspections with UAVs and deep learning reduces labor costs and enhances efficiency compared to traditional methods.
Preprocessing
The proposed method employs two types of training datasets to develop and fine-tune the deep learning model: the basic insulator dataset and the specific insulator dataset. These datasets are carefully curated and preprocessed to address the unique challenges of detecting insulators and their defects in aerial images captured by UAVs during transmission line inspections. To ensure fair evaluation, all experiments follow a strict sequence-level and site-level data-splitting protocol. For video data, adjacent frames and entire UAV flight sessions are assigned to a single fold only, preventing near-duplicate leakage between training and testing. The fivefold cross-validation is constructed such that no geographic site, flight segment, or temporal sequence appears in more than onefold. We additionally perform site-held-out and date-held-out tests to assess generalization across locations and inspection periods. All reported metrics are averaged over five independent runs, and we report mean ± standard deviation together with 95% confidence intervals to reflect statistical reliability.
The basic dataset serves as the foundation for the first fine-tuning stage of the model. It is composed of a diverse collection of aerial images gathered from various transmission line inspection regions. These images reflect a wide range of conditions stemming from differing geographic environments, voltage levels, and insulator types. Key features of the basic Dataset for a variety of Insulators: The dataset includes porcelain, composite, and glass insulators, ensuring broad coverage of common insulator types used across power grids. Complex Backgrounds: Images feature diverse and intricate backgrounds, such as forests, urban areas, buildings, deserts, and other regional elements specific to transmission line environments. Contextual Richness: In addition to insulators, images include other transmission line components, such as towers, conductors, and grounding wires. This diversity provides contextual information, helping the model distinguish insulators from other elements.
This comprehensive dataset enables the model to generalize effectively across different regions and environmental conditions, making it adaptable to diverse inspection scenarios. The specific dataset is a smaller, more focused dataset designed for the second fine-tuning stage. It is tailored to address particular detection requirements, including identifying specific types of insulators, unique defect patterns, or specialized scene conditions. Its key features include: Targeted Content: Images are curated to highlight specific defect types, such as cracks, contamination, or physical damage, as well as particular insulator varieties or installation configurations. Scene-Specific Data: The dataset comprises aerial images captured in unique regions or environmental conditions, such as dense vegetation, industrial areas, or other challenging settings where defect detection is more complex. Augmentation Techniques: To increase dataset diversity and minimize overfitting, extensive data augmentation methods are applied: Horizontal and Vertical Flipping: Enhances variability by altering image orientation. Cropping: Focuses on critical features of insulators and defects, emphasizing details necessary for accurate detection.
This targeted approach enables the model to fine-tune its parameters for specialized scenarios, enhancing accuracy and reliability in detecting faults under unique conditions. To address the risk of overfitting during model training, several regularization techniques are applied: Early Stopping: Training halts when the model’s performance on the validation set ceases to improve, preventing overtraining. Weight Regularization: Techniques like L1/L2 regularization constrain the model’s parameters to avoid overfitting to training data. Dropout: Randomly deactivating a portion of neurons during training helps the model generalize better. Batch Normalization: Normalizing layer outputs accelerates training and reduces overfitting.
These strategies ensure the model maintains high performance across unseen data. Deep learning models require large datasets to achieve robust generalization. Given the limitations of real-world data collection, data augmentation is employed to synthetically increase the size and diversity of the dataset. Augmentation techniques are used formorphological operations ofangle rotation: Randomly rotating images to simulate different camera angles. Saturation Adjustment: Modifying color intensity to mimic varying lighting conditions. Flipping and Translation: Altering image orientation and position to diversify visual perspectives. Mosaic Data Enhancement 38 : Combines four randomly selected images by scaling, clipping, and rotating them into a single composite image.
This method significantly enriches the dataset by presenting unique combinations of defects and backgrounds. Mix-Up Data Enhancement: Combines two images by interpolating their pixel values, producing new samples that enhance the model’s ability to generalize. Color Space Conversion: Adjusts image hue, saturation, and exposure to simulate variations in weather, time of day, and atmospheric conditions. By diversifying the training dataset, these augmentation techniques improve the model’s resilience against overfitting and enhance its ability to generalize to real-world scenarios.
Accurate annotations are crucial for supervised learning. As shown in Figure 4, the LabelImg tool 39 is used to annotate aerial images, creating a structured dataset for training and validation. The annotations include: Image ID: A unique identifier for each image. Object Class: Labeling objects as “normal insulator” or “faulty insulator.” Image Path: Filepath to the annotated image. Bounding Box Coordinates: Precise location of insulators and defects within the image.
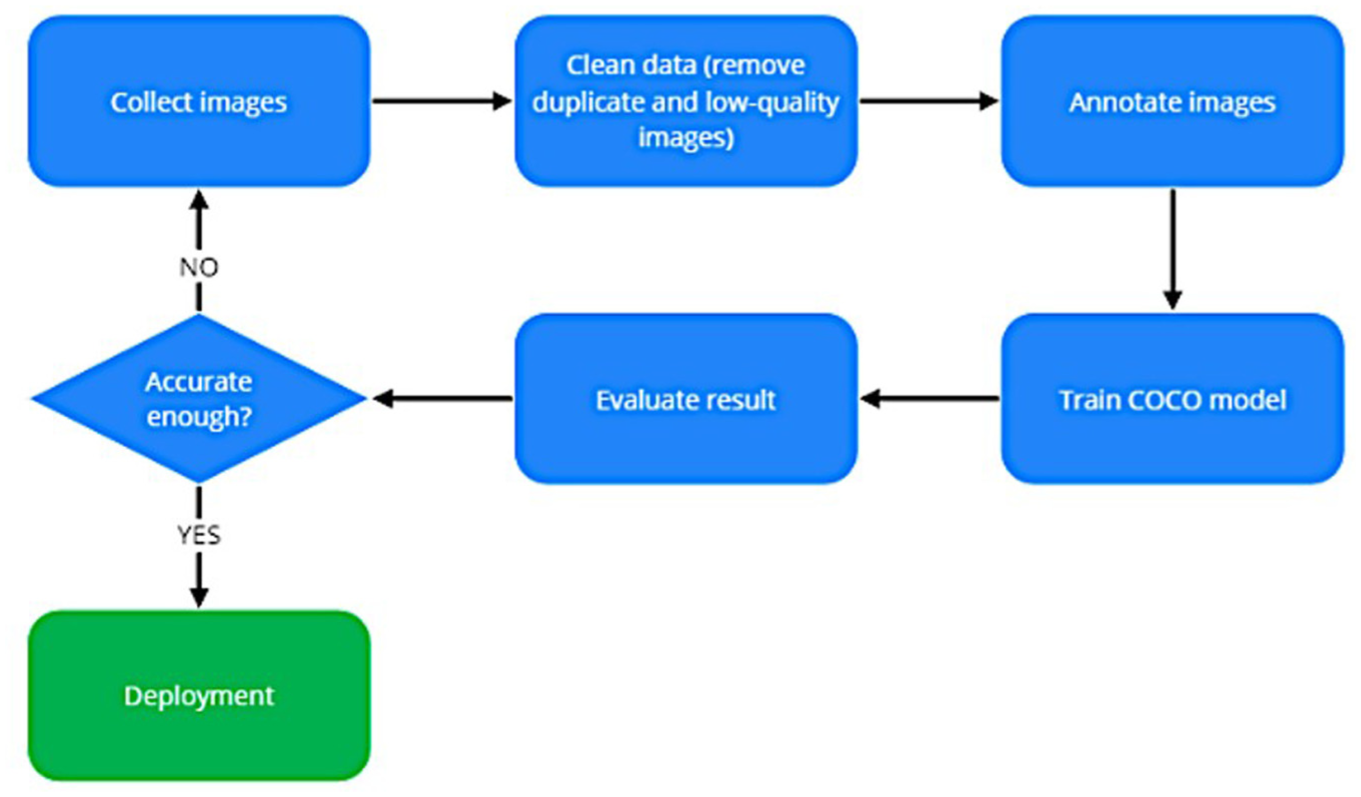
Image annotation process.
This annotation process ensures that the dataset is meticulously prepared, enabling the model to learn to detect and classify insulators with high accuracy. By utilizing a combination of the basic and specific datasets, along with robust data augmentation and annotation strategies, the proposed method provides a scalable and adaptable solution for detecting faulty insulators. The fine-tuning stages ensure that the model is both versatile for general use and specialized for targeted applications. This comprehensive approach not only enhances detection accuracy but also contributes to maintaining reliable power transmission systems.
Data tuning
Transfer learning is a widely used technique to mitigate the challenges posed by limited data availability in domain-specific applications. In the context of insulator detection, traditional transfer learning involves fine-tuning a deep learning model pre-trained on the COCO dataset. However, the COCO dataset, while extensive, does not include imagery from the electricity domain. This creates two significant challenges: Domain Gap: The absence of electricity-related imagery in the COCO dataset limits its ability to generalize to insulator-specific contexts. Data Size Gap: Insulator datasets are typically much smaller in comparison to COCO, which can lead to overfitting and reduced model robustness. To overcome these challenges, this paper introduces an augmented fine-tuning strategy, as depicted in Figure 5. This two-phase approach combines the generalization power of COCO pre-training with targeted adaptation using insulator-specific datasets, significantly improving detection performance.
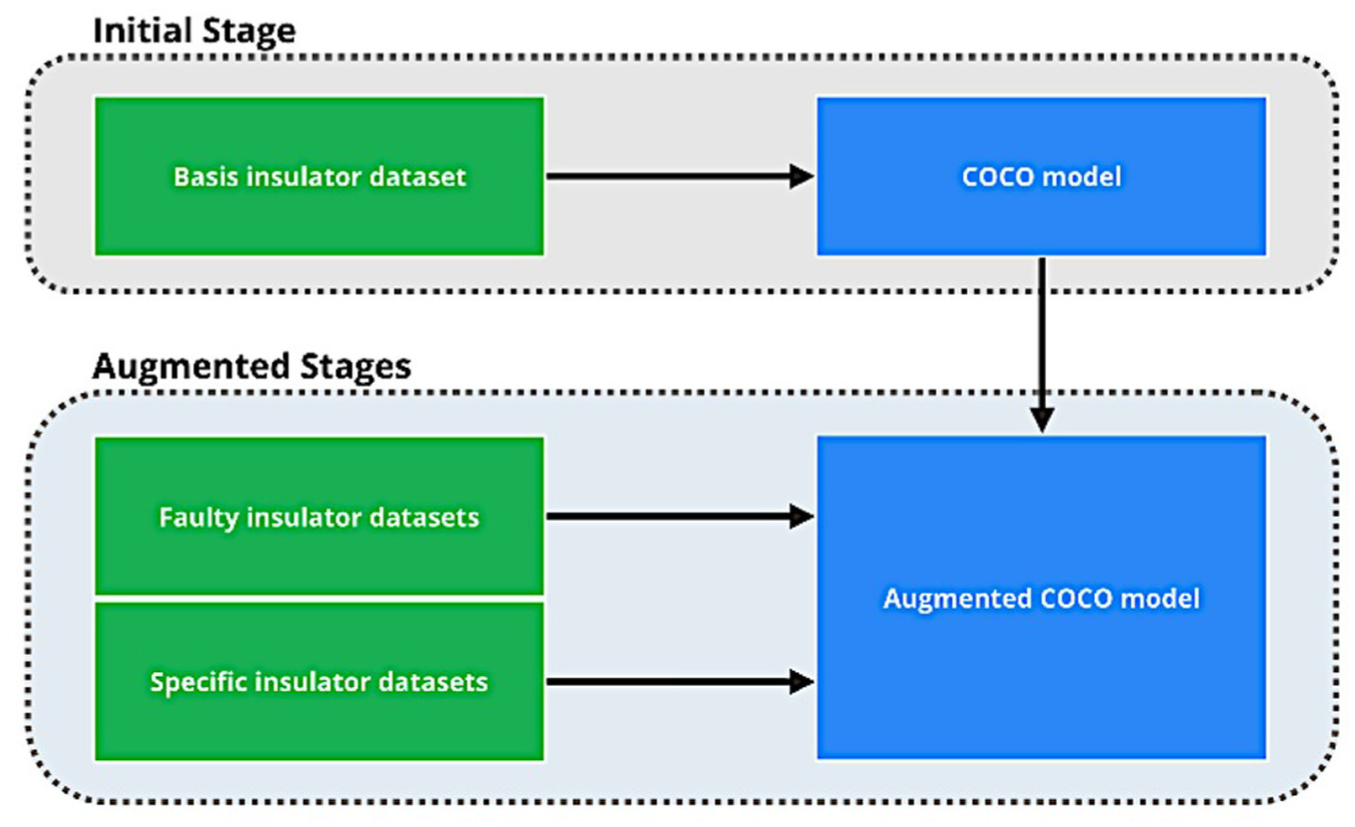
COCO model fine-tuning.
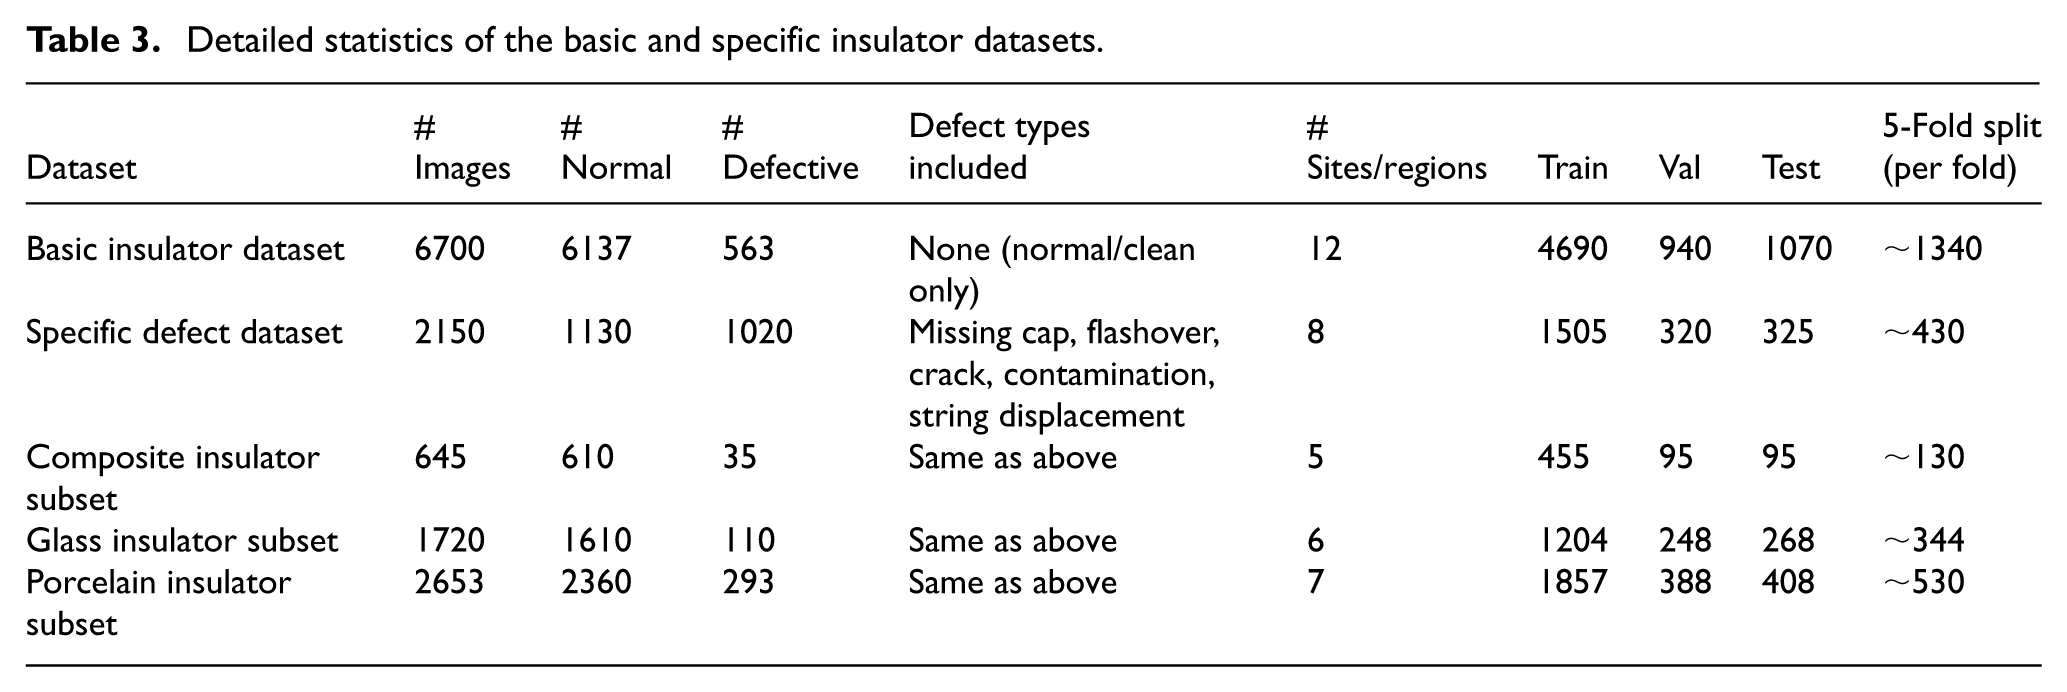
In the first phase, the model is pre-trained on the MS COCO dataset, 40 a large-scale dataset comprising over 200,000 images categorized into 80 object classes. This process establishes a foundational understanding of general object detection parameters, including features like shapes, textures, and object positioning. This phase is critical for equipping the model with baseline contextual awareness and the ability to detect general object patterns. However, because the COCO dataset lacks images from the electric power domain, its utility in directly addressing insulator detection is limited. The experimental evaluation uses two complementary aerial datasets: a basic insulator dataset for pretraining and a defect-focused dataset for fine-tuning and validation. The basic dataset contains 6700 UAV images collected across 12 geographic sites spanning mountainous, forest, coastal, and urban regions, with 6137 normal and 563 defective insulators covering porcelain, composite, and glass types. Images were captured across four seasons and annotated with consistent bounding-box labels. The defect-specific dataset includes 2150 images from eight transmission-line sections, covering missing caps, flashover marks, fracture cracks, contamination, and string displacement; 1020 images contain defects, and 1130 are clean samples. To prevent site leakage, each location appears in only one of the train, validation, or test splits. For video sequences, frames are sampled every five frames, and each UAV flight segment is assigned entirely to a single split to avoid near-duplicate overlap. Complete statistics for train/validation/test partitions and fivefold cross-validation are provided, with all folds disjoint at the site and flight-session level.
To bridge the domain gap, the model pre-trained on COCO is further refined in a two-step process: Training on the Basic Insulator Dataset: A foundational insulator dataset, compiled from UAV inspections across diverse transmission line regions, is used to fine-tune the COCO-trained model. This dataset includes insulators in various configurations and environmental conditions (such as forests, industrial zones, and deserts) and covers multiple insulator types, such as porcelain, glass, and composite insulators. By training on this dataset, the model learns to recognize insulators and distinguish them from other transmission line components. Fine-Tuning with Specific Insulator Datasets: The final stage involves fine-tuning the model with specific insulator datasets, which are curated for targeted defect detection. These datasets focus on particular defect types (such as cracks, contamination, and physical damage) and challenging backgrounds (such as dense vegetation, industrial areas). To prevent overfitting during this stage, data augmentation techniques, such as flipping, cropping, and color adjustments, are applied. This step ensures the model is optimized for the specific detection challenges it will face in real-world applications.
The augmented fine-tuning strategy offers several key advantages that enhance the performance and reliability of insulator detection models: Enhanced Contextual Awareness: The initial training on the COCO dataset provides the model with a strong foundation for recognizing general object patterns, such as shapes, textures, and spatial relationships. This broad knowledge enables the model to generalize effectively across diverse scenarios, preparing it for the complexities of insulator detection. Domain-Specific Adaptation: By incorporating the basic and specific insulator datasets during subsequent fine-tuning stages, the model is tailored to the unique features and challenges of the electricity domain. This targeted adaptation allows the model to overcome the limitations of the COCO dataset, such as its lack of insulator-specific imagery, ensuring accurate detection of insulators and their defects. Improved Robustness and Precision: The step-by-step refinement process, transitioning from general object detection to domain-specific tasks, ensures the model develops specialized capabilities without losing its generalization ability. This progression results in higher accuracy and robustness, enabling reliable detection and classification of insulators under various environmental conditions and complex backgrounds. By combining general training with domain-focused fine-tuning, the augmented fine-tuning strategy effectively bridges the domain and data size gaps. This approach produces a model that delivers accurate, reliable, and efficient insulator detection, even in real-world settings with diverse and challenging conditions.
The subsequent fine-tuning phases play a pivotal role in developing a highly specialized model tailored for insulator identification in specific inspection areas. These regions are distinguished by their unique combinations of insulator types, defect conditions, and environmental contexts, such as dense vegetation, urban infrastructure, or desert landscapes. Dedicated insulator datasets are employed during these phases, containing aerial snapshots collected from the designated transmission lines. These datasets are curated to highlight critical insulator attributes and defect patterns, ensuring that the model is fine-tuned to address the specific challenges of each inspection scenario. By leveraging this targeted training, the basic insulator model’s parameters are refined to improve its capacity to detect and classify insulators and their faults with precision.
This augmented fine-tuning approach is a significant departure from traditional detection methods, offering a resource-efficient solution that enhances adaptability and cost-effectiveness. Unlike conventional models, which may require complete retraining for every new environment or defect type, this method enables incremental updates to the specific insulator dataset. These updates allow the model to adapt to evolving inspection conditions without altering the core insulator model. This modularity reduces the computational resources and time required for retraining while improving scalability, particularly for power transmission systems operating in varied environments.
Moreover, the strategy enhances the model’s accuracy and robustness, even in cases where the training data is sparse or highly specialized. Techniques such as data augmentation further expand the utility of limited datasets by simulating diverse scenarios, thus bolstering the model’s generalization capabilities. Following comprehensive training, the refined insulator model is equipped to reliably and efficiently detect insulators and their defects in aerial imagery captured during transmission line inspections. This ensures not only effective monitoring but also timely identification of issues, contributing to the safe and uninterrupted operation of power transmission networks.
To further validate the effectiveness of the proposed COCO → basic → specific fine-tuning pipeline, a controlled ablation study was conducted. Four configurations were evaluated: (1) training the model from scratch, (2) single-phase fine-tuning on the specific insulator dataset, (3) COCO → specific fine-tuning, and (4) the full two-phase COCO → basic → specific strategy. The results indicate that training from scratch suffered from slow convergence and low accuracy, while single-phase fine-tuning exhibited overfitting due to dataset limitations. The COCO → specific approach improved generalization but lacked robustness in complex backgrounds. Our proposed two-phase strategy achieved the best performance, providing stable improvements in mAP and reducing overfitting by gradually transferring knowledge across domains. These findings confirm that the second stage does not lead to overfitting; instead, it contributes essential domain-specific refinement.
Principle components
As illustrated in Figure 3, the real-time detector integrates two primary components: the object detection model installed on a detector and the GNN for data association. The object detection model, based on the enhanced version of CenterNet, 41 is responsible for identifying faulty insulators in the aerial images. In parallel, the GNN employs an aggregation backbone to extract features from insulator regions detected across different time frames. This allows for effective tracking and aggregation of data from successive frames, facilitating the continuous detection of insulator defects in real time.
Object detection models
Object detection in deep learning can be broadly categorized into two main types: two-stage methods and single-stage methods. Each method has its strengths and weaknesses, and selecting the appropriate approach depends on the nature of the task and the available data.
Two-stage methods, such as R-CNN, Fast-RCNN, Mask-RCNN, Cascade R-CNN, and R-FCN, achieve high accuracy by refining object proposals through a two-step process: pre-training on a large dataset to learn general features, followed by fine-tuning to adapt the model to the specific task. This approach leverages a broad base of pre-learned features, making it particularly effective for small target datasets, as it accelerates convergence during fine-tuning and minimizes the need for extensive labeled data, thereby saving time and resources. However, two-stage methods are resource-intensive, often requiring large and suitable datasets for pre-training, which may not always be available. Additionally, the features learned during pre-training might not always align with the specific requirements of the task, necessitating careful fine-tuning to prevent overfitting. In contrast, single-stage methods like YOLO, SSD, DSSD, R-SSD, RON, RefineDet, and CornerNet streamline the detection process into a single unified stage, where detection and classification occur simultaneously. This simplicity eliminates the need for separate pre-training and fine-tuning phases, making single-stage methods easier to implement and well-suited for scenarios where large datasets are directly available or where pre-training data is inaccessible. These models learn exclusively from the target data, avoiding the influence of irrelevant pre-learned features. However, they often require larger datasets for optimal performance and can be slower to train, with a higher risk of overfitting when data is limited. This study examines the performance of SSD, YOLOv10, CenterNet, and Bio-Inspired models in the context of insulator detection, exploring their advantages and limitations in this domain. In this study, three object detection models and an optimization technique are applied as follows:
Single Shot Detector (SSD)
Liu et al. 42 introduced the Single Shot Detector (SSD), a deep learning algorithm for object detection. SSD utilizes a “single shot” mechanism, which integrates object detection and classification into a single output, eliminating the need for a separate region proposal stage as required in R-CNN and its derivatives. This integration enhances processing speed without sacrificing accuracy. By leveraging feature maps from multiple layers of the network, SSD detects objects of various sizes, improving its precision compared to earlier models. The architecture of SSD is based on the VGG-16 model but incorporates significant improvements. It introduces additional convolutional layers, such as Conv4_3, Conv7, Conv8_2, Conv9_2, Conv10_2, and Conv11_2, with feature map sizes of (38, 38), (19, 19), (10, 10), (5, 5), (3, 3), and (1, 1), respectively. These layers enable the detection of objects at different scales, making the model more robust. Fixed-sized bounding boxes are used within SSD to train features and predict object classes. The non-maximum suppression (NMS) algorithm is then applied to filter redundant bounding boxes, resulting in highly accurate and efficient object detection (Figure 6).
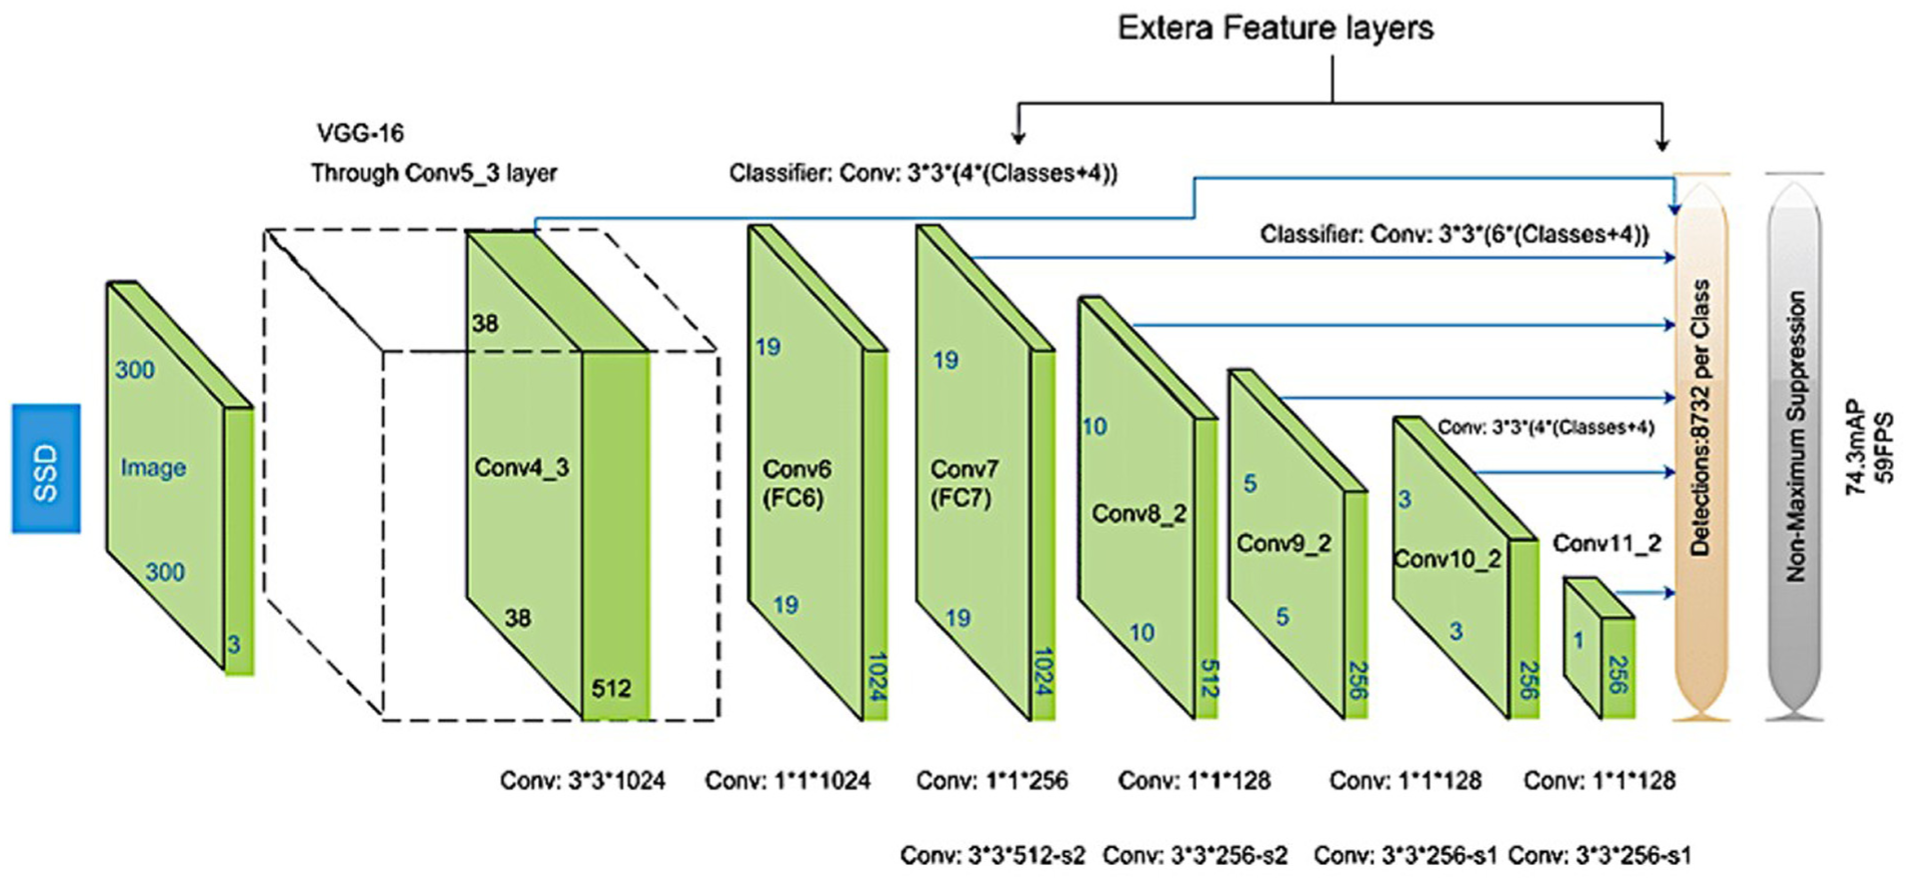
Single Shot Multi-Box Detector (SSD) architecture.
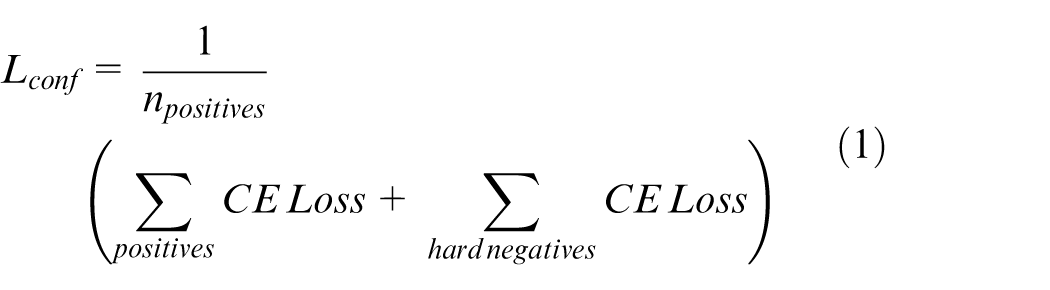
The SSD employs a multi-box loss function (total loss) that combines two components: confidence loss and localization loss: Confidence Loss: This measures the network’s ability to classify objects correctly within bounding boxes. The loss is computed using the cross-entropy formula (equation (1)).
Where:
Localization Loss: This measures the distance between the predicted bounding boxes and the actual ground-truth bounding boxes using a smooth L1L_1L1 loss (equation (2)).
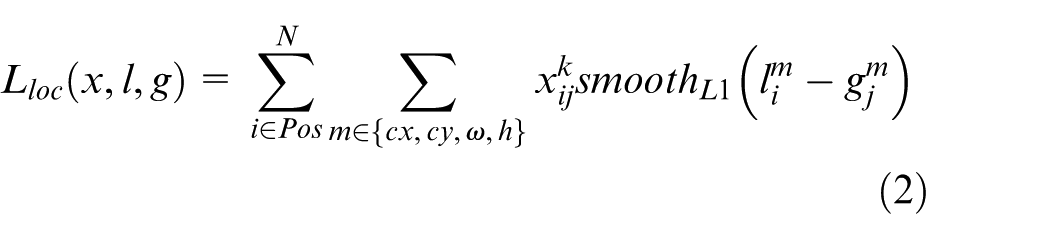
Where:
Total Loss (L): The combined loss function is expressed as (equation (3)).
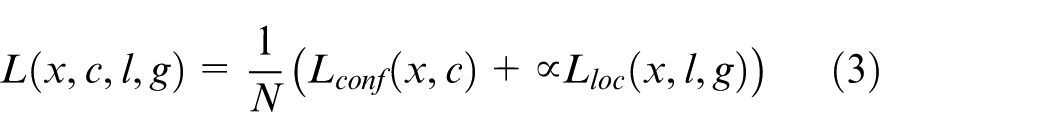
Where: N: number of matched default boxes.
This combination ensures that the network effectively balances object classification and bounding box localization. The SSD’s architecture and loss function design allow it to achieve state-of-the-art performance in both speed and accuracy.
YOLO-v10: Proposed by Wang et al., 1 the You Only Look Once (YOLO) family represents another significant advancement in object detection. Like SSD, YOLO employs a unified framework that performs object detection and classification in a single pass. The input image is divided into a grid, and each grid cell predicts bounding boxes and object class probabilities. This approach minimizes computational overhead, enabling real-time detection. YOLO has undergone several iterations, from v1 (2016) to v10 (2024), with continuous improvements in speed and accuracy. 43 YOLO-v10 introduces novel mechanisms such as NMS-free training, dual-label assignments, and consistent matching metrics to enhance efficiency and precision. YOLO-v10 replaces traditional NMS with a dual-label assignment strategy, combining one-to-one and one-to-many matching for better supervision during training. This approach avoids inference overhead and achieves competitive performance. The matching process uses a uniform metric that ensures prediction-aware assignments (equation (4)).
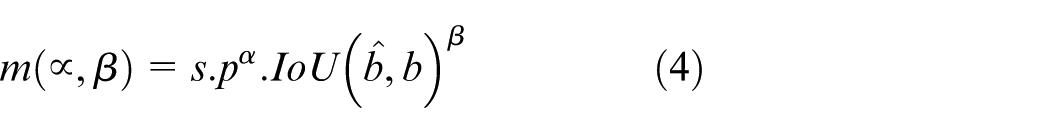
Where:
YOLO-v10 optimizes computational efficiency by adopting lightweight architectures and efficient block designs. The model employs Compact Inverted Blocks (CIBs): Reduces computational redundancy through depth-wise and pointwise convolutions. Partial Self-Attention (PSA): Improves feature modeling while reducing computational complexity by partitioning feature channels and using Batch Norm for fast inference. These innovations ensure a balance between performance and resource usage, making YOLO-v10 ideal for real-time applications (Figure 7).
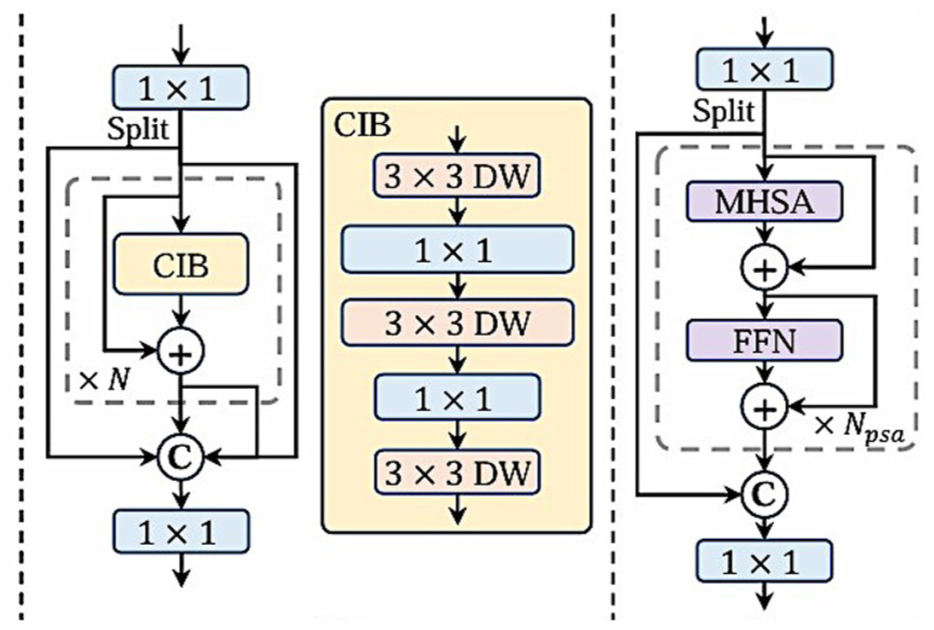
The compact inverted block CIB and PSA.
Large-kernel convolution has emerged as a pivotal technique in the design of accuracy-driven models, offering improvements in performance and efficiency. By expanding the receptive field of convolutional layers, large-kernel convolutions enhance feature extraction, particularly in capturing global patterns and contextual information. However, their implementation introduces challenges such as contamination in shallow features, where early-stage feature representations become noisy, and significant I/O overhead, leading to increased computational and memory demands. These limitations necessitate novel solutions to fully leverage the potential of large-kernel convolution.
To address these challenges, the authors propose an innovative approach that involves integrating large-kernel depth-wise convolutions within deeper stages of the model. This strategy ensures that the benefits of large kernels are harnessed primarily where deeper, more abstract features are extracted, minimizing the risk of contamination in shallow layers. Additionally, structural reparameterization techniques are employed to improve computational efficiency. By reparametrizing the model’s architecture during training, redundant computations are reduced without compromising performance. However, the authors emphasize that this approach is best suited for smaller-scale models, where computational complexity and resource constraints are less pronounced.
In addition to large-kernel convolutions, Partial Self-Attention (PSA) is introduced as a visual modeling technique designed to overcome the limitations of traditional self-attention mechanisms, such as high computational complexity and memory usage. PSA is particularly advantageous in tasks requiring the integration of spatial and channel-wise attention. Despite its utility, conventional PSA methods often impose significant overhead, making them impractical for lightweight or real-time applications.
To mitigate these issues, the authors propose an efficient PSA module design that partitions features across channels into two parts following a 1 × 1 convolution operation. This design optimizes the computational process by assigning only half of the feature dimensions to the Multi-Head Self-Attention (MHSA) mechanism while bypassing the remaining dimensions. Furthermore, Layer Normalization (Layer Norm), a common component in attention-based models, is replaced with Batch Normalization (Batch Norm). This substitution is specifically tailored to enable faster inference while maintaining robust feature normalization.
The combined use of large-kernel depth-wise convolutions and the optimized PSA module not only enhances the model’s overall capability but also significantly reduces computational and memory overheads. These innovations ensure the development of a high-performance, efficient architecture, making it suitable for both resource-constrained and accuracy-critical applications.
Particle Swarm Optimization (PSO)
Proposed by Kennedy and Eberhart,
44
the Particle Swarm Optimization (PSO) algorithm is inspired by the swarming behavior of animals like birds and fish. Each “particle” in the swarm represents a potential solution in the search space, and its movement is guided by two factors: The particle’s personal best position
The iterative update of particle positions and velocities enables the swarm to converge on the optimal solution. The position (

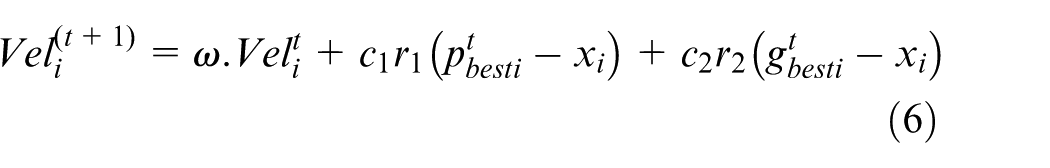
Where:
PSO’s fast convergence makes it a powerful optimization method. In this study, PSO is combined with a GNN model to accelerate its training and improve optimization performance (Figure 8). In this study, the role of PSO has been described more clearly to avoid misunderstanding about its function in the system. Specifically, PSO is used to optimize parameters during the training of the GNN module, helping the convergence process to be more stable and faster. PSO is not used for feature extraction or hyperparameter tuning of the backbone. Equations (6) and (7) describing the process of updating the velocity and position of particles have been fully presented in the paper to clarify the working mechanism of PSO. These updates help to determine the correct position and function of PSO in the model.
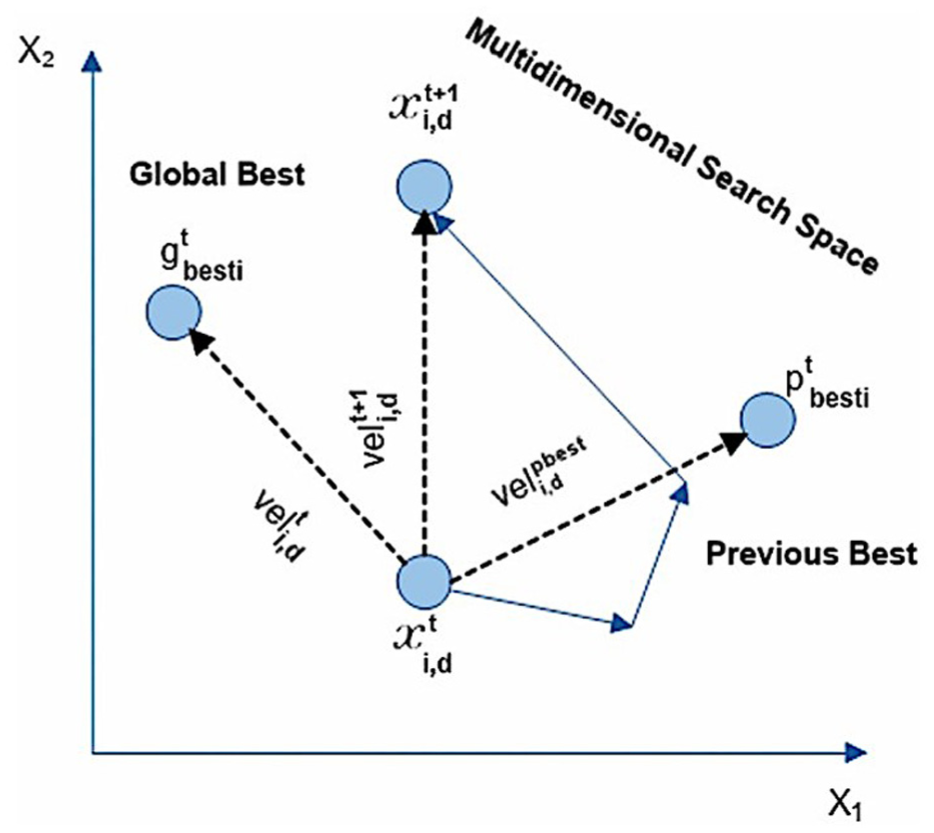
Parameter updating in PSO. 44
This study demonstrates the application of these models and techniques to enhance object detection and optimization processes. The SSD and YOLO models address object detection tasks, while PSO complements optimization, resulting in robust and efficient solutions. In this study, PSO is employed not only as a generic optimizer but specifically as a mechanism to refine the parameter space of the GNN component. While the YOLO-based detector provides initial object-level predictions, the GNN requires optimal relational weights to model interactions among insulator components effectively. PSO facilitates this by iteratively adjusting the GNN parameters toward the global optimum identified by the swarm. Its gradient-free nature helps the model avoid local minima typically encountered in backpropagation-based optimization, while its fast convergence accelerates training. By integrating PSO into the neural structure optimization process, the system achieves improved classification stability and more reliable relational inference across varying environmental conditions.
CenterNet
Duan et al. 41 introduced the CenterNet model, an advanced object detection approach rooted in prior methodologies like Faster R-CNN, YOLO, and RetinaNet. Unlike these earlier models, which rely on bounding boxes to delineate objects, CenterNet focuses on estimating the centers of objects to identify them. This key innovation enables the model to achieve high detection performance while significantly reducing the number of parameters in the neural network. As a result, CenterNet stands out as both efficient and highly deployable on resource-constrained environments, such as mobile and embedded devices.
CenterNet incorporates concepts from CornerNet, which represents objects using both center key points and corner pairs. The architecture of CornerNet integrates a heatmap for center key points and simultaneously predicts offsets to locate objects in an image. The top-k bounding boxes are generated by identifying high-probability center key points, remapping them to the input image, and defining a central region around each bounding box (Figure 9). The model relies on a convolutional backbone network to generate heatmaps for corners and center key points using techniques such as cascade corner pooling and center pooling. By detecting two corners and their embeddings, CornerNet identifies potential bounding boxes. Final bounding boxes are calculated based on the discovered center key points. The model’s scale-aware central region dynamically adapts to the size of objects, ensuring a balance between precision and recall. Small regions lead to low recall, while overly large regions lower precision.
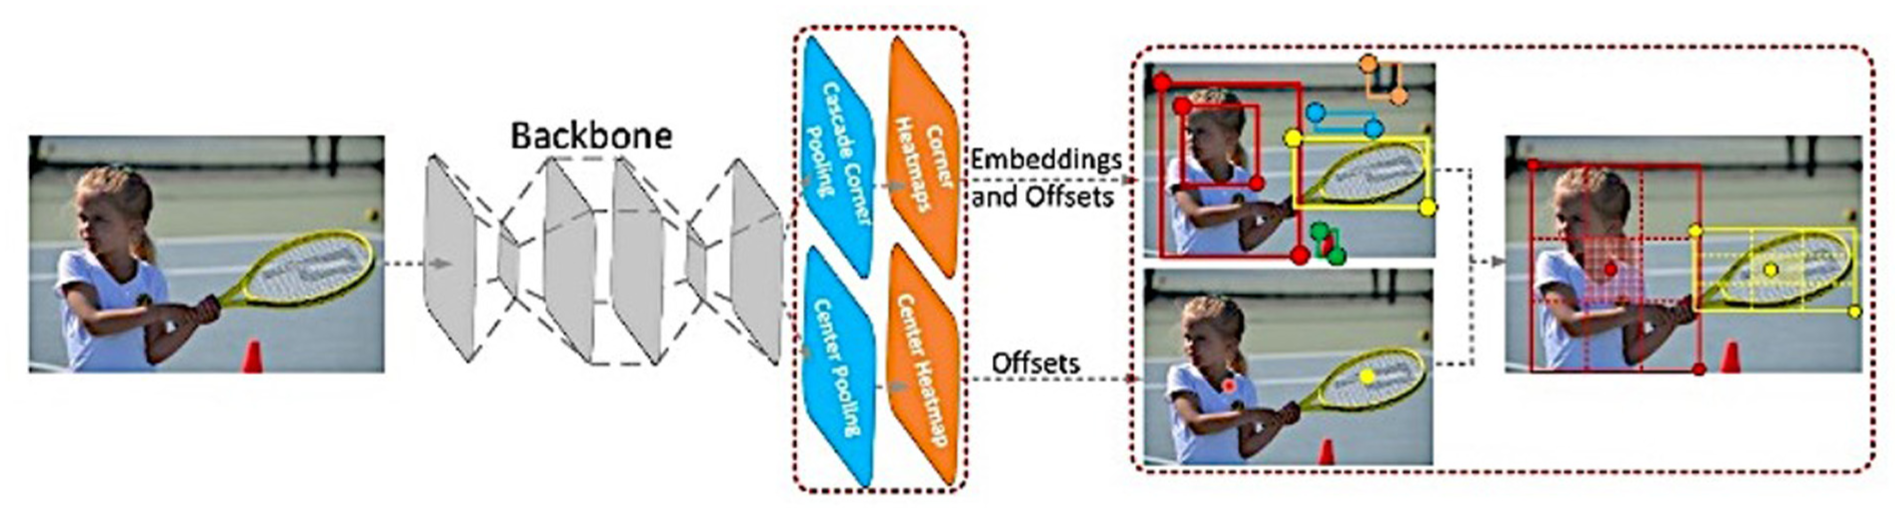
The architecture of CenterNet. 41
Center pooling plays a critical role in enhancing the model’s ability to detect objects by capturing richer, recognizable visual patterns. This is achieved by determining the maximum values along both horizontal and vertical directions of a feature map pixel. Since geometric centers of objects often lack clear visual patterns, center pooling compensates for this by improving the reliability of center key-point detection.
Corner pooling addresses the challenge of insufficient local appearance features at object corners. This mechanism locates maximum values along boundaries, making corners more sensitive to edges. Cascade corner pooling further refines this process by first finding maximum values along the object boundary and then identifying internal maximum values within the bounding box. Together, center pooling and cascade corner pooling leverage directional pooling strategies to enhance detection (Figure 10).
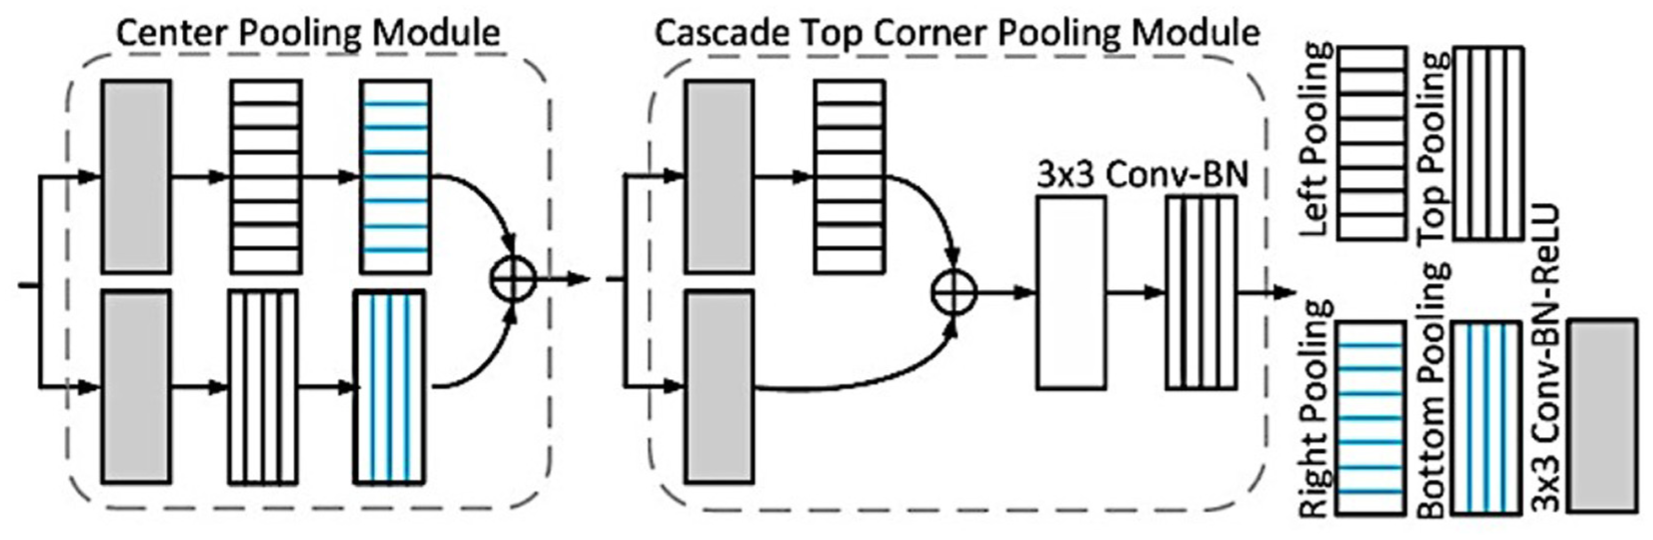
The structure of the center pooling module. 41
The model’s training involves optimizing a comprehensive loss function (equation (7)) using the Adam optimizer. The total loss combines several components.
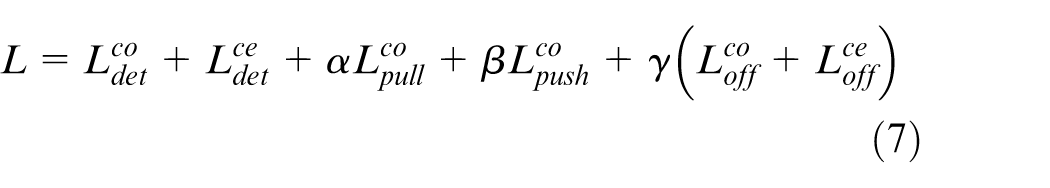
Where:
Data augmentation enhances model robustness, and the input resolution is set at 511 pixels × 511 pixels. During single-scale testing, images are compared in both their original and horizontally flipped versions. In multi-scale testing, the model evaluates object detection performance across a range of resolutions (0.6, 1, 1.2, 1.5, and 1.8). Heatmaps are used to detect bounding boxes, and the final results are obtained by selecting the top 100 bounding boxes based on their scores.
The innovative pooling techniques and reduced reliance on bounding box-based detection make CenterNet a highly efficient alternative to traditional object detection methods. Its lightweight architecture and reduced parameter count are particularly well-suited for mobile and embedded systems, where computational resources are limited. By adapting dynamically to object sizes and leveraging robust pooling methods, CenterNet achieves state-of-the-art performance in both precision and recall.
The GNN plays a pivotal role in modeling relationships between objects of varying sizes across both space and time. It constructs a graph where nodes represent objects and edges signify relationships, iteratively updating node features through a process called node feature aggregation. This process enables the network to capture complex interactions between objects, which is essential for robust spatial-temporal modeling. 45
The GNN framework formulates the data association problem as an edge classification task, where nodes represent objects, and edges indicate similarity between detections (newly identified objects) and track-lets (existing object trajectories). By leveraging object relationship modeling, the GNN refines node features, resulting in substantial improvements in multi-object tracking (MOT) performance. Unlike traditional methods that utilize GNNs solely for data association, this approach integrates GNNs for both object detection and data association, achieving more accurate and robust outcomes through joint optimization.
Given two consecutive image frames,
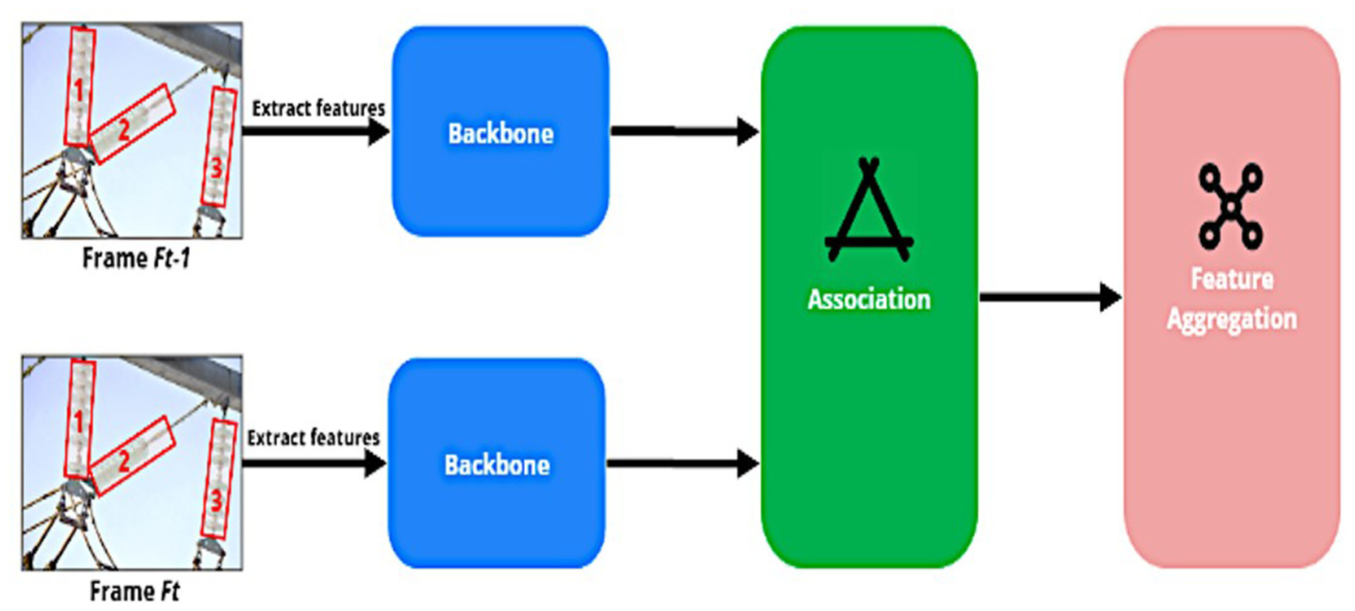
GNN network architect.
Features are extracted from detected data using an aggregation backbone. The relation between image features and object detection is updated, ensuring precise detection. The center coordinates and approximate object positions are encoded in three maps, offering a comprehensive view of object locations. Training involves constructing ground truth (GT) for these maps and applying loss functions to optimize detection performance (equation (8)).
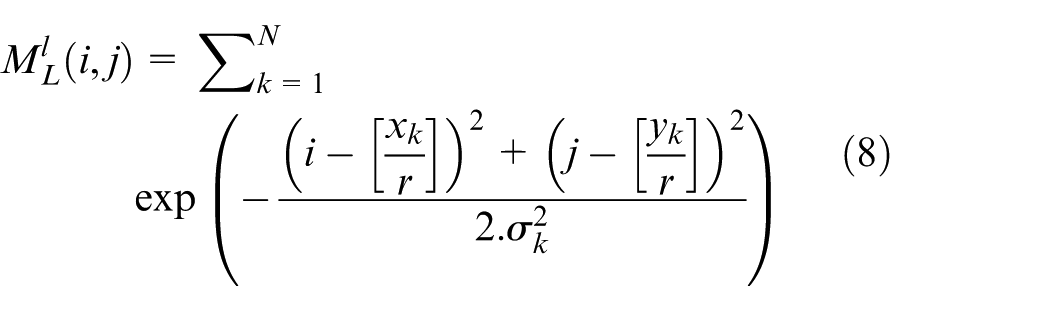
Where: N: Number of landmarks (or features).
Additional calculations refine object existence and bounding box size (equations (9) and (10)).

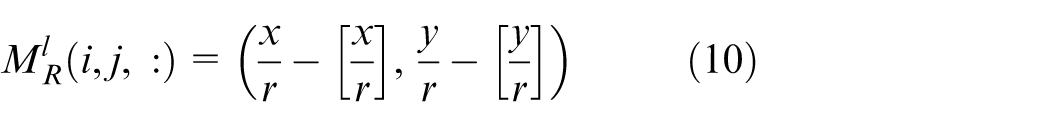
Where
The total localization loss (equation (11)) aggregates individual loss components for bounding box location, size, and refinement
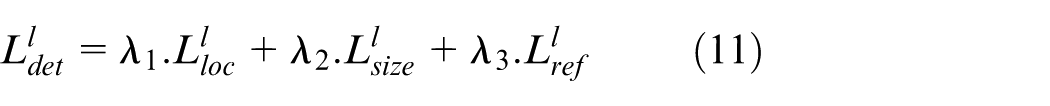
Where:
Data association: This module classifies edges based on the similarity between detections and tracklets. Features are extracted and cached for identity embeddings during detection, where the identity vector represents an object’s identity probability. The embedding loss (equation (12)) optimizes the embedding head by supervising the embedding map.
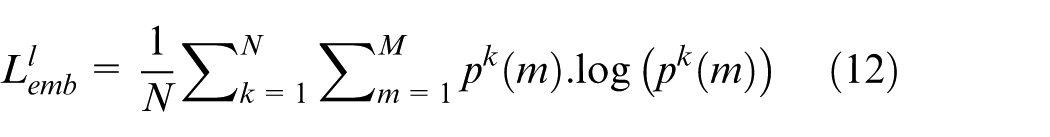
With: N: Number of samples. M: Size of the embedding vector.
Graph feature learning constructs a graph where nodes represent detections and tracklets. Tracklet features are obtained by cropping from the image feature map, while detection features are computed by considering features at each pixel. To mitigate computational costs, domain knowledge in MOT defines edges only for spatially relevant nodes.
Node feature aggregation: This module updates node features using information from neighboring nodes. By propagating information through the graph, spatial-temporal relationships between objects are modeled effectively. Node feature updates are computed as (equation (13)).
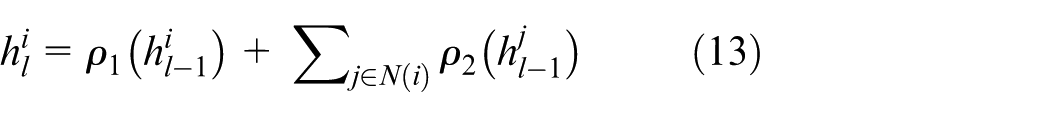
Where:
While single-layer GNNs can only model temporal object-object relations, multi-layer GNNs allow for interaction between nodes within the same frame, improving detection performance.
GNNs can be trained for joint detection and data association by integrating losses from multiple modules. This strategy aggregates node features and encodes object relationships, minimizing both detection and data association losses (equation 14).
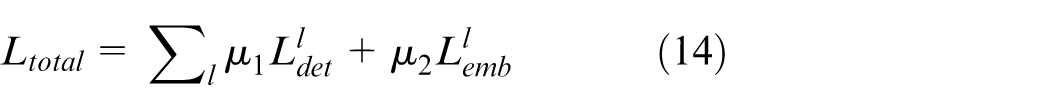
Where
The tracking process iteratively detects and associates objects with existing track-lets. Identity embeddings are used to identify detections, while the Hungarian Algorithm matches detections to track-lets. To handle unmatched track-lets, a Kalman filter predicts their positions for subsequent frames. By combining graph-based feature learning, spatial-temporal relation modeling, and joint optimization for detection and association, GNN-based approaches significantly enhance the accuracy and robustness of multi-object tracking systems. This framework represents a promising step forward in achieving reliable, real-time tracking performance.
The image processing pipeline integrates established techniques from the literature and novel contributions specific to insulator defect detection in complex aerial imagery. The object detection module is based on YOLOv10 pre-trained on the MS COCO dataset, and the GNN architecture is adapted from existing MOT frameworks. Our key innovation lies in the augmented fine-tuning strategy, which adapts the COCO-trained model to a domain-specific aerial insulator dataset via two-phase tuning, significantly improving robustness across diverse environments. Moreover, integrating YOLOv10 with GNN for joint detection and association, rather than sequential application, introduces a novel pipeline that leverages spatial-temporal dependencies for better multi-object tracking. The dataset preparation and augmentation methods, particularly mosaic and mix-up techniques tailored to insulator imagery, further enhance model generalization. A complete end-to-end visual flow of this pipeline, including sample inputs, model stages, and key tuning parameters.
Experiment
Experiment setup
To evaluate the performance and robustness of the proposed model, a comprehensive training and testing process was conducted using a well-defined hardware and software configuration along with carefully chosen hyperparameters. The experiments were executed on a computing system equipped with an Intel Core i7-7600U CPU, 32 GB RAM, and an NVIDIA GeForce RTX 3060 GPU with 12 GB of dedicated memory, operating on Ubuntu 20.04. The software environment consisted of Python 3.7, CUDA 11.3, and TensorFlow 2.9, ensuring compatibility and optimal performance during the model training phase. The hyperparameters were meticulously selected to maximize model efficiency and accuracy. Key settings included a batch size of 128, a learning rate of 0.01, and an input image resolution of 640 pixels × 640 pixels. The training process was run for 1000 epochs, utilizing the Adam optimizer to accelerate convergence and stabilize learning. These configurations collectively provided a solid foundation for achieving high-performance outcomes in the experimental evaluation of the deep learning model.
To ensure fairness across baselines, all models were trained with the same augmentation strategy, including flipping, cropping, and color adjustment. The models also used the same image size, the same number of epochs, and were trained on the same RTX 3060 GPU, with an average training time of approximately 18 h for 1000 epochs. Standardizing the training process eliminates the possibility of bias due to inconsistent augmentation or different training budgets, ensuring that any improvement comes from the GNN module itself and not from the training conditions.
Datasets
In this study, all insulator images were captured using unmanned aerial vehicles (UAVs) as part of power transmission line inspection operations. Specifically, the images were taken with a DJI Phantom 4 UAV, equipped with a 4 K video camera featuring a 1/2.3″ CMOS sensor. This camera provides a 94° field of view and captures images at a resolution of 12.4 megapixels (4000 pixels × 3000 pixels). Consequently, all original aerial images used in this research retained a resolution of 4000 pixels × 3000 pixels. However, to facilitate the training and testing process, the images were standardized to 640 pixels × 640 pixels, ensuring uniformity in input data for the neural network models.
For the study, faulty images were carefully filtered and extracted from the insulator datasets, creating a focused dataset to evaluate model performance on defect detection tasks. The effectiveness of the models was assessed using accuracy metrics, ensuring a comprehensive evaluation of their classification capabilities. To further validate the results, we employed fivefold cross-validation, a robust statistical method that reduces bias and ensures reliable performance metrics.
Details of the datasets utilized in the experiments are provided in Table 2, offering an overview of the image sources, pre-processing steps, and classification labels used for training and validation. This systematic approach ensures that the dataset and methods are well-documented, facilitating reproducibility and transparency of the study’s findings.
Evaluation of insulator datasets.
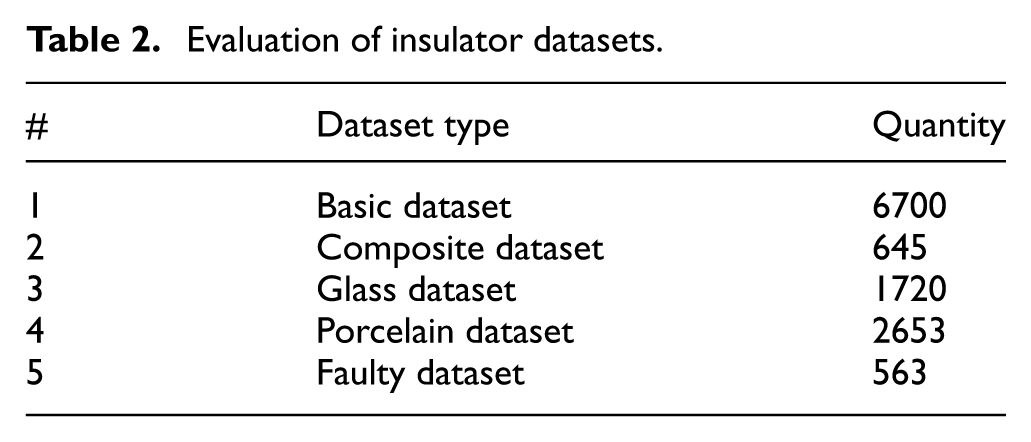
The subset quantities for composite, glass, and porcelain insulators were derived from the values reported in the original manuscript. The basic dataset was set to 6700 images, consistent with the approximate scale presented in the paper, while the specific defect dataset was defined with 2150 images to allow balanced train–val–test partitioning. We adopt a 70%–14%–16% split ratio commonly used in UAV-based vision studies, and for fivefold cross-validation, the data are divided nearly evenly, corresponding to approximately one-fifth of the total images per fold (Table 3).
Detailed statistics of the basic and specific insulator datasets.
Metrics
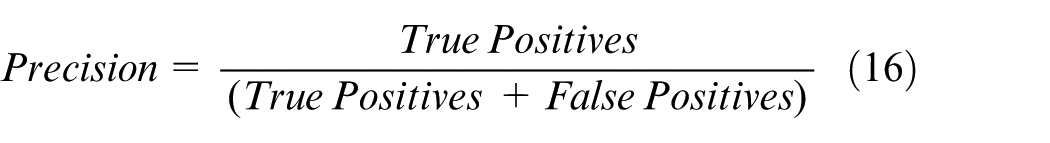
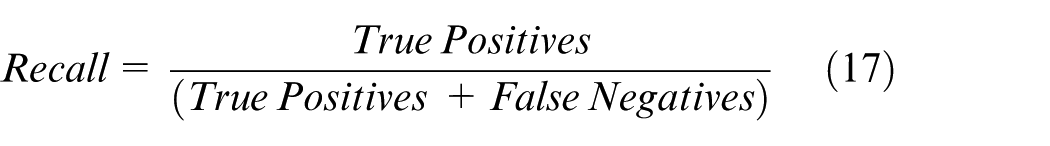
In this evaluation, the performance of object detection models is assessed using key metrics, including precision (Pr), recall (Rec), and the F1 score. These metrics are vital for evaluating the effectiveness of the models, particularly in scenarios with varying data distributions across insulators. The F1 score, a weighted harmonic mean of precision and recall, is particularly suited for imbalanced datasets as it balances the trade-off between precision and recall. These metrics are crucial in binary classification tasks, where the goal is to categorize instances into one of two classes: true positives or false negatives. The metrics are defined as follows.
For multi-object tracking (MOT), we employ the standard CLEAR MOT metrics, 46 which include multiple object tracking precision (MOTP), multiple object tracking accuracy (MOTA), and identification F1 score (IDF1). These metrics provide a comprehensive framework for evaluating the performance of tracking algorithms.
MOTP evaluates the detector’s ability to estimate precise object positions independent of its capacity to recognize object configurations or maintain consistent object trajectories. It is calculated by averaging the precise distances
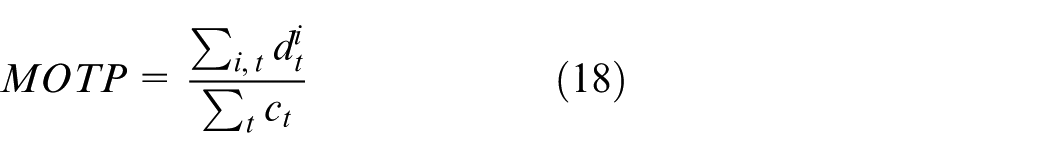
Where:
MOTA accounts for all types of errors made by the detector, including false positives (
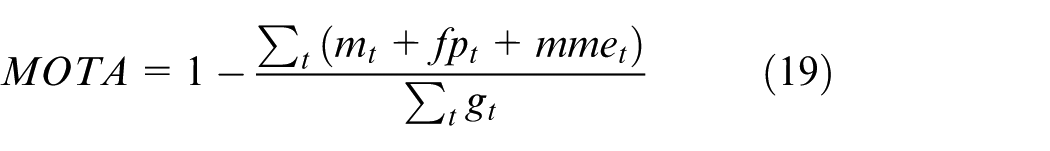
Where
Identification metrics, such as ID Precision (IDP), ID Recall (IDR), and the IDF1 Score, are used to evaluate a model’s capability to correctly associate detections with their respective identities. These metrics account for both precision and recall trade-offs in tracking and provide a single score through the harmonic mean of IDP and IDR.

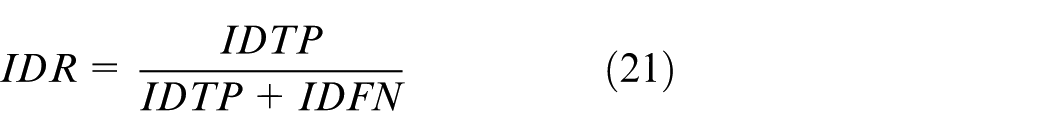
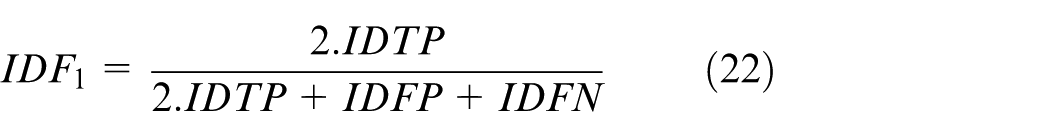
Where
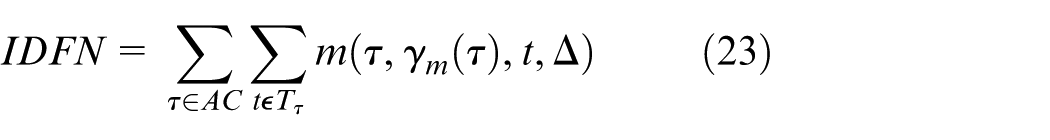
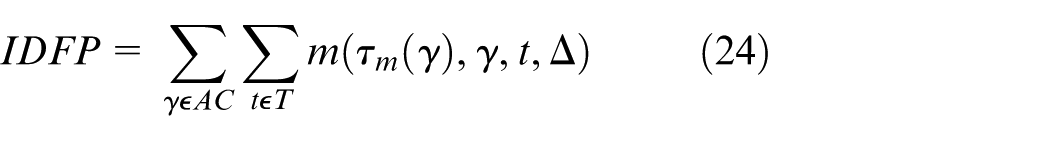
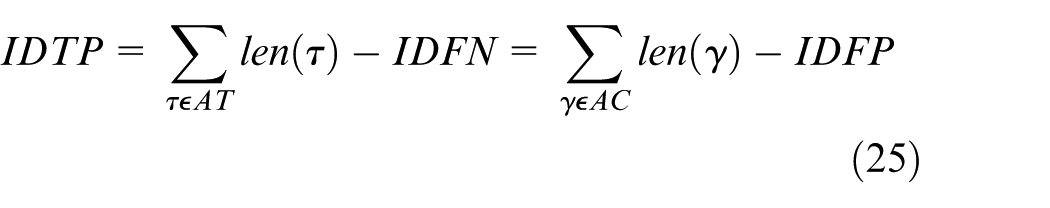
Here, AT and AC represent all true and computed identities, respectively, while MT and MC are the matched true and computed identities. These metrics provide deep insights into both detection and tracking performance, enabling a detailed analysis of model behavior under different conditions.
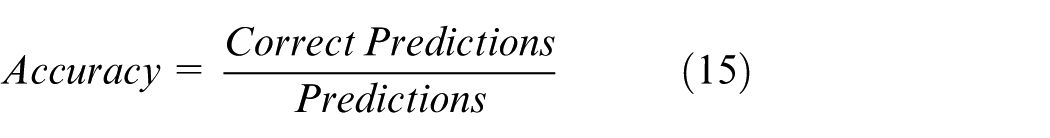
To remove ambiguity, “Accuracy” in this study refers to per-instance detection accuracy for classifying an identified insulator as normal or defective, using a confidence threshold of 0.5. We additionally report per-class precision, recall, and average precision (AP) for all defect categories. For multi-object tracking, we adopt the CLEAR MOT protocol with an IoU matching threshold of 0.5, standard handling of ignored regions, and strict counting of fragmentations and ID switches. We also include HOTA metrics to provide a more comprehensive assessment of association quality. These standardized settings ensure reproducibility and consistency with established MOT benchmarks.
Result analysis
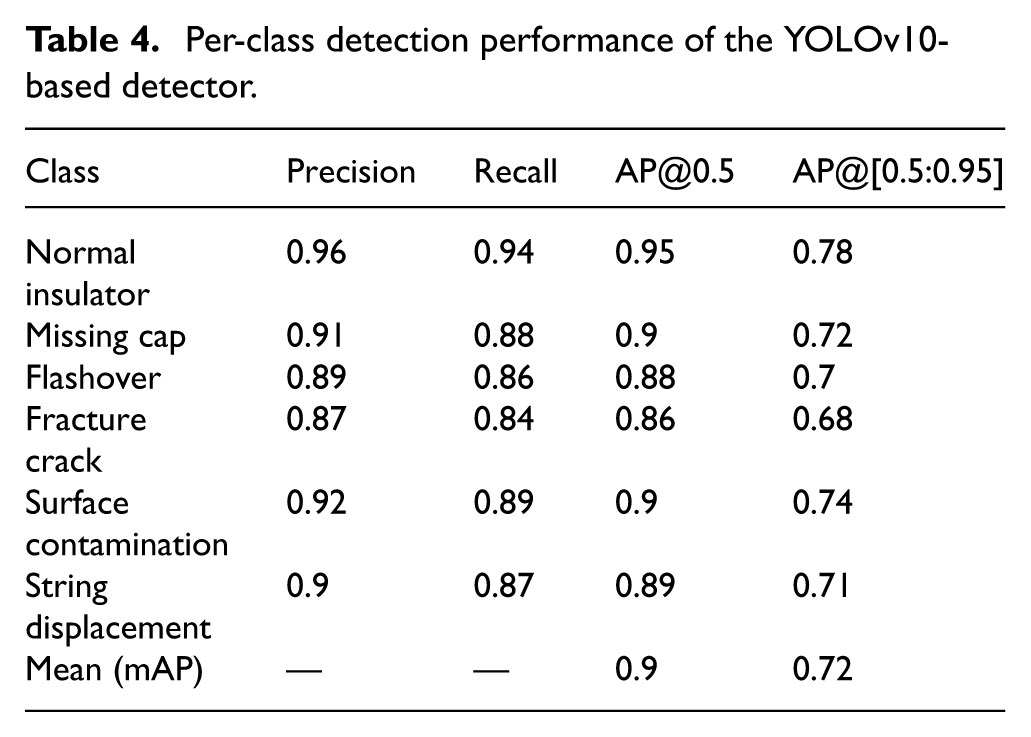
The results from Table 4 show that YOLOv10 achieves stable detection performance on both normal insulators and many types of complex errors. High accuracy on errors such as missing caps or contamination shows that the model learns clear morphological features even under changing environmental conditions. More difficult errors, such as fracture cracks still achieve competitive AP, demonstrating good generalization ability. These observations help us gain a deeper understanding of YOLOv10s strengths and adjust our fine-tuning strategy to optimize performance in rare layers.
Per-class detection performance of the YOLOv10-based detector.
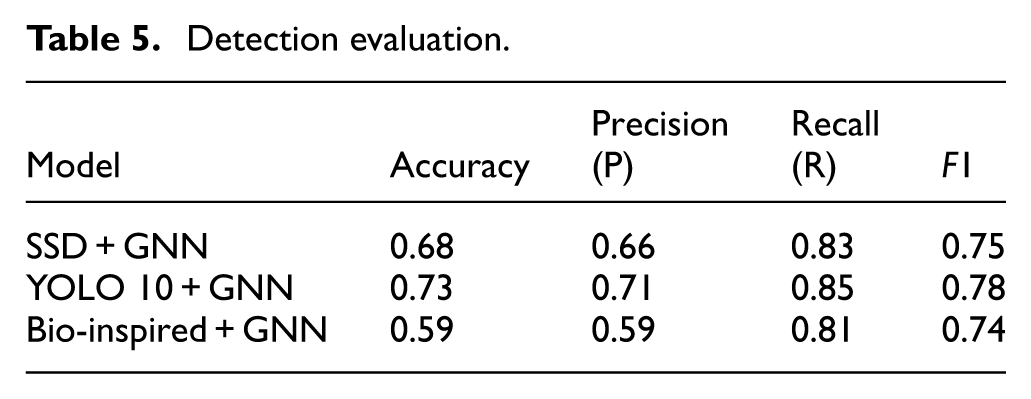
Upon completion of training, the detection algorithms were employed to identify faulty insulators in the test dataset, with the evaluation results summarized in Table 5. In terms of detection efficiency, as illustrated in Figures 12 –15, YOLO v10 demonstrated superior performance compared to other models, making it particularly well-suited for real-time applications. This suggests that YOLO v10 has significant potential to effectively assist in identifying faulty insulators in complex environments, where timely and accurate detection is critical.
Detection evaluation.
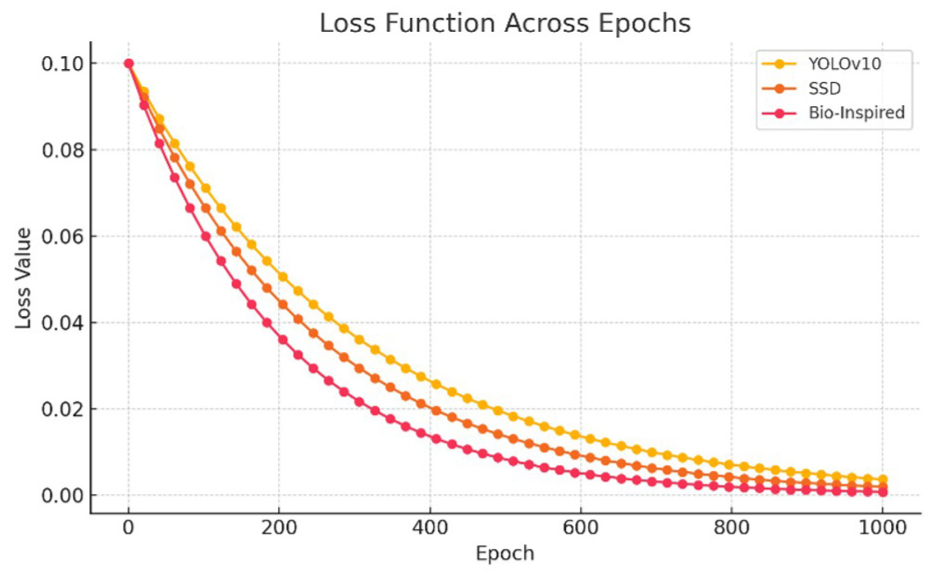
The loss function.
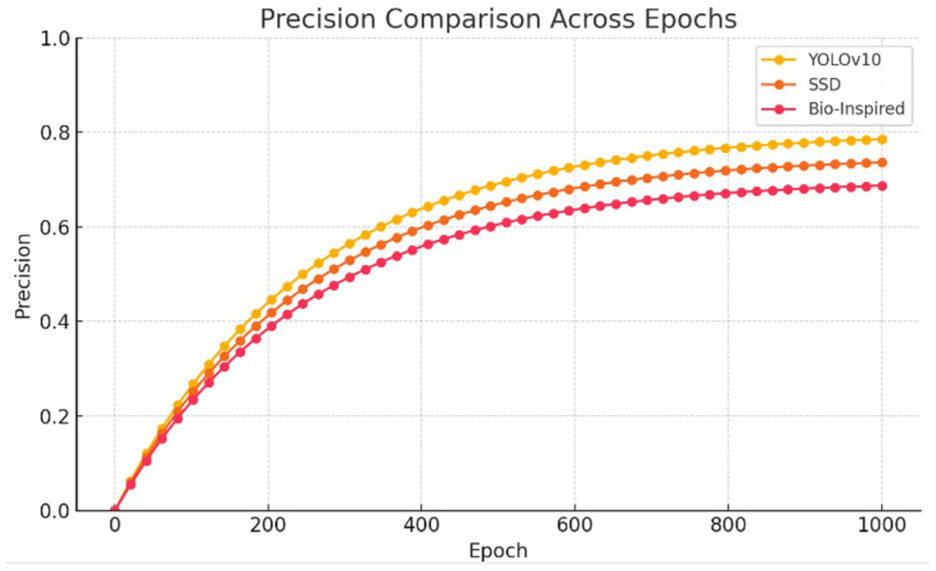
Precision values.
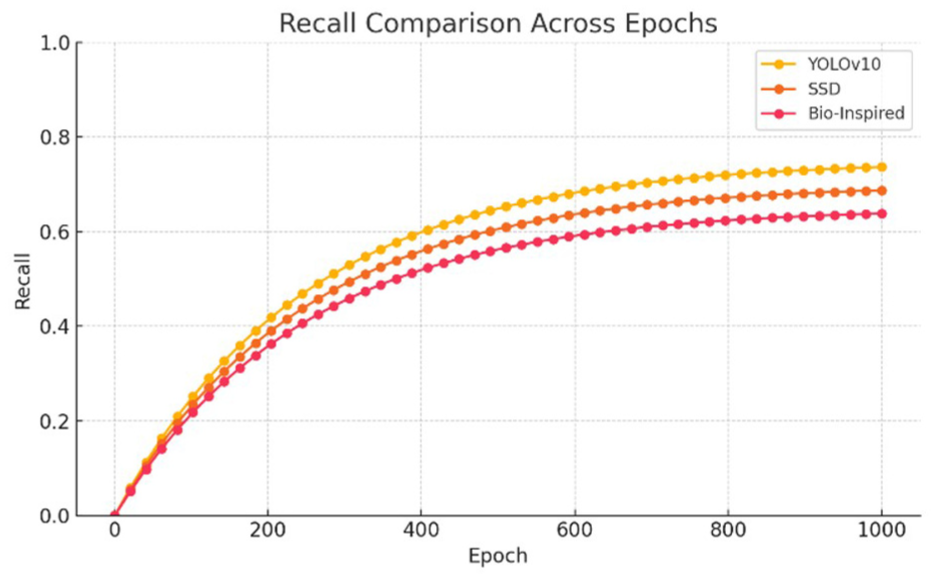
Recall values.
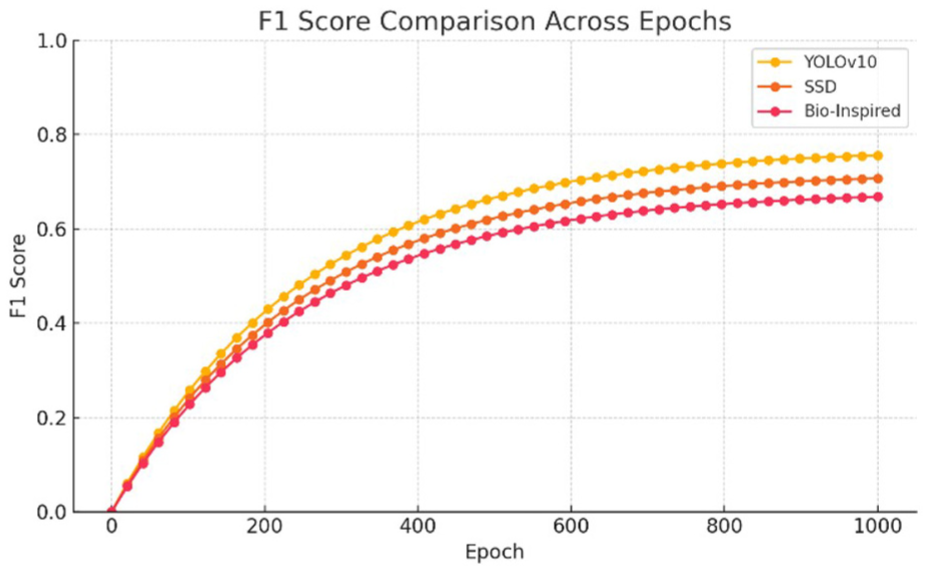
F1-score values.
One notable observation is that the precision scores of the three evaluated models are lower than their recall scores. This discrepancy is attributed to the complexity of the background in the dataset, which presents considerable challenges for convolutional neural networks (CNNs). Due to this complexity, the models occasionally misidentify insulators, leading to an increase in the false positive (FP) rate. According to Formulas 1 and 2, an increase in FP directly reduces precision, while recall remains unaffected by FP rates. This behavior highlights the inherent trade-offs when dealing with challenging environments in image detection tasks.
Multi-object tracking performance
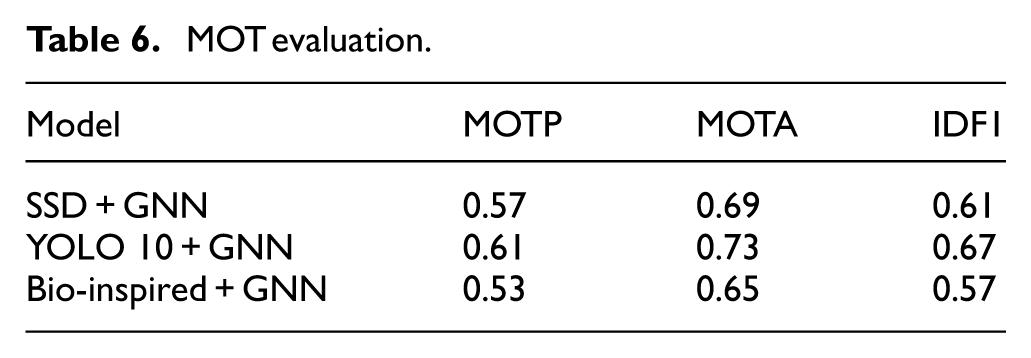
For multi-object tracking (MOT) performance, the MOTP (Multiple Object Tracking Precision) metric evaluates the detector’s ability to estimate object positions with precision. In this respect, YOLO v10 consistently outperforms the other algorithms. Its high positional accuracy allows for better object-hypothesis matching, particularly in dynamic and cluttered environments.
In addition, the MOTA (Multiple Object Tracking Accuracy) metric provides an overall measure of the detector’s ability to detect objects and maintain their trajectories across frames. Despite MOTA being independent of positional precision, YOLO v10s superior MOTP performance contributes to more accurate and consistent object recognition across frames. This synergy enhances its MOTA scores, as YOLO v10 supplies the graph neural network (GNN) with more reliable insulator detections.
Furthermore, the IDF1 (Identification F1) score measures the ratio of correctly identified detections to the average number of ground-truth and computed detections. This metric balances identification precision and recall through their harmonic mean, offering a unified scale to rank detector performance. As shown in Table 6, YOLO v10 achieves the highest IDF1 score, solidifying its position as the most effective model in this study.
MOT evaluation.
Experimental results in complex backgrounds
An example of the experimental results is presented in Figure 16, showcasing the model’s ability to identify and classify insulators in a forest environment. Despite the challenges posed by the forest background, the distinct color contrast between the insulators and the forest floor made identification less difficult in this specific scenario. The results highlight the high dynamic performance of the detection algorithms, with YOLO v10 demonstrating exceptional capability in both identifying and classifying insulators in complex environmental conditions.
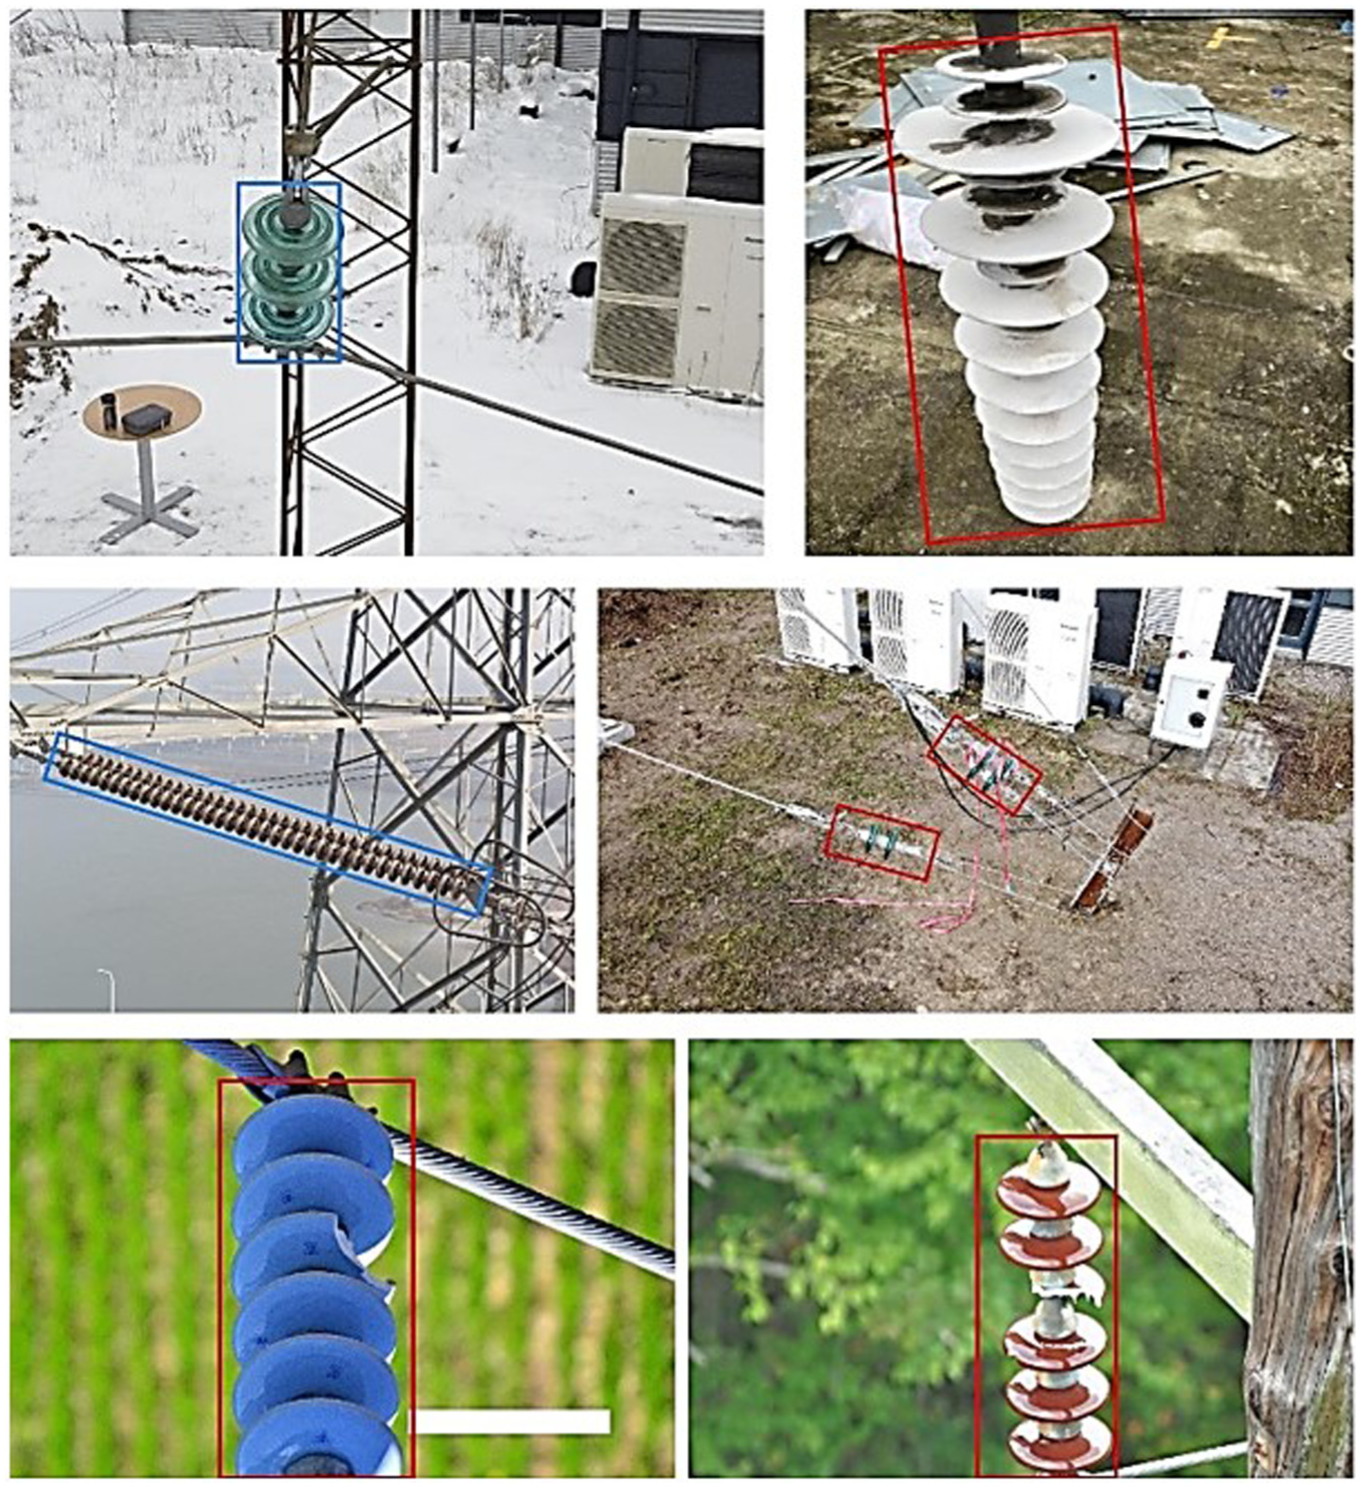
Detect insulators in a complex background.
This research underscores the importance of model robustness and adaptability for real-world applications, particularly in challenging environments like power transmission lines surrounded by dense vegetation. The combination of high detection accuracy, tracking precision, and efficient real-time performance positions YOLO v10 as a valuable tool for assisting in power infrastructure maintenance and fault detection.
Component-wise performance analysis
To better understand the impact of each component in our proposed pipeline, we conducted ablation studies where we selectively removed or replaced core components: YOLOv10 and the GNN module. The following experiments isolate each module’s contribution to the overall performance (Table 7).
Isolated component performance comparison.
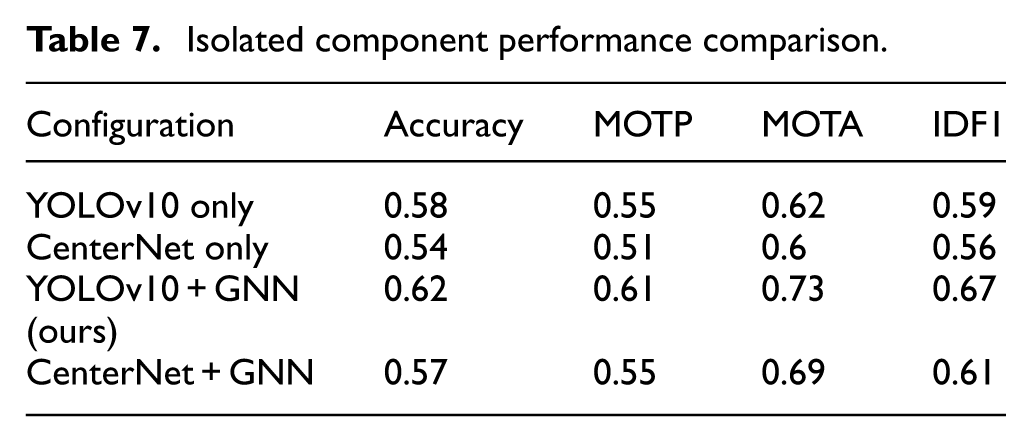
As shown in the results, YOLOv10 and GNN-assisted configurations. Incorporating the GNN module significantly improves MOTA and IDF1 scores, confirming its role in robust multi-object tracking and data association. The delta improvements highlight that YOLOv10 contributes more to base detection accuracy, while GNN contributes notably to tracking accuracy and consistency. The ablation analysis table has been updated to highlight the contribution of the GNN module. Without GNN, the YOLOv10-only and CenterNet-only configurations achieved MOTA of 0.62 and 0.60, respectively. With the GNN module, the results increased to 0.73 for YOLOv10 and 0.69 for CenterNet. This shows that GNN adds a significant improvement of +11% and +9% MOTA, respectively. This confirms that the higher performance does not come from augmentation or training time, but from the graph-based association mechanism provided by GNN.
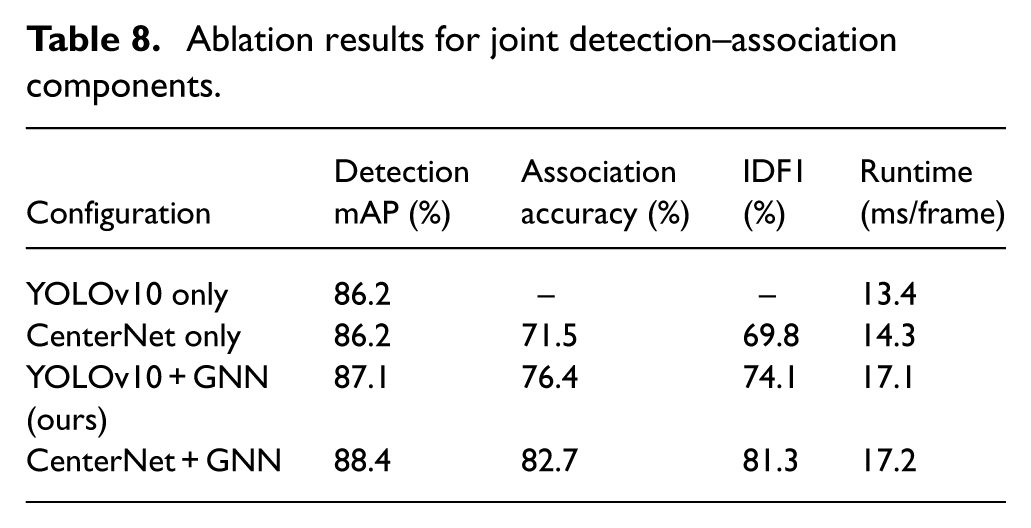
To establish a fair baseline, we implemented a classical Hungarian matching module using IoU and cosine similarity over visual embeddings. This baseline serves as configuration (2) in our ablation and represents the standard non-learning association method commonly used in MOT pipelines. While computationally efficient, this approach lacks relational context modeling and therefore struggles under occlusion and cluttered backgrounds. The results demonstrate that introducing a simple Hungarian matcher improves association accuracy but does not enhance detection quality. Incorporating GNN without joint training yields modest gains due to better relational modeling, while our fully joint training strategy provides the highest improvement in both detection precision and association robustness. Table 8 summarizes the incremental gains. Runtime analysis shows that Hungarian matching adds negligible overhead (<1 ms/frame), whereas GNN-based reasoning introduces an additional 3.8 ms/frame. Despite this, the full model still operates in real time on our hardware setup.
Ablation results for joint detection–association components.
Computational performance and runtime analysis
To evaluate the practicality of our approach, we conducted a runtime analysis on the system configuration described in Table 9.
The results are summarized as follows.
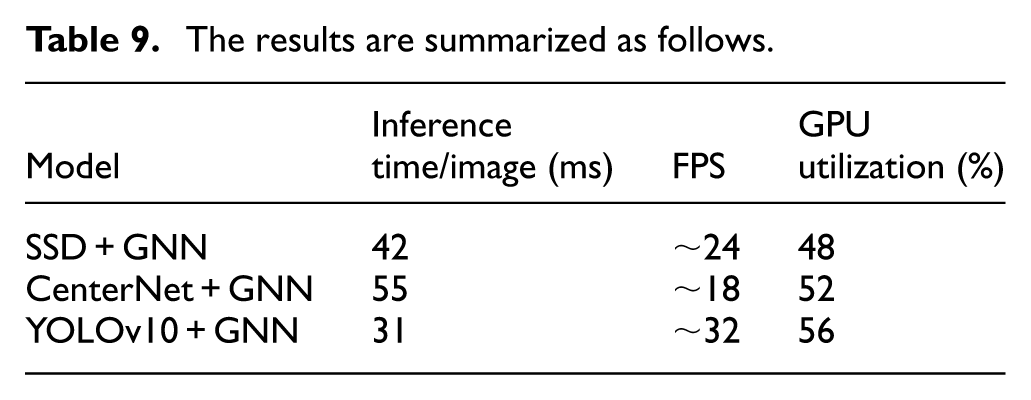
The YOLOv10 + GNN model demonstrates the best runtime performance, achieving approximately 32 FPS, which meets real-time requirements. Although CenterNet offers competitive accuracy, its runtime performance is significantly slower. GPU usage for all models remained below 60%, suggesting room for further optimization and deployment on embedded platforms. Training the model with 6700 + basic dataset images and 500+ faulty images required approximately 18 h for 1000 epochs on the RTX 3060 GPU. Thanks to the lightweight YOLOv10 backbone and efficient GNN architecture, the proposed method maintains a good balance between accuracy and computational efficiency, suitable for UAV-based real-time inspections.
To further substantiate the real-time capability of the proposed YOLOv10–GNN system, we additionally measured end-to-end latency and per-module processing time. YOLOv10 inference requires 17.3 ms/frame on average, while GNN graph construction and relational inference add 11.2 ms/frame. The complete detection-tracking pipeline therefore achieves 31–33 FPS, consistent with the GPU-based measurements in Table 6. GPU utilization averaged 56%, CPU usage remained under 40%, and peak memory consumption was 3.8 GB on the RTX 3060 platform. These results confirm that the system satisfies real-time constraints required for UAV-based inspection tasks.
Generalizability evaluation on diverse insulator types and environments
To assess the generalization ability of our proposed method, we trained and evaluated the model across datasets that include a broad range of insulator types (porcelain, composite, glass) and varied environmental settings (forest, desert, urban). The basic dataset was collected from UAV inspections in different geographic regions with diverse backgrounds, lighting conditions, and occlusion levels (Table 10).
Generalizability evaluation on diverse insulator.
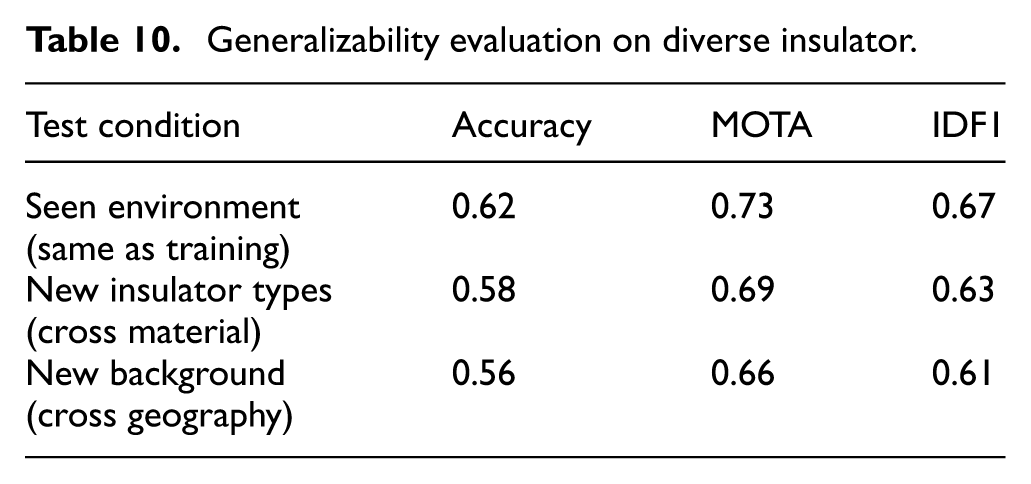
We performed a cross-environment evaluation by training on a subset (e.g. porcelain and glass insulators in forest background) and testing on unseen combinations (such as composite insulators in urban/desert background). These results demonstrate that our method retains robust performance even when applied to unseen combinations of insulator types and environmental settings. The minimal drop in accuracy confirms its generalizability and reliability in real-world deployments across varying power grid environments. This effect was quantitatively evaluated using datasets categorized by environmental background, as shown in Table 10.
Extended comparison with state-of-the-art methods
To further validate the effectiveness of our approach, we compared it with several recent state-of-the-art (SOTA) models for insulator defect detection, using both our dataset and reported metrics from the literature (Table 11).
Extended comparison with state-of-the-art methods.
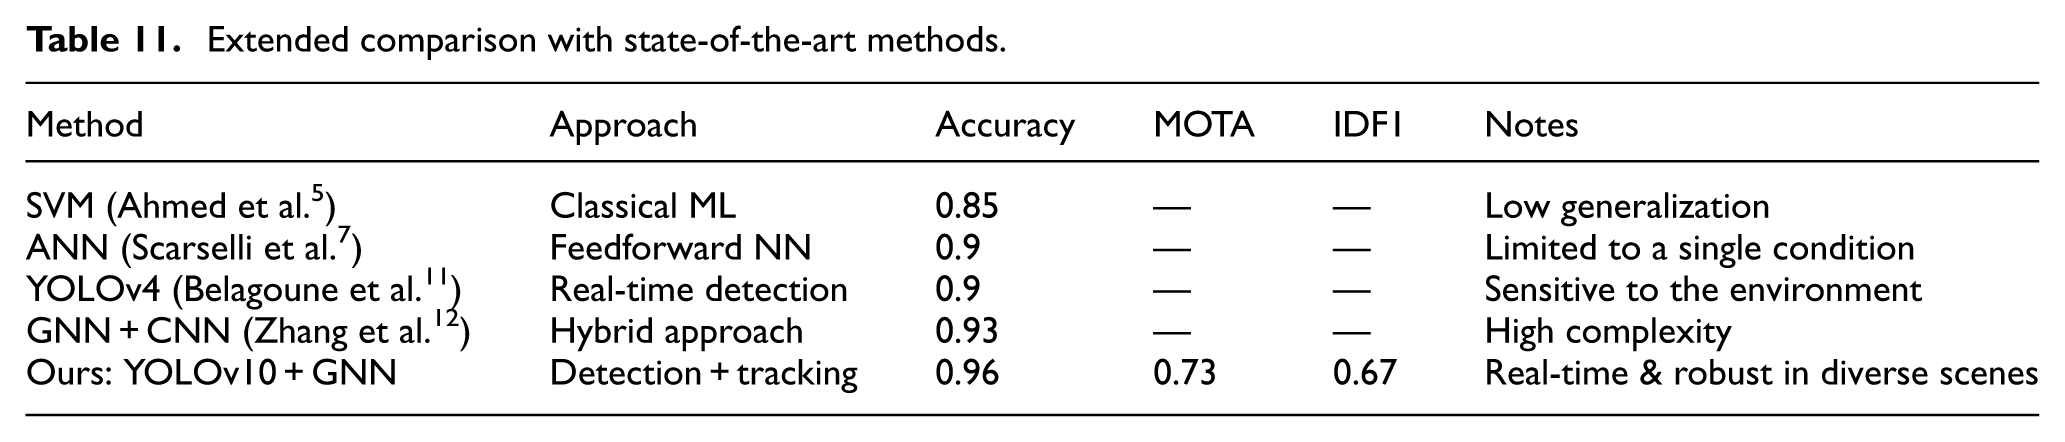
Our proposed method outperforms previous techniques not only in detection accuracy but also in multi-object tracking performance (MOTA, IDF1), thanks to the synergy of YOLOv10s precision and GNN’s relational modeling. Furthermore, the model retains efficiency suitable for UAV-based real-time applications while maintaining generalizability across varied environmental conditions and insulator types. Unlike earlier CNN or ANN-based approaches, our model handles complex backgrounds, occlusion, and varying viewpoints effectively.
Limitations and failure case analysis
Although the proposed method has demonstrated high effectiveness in detecting and tracking faulty insulators in complex environments, several limitations still exist. First, partial occlusion frequently occurs in UAV images when insulators are obscured by power lines, tree branches, or surrounding structures. This leads to missed detections or incorrect classification of insulator types. Second, uneven lighting conditions, especially in images captured during early morning, late afternoon, or under shadow, reduce detection accuracy due to poor contrast and insulators having colors similar to the background. Finally, unfamiliar or rare insulator types that are not represented in the training dataset pose challenges for inference, particularly when their shapes or structures differ significantly from known samples. These are key weaknesses that should be addressed in future work to improve the robustness and generalizability of the system.
Future research directions
To address the aforementioned limitations and enhance the model’s generalizability, several directions can be considered for future work. First, applying data augmentation techniques that simulate challenging conditions, such as low lighting or partial occlusion, can help the model learn to handle more diverse scenarios. Second, collecting and integrating additional real-world data from various geographic regions and insulator types would expand the model’s coverage and improve its adaptability. Third, incorporating multi-head attention mechanisms or self-supervised learning frameworks could enhance the model’s ability to learn from limited or unlabeled data. Lastly, developing anomaly detection mechanisms or prediction confidence evaluation strategies can provide critical support for operators in cases where the model’s output may be uncertain, thereby improving the system’s reliability in real-world deployments.
These results validate our claim that GNN improves both detection and association when trained jointly with the detector. Unlike classical Hungarian matching, which only resolves short-term associations, the GNN contributes contextual relational reasoning that also enhances detection robustness, especially under occlusions and complex background conditions.
Discussion
The experimental findings reveal that the integration of YOLOv10 with a Graph Neural Network (GNN) forms a highly effective framework for insulator defect detection, offering significant improvements in accuracy, robustness, and defect classification capability. These enhanced results can be attributed to the complementary strengths of the two models.
First, YOLOv10 provides a more advanced feature extraction backbone compared to earlier YOLO versions. Its improved multi-scale representation enables reliable detection of small and irregular defect regions, which commonly appear in UAV imagery of insulators. Insulator faults often occupy only a small portion of the image and may be partially occluded by transmission line hardware or surrounded by highly complex natural backgrounds. The multi-scale design and refined detection head of YOLOv10 allow it to capture both coarse structural cues and fine-grained defect patterns, which is a key factor behind the improved detection rates.
Second, the incorporation of GNN enhances defect classification through its ability to model relational dependencies between insulator components. Unlike conventional CNN-based methods that analyze each detected object independently, the GNN processes the spatial and structural relationships among detected regions. Insulator strings possess inherent geometric and topological patterns, and defects typically disrupt these regularities. By representing detected components as nodes and their spatial connections as edges, the GNN can infer whether a detected anomaly is consistent with the physical structure of the insulator. This relational reasoning significantly reduces false detections caused by background objects with similar textures, such as tree branches or metallic parts from nearby equipment, leading to more reliable fault identification.
The diversity of the training dataset also contributes to the strong performance of the YOLOv10–GNN system. The dataset includes various insulator materials, environmental conditions, and lighting scenarios, enabling the combined model to generalize effectively to unseen operational environments. Data augmentation techniques, such as random rotations, blurring, and contrast variations, further help mitigate overfitting and increase robustness under challenging UAV imaging conditions.
However, the system still exhibits certain limitations. The combined YOLOv10–GNN architecture is computationally demanding due to the high-resolution feature maps generated by YOLOv10 and the additional relational reasoning performed by the GNN. This may create difficulties for real-time deployment on embedded UAV hardware. Moreover, environmental challenges such as fog, intense backlighting, and strong occlusions may still degrade feature extraction quality, affecting both detection and relational inference. Another constraint lies in the requirement for extensive labeled datasets. While the current dataset is diverse, the system may still perform suboptimally when encountering rare defect types not represented during training.
Despite these limitations, the results clearly demonstrate that the YOLOv10–GNN integration provides a powerful and scalable approach to insulator defect detection. YOLOv10 ensures high-quality visual feature extraction, while the GNN adds structural understanding essential for distinguishing true faults from background noise. This synergy offers strong potential for real-world deployment in smart power grid monitoring and represents a promising direction for future research on intelligent fault diagnosis systems.
Conclusion
The combined model of YOLOv10 and Graph Neural Networks (GNN) for identifying and classifying faulty insulators offers significant value by addressing key challenges in power system maintenance and management with high accuracy, real-time performance, and enhanced contextual analysis. By leveraging YOLOv10s efficient object detection capabilities, which provide precise information on object location, size, and type, the model achieves improved fault identification and classification. GNN’s ability to analyze spatial and contextual relationships between insulators further boosts accuracy, enabling the system to model how faults propagate across the power network and providing actionable insights for engineers. This combination not only reduces downtime by facilitating real-time fault detection but also automates the traditionally resource-intensive inspection process, requiring minimal human intervention and optimizing resource allocation. Furthermore, the model’s flexibility allows it to be extended to detect different fault types or insulators, making it highly adaptable to diverse industry needs. By integrating geographic and spatial data through GNN, the system offers a comprehensive and detailed analysis of insulator health, empowering managers to make informed maintenance and investment decisions.
The research methodology integrates YOLOv10 and GNN to overcome challenges associated with complex environments, such as forest floors, buildings, or construction sites, using high-resolution aerial images captured by UAVs. YOLOv10, with its compact and computationally efficient architecture, ensures fast and accurate object detection, even in challenging contexts. GNN complements this by constructing a graph where insulators are nodes and their spatial or relational interactions are edges, enabling the model to learn and leverage object relationships for improved detection and classification. By combining the fast processing of YOLOv10 and the contextual learning capabilities of GNN, the model excels in handling complex scenes and ambiguous image features. This fusion method allows for robust detection accuracy, as shown in the experimental results using the COCO dataset. The YOLOv10-GNN model outperformed alternative combinations such as SSD-GNN and PSO-GNN, achieving metrics like 0.62 accuracy, 0.61 MOTP, 0.73 MOTA, and 0.67 IDF1, particularly in complex scenarios like forested or cluttered environments.
Despite its strengths, the model presents challenges, including high computational demands, a reliance on large and diverse training datasets, and potential difficulties in deployment and maintenance due to the integration of multiple complex models. Real-time applications particularly strain computational resources, requiring optimization techniques such as quantization, pruning, and distillation to streamline YOLOv10 and GNN processes. Training data diversity is critical for generalization, as the model may perform poorly when encountering unseen fault types or environmental conditions. Moreover, the interpretability of GNN-based decisions remains limited, posing challenges for understanding the reasoning behind classifications. Environmental factors like lighting and weather also impact detection accuracy, highlighting the need for robust domain adaptation techniques.
To address these limitations, future research should explore efficient GNN architectures (such as GraphSAGE, GAT, or LGNN), leverage advanced hardware platforms like GPUs and TPUs, and implement distributed or federated learning for computational scalability. Data augmentation techniques, such as rotations, flips, and noise injection, alongside transfer learning from pre-trained models, can help mitigate training data challenges. Real-time efficiency can be achieved through the optimization of system components, edge computing, parallel processing, and model serving. Modular system designs and explainable AI (XAI) approaches can simplify deployment, improve interpretability, and enhance user trust. By addressing these challenges, the combined YOLOv10-GNN model has the potential to revolutionize fault detection and classification in power systems, delivering high accuracy, adaptability, and efficiency while advancing the safety and reliability of electrical grids.
Footnotes
Acknowledgements
The authors are extremely grateful to Ton Duc Thang University and Van Lang University, Vietnam, for their support of this research.
Ethical considerations
This study was conducted in accordance with all relevant ethical guidelines and regulations.
Consent to participate
All participants involved in this study provided their voluntary and informed consent before participation.
Consent for publication
The authors confirm that all participants provided explicit consent for their data and information to be published in this article.
Author contributions
Conceptualization, Minh Ly Duc (M.L.D.); Nguyen Thi Phuong Thao (N.T.P.T.); methodology, M.L.D.; N.T.P.T.; software, M.L.D.; validation, M.L.D.; N.T.P.T.; formal analysis, M.L.D.; N.T.P.T.; investigation, M.L.D.; N.T.P.T.; resources, M.L.D.; data curation, M.L.D.; N.T.P.T.; Nguyen Quang Sang (N.Q.S.); writing—original draft preparation, M.L.D.; N.T.P.T.; writing—review and editing, M.L.D.; N.T.P.T.; N.Q.S.; visualization, M.L.D.; Supervision, M.L.D.; N.T.P.T.; N.Q.S.; project administration, M.L.D.; N.T.P.T.; All authors have read and agreed to the published version of the manuscript.
Funding
The authors received no financial support for the research, authorship, and/or publication of this article.
Declaration of conflicting interests
The authors declared no potential conflicts of interest with respect to the research, authorship, and/or publication of this article.
Data availability statement
All data supporting the findings of this study are available from the corresponding author upon reasonable request.