
Abstract
In the cut-tobacco drier production line, precise temperature control of the thin-plate roaster is essential for ensuring product quality and operational safety. However, existing temperature prediction models exhibit limited prediction accuracy, resulting in unstable product quality and potential safety risks. To address this challenge, a temperature prediction model for the thin-plate roaster is proposed, integrating a back-propagation (BP) neural network optimized by the parrot optimization algorithm (PO). Production data from a tobacco factory were collected, focusing on seven key operational parameters: IP4 steam film valve opening, process gas velocity, process gas temperature, process gas pressure, condensate water temperature, dehumidification air volume, and hood pressure. A BP neural network was constructed using these features as input variables. To enhance model performance, the PO algorithm was employed to optimize the initial weights and thresholds of the BP network. The proposed PO-BP model was systematically compared with traditional optimization algorithms, including particle swarm optimization (PSO), grey wolf optimization (GWO), and genetic algorithm (GA). Experimental results demonstrate that the PO-BP model achieves superior generalization ability and prediction accuracy. Specifically, the coefficient of determination (
Keywords
Introduction
With the continuous advancement of artificial intelligence in recent years, manufacturing enterprises have progressively adopted intelligent management and predictive maintenance for production-line machinery and equipment.1,2 As the backbone of the tobacco industry, tobacco machinery is pivotal in ensuring the safe and stable operation of the entire production process. 3
Tobacco machinery encompasses a variety of specialized units, among which dryers, leaf-processing machines, and cutting machines are indispensable for cigarette manufacturing. 4 The dryer, serving as a critical component for tobacco conditioning, has its operating temperature identified as a decisive parameter. Heat is transferred to the tobacco via thermal conduction: steam flowing between thin plates radiates heat, evaporating moisture from the tobacco. The generated vapor is subsequently condensed and expelled through the exhaust port, completing the dehydration cycle, as shown in Figure 1. 5 Any deviation in thin-plate temperature will disturb the final moisture content of the cut tobacco, leading to either excessive or insufficient dryness, thereby compromising flavor quality and lowering the market value of the finished cigarettes. Such deviations can impose substantial losses on the entire production line. Hence, an accurate method for predicting the baking temperature of cut tobacco under varying operational conditions is urgently required to safeguard product quality.6–8
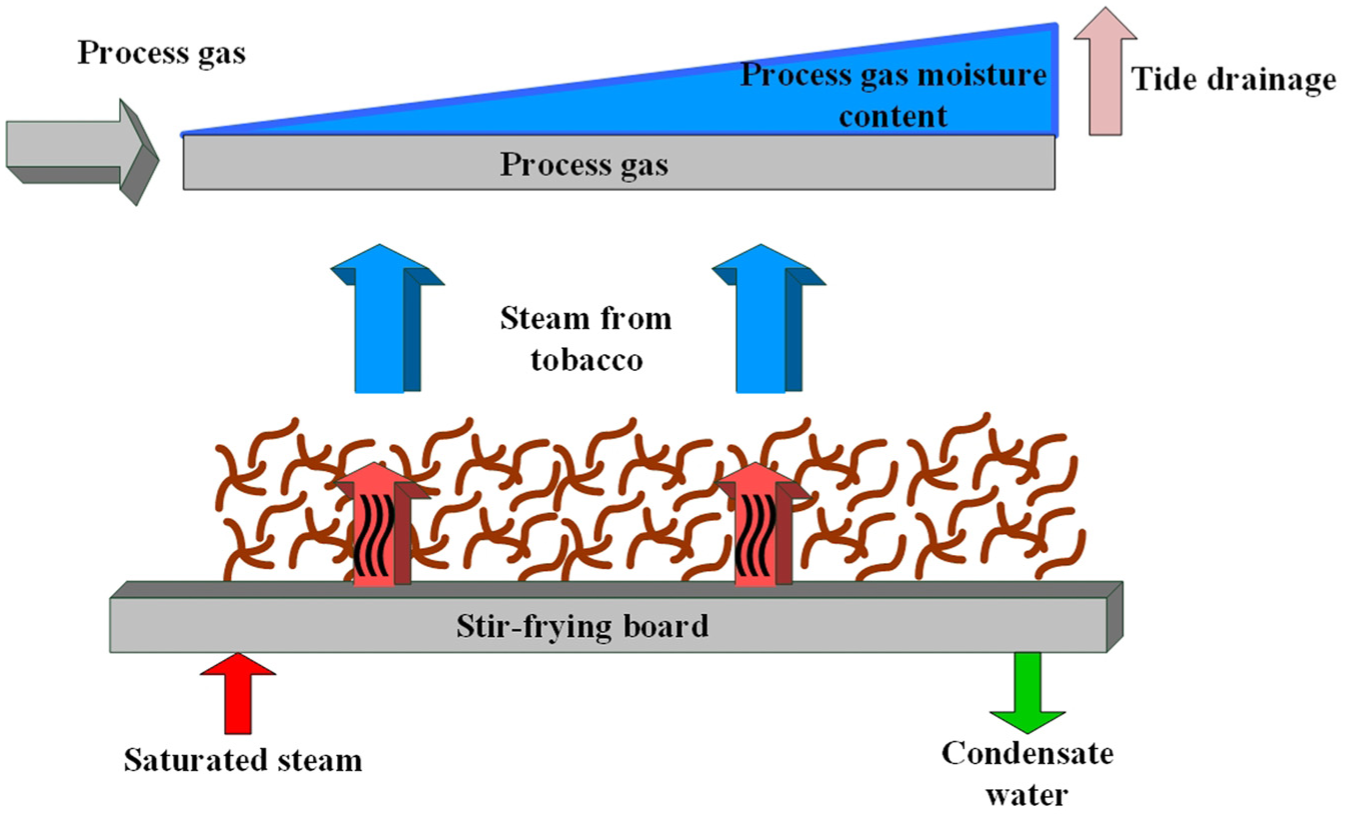
Drying machine processing flow diagram.
State-of-the-art research on condition prediction can be broadly classified into three categories: model-based, experimental, and data-driven approaches. Model-based methods demand an in-depth understanding of drying-machine mechanisms and entail substantial manual effort, whereas experimental methods incur high costs. In contrast, data-driven techniques require minimal domain expertise and are more cost-effective. With the rapid advancement of artificial intelligence, these data-driven approaches have been widely adopted for machinery condition prediction. 9 For health-state prediction of proton-exchange-membrane fuel cells, Hong et al. 10 proposed a hybrid framework that couples a semi-empirical model with machine learning. Stochastic operating scenarios were first generated via the semi-empirical model to produce voltage outputs, which were then employed as health indicators and fed into a neural network for training the final prediction model. Luo et al. 11 introduced an RBF-neural-network-based state-of-charge (SOC) predictor for batteries and further enhanced its accuracy by integrating an ensemble learning algorithm (ELA). Wang et al. 12 developed a short-term multi-state forecasting scheme for wind turbines using Graph Attention Networks (GAT) combined with Graph Learning (GL) modules. By constructing a time-series graph and exploiting GL modules for automated feature extraction, the model effectively predicts multi-variable turbine states. Lan et al. 13 presented a WOA-RF-Adaboost-based hydroturbine condition-prediction model. VMD was first applied to decompose the pressure-pulsation signal; permutation entropy, kurtosis of IMFs, and the mean of the original signal were then calculated to form a feature vector for the RF classifier. Wang et al. 14 introduced an MFE-GRU-TCA hybrid model for lithium-ion battery health-state and remaining-useful-life (RUL) prediction, integrating multi-feature extraction with a temporal-convolution attention mechanism to improve SOH and RUL accuracy. Ding et al. 15 developed a friction-system operating-condition predictor that fuses chaotic characteristics with a BP neural network, aiming to forecast the break-in state of shafts and gears. Zheng et al. 16 proposed an HVCB mechanical-state prediction strategy combining LSTM and SVM. LSTM first predicts breaker signal (BS), contact travel (CT), and coil current (CC); key mechanical feature parameters are then derived from these predictions and diagnosed by an SVM model for final state classification. Pei et al. 17 designed an adaptive data-fusion framework integrating XGBoost and Dempster-Shafer theory to feed a multi-task neural network for real-time baking-quality prediction and parameter optimization in industrial thermal systems. The scheme analyzes multi-source feature variation patterns to identify tobacco-baking states and determine heating times accurately. Chen et al. 18 examined deep-learning-based post-disaster damage-state assessment of nonlinear structures by combining Transformer and Informer networks with a customized classifier. Leveraging attention mechanisms for long-range dependencies, the model delivers accurate long-term predictions for seismic response and structural damage states.
The above studies collectively demonstrate that machine-learning and deep-learning models exhibit strong generalization capability and powerful nonlinear representation, making them particularly suitable for complex data-driven industrial applications. They provide an efficient and practical solution for accurately predicting the thin-plate temperature of drying machines. 19 Martínez-Martínez et al. 20 developed an artificial neural network (ANN) approach to predict temperature and relative humidity during tobacco drying. A wireless sensor network (WSN) deployed on an industrial dryer continuously acquired spatial temperature–humidity profiles, which were then fed into a trained ANN to forecast values at different locations and future time steps. Wu et al. 21 fused tobacco images with environmental curing data to construct a three-layer back-propagation (BP) neural network capable of high-accuracy temperature and humidity prediction. Wu 22 employed a genetic algorithm (GA) to optimize support vector machines (SVM) for curing-state recognition, achieving an accuracy of 96.5%. Building on this, Wu and Yang 23 proposed a multi-sensor data-fusion framework that combines least-squares SVM with an adaptive neuro-fuzzy inference system (ANFIS). Odor, image, and moisture features were fused as inputs to enhance prediction reliability further. Leveraging a “multi-scale convolution–attention–lightweight physical regularisation” architecture, Mu et al. 24 realized high-precision, 2-h-ahead moisture-content forecasting on real tobacco-curing big data, delivering a practical soft-sensing solution for smart curing. Guo et al. 25 introduced a “COMSOL–Neural Network–Poisson Fusion” framework that synergizes mechanism-driven (COMSOL) and data-driven (neural network) modelling. COMSOL provides spatial gradient fields, neural networks refine numerical accuracy, and a Poisson fusion algorithm removes boundary discontinuities, enabling real-time, high-resolution temperature–humidity field prediction across the curing chamber with minimal sensor deployment. Wang and Qin 26 designed a lightweight feature set combining RGB-HSV color and mass characteristics for densely packed tobacco leaves. A two-layer stacking ensemble (SPFM) that couples LSTM and XGBoost achieved 97.4% accuracy in real-time curing-state prediction and has been successfully embedded in intelligent curing platforms. Zheng et al. 27 applied a Quantum Genetic Algorithm (QGA) to tune XGBoost hyperparameters, yielding a QGA-XGB moisture-deficit predictor automatically. The system provides real-time humidification compensation, reducing the average inlet moisture deviation of shredded tobacco to 0.079% and improving the process capability index (CPK) to 2.02, significantly outperforming manual and empirical controls. Wen et al. tackled pronounced moisture variability and strong variable coupling at the outlet of cylinder-and-tube-plate shredders by installing smart sensors for ambient temperature, humidity, and steam quality. 28 A “Random-Forest Incremental-Learning Prediction + Multi-level Collaborative Feedback” control strategy stabilized moisture: CPK increased by 45%, standard deviation decreased by 52%, and non-steady-state duration was shortened by 15%.
Although numerous temperature-prediction strategies have been proposed for tobacco-shred drying, prevailing models still exhibit shortcomings in generalization, architectural complexity, computational overhead, and real-time responsiveness. To overcome these limitations, this paper introduces a PO-BP neural-network model specifically devised for thin-plate temperature prediction in tobacco dryers. The Parrot Optimization algorithm is employed to search for globally optimal weights and thresholds, thereby establishing the PO-BP predictor. This approach strengthens parameter identification and global search during model construction, mitigates convergence to local minima, and markedly enhances prediction accuracy. Comparative experiments conducted on real production data from a cigarette factory demonstrate that the PO-BP model not only achieves higher accuracy but also captures the thin-plate temperature dynamics more effectively than alternative BP variants.
Neural network model construction
The basic idea of BP algorithm
The back-propagation (BP) algorithm—also termed the error back-propagation algorithm—comprises an input layer, one or more hidden layers, and an output layer. It is widely applied to classification, regression, pattern recognition, and data mining tasks.29–34 The architecture of a BP neural network is illustrated in Figure 2. The procedure begins by forwarding the input signal through the hidden layers to the output layer. The predicted values are then compared with the target values; if discrepancies exist, the error gradient is propagated backward from the output layer to the input layer. Gradient descent is employed to update the network weights iteratively. Nevertheless, standard BP networks are susceptible to local minima because of their gradient-based nature. To mitigate this limitation, this paper adopts a Parrot Optimization (PO) enhanced BP neural network.
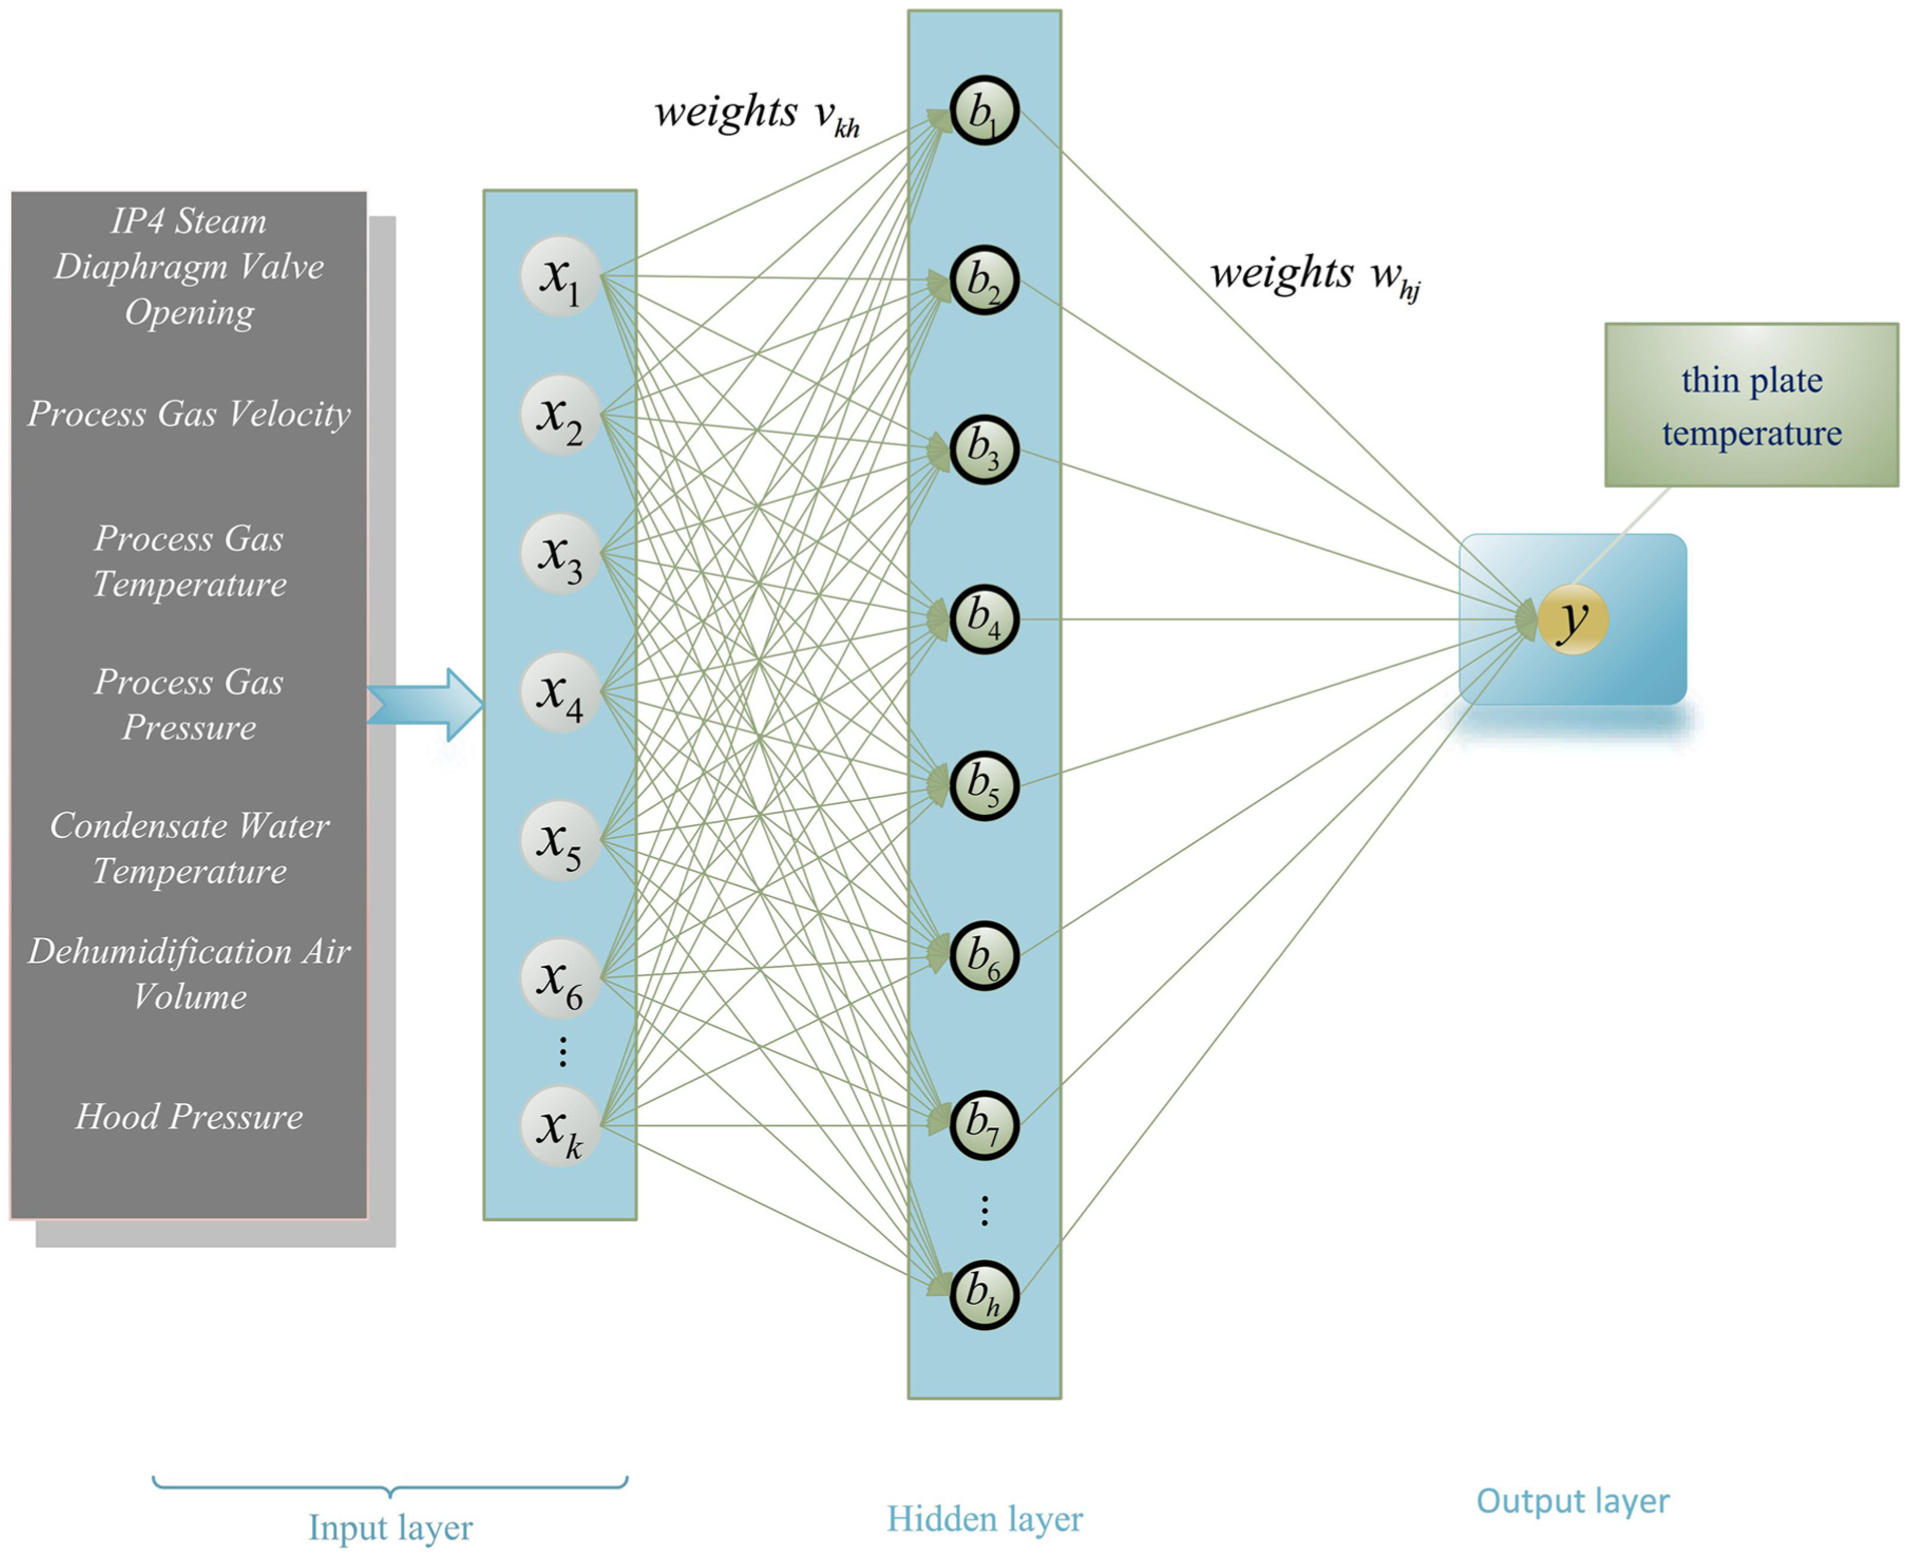
BP neural network architecture illustration.
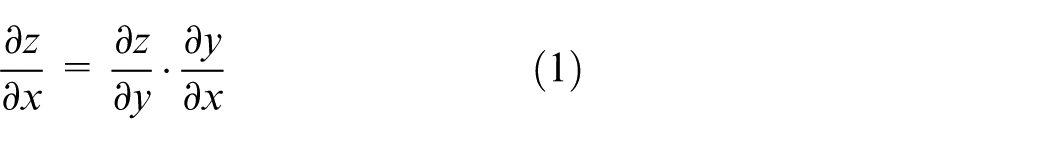
In the BP algorithm, the core mathematical tool is the chain rule of calculus. If
For a given training set
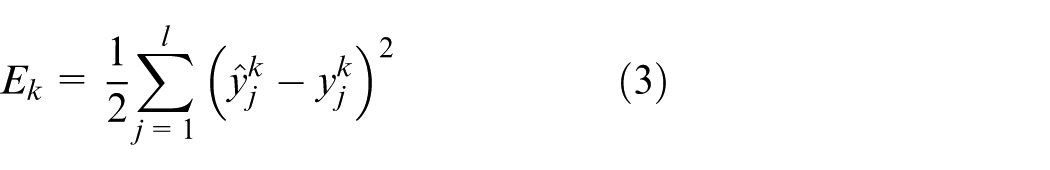
Step 1: Define the loss function
For the sample
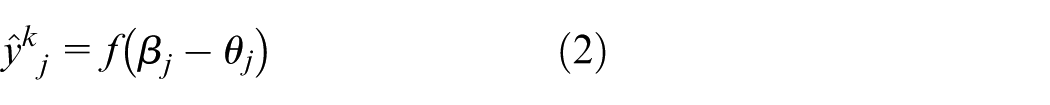
In equation (2),
The mean square error of the neural network on the samples is given by 35 :
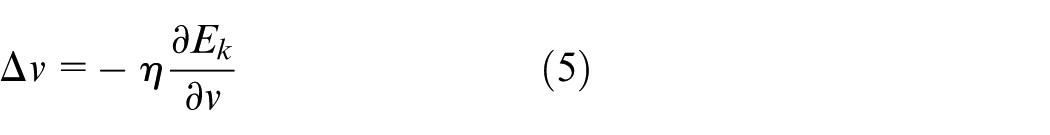
Step 2: Define the parameter adjustment strategy
The BP neural network algorithm is based on the gradient descent strategy, adjusting the parameters in the direction of the negative gradient of the target. This can be expressed mathematically as 36 :

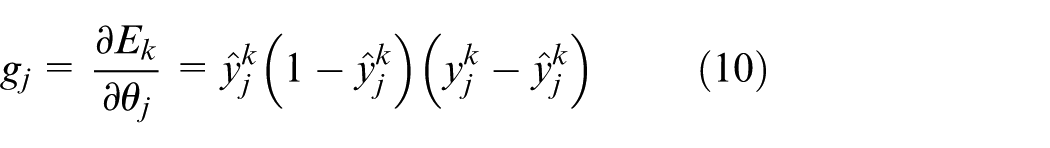
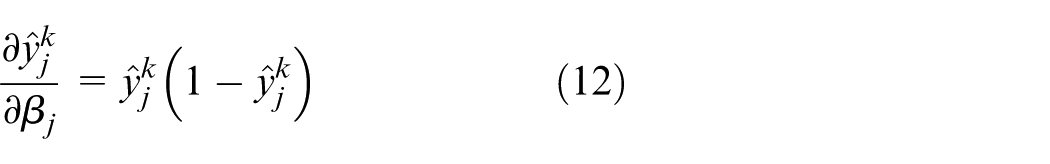
Step 3: Calculate the gradient of the output layer threshold
Since
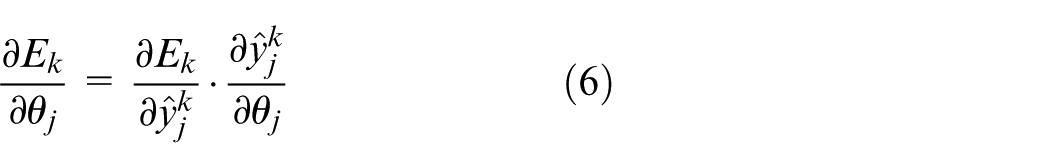
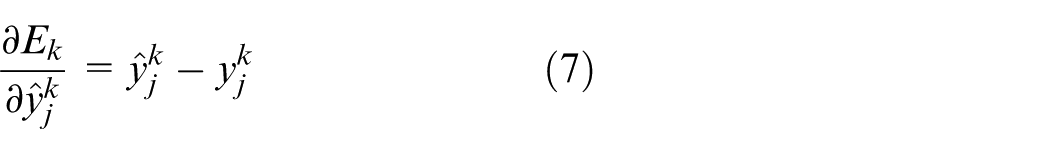
This can be obtained from equation (3):
Choose the sigmoid function as the activation function, and according to equation (2), we can obtain:
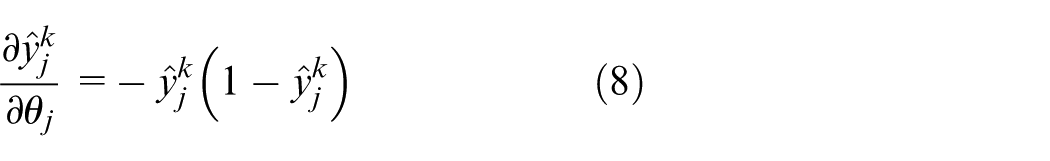
So there is:
Denote it as
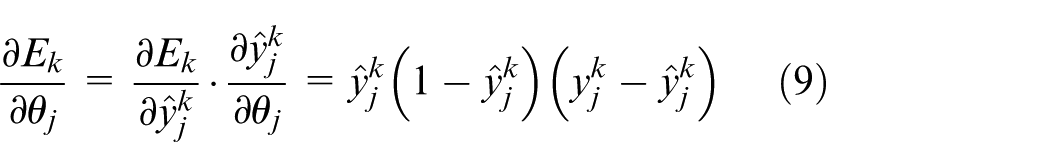
Step 4: Calculate the gradient of the connection weight
Since
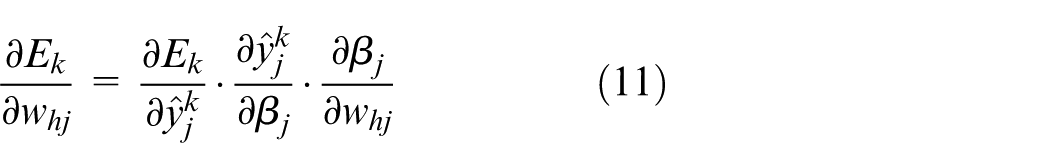
According to Step 3:
From the definition of
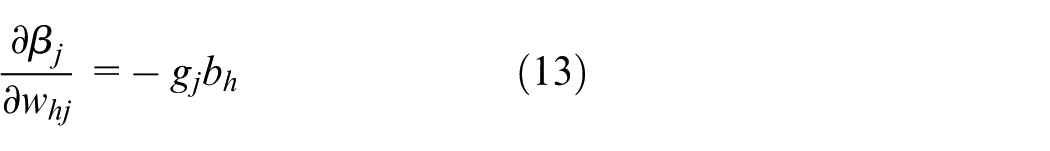
where
By combining with equation (10), we can express the gradient of the connection weights from the hidden layer to the output layer as:
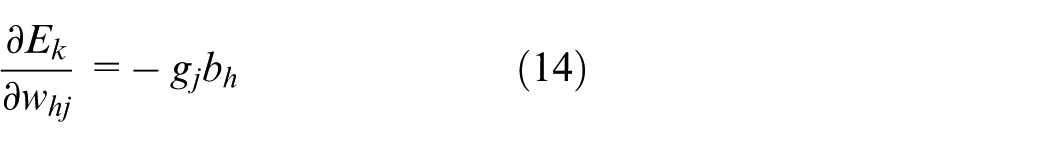
Step 5: Calculate the gradient of the hidden layer threshold
Since
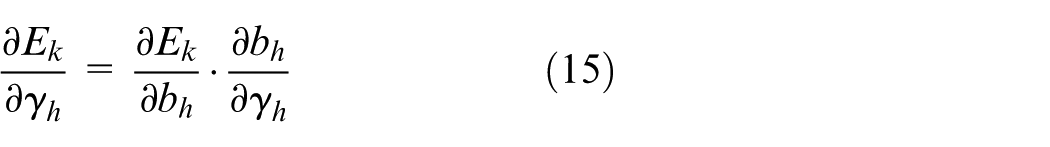
Also because.
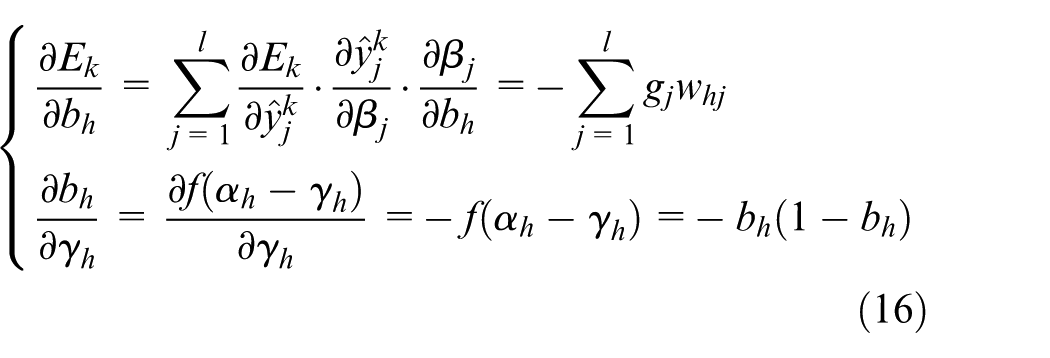
So there is:
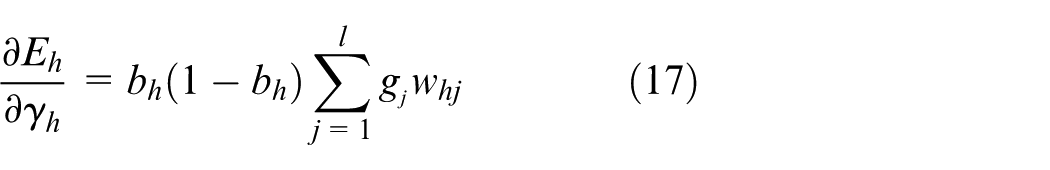
From equation (17), we can conclude that the gradient of the hidden layer threshold depends on the output of the hidden layer neurons, the gradient of the output layer threshold, and the connection weights between the hidden layer and the output layer. In a multilayer feedforward network, the gradient of the hidden layer threshold is expressed as the threshold gradient of layer
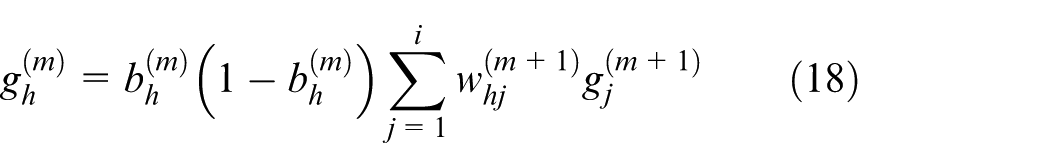
It can be seen that in the threshold adjustment process, the gradient of the current layer’s threshold depends on the gradient of the next layer’s threshold.
Similarly, the gradient of the connection weights from the hidden layer to the output layer
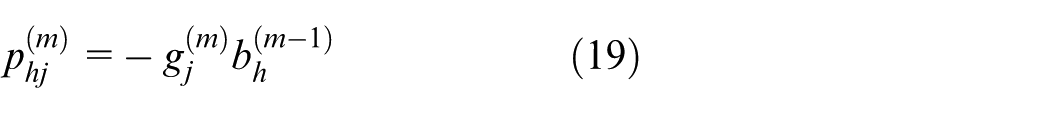
In other words, the gradient of the connection weights for the current layer depends on the gradient of the current layer neuron thresholds and the output of the previous layer neurons. As long as the gradient of the previous layer neuron thresholds is known, we can calculate the gradient of the current layer neuron thresholds and the connection weights. Based on equation (10), we can then determine the gradient of the output layer neuron thresholds, which allows us to calculate the gradients of the neuron thresholds and connection weights for the entire network, thus achieving the goal of training the network.
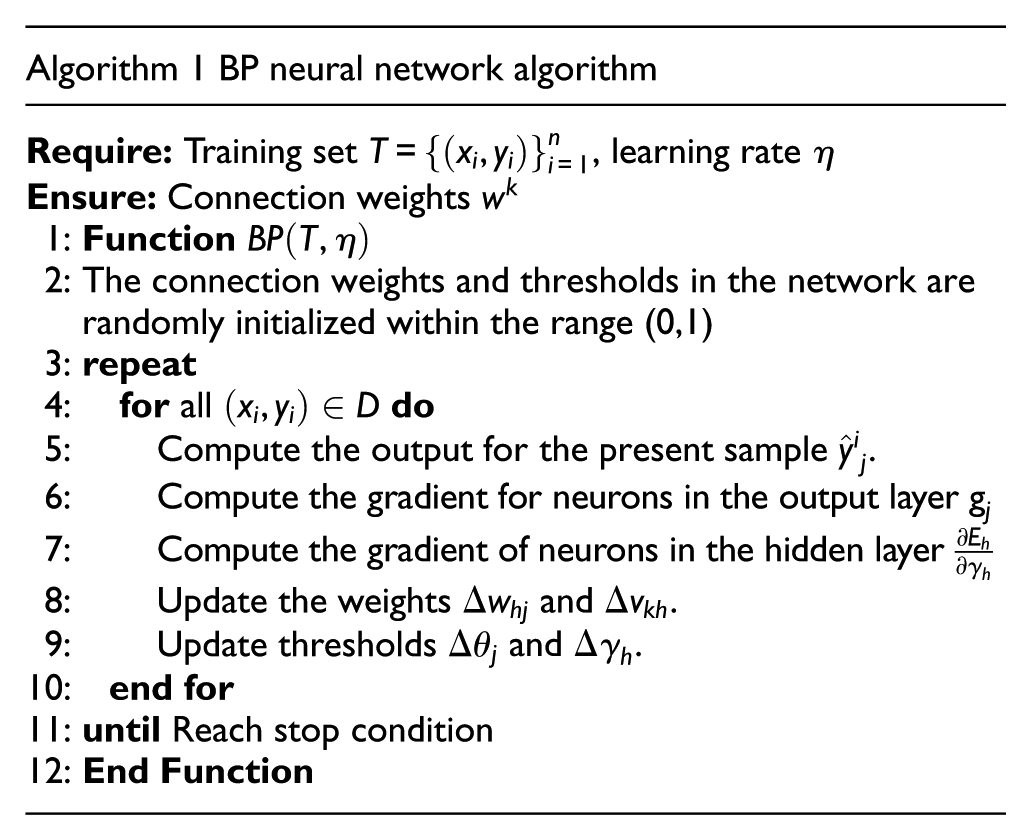
The algorithm 1 pseudo-code is as follows:
PO-BP neural network
Basic idea of the parrot algorithm
In 2024, Lian et al. introduced the PO algorithm—an effective meta-heuristic inspired by the interaction between parrots and their owners. 35 The method begins by randomly generating an initial population of candidate solutions. In each iteration, PO navigates the search space by stochastically exhibiting one of several parrot-inspired behaviors, guiding the population toward the vicinity of the global optimum. Throughout the optimization, every individual is continuously influenced by the current best solution, dynamically adjusting its position until the predefined termination criteria are satisfied. Compared with traditional meta-heuristics such as Genetic Algorithms (GA) and Particle Swarm Optimization (PSO), PO’s probabilistic behavioral selection markedly enhances population diversity. This mechanism enables the PO-BP model to escape local minima while consistently maintaining solution quality.
The CEC2005 test functions are a standard function set used to evaluate and compare the performance of optimization algorithms. To assess the PO algorithm, four representative functions were selected: unimodal F1, multimodal F6, hybrid F12, and composite F13. As illustrated in Figure 3, PO consistently outperforms the compared algorithms, exhibiting both faster convergence and lower fitness values across all four functions, thereby evidencing its superior optimization capability.
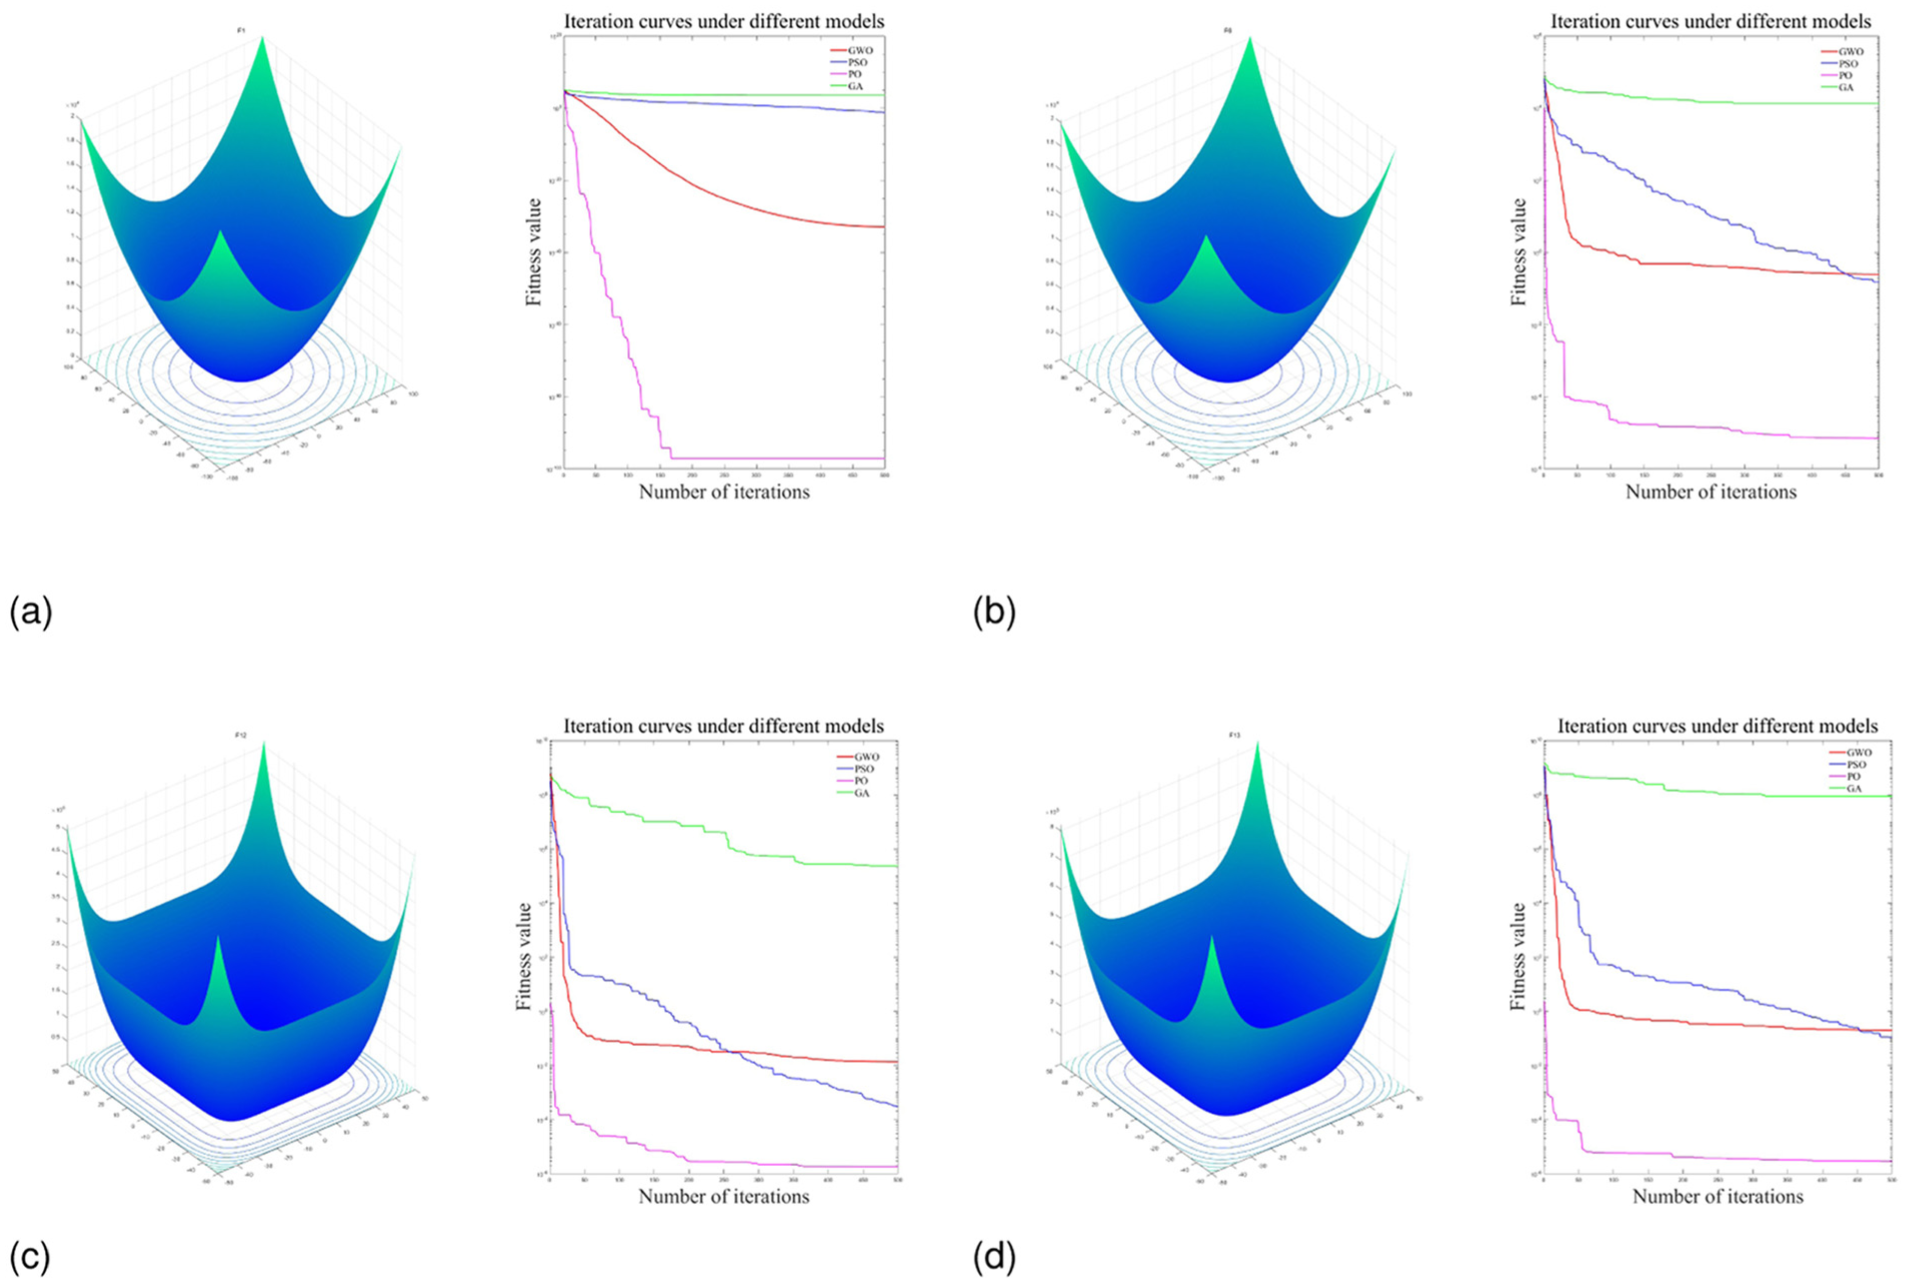
Optimization performance comparison of various algorithms on different functions: (a) unimodal function F1, (b) multi-modal function F6, (c) mixed function F12, and (d) combination function F13.
Parrot Optimization algorithm implementation steps:
Initialize the population: In the initialization phase, a swarm of parrots is generated, with each agent (parrot) encoding a potential solution within the search space;
Defining the fitness function: The fitness function is used to evaluate the solution of each parrot in the Parrot Optimization algorithm;
Simulating foraging behavior: Parrots move within the search space, seeking better solutions;
Simulating staying behavior: In certain situations, a parrot may choose to stay in its current position, conducting a more detailed search in the current area;
Simulating communication behavior: Information exchange between individual parrots to help find the global optimal solution;
Simulating fearful behavior toward strangers: When a parrot encounters a stranger, it exhibits fear and flees, which can be seen as an escape strategy to help the algorithm break out of local optimal solutions;
Update positions: Based on the behaviors described earlier, update the position of each parrot;
Iteration and Convergence: Keep executing the steps above until you either reach the set number of iterations or fulfill the convergence criteria;
Outputting the optimal solution: The algorithm will yield the best solution found or an approximate optimal solution.
Parrot algorithm mathematical model
Population initialization
The initialization formula for PO is:

In equation (20),
Foraging behavior
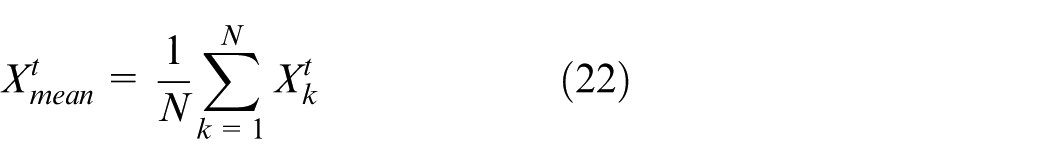
In foraging behavior, parrots determine the location of food by observing either the food’s position or the owner’s position, and then fly to their respective locations. 38 The position update formula is as follows:
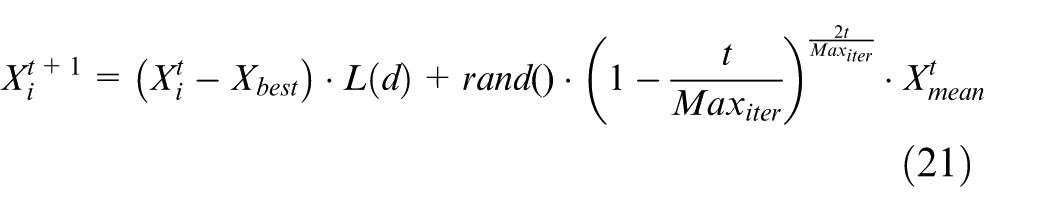
In equation (21),
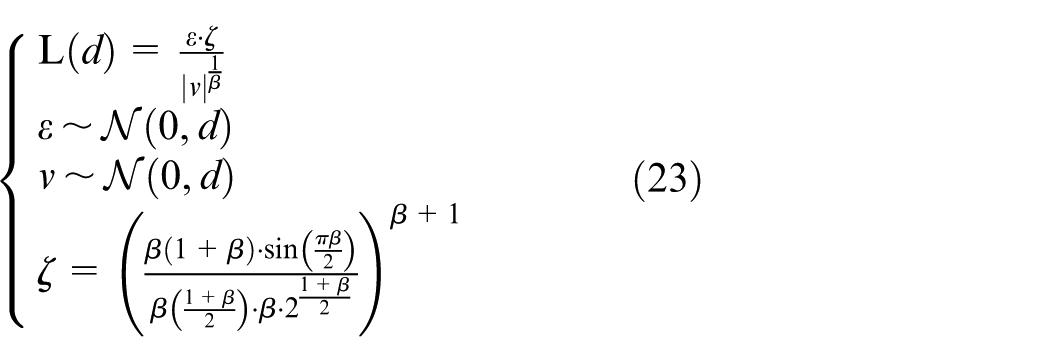
The expression for
Based on the rules in equation (23), the distribution can be obtained.
Stationary behavior
The stationary behavior of a parrot can be represented by the equation:

In equation (24),
IV Communication behavior
In PO, the way parrots communicate includes both flying toward and avoiding the population for interaction. Under the premise of a homogeneous probability distribution between the two behavioral modes, the population’s centroid is represented by its mean position. This process can be mathematically expressed as:
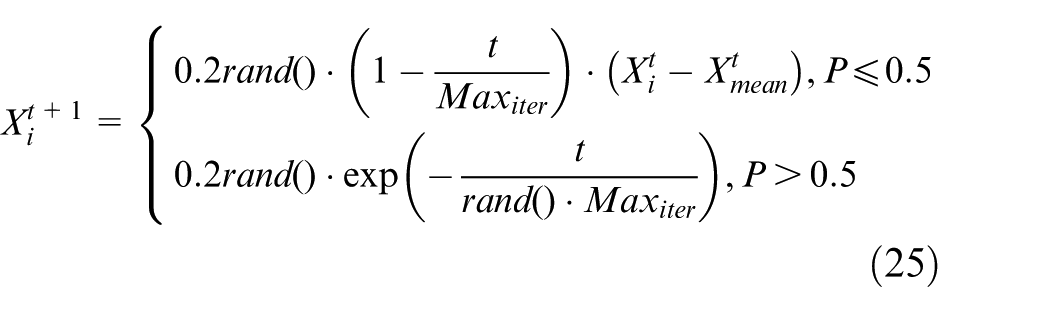
In equation (25),
Fear behavior toward strangers
The instinct of a parrot to show fear and move away from strangers can be represented by the equation (26):
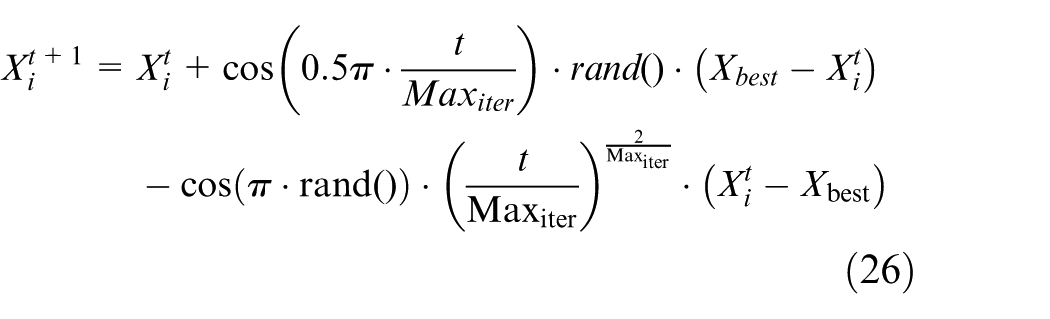
Here,
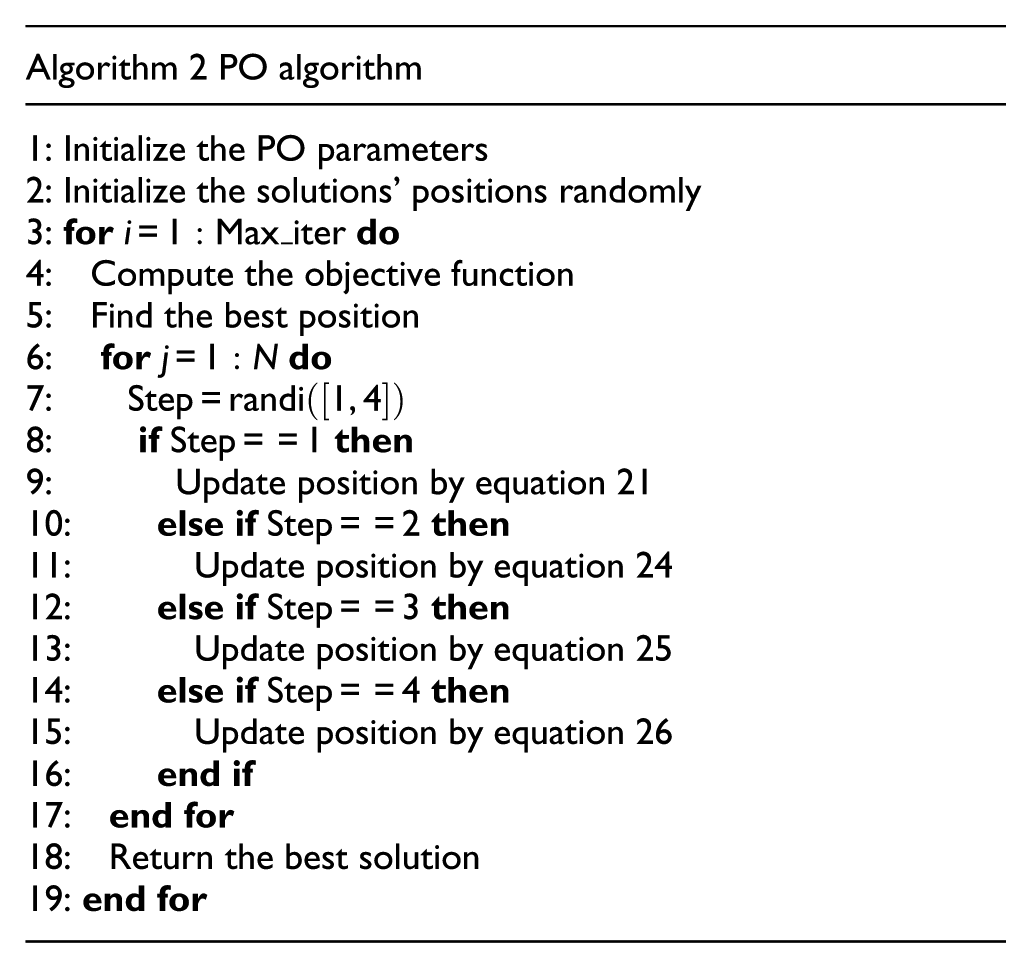
The algorithm 2 pseudo-code is as follows:
PO-BP prediction model
Inaccurate predictions may arise from randomly setting connection weights when building a BP neural network. Furthermore, training with gradient descent is hindered by its slow pace and the difficulty of avoiding local minima, making global optimization in neural network training difficult. Therefore, the parrot optimization algorithm optimizes biases of the BP neural network and the weights by treating them as parrot positions, aiming to find the best solution. In the initialization phase, the PO algorithm randomly generates a set of candidate solutions that cover the entire search space. This randomness enables the algorithm to start searching from multiple different starting points, increasing the chances of finding the global optimum. Moreover, the
The algorithm flowchart for the PO-BP network is illustrated in Figure 4.
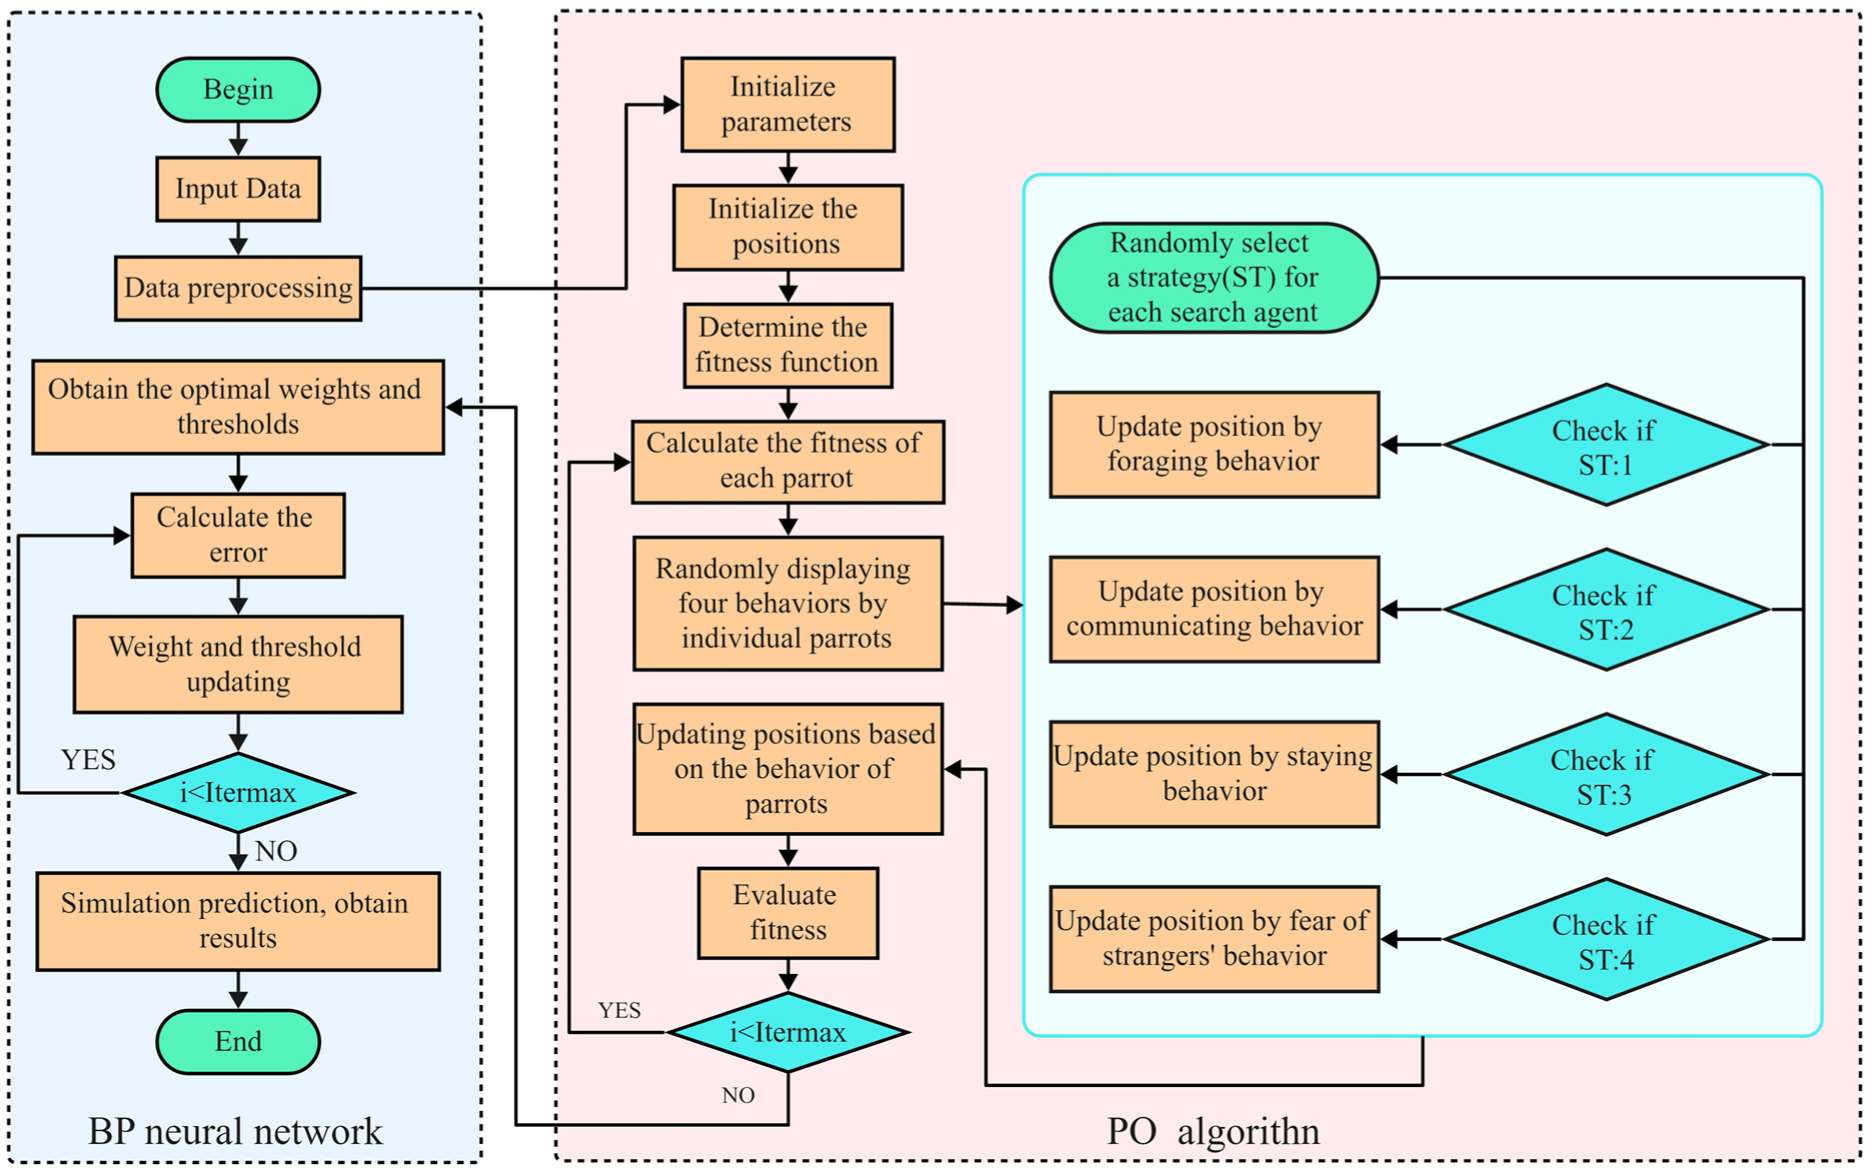
Algorithm flowchart of the PO-BP network.
Experiments and results
Experimental environment
To confirm the method’s feasibility in this article, the model will be validated through simulations in MATLAB on a 64-bit Windows OS. The Matlab version used is 2023B, and the system is configured with an Intel Core i7-9750H 2.60GHz processor, 16.0GB of RAM, and an NVIDIA GeForce GTX 1660Ti GPU.
Data sources
The experimental dataset was derived from the thin-plate dryer of a tobacco factory, aiming to construct a data-driven predictive model for real-time monitoring of plate temperature dynamics during the drying process. To ensure the validity of model training and the reliability of predictive results, this study implemented a systematic data cleaning process on the original industrial data. The following procedures were executed to address potential missing values and anomalies originating from sensor malfunctions or recording processes:
Missing Value Handling: Discard all sample records containing NaN or Inf values.
Anomaly Removal: Use the
Normalization Pre-Check: Before applying Min-Max scaling, verify the extreme value range to prevent distortion caused by outliers.
After data cleaning, the dataset shrank from 6000 to 5642 samples, guaranteeing both data quality and model stability. From this cleaned set, 2000 samples were selected for the experiment and split into training and test sets in an 8:2 ratio. The inputs include seven parameters: IP4 steam film valve opening, process gas velocity, process gas temperature, process gas pressure, condensate water temperature, dehumidification air volume, and hood pressure. The output data is the thin plate temperature. The specific parameters are listed in Table 1.
Partial sample data.
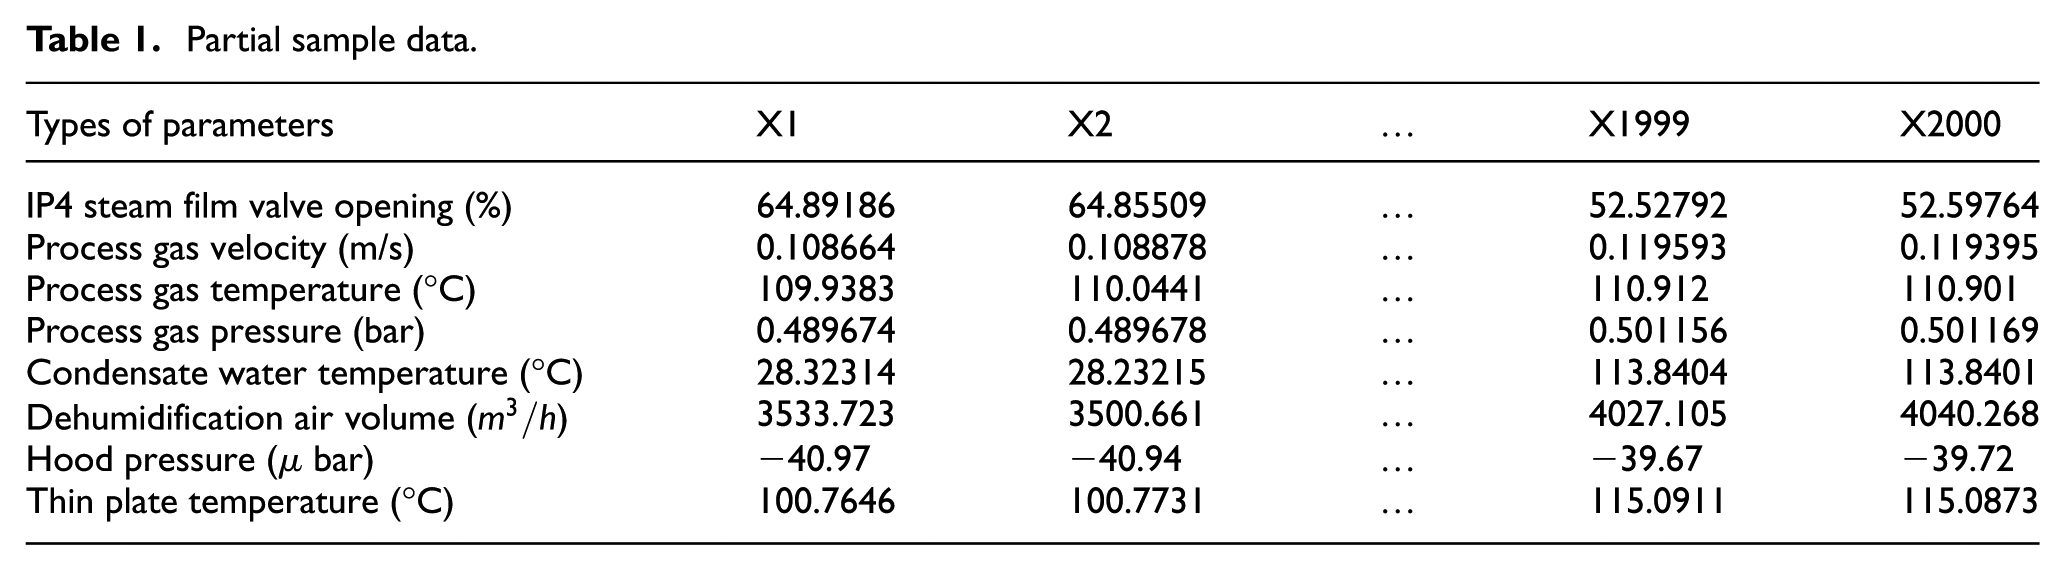
From Table 1, the tobacco-shred drying process shows significant dimensional differences among variables, which could result in a slower convergence speed for the prediction model. Therefore, normalization of parameters is needed to reduce the impact of data scale, features, and distribution differences on the model. Max-min normalization is applied to normalize the input parameters.
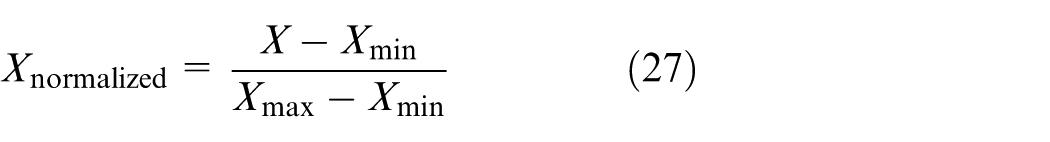
In equation (27),
Parameter settings
The training iterations for the PO-BP prediction model were set to 1000, with a learning rate of 0.01, a training target minimum error of 1e-6, and a display frequency of once every 25 training iterations. The momentum factor was set to 0.01. The hidden layer’s node count was derived from the empirical formula proposed by Jadid and Fairbairn. 42

In equation (28),
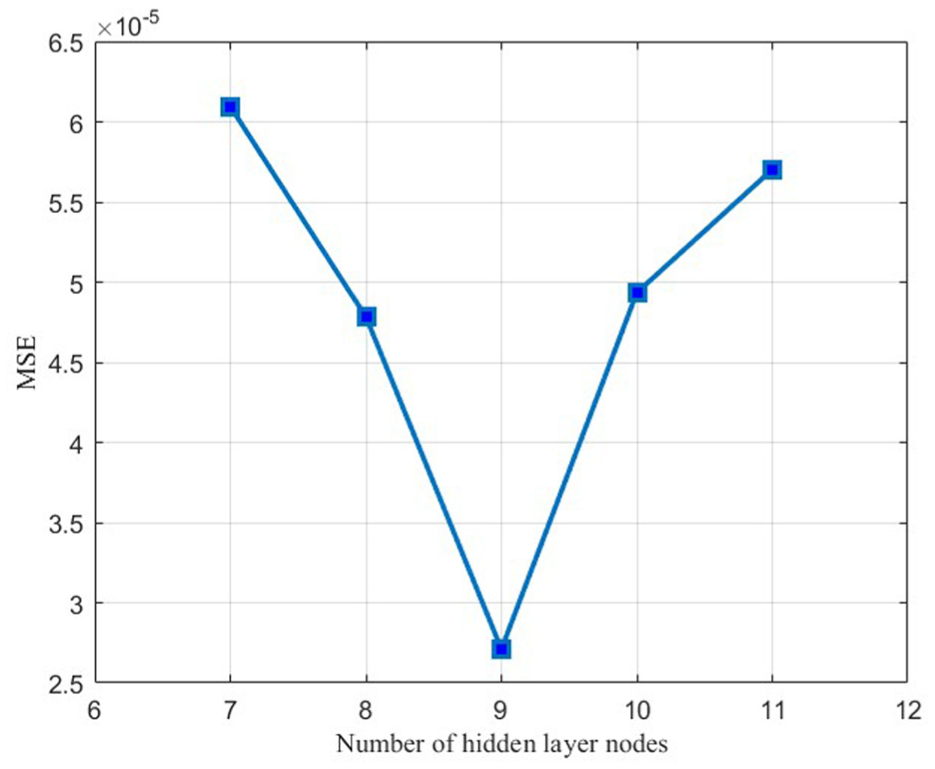
Comparison of training set MSE under different numbers of hidden layer nodes.
Predictive performance evaluation metrics
The paper employed
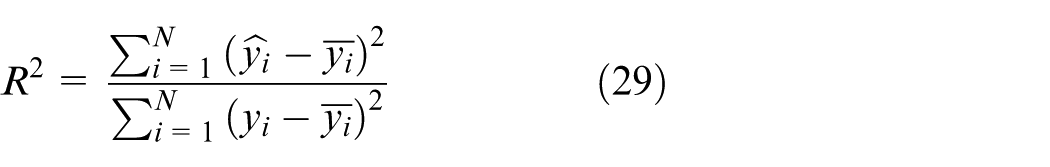
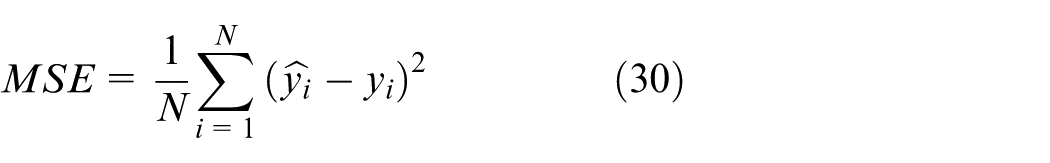
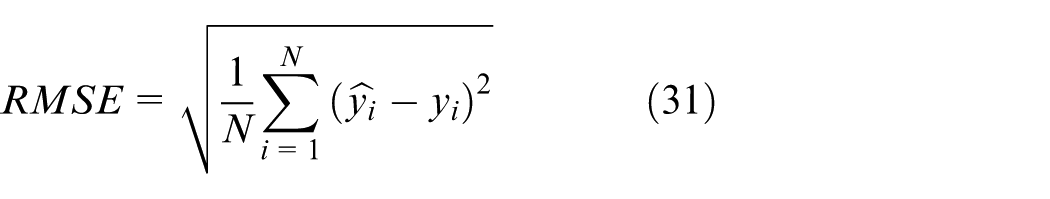
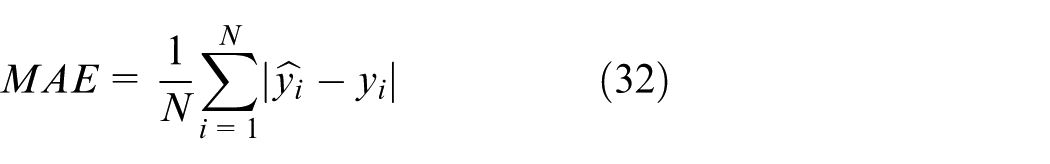
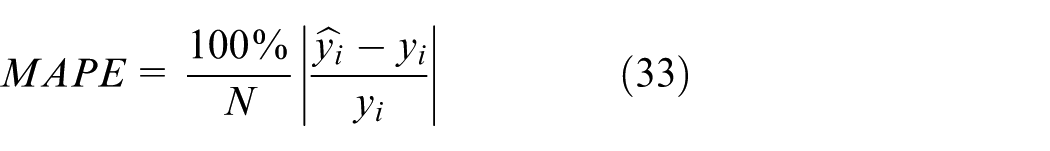
Equations (29) to Equations (33) are the calculation formulas for various evaluation metrics, where N signifies the overall number of samples,
Results and analysis
To verify the differences between the PO-BP network established this time and several other BP neural networks, after training them with the training set, they are each used for predicting plate temperature. Figure 6 illustrates the comparison between the predicted values and the expected values for each network.
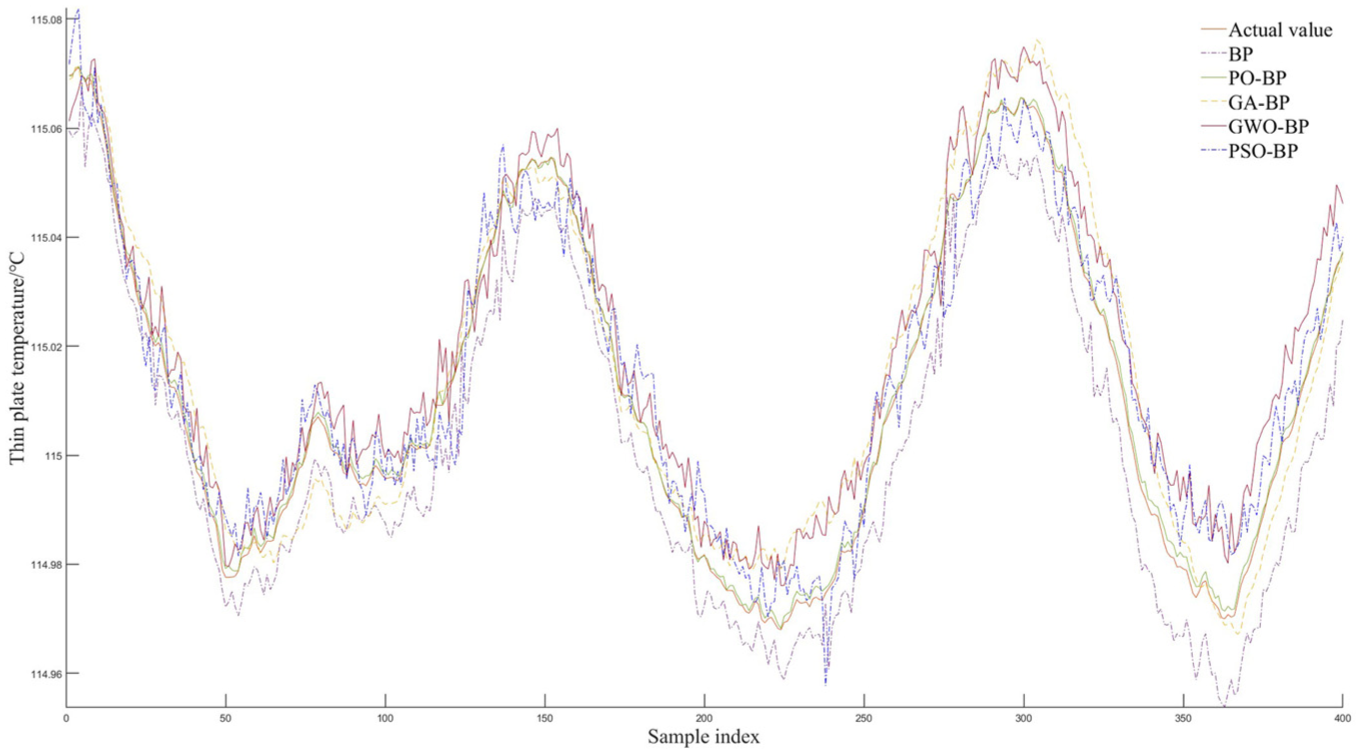
Comparison of prediction results.
From the predictions of several BP neural networks shown in Figure 6, the traditional BP neural network prediction model shows significant deviations from the actual values and fails to adequately fit the trend of actual changes, resulting in poor prediction accuracy (purple line). After optimization by several traditional metaheuristic optimization algorithms(GWO, PSO, and GA), the model’s accuracy improved to some extent, but as the number of samples increased, the prediction results gradually deviated more from the actual values in the latter half of the data (yellow, red, and blue lines). Due to its unique mechanism, the PO algorithm demonstrates advantages in optimization algorithms. The established PO-BP model can better fit the trend of actual values compared to other models, effectively addressing the issue of BP neural networks getting trapped in local optima and significantly improving the prediction model’s accuracy.
The fundamental reason why the PO-BP model outperforms the traditional BP neural network lies in the fact that the Parrot Optimization algorithm simultaneously addresses two major inherent weaknesses of BP—proneness to local minima and slow/oscillatory convergence—from both the ”search mechanism” and ”weight initialization” perspectives. In traditional BP neural networks, if the randomly initialized starting point falls within an “error valley” or on a “flat plateau,” gradient descent is highly prone to becoming stuck or sliding ineffectively. In contrast, the introduced PO algorithm effectively flattens all network weights and thresholds into a D-dimensional vector, which serves as a “parrot individual” in the PO process. The PO algorithm first performs several dozen population-wide large jumps (
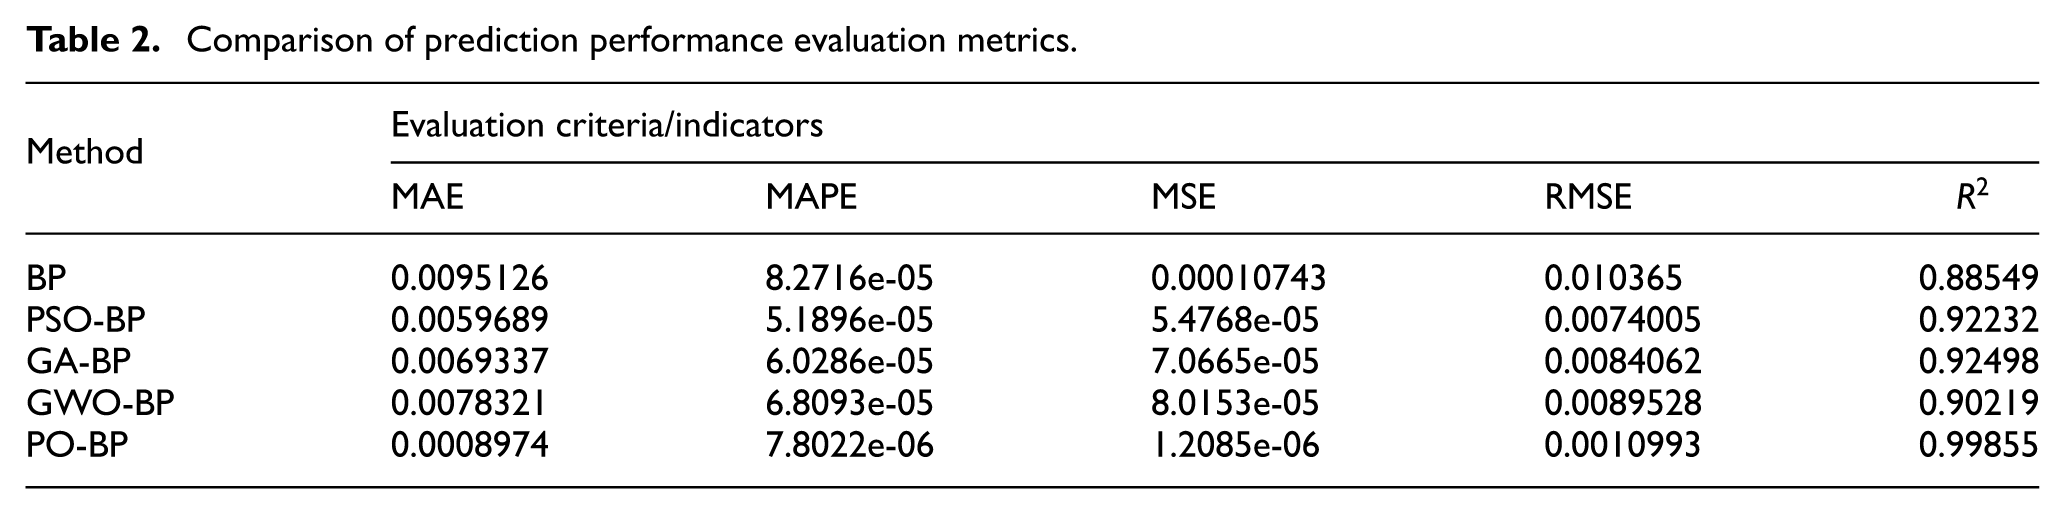
Refer to equation (10) to equation (14) to calculate the evaluation metrics of the neural network, with the results outlined in Table 2. The correlation coefficients
Comparison of prediction performance evaluation metrics.
To visually illustrate the differences between the standard BP and other BP models, the above indicators are plotted for comparison.
When comparing different models, a model with a high
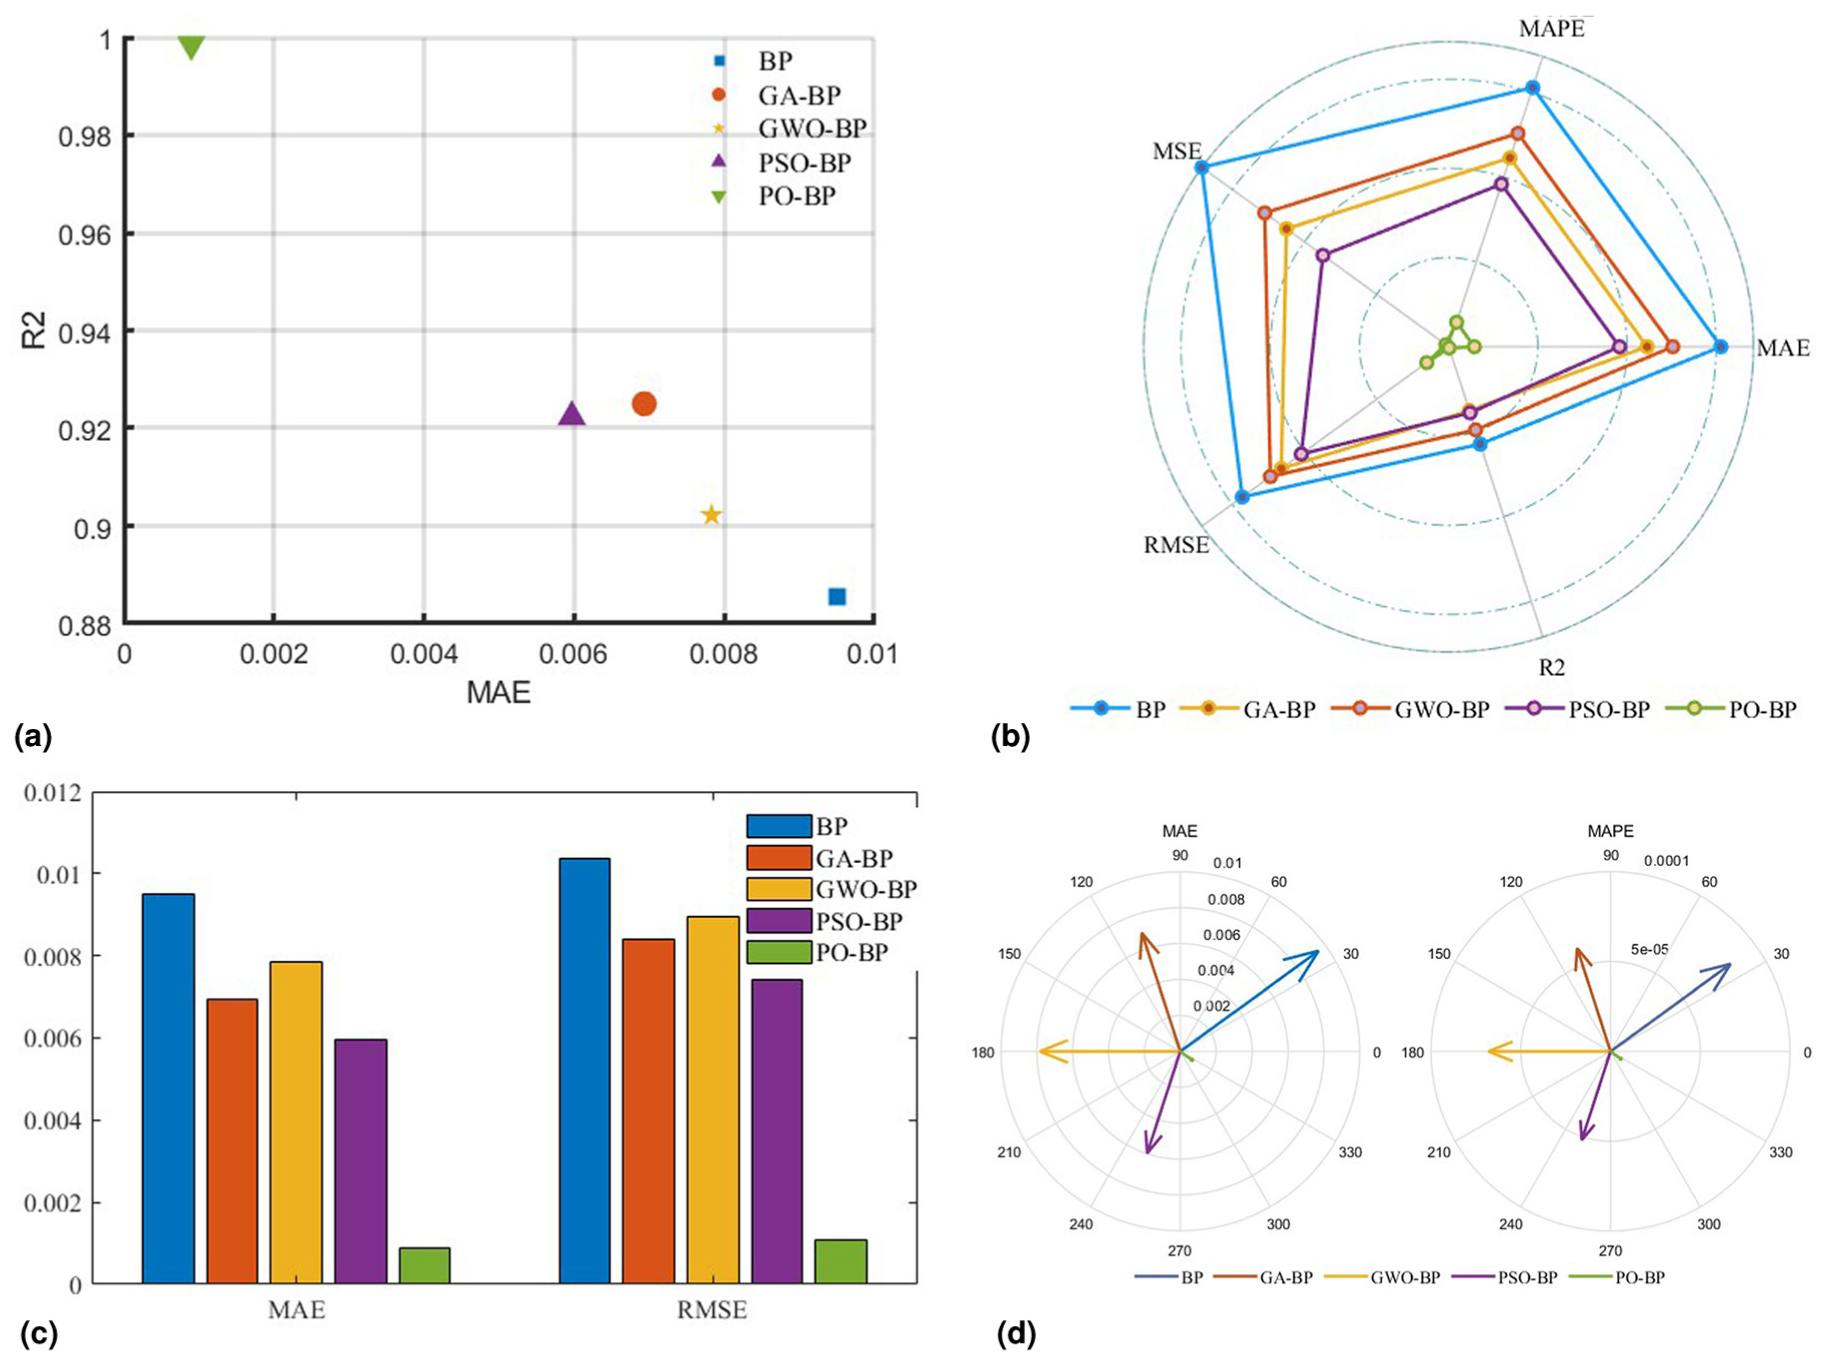
Performance comparison of different algorithms: (a)
The five performance indicators in Table 2 were normalized to a single dimension, and the
Selecting MAE and RMSE indicators with relatively similar dimensions, a bar chart was created for comparison, as shown in Figure 7(c). The height differences in the bar chart more intuitively reflect the differences between the PO-BP prediction model and the other four models in the selected indicators.
A polar plot was created based on the values of MAE and MAPE, and converted into a vector in Cartesian coordinates to generate the polar coordinate graph, as shown in Figure 7(d).
Through the above visualization, it is evident that the prediction model optimized by the optimization algorithms significantly outperforms the traditional BP model. Among the various optimization algorithms, the PO-BP prediction model achieves the best prediction accuracy, with results far superior to the other models.
Generalization experiment
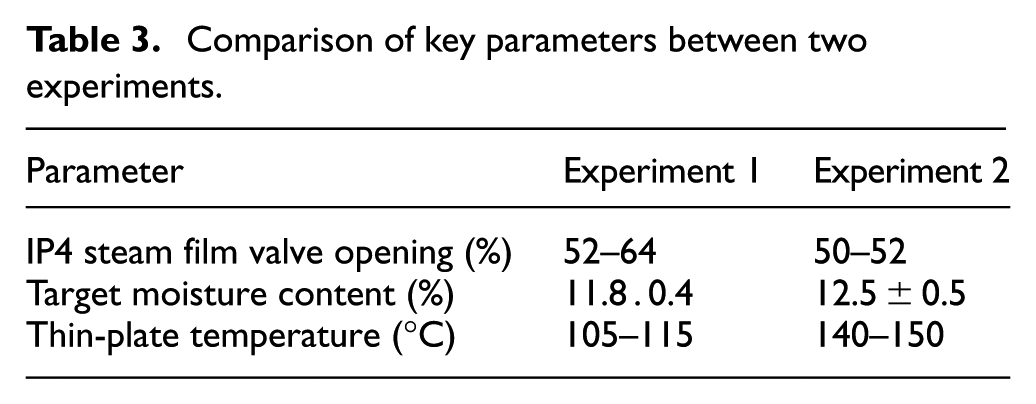
To validate the generalization capability of the proposed PO-BP model across diverse tobacco production scenarios, this study augmented the initial single-product experiments with a second product batch for comparative analysis. Both datasets were collected from the identical thin-plate heat exchange drying line while maintaining consistent process parameter frameworks, though differences in raw material blends, target moisture contents, and drying temperature settings authentically replicate operational variations during product changeovers. Key process differences are detailed in Table 3.
Comparison of key parameters between two experiments.
Initially, 7500 records were collected. After applying the data-cleaning procedure described in Section “Data Sources” to remove missing values and outliers, 7186 valid samples remained. Consistent with the previous experiment, 2000 samples were randomly selected for this study and split into training and test sets at an 8:2 ratio. The network architecture continued to use the 7-9-1 topology determined in Section “Experimental Environment”, and all hyperparameters were kept identical. The evaluation metrics—
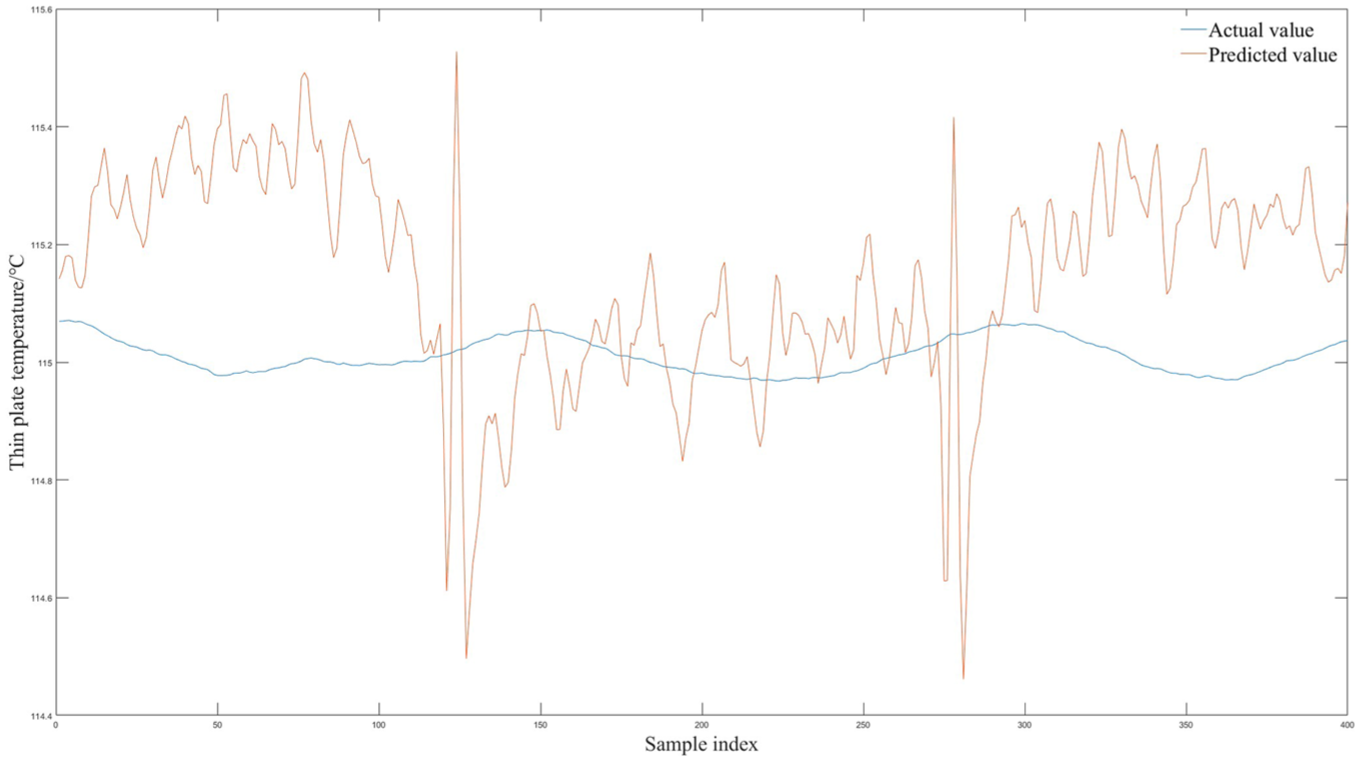
As shown in the Figure 8, the PO-BP-predicted curve almost perfectly overlaps the actual thin-plate temperature across the entire test range; only minute deviations are observed at a few extreme points. The calculated metrics are
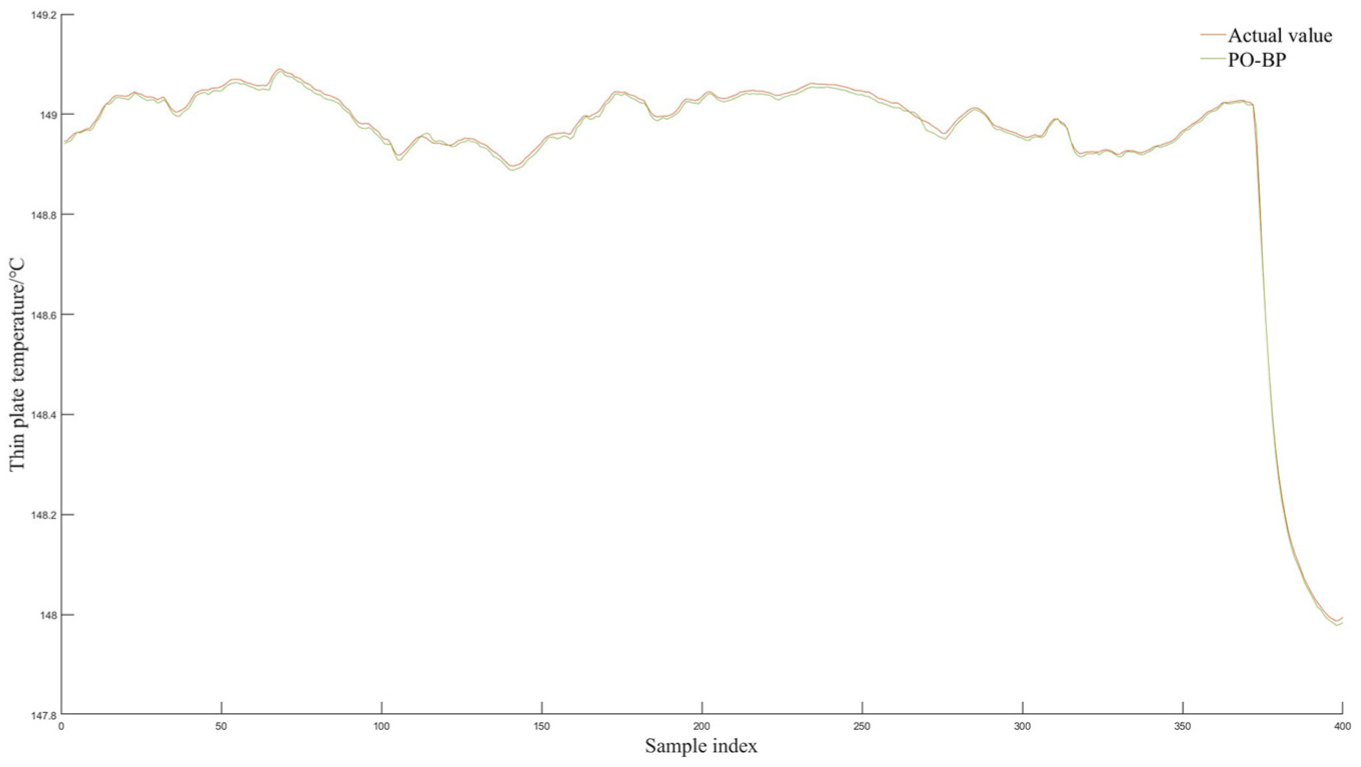
Generalization experiment prediction result graph.
In the single-product scenario, PO-BP already outperforms the standard BP, PSO-BP, GA-BP, and GWO-BP networks in terms of accuracy and stability. The cross-product experiment on the second dataset further demonstrates that the PO-BP model retains its superiority: R2 remains above 99.9%, RMSE stays below 0.007 °C. These consistent results confirm that the PO algorithm’s optimization of BP weights and thresholds not only elevates prediction accuracy but also ensures robust generalization across different tobacco products on the same production line.
Comparison with related studies
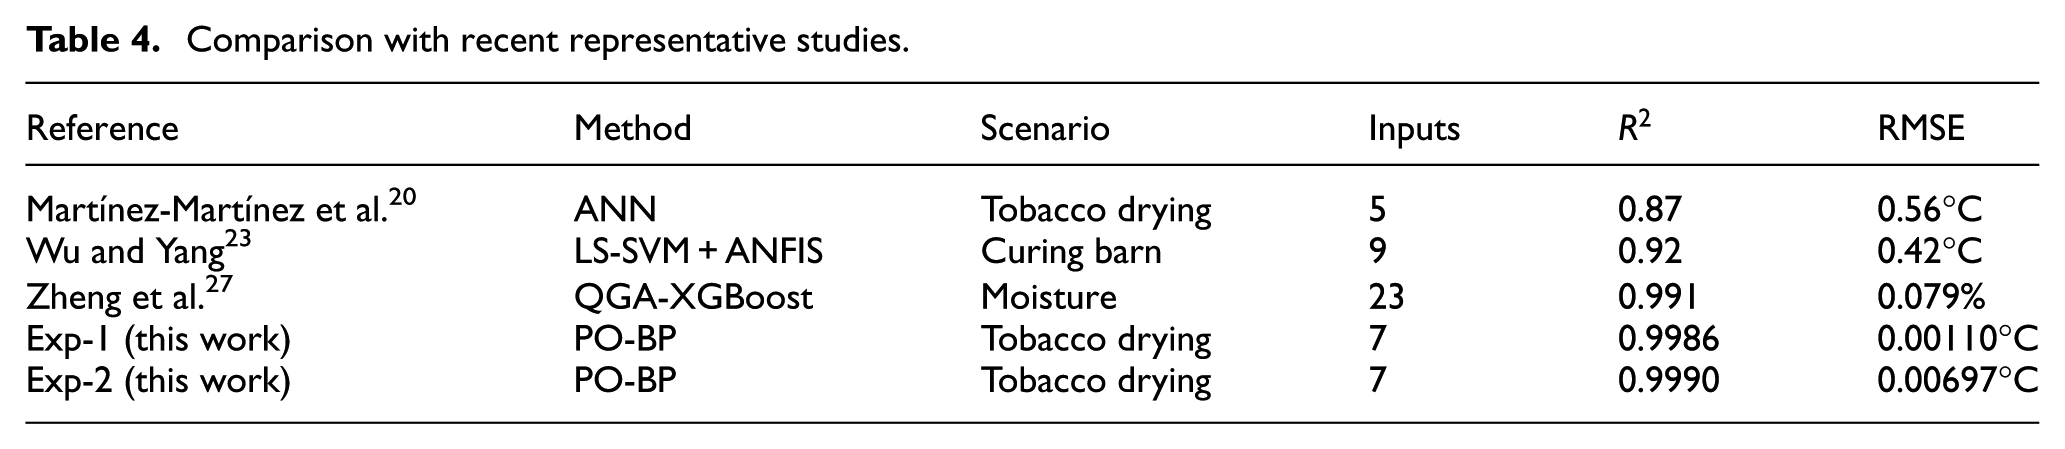
To evaluate the performance of PO-BP, we compared its metrics with those of representative studies published in recent years on tobacco drying or similar thermal processes, as summarized in Table 4. As shown, traditional mechanistic models rely on prior assumptions and achieve only 0.86–0.88 in R2, while also lacking online update capability. Conventional GA-BP and PSO-BP approaches typically yield RMSE values greater than 0.01°C—roughly an order of magnitude higher than the 0.00110°C obtained in our Experiment 1. The latest QGA-XGBoost method performs well in moisture prediction (R2 = 0.991), yet it requires 23 input dimensions, resulting in a computational load 3.4 times that of our study. By contrast, our model attains high accuracy with only seven low-redundancy features, demonstrating PO-BP’s practical value in “small-sample–high-dimension” scenarios. However, the current dataset is still confined to a single production line; our next step will involve collecting cross-line and cross-season data to validate model robustness. Future work will integrate transfer learning and incremental updating strategies to enable “plug-and-play” deployment.
Comparison with recent representative studies.
Discuss the applicable boundaries of alternative model architectures
Deep neural network
The multi-layer nonlinear mapping of deep neural networks (DNNs) enables them to approximate any continuous function, with representational capacity scaling linearly with depth. However, the hyperparameter space expands dramatically, making tuning costs significantly higher than for shallow networks. Should the factory subsequently incorporate high-dimensional nonlinear features such as high-frequency vibration (≥10 Hz), infrared thermal images, or steam pressure pulsation, the representational capacity of a shallow 9-node BP neural network would rapidly saturate. In such cases, replacing it with a DNN hybrid model—combined with PO-based layer-wise pre-training—could significantly enhance its fitting performance. When building joint models for multiple types of tobacco shreds, DNNs can automatically learn the nonlinear mapping between “raw material characteristics” and “operating conditions,” thereby reducing the need for manual feature engineering. However, the number of parameters tends to grow quadratically, requiring over 10,000 cross-seasonal data samples to prevent overfitting. The currently available dataset remains insufficient to adequately support DNN training. Furthermore, programmable logic controllers (PLCs) deployed on factory floors typically have less than 50 MB of memory, and 8-bit MCUs possess limited floating-point computation capabilities. As a result, the inference time of neural networks with more than three layers may exceed the hard real-time requirement of a 1-s control cycle.
To further evaluate the applicability of DNNs in the tobacco drying temperature prediction task studied here, we plotted the sample distribution of the training and test sets on this model (as shown in Figure 9). It can be observed from the figures that although the prediction curve performs nearly perfectly on the training set—achieving almost error-free fitting of all training samples—it performs very poorly on the unseen test set. While this discrepancy has a relatively minor impact in shallow BP networks, it triggers more severe overfitting in DNNs due to their larger parameter capacity and stronger fitting ability, especially under the current condition of a still limited dataset size. Therefore, before sufficient data is available and both sampling frequency and feature dimensionality are expanded, the premature introduction of a DNN architecture is unlikely to yield significant performance improvements. On the contrary, it may compromise practical deployment due to training instability and reduced generalization capability. Therefore, only when sufficient data is available and hardware is upgraded to ARM Cortex-A or edge GPUs would replacing the BP architecture with a DNN be worthwhile.
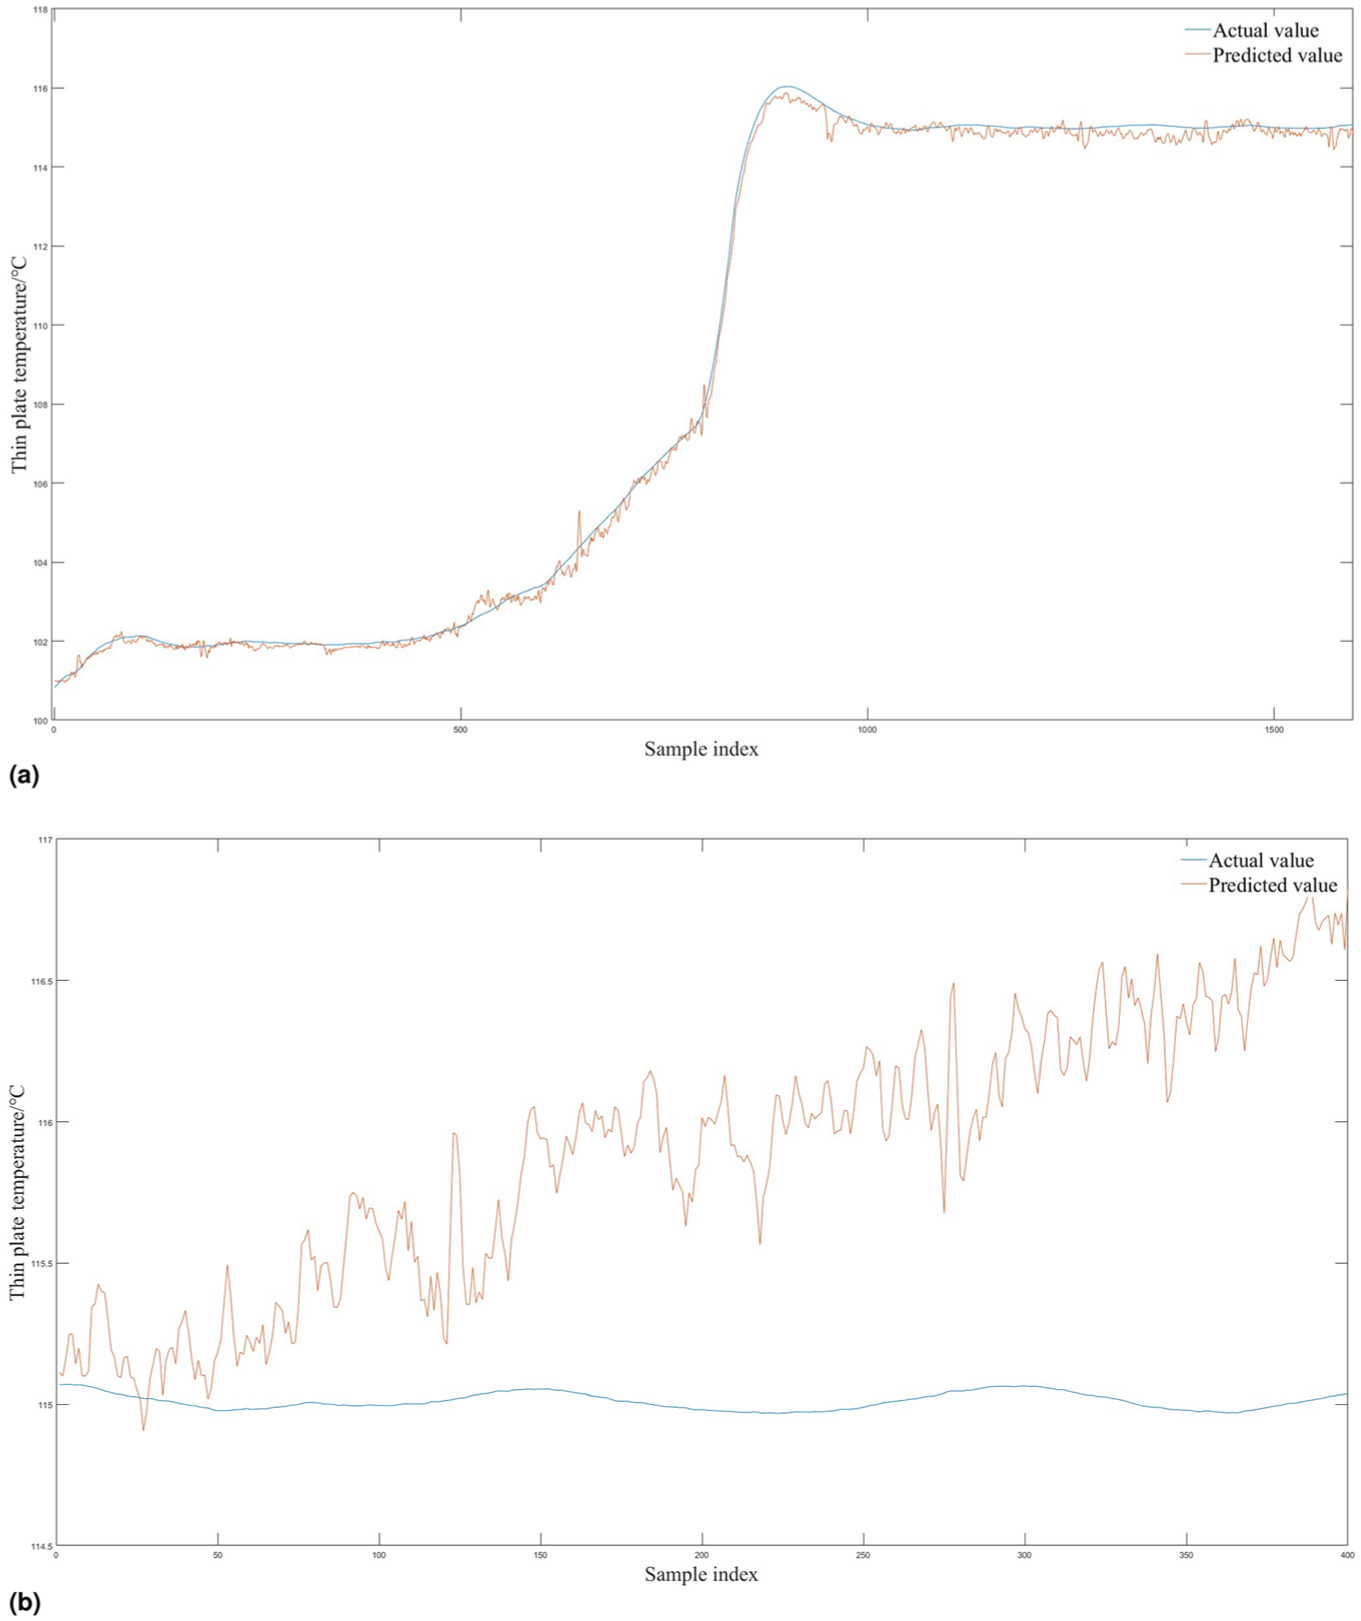
The prediction result graph of the DNN model: (a) training set prediction results, (b) test set prediction results.
LSTM
The gating mechanism of LSTM automatically determines the length of the time window, enabling it to capture both minute-level long-lag dependencies and second-level short-term dynamics. However, its parameter count
Figure 10 presents the prediction results of the Long Short-Term Memory (LSTM) model on the test set. The strong fitting capacity of LSTM enables it to not only capture the underlying physical patterns but also likely overfit stochastic noise and measurement errors present in the training data. As illustrated in the figure, the LSTM model has learned even the noise in the data as “signals,” reproducing them during prediction and thereby introducing unnecessary and intense high-frequency oscillations in the forecast curve. Therefore, replacing the BP neural network with an LSTM could introduce parameter redundancy and real-time performance.
Prediction results of the LSTM model.
Conclusion
This paper proposes a temperature prediction framework for the thin plate of a tobacco-sheet drying machine, leveraging a Backpropagation Neural Network optimized via the Parrot Optimization Algorithm. The PO adaptively adjusts the BPNN’s weights and biases to minimize prediction errors in real-time thermal dynamics.
The results are as follows:
Incorporating PO for parameter optimization in the BP neural network has addressed the problem of the algorithm being trapped in local optima, significantly improving prediction accuracy.
Applying the PO-BP prediction model to predict the thin plate temperature of the roaster, an analysis of the prediction results on the test set shows that the correlation coefficient R2 can reach 0.998.
Contrastive experiments show that, compared to the traditional BP neural network, the thin plate temperature prediction model based on PO-BP proposed in this paper has significantly improved the correlation coefficient R2 from 0.885 to 0.998, and reduced the root mean square error RMSE from 0.01 to 0.001. This effectively enhances the accuracy of thin plate temperature prediction.
The improved thin plate temperature prediction model can significantly enhance the efficiency and product quality of tobacco drying processes, while reducing energy consumption and production costs. Furthermore, these research findings can be applied to other industrial sectors, such as food processing and chemical production, by enabling more accurate temperature prediction and control. This optimization of production processes can improve equipment reliability and service life, thereby generating greater economic benefits for enterprises.
Due to the limited number of production data samples, the model may suffer from overfitting. Future research will focus on expanding the dataset’s scale and diversity to verify the model’s generalization ability. Additionally, further exploration will be conducted to apply the model to other types of industrial equipment and production processes, thereby further validating its effectiveness and applicability.
Footnotes
Ethical Considerations
This study did not involve human participants or animal subjects. All data used in this research were obtained from industrial equipment monitoring systems, and the analysis did not involve any personal or sensitive information. The research complied with all applicable ethical standards in industrial data analysis.
Informed Consent
As this study exclusively utilized anonymized operational data from industrial equipment with no human involvement, informed consent was not required. All data were provided by the manufacturing facility under appropriate data usage agreements.
Funding
The authors disclosed receipt of the following financial support for the research, authorship, and/or publication of this article: This work was supported by the Hebei Provincial Higher Education Scientific Research Project (Grant No. CXZX2025039).
Declaration of conflicting interests
The authors declared no potential conflicts of interest with respect to the research, authorship, and/or publication of this article.
Study design
This is a retrospective analysis/experimental study, which does not require trial registration.
Data availability statement
The datasets generated and analyzed during this study are proprietary operational data collected from a local manufacturing facility under confidentiality agreements. Due to commercial sensitivity and contractual obligations, the raw data are not publicly available. However, anonymized subsets or processed data supporting the findings may be provided by the corresponding author upon reasonable request, subject to approval by the data owner.