
Abstract
In hydraulic engineering, the particle size distribution (PSD) of suspended solids is a key parameter with important implications for both research and practical applications. Conventional approaches for estimating PSD typically rely on solving first-kind Fredholm integral equations. This study presents a PSD prediction method that integrates acoustic physical mechanisms with deep learning. Based on the ECAH theory of sound propagation in multiphase media, we constructed a feature library of ultrasonic attenuation responses and developed a PSD prediction framework using an SSA-optimized LSTM (SSA-LSTM). Experimental samples were classified by particle size through sieving, yielding 15 standard particle-size intervals. A total of 45 experimental samples were then prepared and measured. The dataset was deliberately designed to cover four benchmark distribution types normal, uniform, random, and specially designed non-continuous distributions to enable a comprehensive evaluation of model performance. Ultrasonic attenuation experiments provided both the physical parameters of particles in the suspended sediment solutions and the corresponding attenuation parameters. The SSA-LSTM model was trained using selected feature and label parameters, allowing it to predict PSDs from the input acoustic features. Four suspended-sediment samples with different distributions were then evaluated using the model, and the predictions were compared against PSDs obtained from sieving, random forest, and a standard RNN approach. The coefficient of determination exceeded 0.80 for all samples, and the median particle-size errors were 6.25%, 6.09%, 3.09%, and 2.07%, respectively. These results demonstrate that the proposed method provides a practical and effective alternative for estimating PSD from ultrasonic attenuation.
Introduction
The hydrological and water quality conditions of rivers are key factors shaping regional ecology and economic development. Among these, the PSD of suspended solids is a fundamental physical indicator that influences the health and stability of riverine ecosystems. For example, in ports and nearshore environments, loose seabed sediments such as silt and clay can be easily resuspended by even mild wave or current disturbances. This process not only causes a sharp rise in water turbidity reducing light penetration and hindering photosynthesis and aquatic life but also serves as the primary source of material for channel and harbor siltation, posing risks to navigation and incurring substantial maintenance costs. 1 In pollution control, many contaminants readily adsorb onto fine particles. When such particles dominate wastewater, pollutant mobility and bioavailability increase markedly, promoting their spread throughout the water body and creating long-lasting ecological threats. PSD, in this sense, can be viewed as the “fingerprint” of urban wastewater. 2 On a broader scale, spatially uneven sediment PSD affects landscape stability. It drives critical geomorphic processes such as shoreline erosion and abnormal sediment deposition and can lead to irregular development of submerged deltas or tidal channels, ultimately disrupting natural morphology. 3 Within river systems, inaccurate assessments of grain-size-dependent sediment transport capacity often result in erroneous predictions of channel scour and deposition patterns. Such misjudgments can lead to serious consequences, including channel instability, bridge foundation scour, and increased flood risk. 4 Therefore, advancing research on grain size distribution is essential not only to understand the mechanisms behind these issues but also to enhance our ability to predict and manage sediment dynamics effectively.
However, owing to the intrinsic physical complexity of two-phase flow systems and the dynamic variability of the many factors involved, achieving accurate and rapid PSD measurement remains a significant challenge. Existing particle size analysis methods generally include sieve analysis, microscopic imaging, gravitational sedimentation, light scattering, and acoustic detection. Gravitational sedimentation, a classical technique based on Stokes’ law, is particularly well suited for samples with broad PSDs. Nevertheless, it faces inherent limitations when dealing with very fine particles: once particle sizes fall below 2 μm, Brownian motion becomes pronounced, severely disrupting gravitational settling and greatly reducing measurement accuracy.5,6 Light scattering techniques determine PSDs by mathematically inverting the distribution of scattered light energy produced by particle ensembles. However, their measurement accuracy is highly susceptible to interference from sample conditions. For example, small-angle scattering signals are often overwhelmed by oversaturated central beams and stray light, directly degrading the reliability of the inversion results. This optical interference has become the primary physical bottleneck restricting the precision of such methods.7–9 Among the various particle size analysis technologies, ultrasonic detection has increasingly become a focus of both domestic and international research due to its non-contact nature, strong penetration capability, and operational convenience. Traditional ultrasonic approaches largely depend on inversion algorithms grounded in physical models to estimate PSDs. Early studies primarily sought to optimize input signals and improve the stability of model solutions. For instance, Xue et al. highlighted the advantages of using broadband acoustic attenuation spectra, while Jia et al. developed a multi-frequency wave superposition strategy to generate more informative attenuation data.10,11 Building on this foundation, later research incorporated a range of optimization algorithms into acoustic models to enhance inversion accuracy. Li et al. introduced an artificial bee colony algorithm, and Yuan et al. integrated a random forest method with ultrasonic physical characteristic parameters.12,13
Despite notable progress in inversion methods grounded in explicit physical models, these approaches often depend on complex theoretical assumptions and remain highly sensitive to signal noise, making it difficult for them to fully capture the nonlinear behavior inherent in real two-phase flow systems. In contrast, deep learning techniques have shown great promise due to their strong nonlinear modeling capabilities. Unlike traditional methods, deep learning does not rely on predefined physical equations; instead, neural networks learn implicit mapping relationships between input features and target outputs directly from data. For example, Ließ and Sakhaee used convolutional neural networks (CNNs) to infer soil texture from geospatial inputs; Zahedi et al. developed a CNN-based semantic segmentation framework for nanoparticle size measurement; and Gao et al. applied CNNs to extract features from microscopic coal images, revealing complex correlations between PSD and measurement errors.14–16 This paradigm shift has opened new directions for particle size analysis research. Nevertheless, it is important to recognize that the choice of deep learning architecture must align with the intrinsic characteristics of the data. CNNs, as used in the studies above, derive their strength from analyzing data with spatial structure, efficiently identifying local patterns using convolutional kernels. Yet in many particle size measurement applications whether the signals come from acoustic, optical, or environmental monitoring systems the data is fundamentally sequential. Measurements at different frequencies or time steps are not independent; together, they encode information about PSD through temporal correlations and long-range dependencies. For such data with pronounced temporal structure, recurrent neural networks (RNNs), and particularly their advanced variant the long short-term memory (LSTM) network offer a more appropriate analytical framework. Their advantages have been empirically demonstrated. Wang et al., for instance, showed that LSTMs excel at capturing long-term dependencies and significantly improve prediction performance compared with RNNs and backpropagation neural networks in analyzing particulate matter concentrations in gas–solid two-phase flows. 17 In addition, Dai et al. further demonstrated the effectiveness of RNN- and LSTM-based data-driven models in complex physical inversion tasks by successfully identifying cohesive-zone law parameters in nickel-modified carbon-nanotube-reinforced nano-silver adhesives, underscoring the robustness of sequence models for nonlinear parameter estimation. 18 Building on this foundation, researchers have begun applying LSTM architectures to more advanced granularity-related challenges. For example, Liu et al. integrated LSTMs with multi-head attention mechanisms to develop a hybrid model capable of accurately predicting the maximum explosion pressure of coal dust. 19 LSTM models have also shown strong promise in practical engineering scenarios. Wu et al. demonstrated that LSTMs can reliably reconstruct aerosol size distributions using routine, low-cost air quality monitoring data, establishing a highly economical and effective approach for relevant applications. 20
This study proposes an innovative PSD measurement approach that integrates particle physical parameters, ultrasonic attenuation data, the Sparrow Search Algorithm (SSA), and LSTM networks. In the experiments, glass microspheres were first sorted into 15 narrow particle-size intervals using precise sieving techniques. Based on these intervals, four representative sample types were carefully constructed for model validation: a normal distribution, a uniform distribution, a random distribution, and a specially designed non-continuous distribution simulating complex operating conditions. Guided by prior knowledge from the Epstein–Carhart–Allegra–Hawley (ECAH) physical model and ultrasonic feature analysis, we selected 10 key parameters including solution concentration and acoustic attenuation coefficients as input features for building the SSA-LSTM model. Training and validation across all four sample types yielded highly accurate PSD predictions. To further elucidate the model’s internal decision-making mechanisms, we applied the SHapley Additive exPlanations (SHAP) framework and evaluated predictive performance using multiple metrics, including root mean square error and the coefficient of determination. Overall, this work aims to develop an optimized and interpretable SSA-LSTM model that establishes an end-to-end nonlinear mapping between feature parameters and PSD, thereby simplifying and in many cases surpassing the capabilities of traditional PSD measurement methods.
Experimental principles and methods
Overall research approach
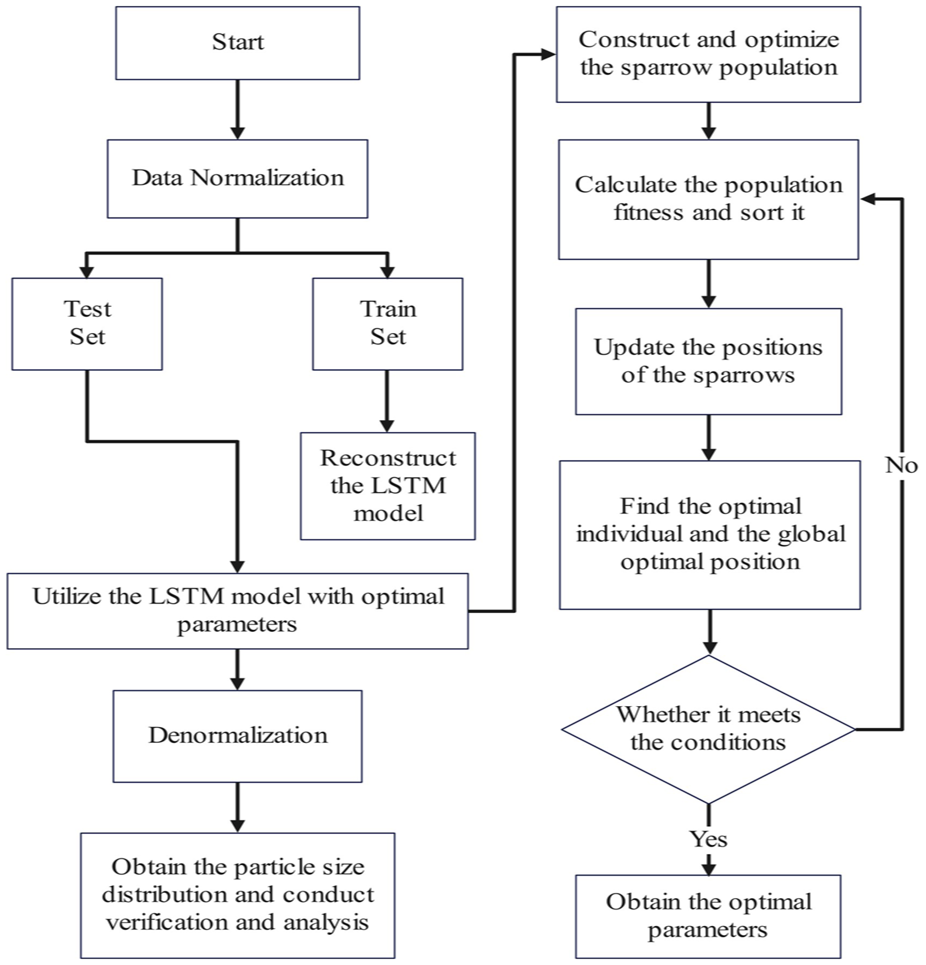
To achieve the objectives outlined in the introduction, we developed a systematic methodology that integrates experimental data collection, acoustic-based feature engineering, and deep learning models optimized through meta-heuristic algorithms. The overall technical workflow of this study is illustrated in Figure 1.
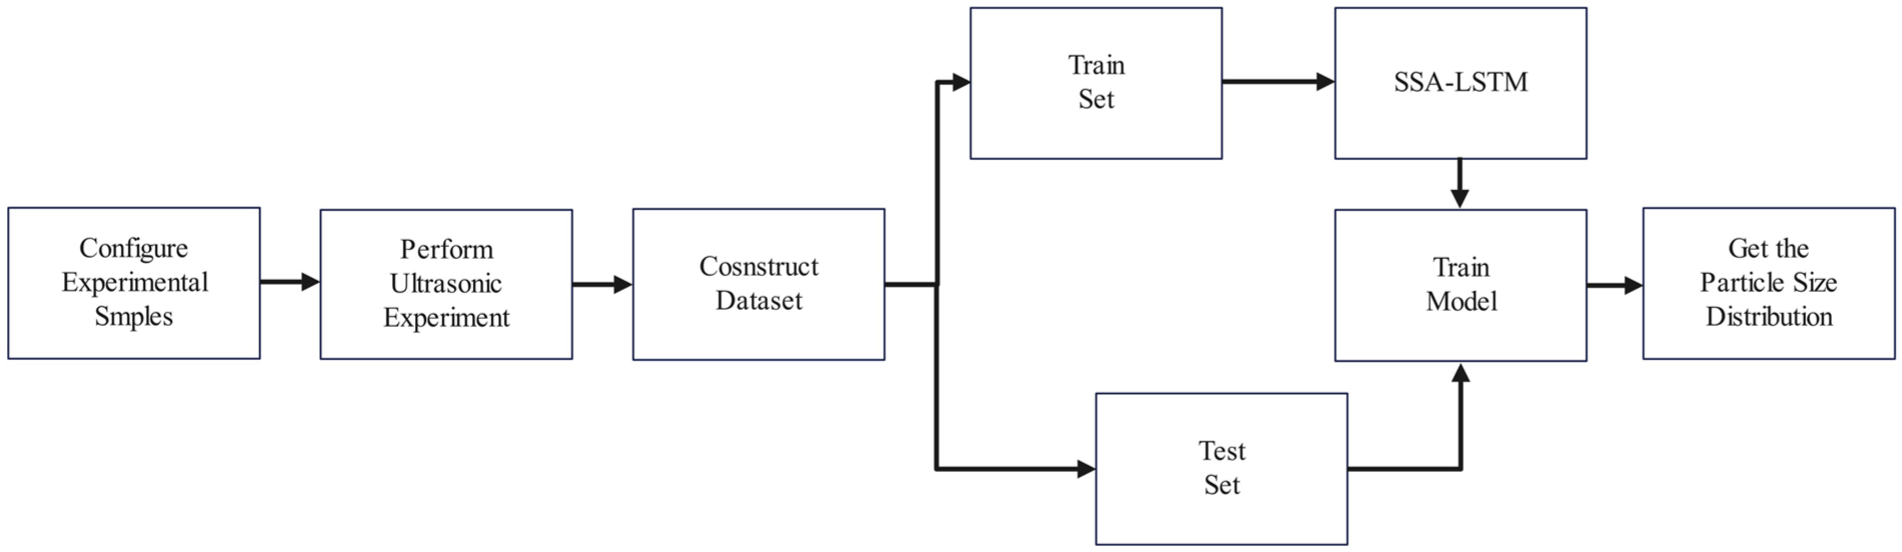
Overall research framework.
During the experimental design and data collection stage, glass microspheres were selected as standard particles to establish an idealized experimental system with uniform physical properties and controllable PSD, owing to their close similarity to natural sediments. Sample preparation followed a two-step procedure. First, the microspheres were precisely classified into 15 distinct size fractions using standard sieving techniques. The suspension samples were passed through a series of sieves with mesh sizes <65, 65–75, 75–80, 80–90, 90–110, 110–120, 120–140, 140–160, 160–180, 180–190, 190–200, 200–220, 220–250, 250–280, and >280 (mesh number), corresponding to Groups A–O, respectively. Second, each fraction was accurately weighed using an electronic balance, and 45 suspension samples were formulated. These samples were designed not only to represent three common continuous distribution patterns normal, uniform, and random but also to include a special class of interference samples. For the latter, particle contents in two designated size intervals were deliberately set to zero to simulate non-continuous distributions under complex operating conditions. This experimental design provided a robust and diverse dataset for subsequent model training and validation. Acoustic response data for all 45 samples were then systematically collected using an ultrasonic attenuation measurement system.
In the feature engineering and model construction stage, we conducted a targeted identification of key feature parameters. Rather than relying on automated feature-selection algorithms, we deliberately chose physical parameters known to be highly sensitive to particle size variations, guided by acoustic theoretical models and supplemented by exploratory analysis of the experimental data. This enabled the development of a structured dataset for model training and evaluation. Finally, this dataset was used to train the SSA-LSTM model, whose generalization performance and predictive accuracy were verified using independent test samples, ultimately enabling precise PSD estimation from ultrasonic attenuation features.
Ultrasonic attenuation model
For measuring solution parameters of suspended solids in water bodies, ultrasonic attenuation is a commonly used technique. The attenuation of ultrasonic waves in suspended solids is essentially the result of multiple physical loss mechanisms combined, theoretically encompassing seven effects including absorption, scattering, viscous loss, and thermal loss. In practical applications, only the four dominant effects energy loss due to absorption, scattering, viscous friction, and thermal conduction need to be considered. The remaining effects can be neglected due to their negligible contributions. The specific expression is shown as equation (1).

In the equation: The
The ECAH model accounts for internal absorption mechanisms, including viscous attenuation, thermal attenuation, scattering, and acoustic losses, capturing the coupled relationships among PSD, particle concentration, and attenuation coefficients.21,22 This model is directly applicable to the suspended sediment solutions investigated in this study and provides an effective framework for analyzing the correlations among PSD, mass concentration, and ultrasonic attenuation. During feature parameter selection, the theoretical model is integrated with experimental data. By examining the relationships between model parameters and measured results, parameters that are most sensitive to variations in particle size are identified as characteristic indicators. The core mathematical formulation of this model is presented in equation (2).
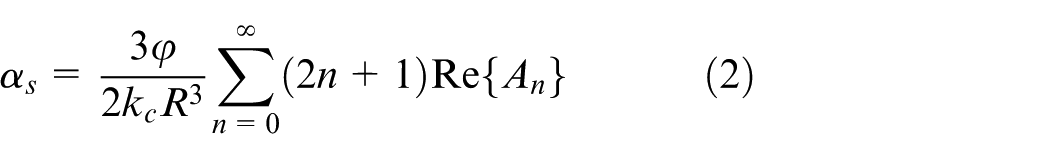
In the equation: The
It can be seen from equation (1) that the differences in concentration and PSD will lead to different ultrasonic attenuations of the suspension solution. The concentration can be determined based on the samples prepared in advance. In actual measurement, to avoid the influence of clear water on the ultrasonic attenuation coefficient, it can be calculated according to equation (3).
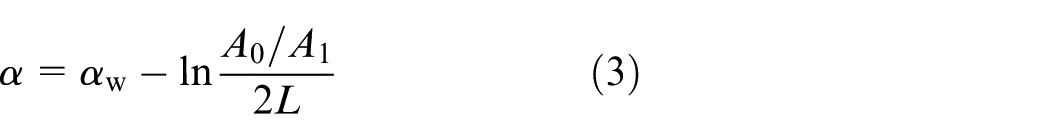
In the equation: The
Experimental instruments
The system schematic diagram of the ultrasonic suspension mass parameter detection device is shown in Figure 2.
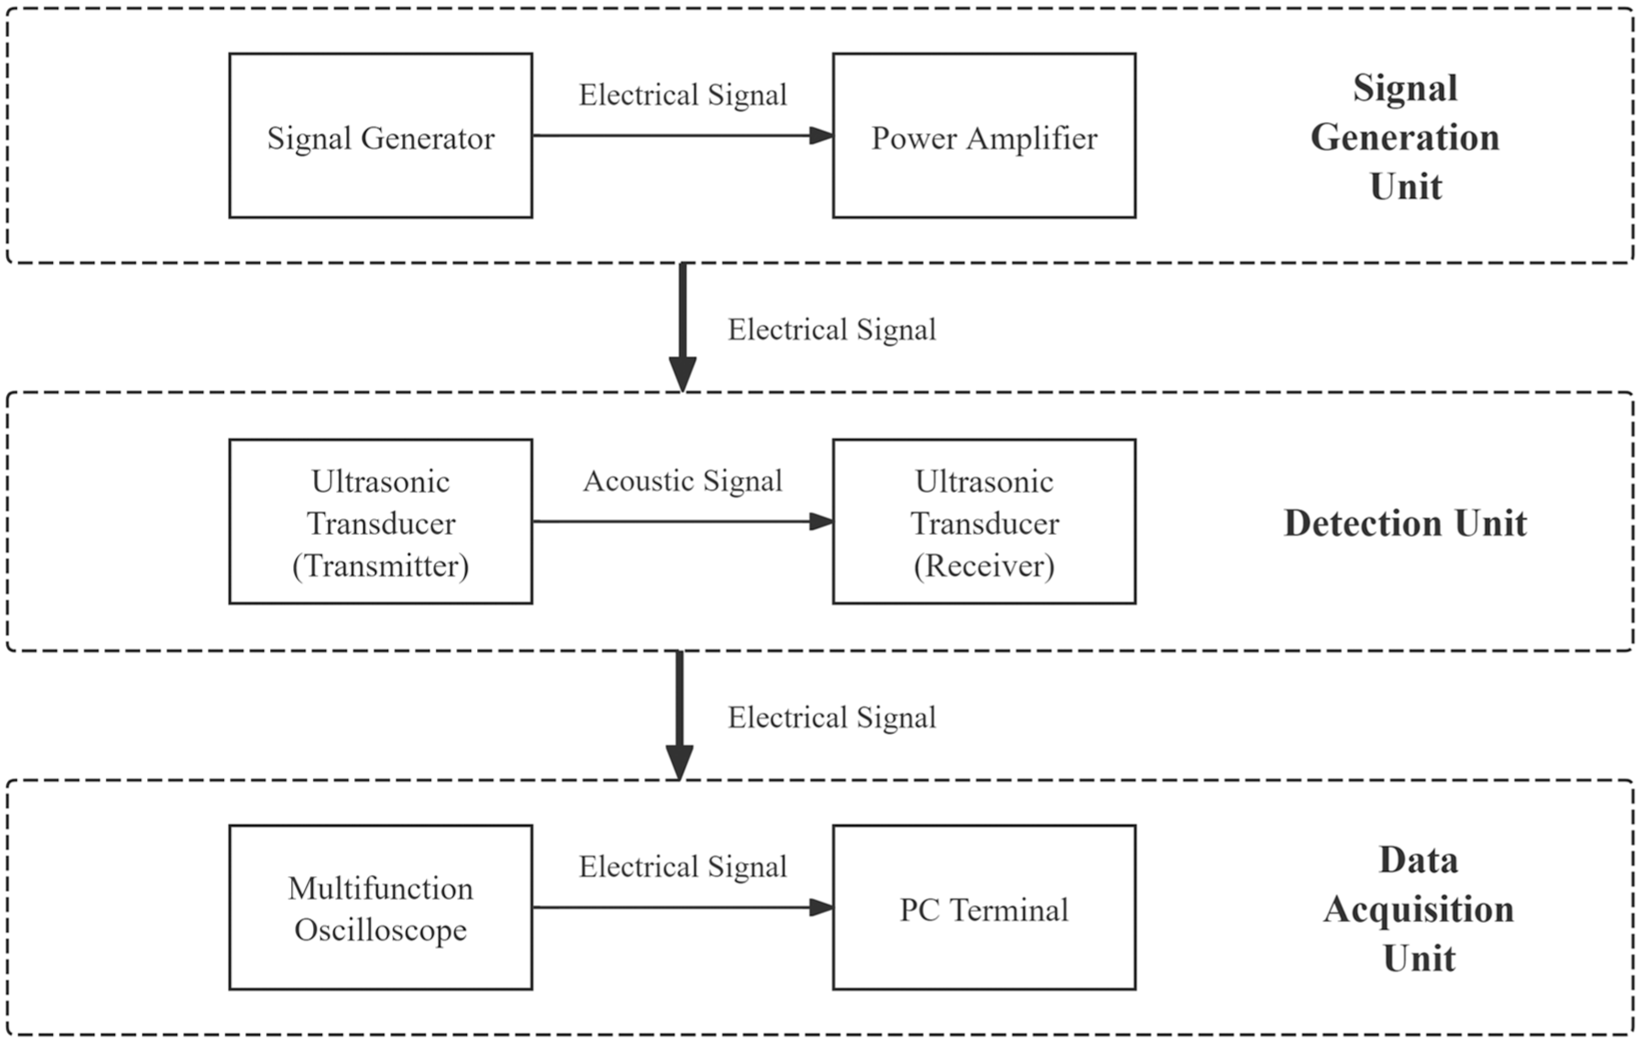
Schematic diagram of the suspended mass parameter measurement system.
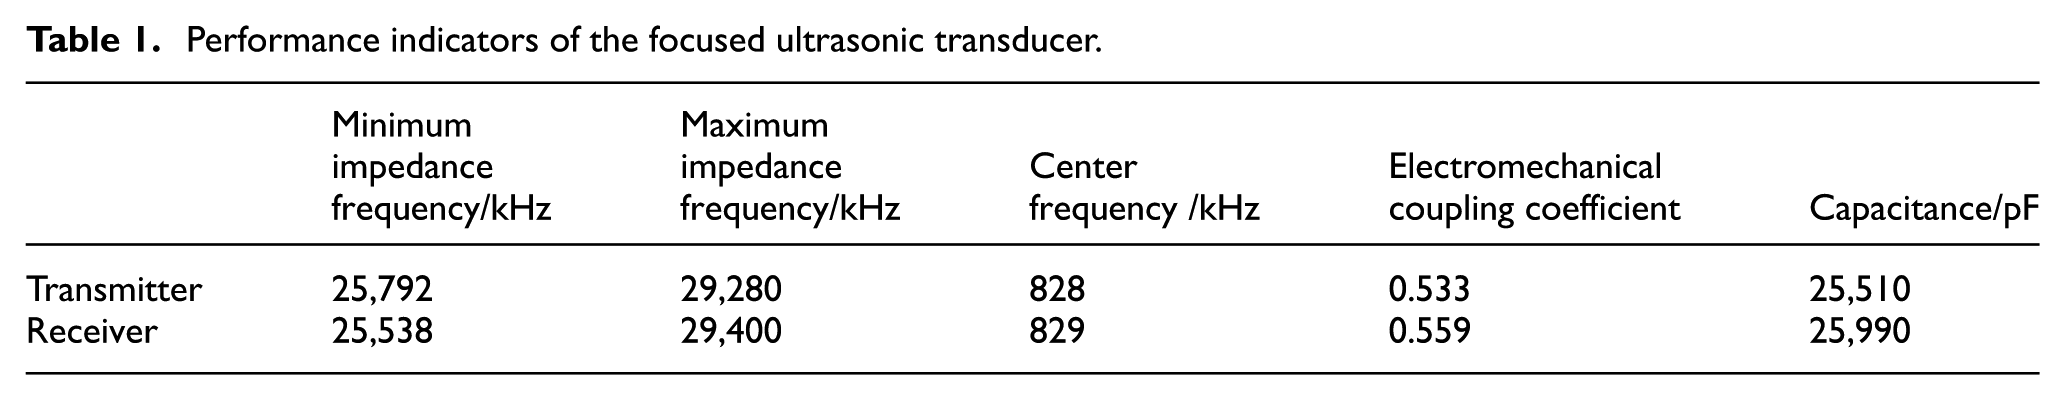
The measurement system primarily consists of a signal generation unit, a detection unit, and a data acquisition unit. The transducer pair is installed in a specially designed acrylic water tank measuring 400 mm × 200 mm × 170 mm, with the center-to-center distance between the two transducers precisely set at 170 mm. Each transducer is fabricated from piezoelectric ceramic PZT82, featuring a spherical projection diameter of 90 mm and a wall thickness of 2.5 mm. The signal conversion process is as follows: the transmitting transducer converts the electrical excitation signal from the power amplifier into an ultrasonic wave. Detailed specifications of the transducers are provided in Table 1. As the ultrasonic waves propagate through the suspended medium, energy attenuation occurs due to the physical properties of the solution. Consequently, the reflected echoes captured by the receiving transducer exhibit a decreasing amplitude pattern. During the experiment, the voltage waveform at the receiving end is recorded in real time using an oscilloscope, allowing the attenuation characteristics of the sound waves to be quantitatively analyzed.
Performance indicators of the focused ultrasonic transducer.
The system diagram of the ultrasonic suspension mass parameter detection device is shown in Figure 3.
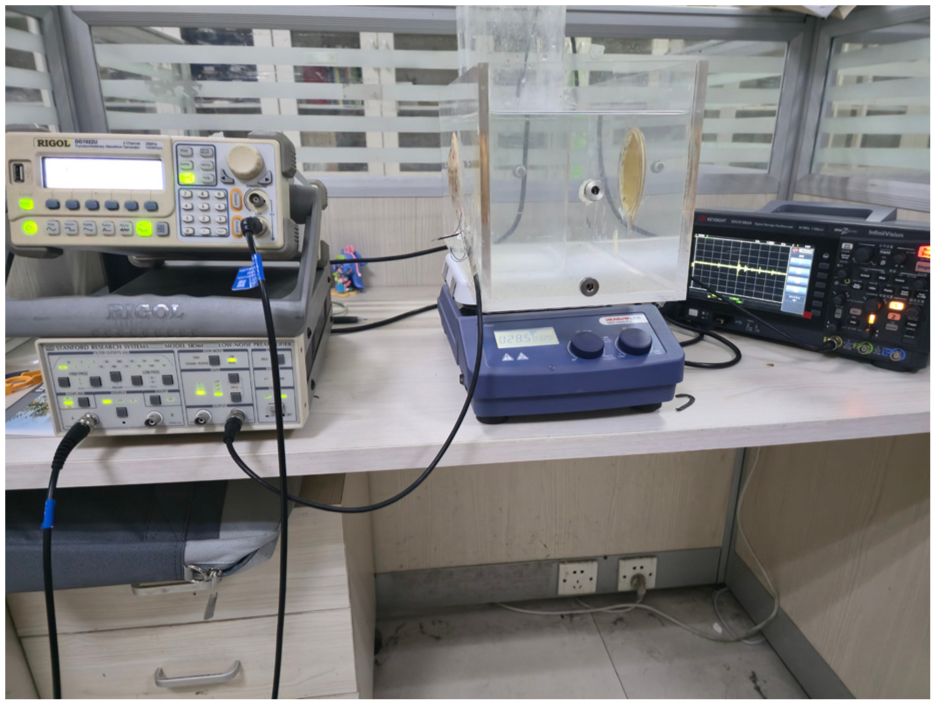
Suspended mass parameter measurement system.
The experiment was conducted as follows. The suspension sample was poured into the container, and an electromagnetic stirrer was used to continuously agitate the fluid, ensuring a uniform particle distribution and simulating realistic flow conditions. The signal generation module was configured to output a pulse wave–modulated excitation with a peak-to-peak voltage of 5 V and a center frequency adjustable between 600 and 900 kHz, according to experimental requirements. The transmitted ultrasonic signals were received by a focused transducer, and the corresponding voltage responses were captured synchronously by a digital oscilloscope. The acquired ultrasonic echo signals were then processed using a wavelet threshold denoising method to remove random and environmental noise. Specifically, the Daubechies-5 (db5) mother wavelet was applied with five decomposition levels, and a soft threshold function based on the universal threshold rule (sqtwolog) was employed to adaptively suppress high-frequency noise while preserving the main echo structure. The resulting denoised time-domain signal is shown in Figure 4, and the corresponding frequency-domain signal, obtained via Fourier transform, is presented in Figure 5.
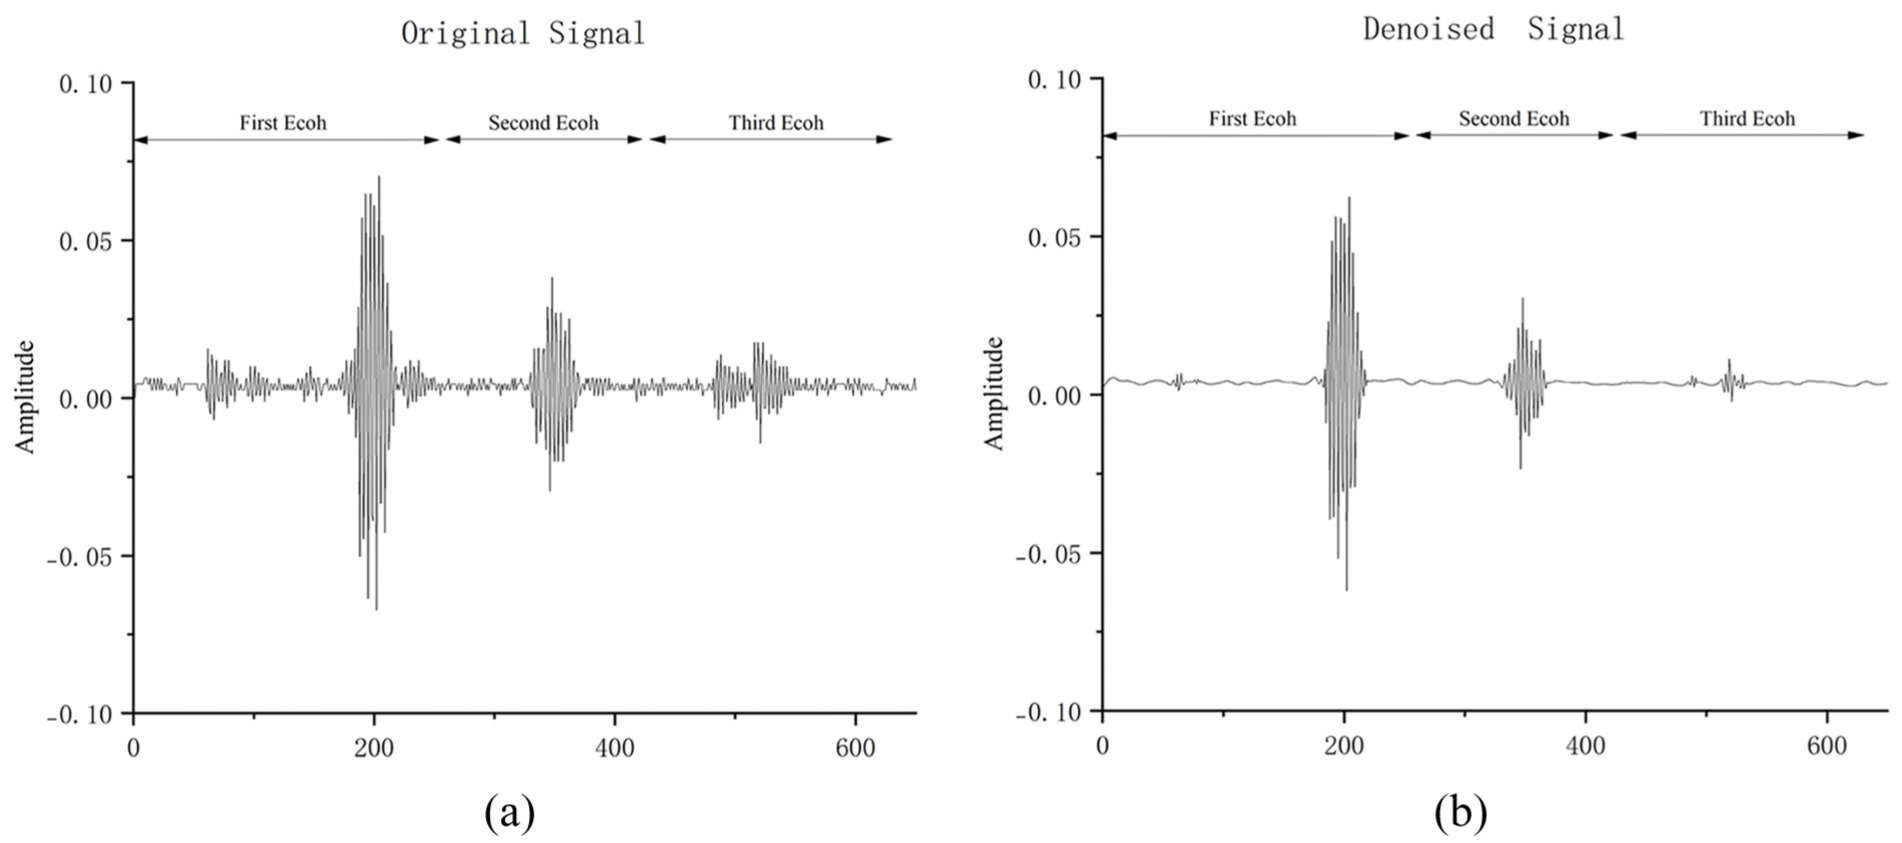
Original signal and denoised signal: (a) original signal and (b) denoised signal.
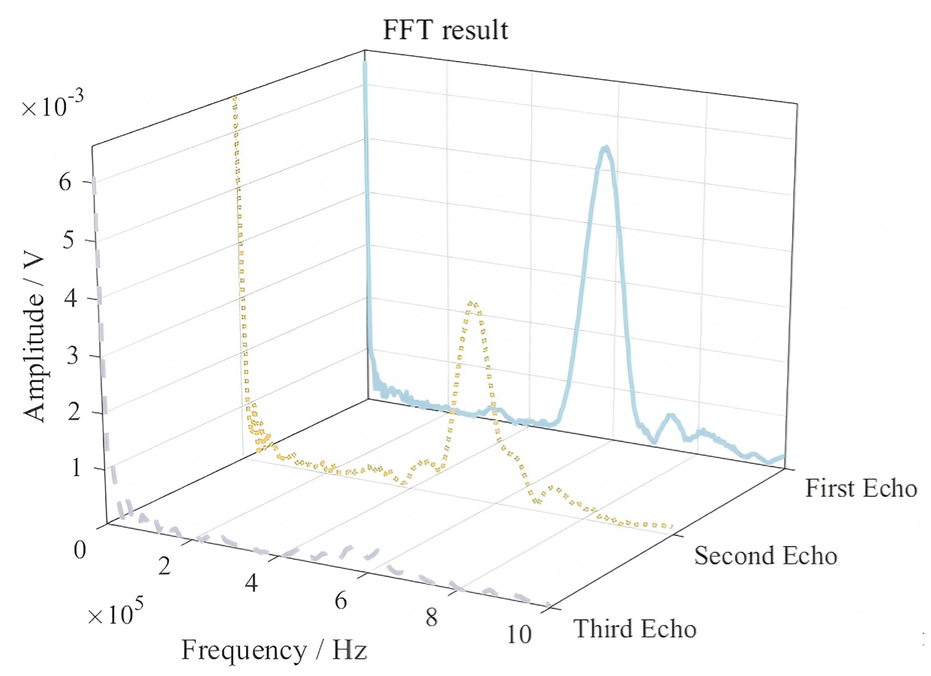
Fourier transform result.
As shown in Figure 4, in the time domain, we selected the peak amplitudes of three consecutive reflection echoes. This approach captures the dynamic trend of the attenuation process, providing greater robustness and richer information for identification compared with using a single echo. However, temporal information alone is insufficient to fully characterize the underlying physical mechanisms of attenuation, as acoustic attenuation exhibits strong frequency dependence a fundamental aspect of granularity analysis. To address this, the time-domain signals were transformed into the frequency domain using the Fast Fourier Transform for further analysis. We focused on the 500–900 kHz frequency band, which corresponds to both the energy-concentrated range and the highest signal-to-noise ratio for the transducers used. This band was also experimentally verified to be most sensitive to particle size variations within the range considered in this study. Within this critical frequency range, the peak amplitude of each echo spectrum serves as a stable and quantifiable indicator of the energy, directly reflecting the attenuation of the core frequency components. In summary, six characteristic parameters the peak amplitudes of three consecutive time-domain echoes and the peak amplitudes of their corresponding frequency-domain spectra were selected. These parameters provide a robust and informative dataset for training deep learning models, enabling high-precision PSD predictions.
SSA-LSTM
This study proposes an innovative PSD measurement approach aimed at overcoming the limitations of traditional inversion techniques based on first-kind Fredholm integral equations, particularly their sensitivity to noise. We developed an integrated measurement framework that combines the SSA Long Short-Term Memory networks, and model interpretability analysis, as illustrated in Figure 6. The core concept of this framework is to first employ an efficient global optimization algorithm to fine-tune a robust sequence prediction model. This optimized model is then used to directly establish an end-to-end nonlinear mapping between ultrasonic experimental feature parameters and PSD, enabling accurate and reliable predictions without relying on complex inversion procedures.
SSA-LSTM structure diagram.
Within this framework, the SSA functions as an optimizer. As an advanced meta-heuristic optimization technique, SSA excels at balancing global exploration with local exploitation.23,24 This capability allows it to effectively avoid local optima a common limitation of traditional gradient descent methods when optimizing complex, non-smooth problems such as neural networks. The core iterative update mechanism of SSA is described by equations (4)–(6).
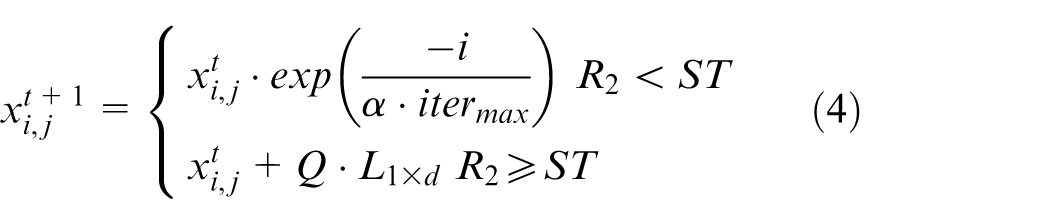
In the equation: The
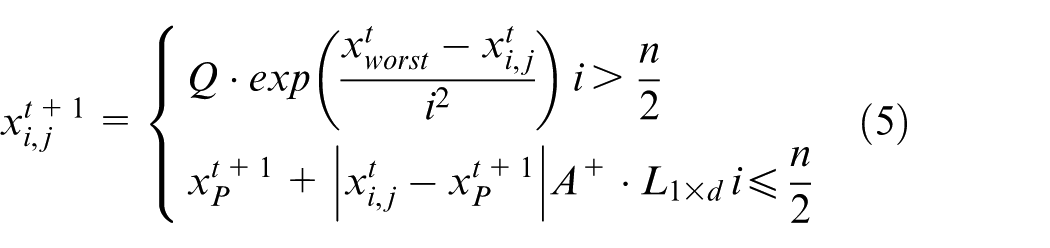
In the equation: The
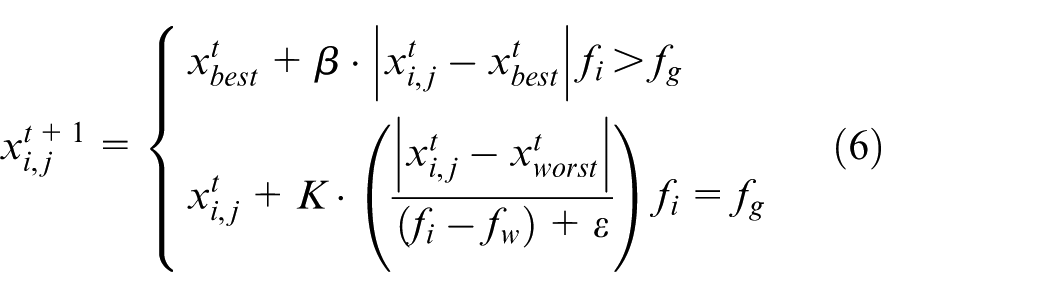
In the equation: The
The aforementioned equations collectively define a dynamic, cooperative optimization process aimed at identifying an optimal set of LSTM hyperparameters namely, learning rate, number of hidden units, and dropout rate thereby improving the accuracy of PSD predictions. In this framework, the position of each “sparrow” represents a complete LSTM hyperparameter vector, and its fitness is evaluated based on the performance of the corresponding model on the PSD prediction task. For this optimization, the SSA population size was set to 30, the maximum number of iterations to 50, and the producer-to-scout ratio to 0.2 and 0.1, respectively. The hyperparameter search space was defined as follows: learning rate
LSTM, a deep learning model specifically designed for sequential data, employs a unit structure illustrated in Figure 6. Its primary strength lies in its ability to capture and leverage long-range dependencies within data sequences through sophisticated gating mechanisms and cell states. 25 This capability makes LSTM particularly well suited to the structure of the experimental data in this study.
The Figure 7 involves three core variables:
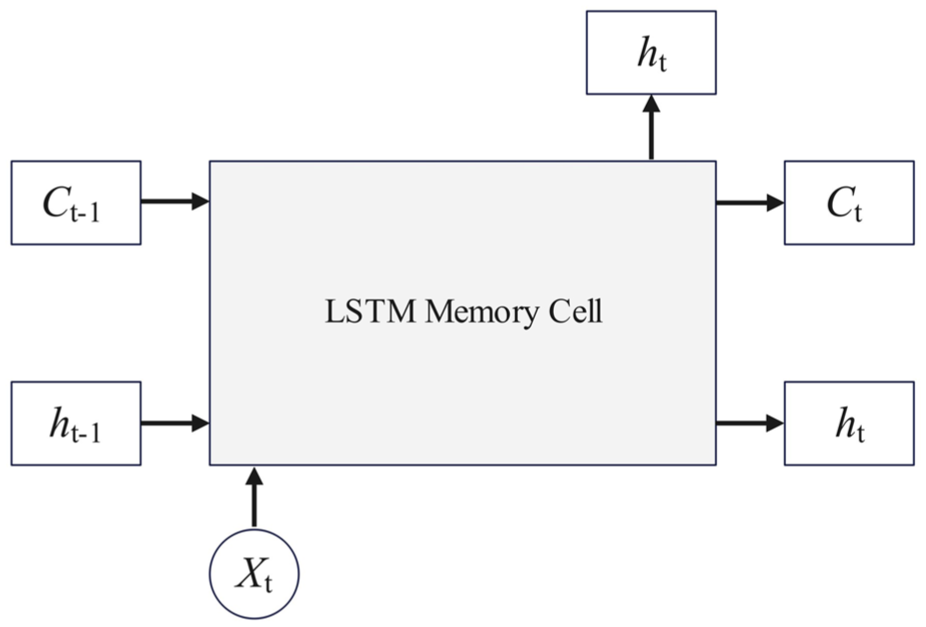
LSTM structure diagram.
Specifically, our experimental data originates from ultrasonic attenuation measurements of N = 45 independent particle suspensions. For sample i (i = 1, ⋯,45), the input data constitutes a feature matrix
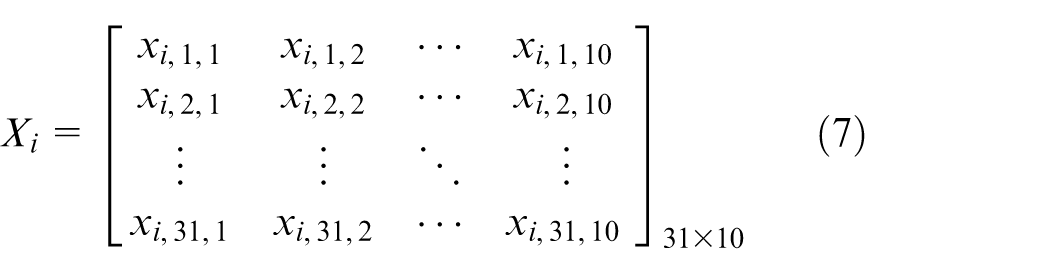
In the equation: The
This structure, arranged in ascending order of frequency, inherently forms a typical sequential signal from the ultrasonic attenuation spectrum data. Attenuation values at different frequency points are interrelated, collectively determining the final PSD. The label corresponding to this input sequence is the PSD of the sample measured by sieve analysis, represented as a vector

In the equation: The
The core task of this study is to utilize an LSTM network to learn a nonlinear mapping function capable of accurately describing this relationship, as shown in equation (9).

In the equation: The Θ represents the weights and biases in an LSTM network.
The SSA-optimized LSTM model was trained using the Adam optimizer with a batch size of 15 and a maximum of 1500 epochs. To prevent overfitting, a validation set was added, and the dataset was divided into 70% for training, 10% for validation, and 20% for testing. The validation set was used to continuously monitor model performance and trigger early stopping when the validation loss ceased to improve (patience = 20, min
Results and discussion
Model training process and convergence analysis
Before evaluating the model’s final predictive performance, we first examined the entire training process to verify its validity and convergence. Figure 8 presents the iterative changes in RMSE, training loss, and validation loss using a polar coordinate plot. In this figure, the angular axis represents the training iterations, while the radial axis corresponds to the magnitude of the error. As shown, all three curves begin with relatively high error values and rapidly contract toward the center as training progresses. The validation loss closely follows the training loss without any divergence, indicating that the model is not affected by overfitting. Ultimately, all metrics stabilize within a very small radius, confirming the rapid and stable convergence of the SSA-LSTM model. This consistent convergence pattern across both training and validation metrics demonstrates that the model has been effectively optimized, providing a reliable foundation for accurate PSD prediction.
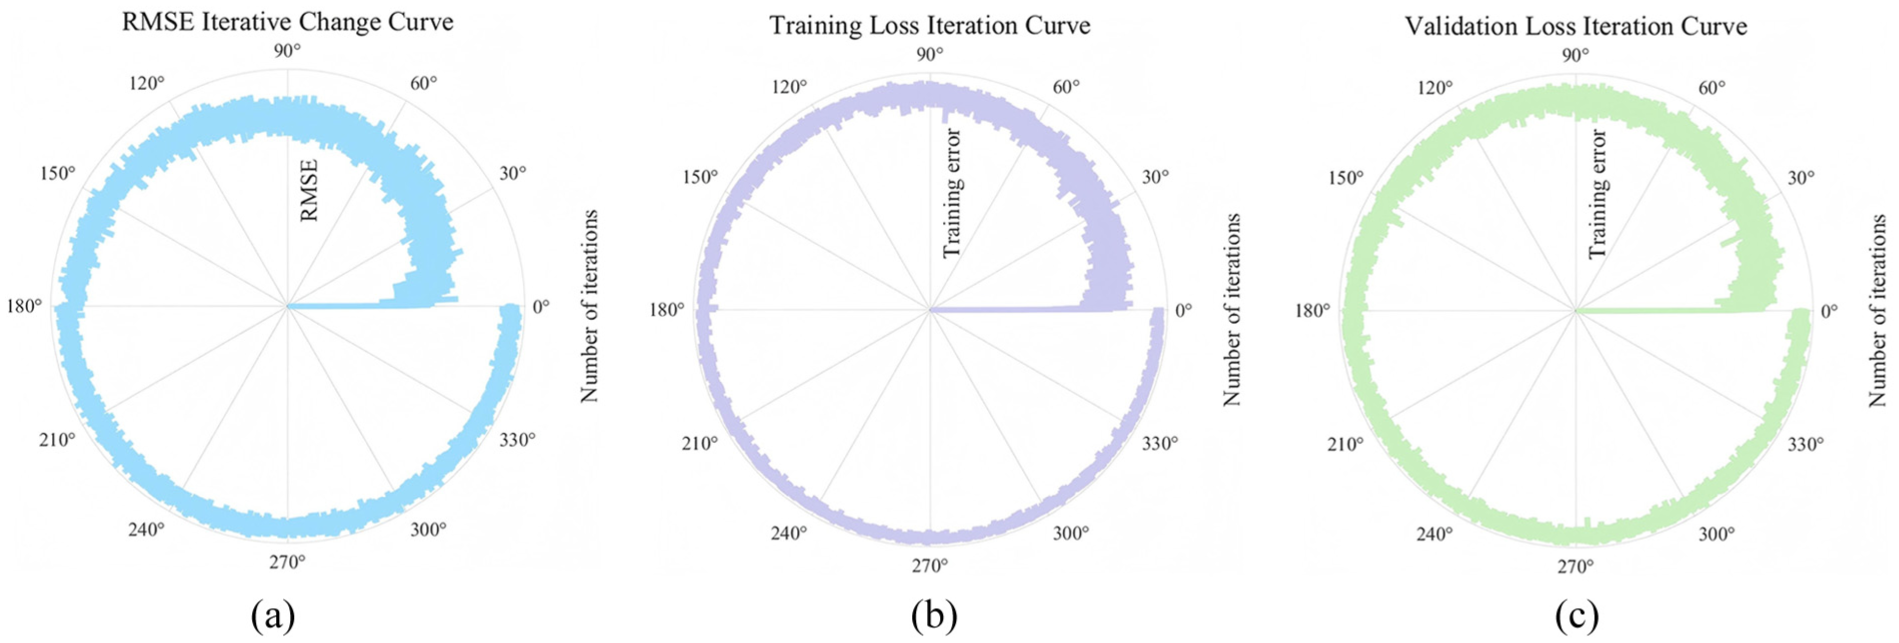
Model training loss function curve: (a) RMSE iteration change curve, (b) training loss, and (c) validation loss.
PSD results and error analysis
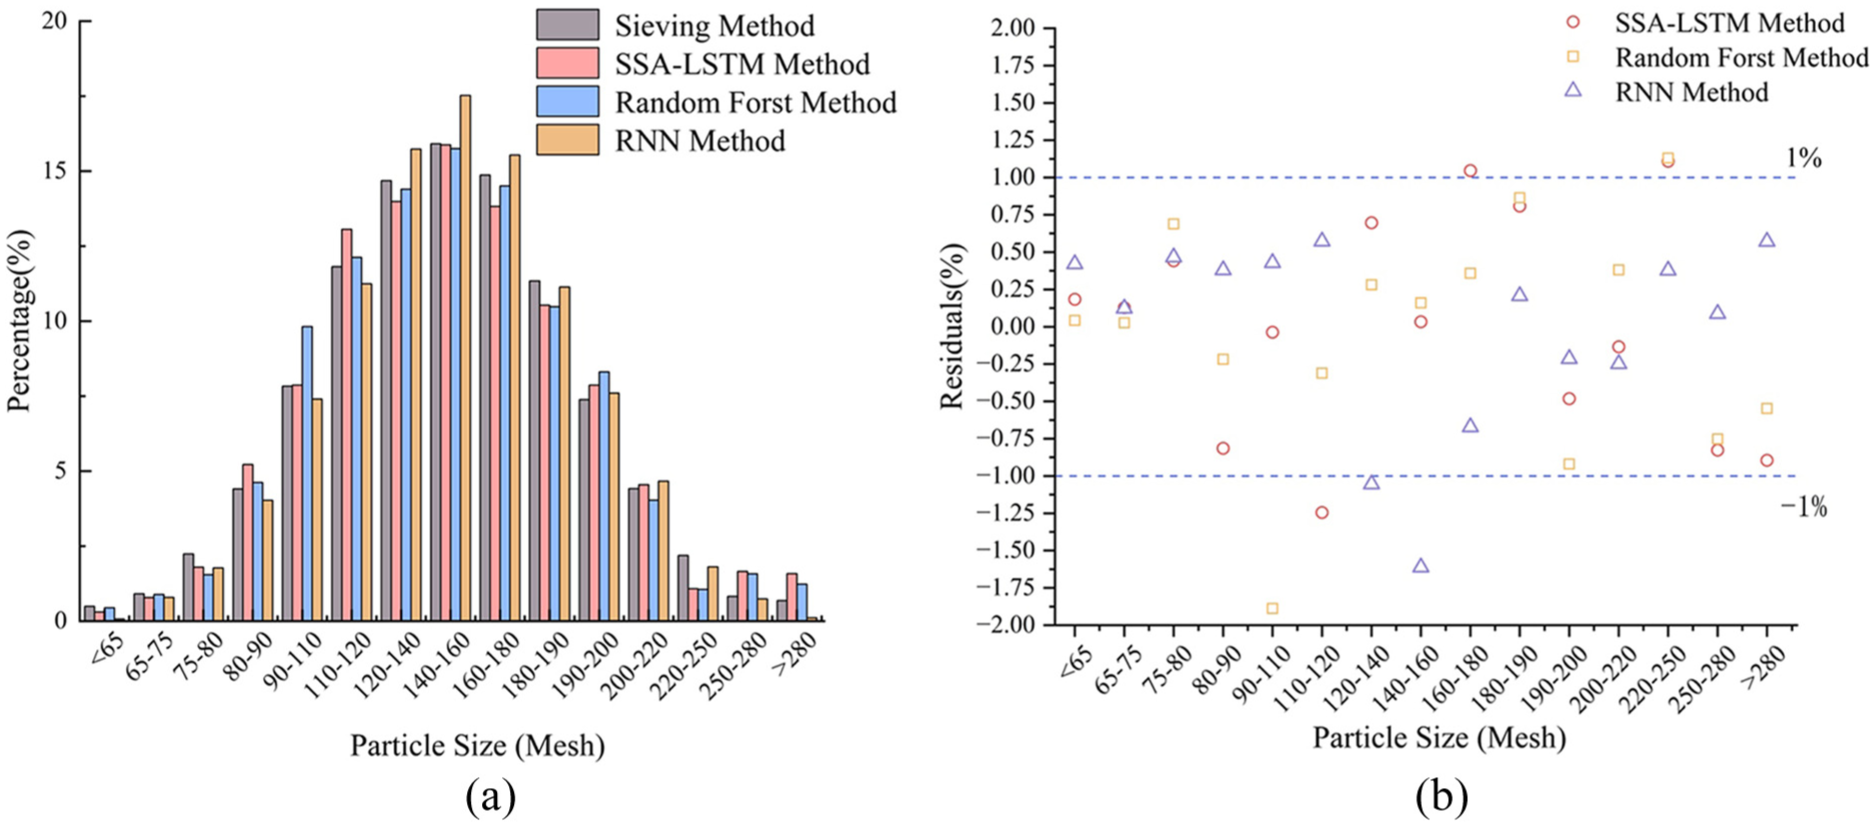
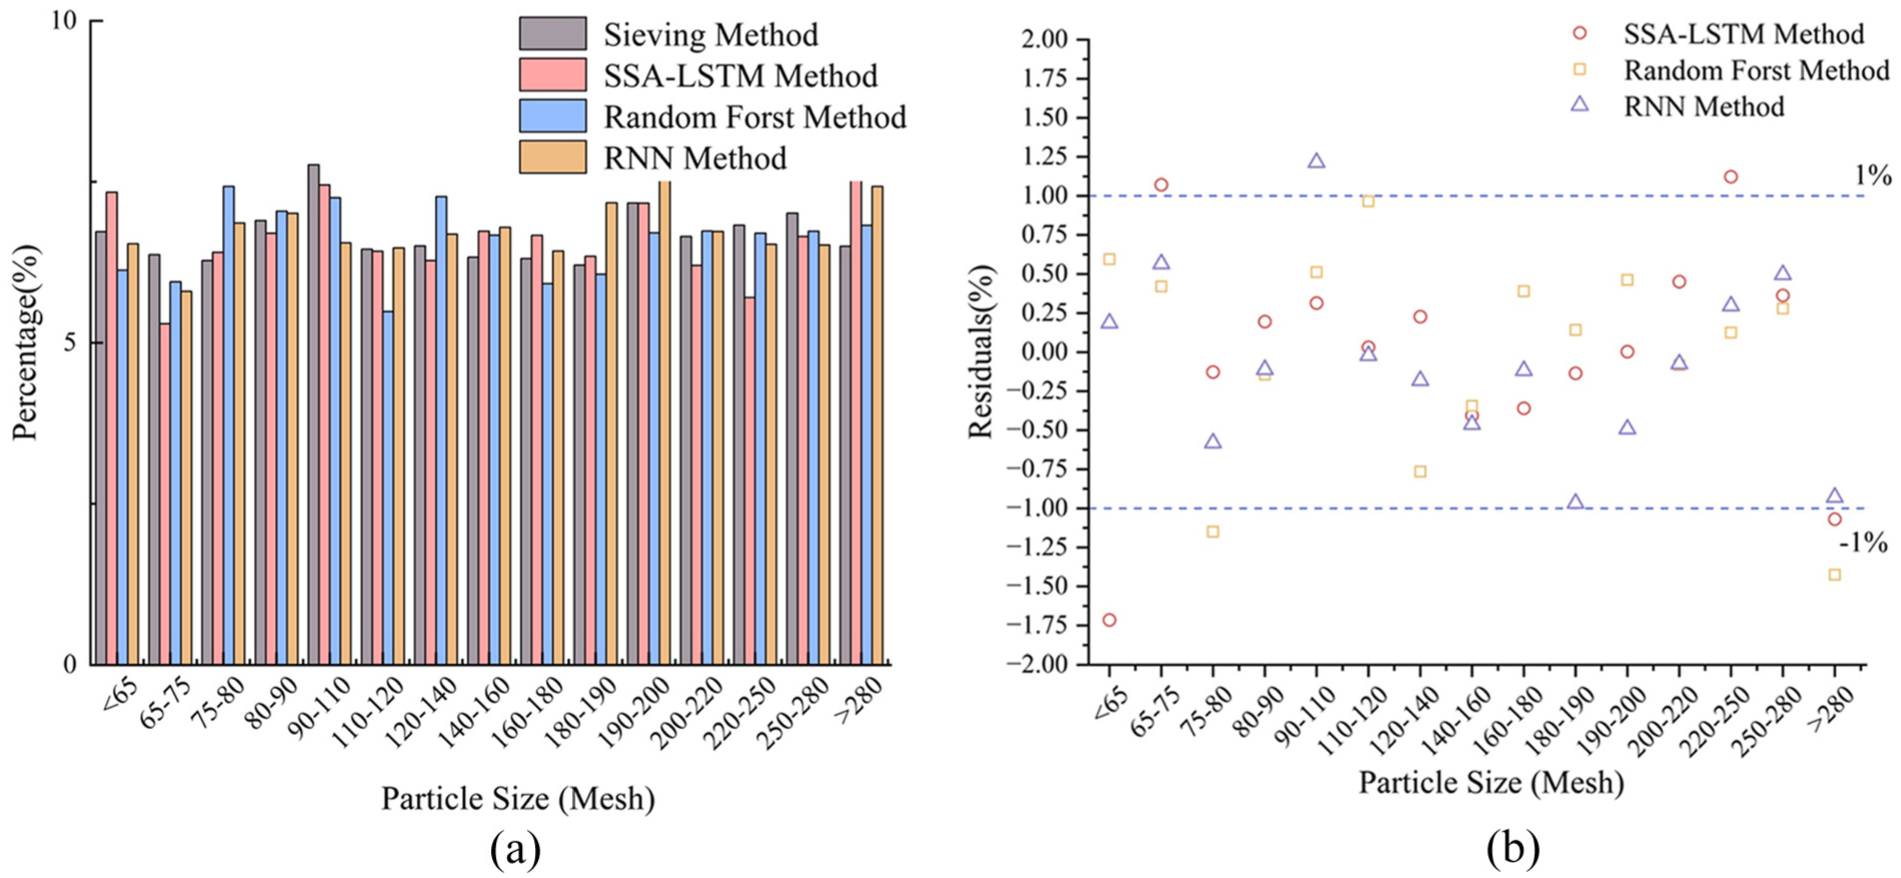
To comprehensively assess the adaptability and robustness of the proposed SSA-LSTM model, its performance was evaluated using an independent validation dataset comprising four representative PSD patterns: a normal distribution, a uniform distribution, a random distribution, and a specially designed discontinuous distribution simulating complex condition. As shown in Figures 9 to 12, both qualitative and quantitative comparisons were performed between the predictions generated by the SSA-LSTM model and those obtained using the standard sieving method, Random Forest, and a conventional RNN approach.
Comparison of three methods for the normal distribution of Sample A: (a) Sample A predicted distribution and (b) Sample A residual plot.
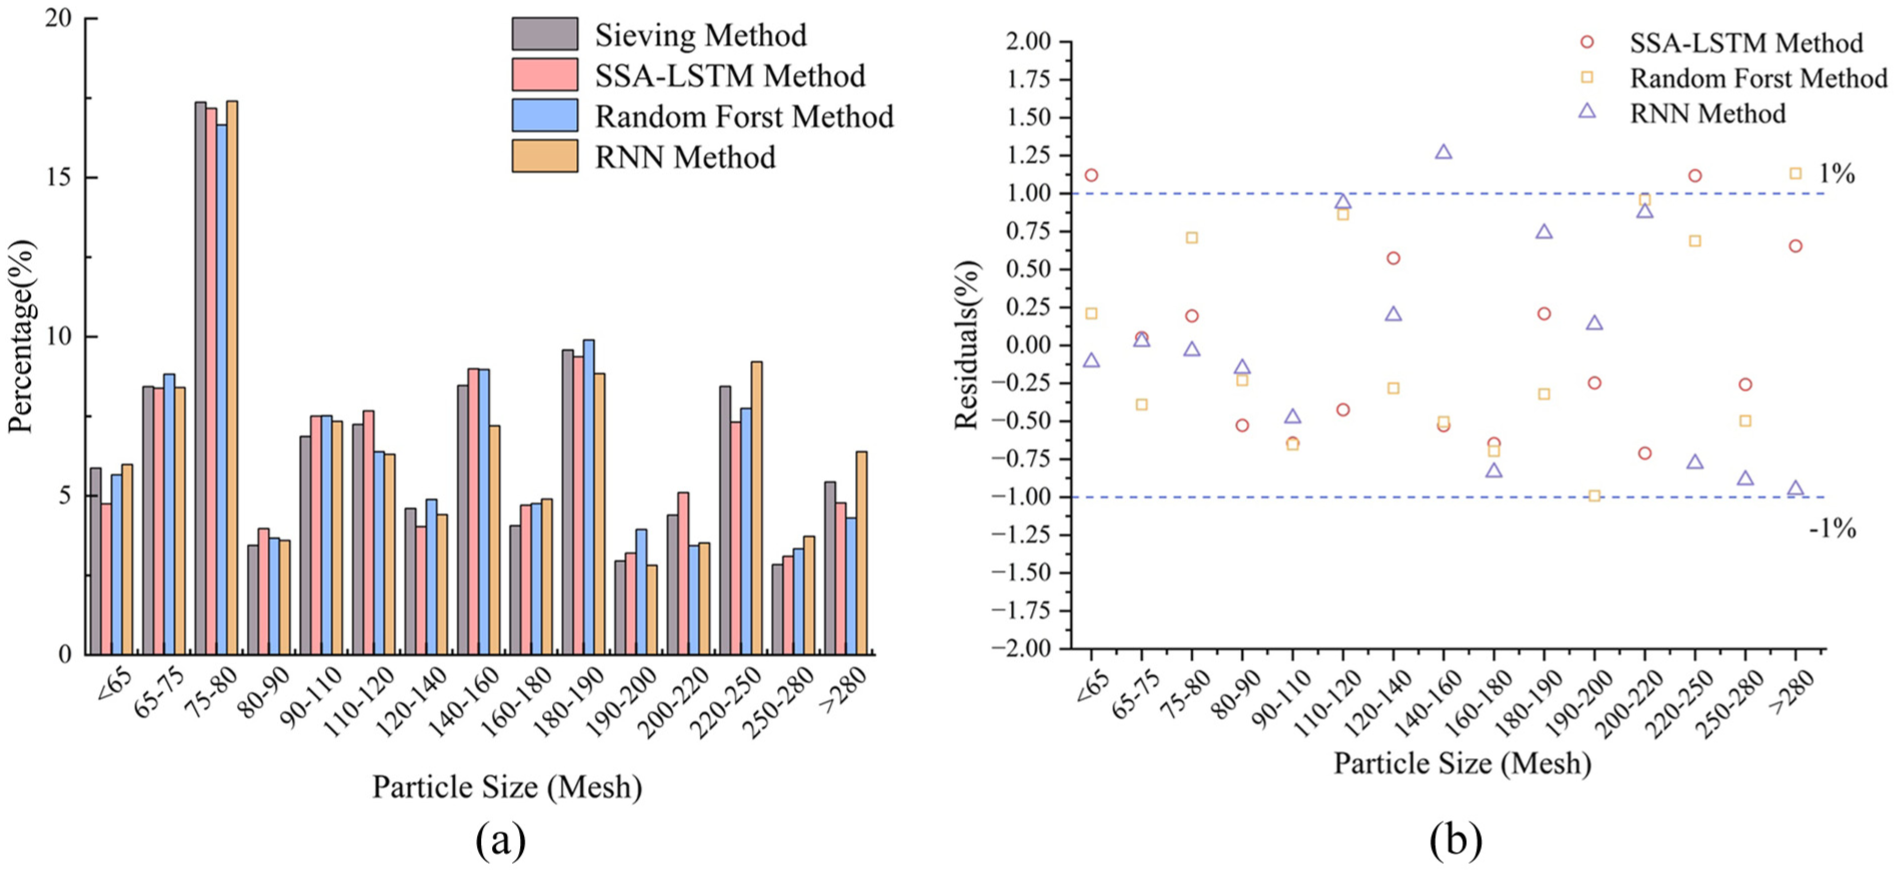
Comparison of three methods for the normal distribution of Sample B: (a) Sample B predicted distribution and (b) Sample B residual plot.
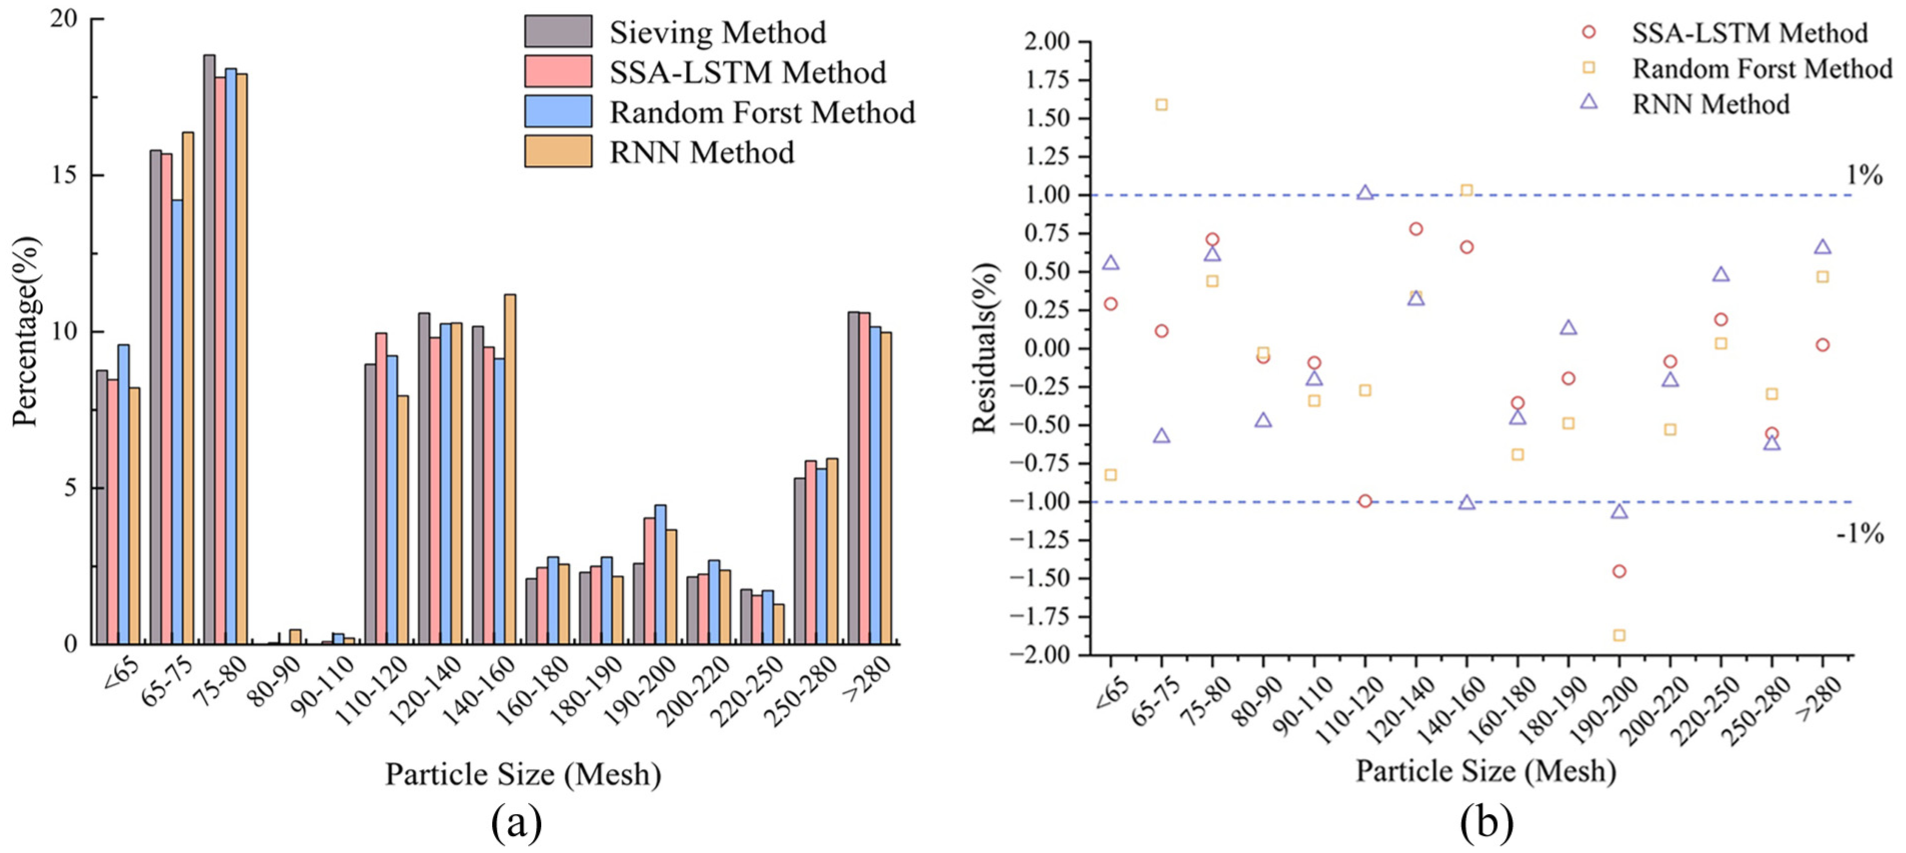
Comparison of three methods for the normal distribution of Sample C: (a) Sample C predicted distribution and (b) Sample C residual plot.
Comparison of three methods for the normal distribution of Sample D: (a) Sample D predicted distribution and (b) Sample D residual plot.
For the normal distribution, the SSA-LSTM model demonstrates the highest consistency with the reference sieving curve, maintaining residuals within ±1%, which indicates excellent fitting accuracy. In comparison, both the Random Forest and RNN methods show larger deviations, with the RNN exhibiting slight underfitting near the peak region. For the uniform distribution, all three models successfully reproduce the overall flat pattern; however, the SSA-LSTM displays moderate boundary bias. The Random Forest performs slightly better at the edges, while the RNN produces oscillatory predictions, reflecting reduced stability. In the case of the random distribution, the SSA-LSTM model shows strong adaptability, accurately capturing local fluctuations in particle composition. By contrast, the Random Forest tends to over-smooth minor peaks, and the RNN fails to capture subtle variations due to its limited capacity to model nonlinear temporal dependencies. For the discontinuous distribution, the SSA-LSTM model clearly outperforms the other methods, correctly identifying “zero-content” intervals and avoiding false peaks. Both the Random Forest and RNN methods, however, generate spurious responses in these discontinuous regions. Overall, these results demonstrate that the SSA-LSTM model provides superior accuracy, adaptability, and robustness across diverse PSD patterns, particularly for complex and discontinuous distributions where traditional machine-learning methods show significant limitations.
To quantitatively assess the performance differences among the models, we employed the coefficient of determination
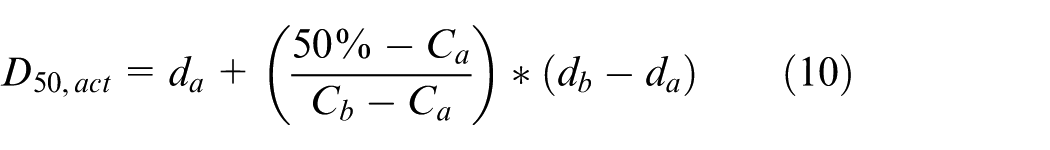
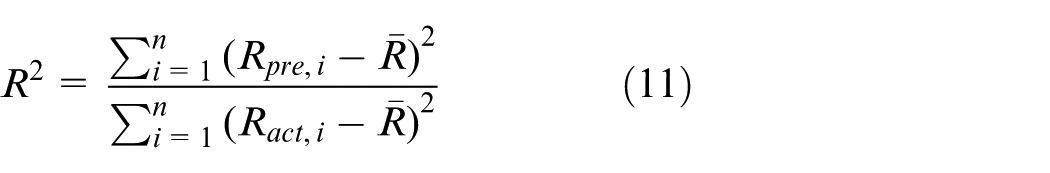
In the equation: the
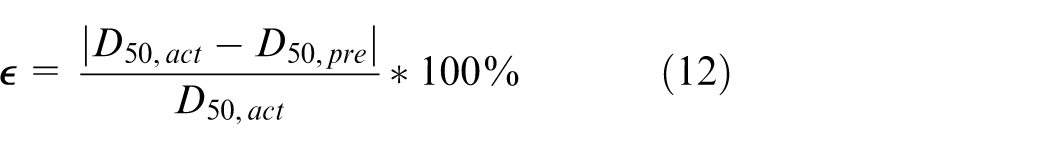
As summarized in Table 2, the SSA-LSTM model consistently outperforms both the Random Forest and RNN methods across all four representative PSD patterns. For the normal and uniform distributions, the SSA-LSTM achieves R2 values exceeding 0.90, demonstrating strong agreement between predicted and measured particle-size fractions. Slight deviations are observed near the boundaries of the uniform distribution, indicating a marginal reduction in fitting accuracy when particle-size fractions are evenly distributed. In contrast, the Random Forest and RNN methods exhibit lower R2 values and higher RMSEs, reflecting reduced predictive capability and stability, particularly during smooth transitions in particle size. When the distribution pattern becomes random or discontinuous, the superiority of the SSA-LSTM model becomes even more pronounced. The R2 increases to 0.98, while the RMSE decreases from 0.80 to 0.59 a 26% improvement over the Random Forest model. Moreover, the median diameter error (ϵ) drops from 5.53% to 2.07%, highlighting the model’s enhanced precision in reproducing key particle-size characteristics. The RNN method, although maintaining moderate performance, shows limited capacity to capture abrupt PSD fluctuations and nonlinear dependencies. Overall, these results confirm that the SSA-LSTM model delivers superior accuracy, adaptability, and robustness across diverse PSD patterns, particularly under complex and discontinuous conditions, while its slight boundary bias in uniform distributions remains acceptable within the high-precision context of ultrasonic PSD inversion.
Comparison of granularity prediction results between SSA-LSTM model and random forest method.
Model interpretability analysis
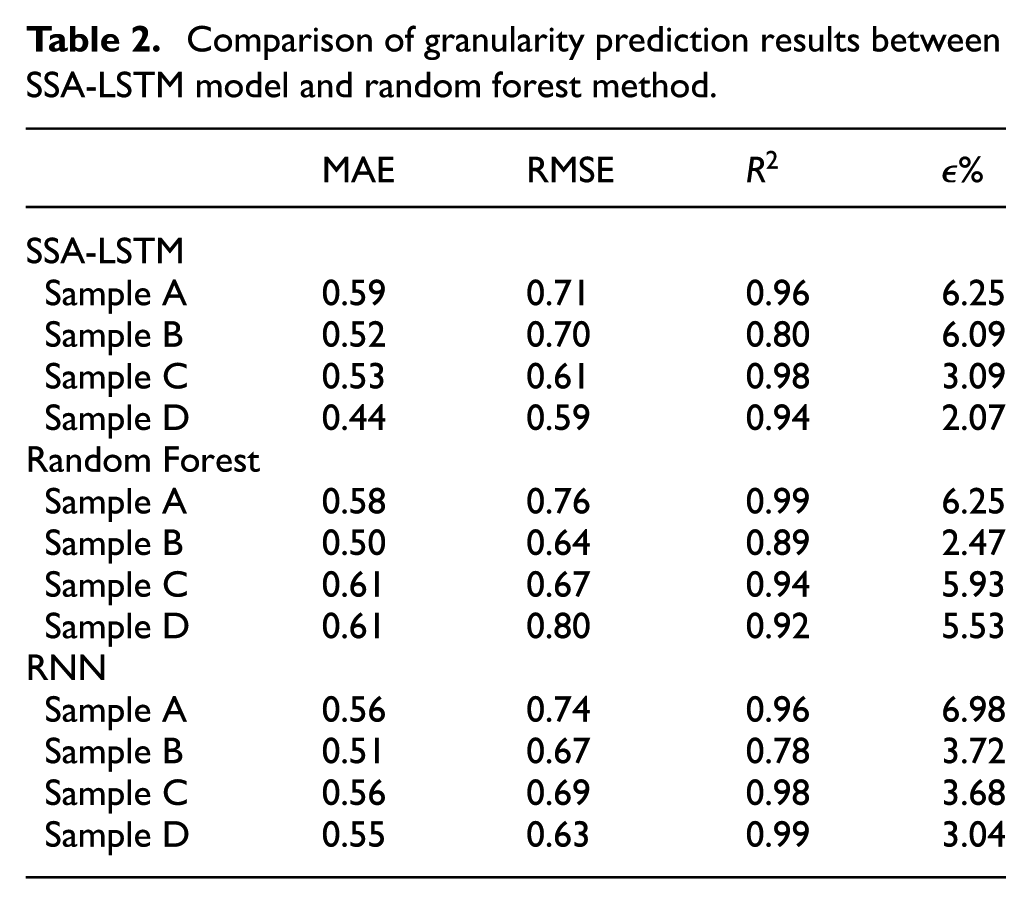
Although the SSA-LSTM model exhibits strong capability in handling complex nonlinear mapping tasks, its inherent complexity gives rise to the “black box” problem. To address this, we employed the game-theoretic SHapley Additive exPlanations (SHAP) framework for in-depth interpretability analysis of the trained model. The 10 input features are defined as follows: main echo FFT amplitude, secondary echo FFT amplitude, tertiary echo FFT amplitude, main echo amplitude, secondary echo amplitude, tertiary echo amplitude, main attenuation coefficient, secondary attenuation coefficient, frequency, and volume concentration. We perform global feature importance and local prediction attribution analysis on the model, as shown in Figures 13 to 17.
Interpretable Analysis of Sample A: (a) Sample A local interpretability heatmap and (b) Feature Importance Ranking of Sample A.
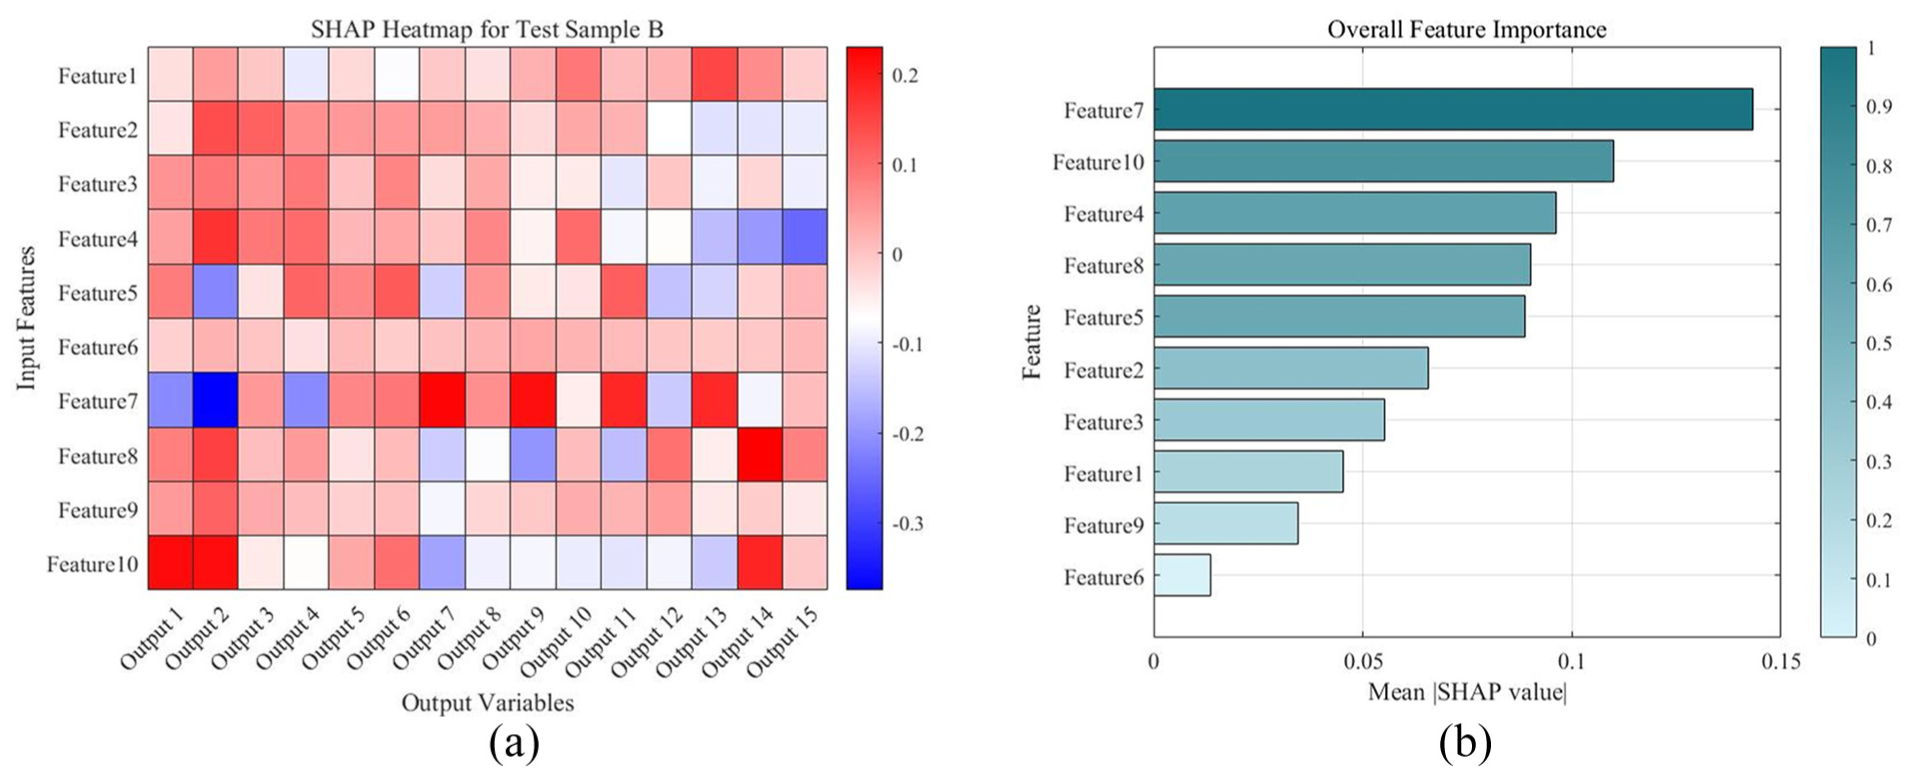
Interpretable Analysis of Sample B: (a) Sample B local interpretability heatmap and (b) Feature Importance Ranking of Sample B.
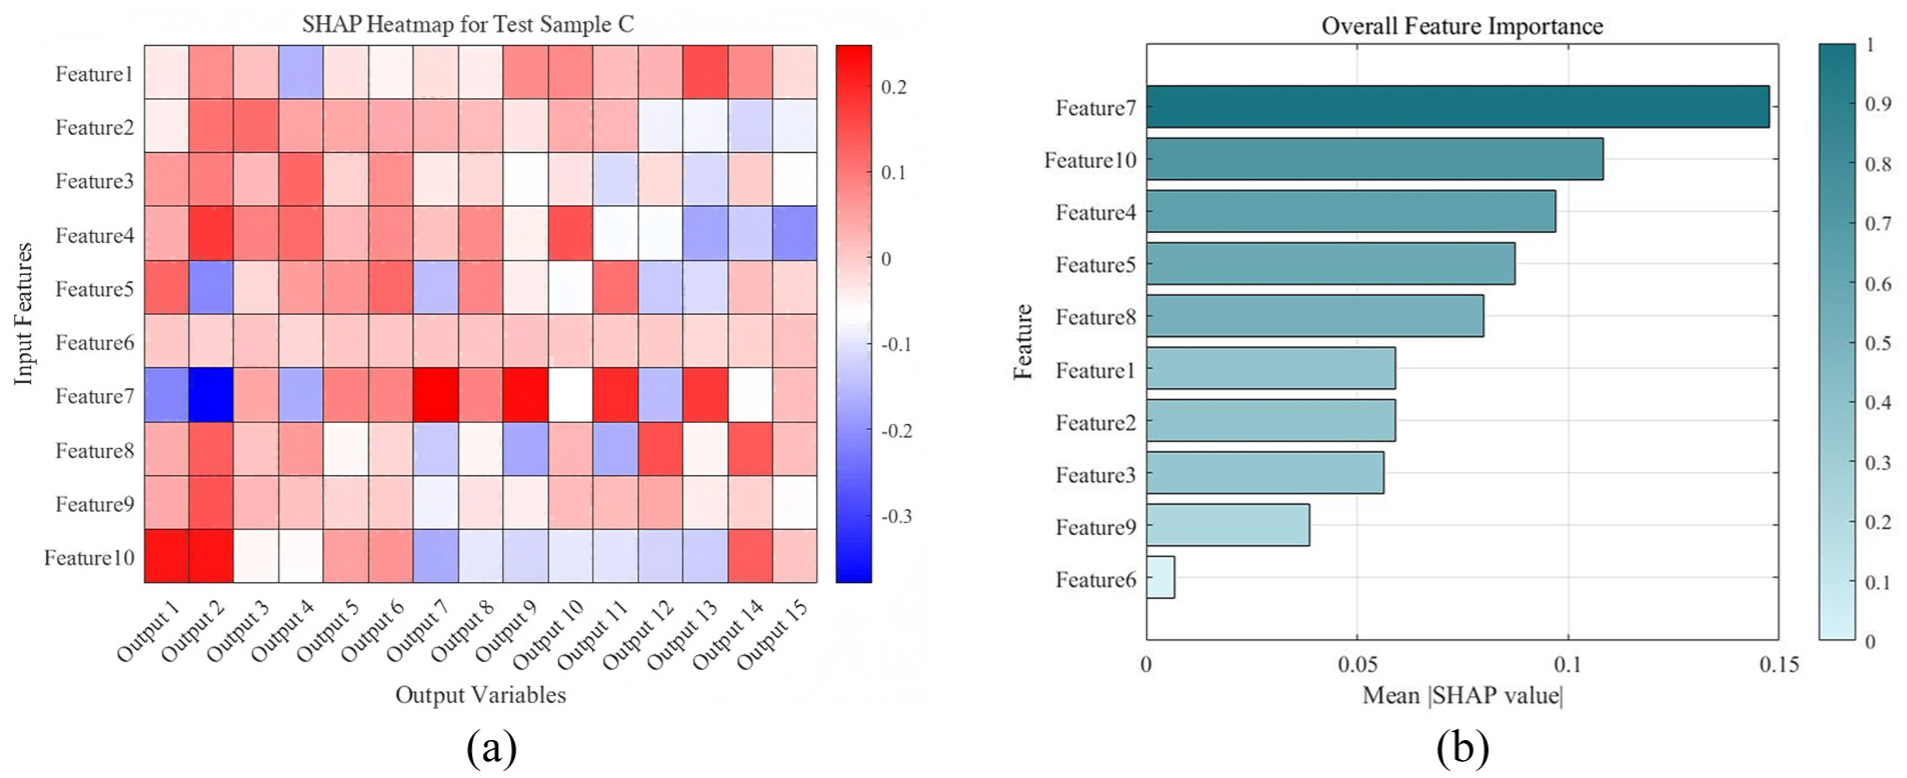
Interpretable Analysis of Sample C: (a) Sample C local interpretability heatmap and (b) Feature Importance Ranking of Sample C.
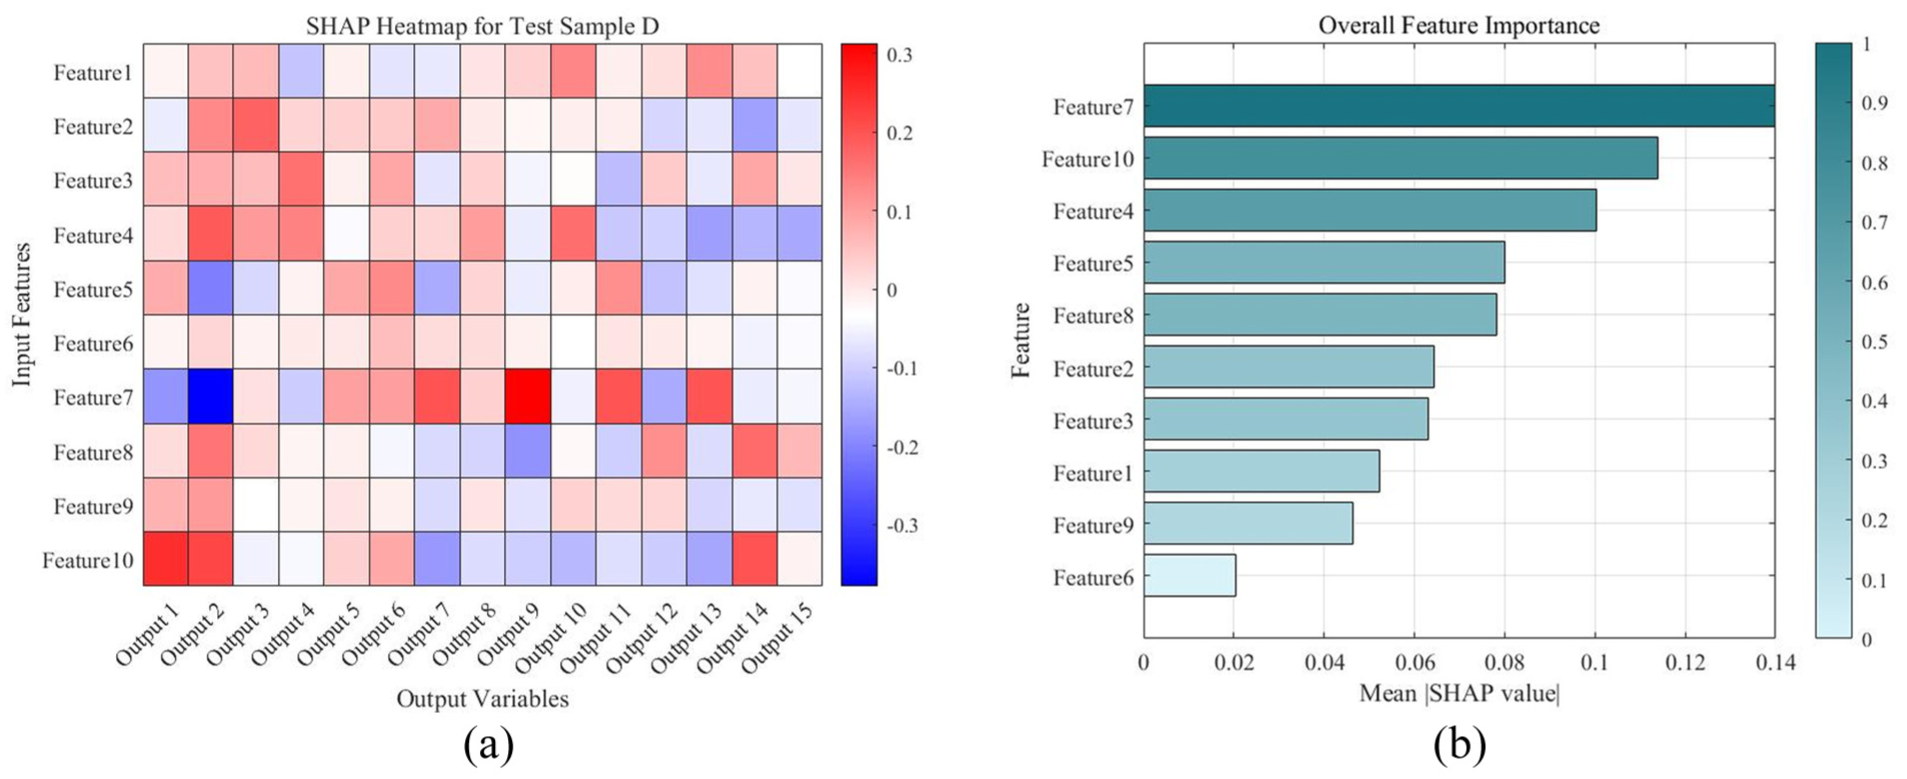
Interpretable Analysis of Sample D: (a) Sample D local interpretability heatmap and (b) Feature Importance Ranking of Sample D.
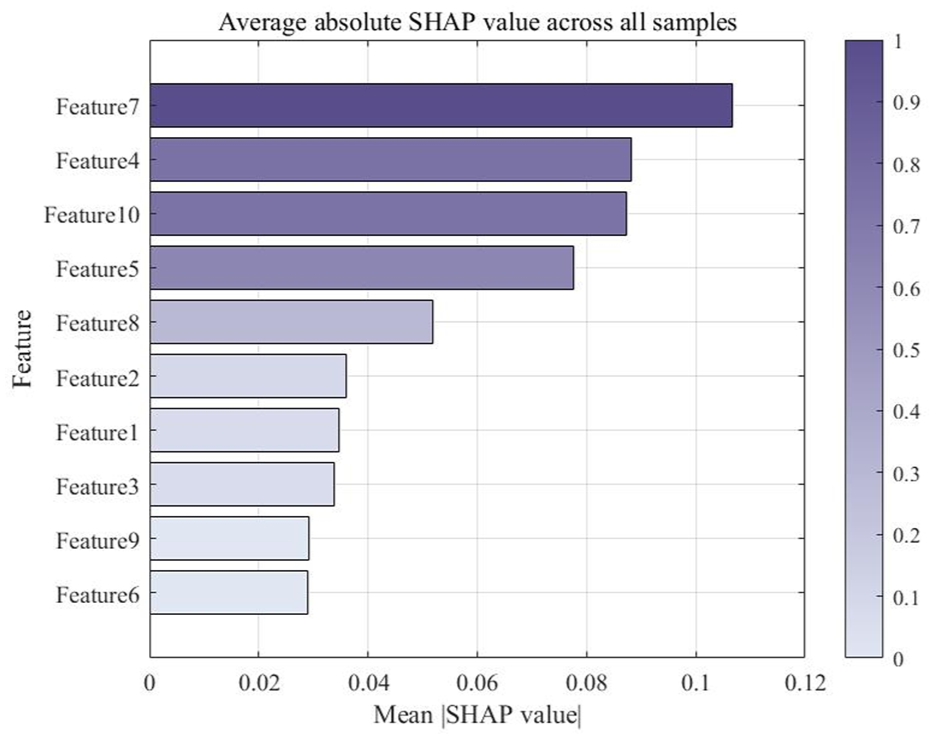
Average absolute SHAP value across all samples.
SHAP explainability analysis of the SSA-LSTM model not only confirms its strong alignment with intrinsic decision logic and physical principles but also provides deep insights into its predictive behavior. As shown in Figure 17, the global feature importance analysis indicates that the attenuation coefficient and volume concentration are the primary drivers of the model’s predictions, a result fully consistent with acoustic theory. The attenuation coefficient is particularly important because it is not an isolated parameter but a comprehensive physical indicator. As described in equations (2) and (3), the acoustic attenuation coefficient is a complex function that couples multiple key physical quantities, including particle size, concentration, sound wave frequency, and the viscous and thermodynamic properties of the medium. Consequently, the attenuation coefficient inherently encodes the most comprehensive information about the particle system. During training, the model autonomously identifies this feature as having the highest information density and assigns it the greatest decision weight, enabling accurate inversion from a single, comprehensive metric to the final PSD. Importantly, this analysis also provides insight into the SSA-LSTM model’s slightly poorer performance at the boundaries when predicting uniform distributions. As illustrated in Figure 14, when processing the flat spectral signal of this sample, the model’s powerful sequence-pattern recognition occasionally misinterpreted the pattern. Drawing on the inertial learning from samples with pronounced peak-and-valley structures in normal distributions, the model exhibited a systematic bias for uniform distributions. This observation suggests that this weakness is an inherent byproduct of the model’s strong sequence-context learning capability. It further highlights that traditional machine-learning methods, such as Random Forest, or sequence models with weaker long-term dependency modeling, such as standard RNNs, may retain certain local advantages when handling flat or low-contrast spectral signals.
Conclusion
This study introduces an innovative approach for PSD measurement that integrates particle physical parameters, ultrasonic attenuation experiments, the SSA, and LSTM networks. Guided by prior knowledge from the ECAH model, a theory-driven feature engineering strategy was employed to extract 10 salient features from the ultrasonic data. These features were then used to train an LSTM predictor, with hyperparameters globally optimized via SSA, establishing an end-to-end nonlinear mapping from experimental features to outputs across 15 particle-size intervals. Rigorous validation on four representative distributions normal, uniform, random, and non-continuous demonstrates the model’s strong predictive accuracy and robustness: the coefficient of determination exceeds 0.80 for all samples, and the median diameter error is as low as 2.07%, closely matching standard sieve analysis. Incorporating the SHAP interpretability framework further elucidates the model’s internal decision logic, providing a comprehensive, reliable, and explainable solution that overcomes the inherent limitations of traditional physics-based inversion methods.
Footnotes
Appendix
Ethical considerations
Our institution does not require ethics approval for reporting individual cases or case series.
Consent to participate
This study did not involve human participants; therefore, informed consent to participate was not required.
Consent for publication
This manuscript does not contain any individual person’s identifiable data or images; consent for publication is not applicable.
Author contributions
Jiawei Xu contributed to the conceptualization and methodology of the study and was primarily responsible for drafting the manuscript.
Zhanhong Shi contributed to the study design and methodology.
Ya Xu, Tong Liu, and Tiejun Liu participated in data collection and experimental implementation.
Dailiang Xie conducted data analysis and contributed to manuscript revision.
Zhengcheng Qin and Dailiang Xie supervised the research and served as corresponding authors.
All authors reviewed and approved the final manuscript.
Funding
The authors disclosed receipt of the following financial support for the research, authorship, and/or publication of this article: This work is supported by National Key Research and Development Project#2022YFC3204500.
Declaration of conflicting interests
The authors declared no potential conflicts of interest with respect to the research, authorship, and/or publication of this article.
Data availability statement
The datasets generated during and/or analyzed during the current study are not publicly available due The data contain sensitive information and cannot be shared publicly but are available from the corresponding author on reasonable request.