
Abstract
The conversion of ultrasonic particle size distribution (PSD) is traditionally modelled as a first-kind Fredholm integral equation problem, requiring integration with theoretical models to calculate the PSD. In this paper, we propose a novel machine learning-based approach for PSD measurement using an ultrasonic–physical property parameter fusion model coupled with a random forest algorithm. This method employs feature and label parameter training to construct a random forest model that predicts the PSD from input feature parameters, eliminating the need for complex theoretical model selection and inversion algorithms. Forty sets of experimental samples were used to obtain feature parameters for PSD prediction. The results, comparing the predicted PSD of three differently distributed suspended sediment samples with those obtained through a screening method, demonstrate coefficients of determination all above 0.8 and median diameter errors of 6.25%, 2.47% and 1.64%, respectively. In addition, we compared the proposed model with traditional inversion algorithms and the artificial bee colony algorithm, demonstrating that the random forest-based method delivers more accurate and reliable PSD measurements. These findings highlight the potential of this approach as a promising alternative for future studies.
Keywords
Introduction
Accurate measurement of the particle size distribution (PSD) of suspended sediment in rivers, lakes, oceans and ecosystems is essential for understanding sediment transport and its effects on aquatic environments, including soil erosion protection and water conservancy construction. Variations in PSD can significantly impact sediment transport capacity, influencing processes such as reservoir sedimentation and coastal geomorphology evolution.1,2 For example, sediment transport capacity is influenced by particle size, with larger particles leading to reduced transport efficiency and increased reservoir sedimentation. Thus, PSD is a critical parameter for characterising sediment dynamics. 3 In addition, understanding PSD enhances predictions of riverbed changes and coastal morphology, as it directly affects suspended sediment transport and coastal landscape formation. 4 Combining observations from river segments with satellite remote sensing provides a foundation for broader studies on sediment dynamics in plateau regions. 5
Particle size measurement methods are generally categorised into screening, microscopy, sedimentation, light scattering and ultrasonic methods. Among these, ultrasonic measurement stands out due to its advantages, including noncontact measurement, strong penetration capability, and simple operation. These benefits have led to its widespread adoption by researchers both domestically and internationally. Hukkanen and Braatz employed in situ laser backscattering during suspension polymerisation to monitor particle size and distribution in real time. 6 Xue et al. used ultrasonic echoes to construct an attenuation spectrum in high-concentration sulphur pulp, combining it with a coupled phase model and optimal regularisation to determine the particle size distribution. 7 Zhang et al. used ultrasonic attenuation and phase velocity spectra, along with the Epstein Carhart Allegra Hawley (ECAH) model, to inversely calculate the particle size distribution of suspended sediment. 8 In addition, Li et al. utilised the artificial bee colony algorithm to optimise particle size calculations. 9 Wang et al. introduced a method based on visible near-infrared trichromatic multispectral characterisation with a GBRT machine learning algorithm, forming an integrated model for rapid particle size measurement in suspensions. 10 The inversion calculations in these models consider the coupling effects of multiple factors, such as concentration, shear and heat scattering. These calculations require solving complex Fredholm integral equations of the first-kind, making them dependent on selecting an appropriate inversion algorithm.
Machine learning techniques leverage data features and outcomes to train models and make predictions. Many researchers have applied machine learning algorithms in the field of particle size distribution (PSD) measurement. For example, Kazemi et al. applied multiple linear regression, artificial neural networks, and genetic algorithms to create models predicting whether the particle size of ground powder falls within the 250 µm range. 11 Cai et al. employed a convolutional neural network to extract microscopic image features of mixed particles and developed a classifier to categorise these particles. 12 Cao et al. used support vector machines to identify oil droplet images and determine their particle size. 13
Various other machine learning models have also been widely used in the field of PSD measurement.14–16 Notably, the random forest algorithm offers distinct advantages for multioutput regression problems. For example, when using remote sensing data to estimate wheat biomass, random forest regression has been shown to outperform support vector machines and artificial neural networks in terms of prediction accuracy. 17 de Miranda Ramos Soares et al. applied the random forest algorithm to model and predict the adsorption process of methylene blue dye onto residual agricultural biomass. 18 Chen et al. compared various decision tree models, including the random forest model, in terms of predicting landslide susceptibility and found that the random forest model achieved the highest predictive accuracy. 19 Schonlau and Zou applied the random forest algorithm to predict thistle pollen concentrations, outperforming other methods by integrating historical data with multiple predictive variables. 20
Furthermore, Seyyedattar et al. employed both the LightGBM and random forest algorithms to predict hydrogen absorption in metal–organic frameworks (MOFs). 21 In oncology, Pellegrino et al. employed random forests to predict tumour somatic mutations, providing a powerful predictive tool for cancer research. 22 In chemistry, Fang et al. applied random forests to predict the toxicity of chemical substances to Tetrahymena pyriformis. 23 Wang et al. proposed a random forest model to predict the density and surface tension of deep eutectic solvents (DESs). 24 Additionally, Sipper and Moore effectively applied random forests to process diverse dataset subsets in conservation-related challenges. 25
The random forest algorithm uses multiple decision trees for multioutput regression, enabling it to determine relationships between results while ensuring that the sum of total predictions equals one. This contrasts with other algorithms, in which such a relationship may not hold. This feature makes the random forest algorithm particularly well-suited for PSD prediction because the sum of the predicted particle sizes must equal the total sample size.
This work proposes a particle size distribution measurement method that integrates particle property parameters, ultrasonic attenuation experimental parameters and a random forest algorithm. The glass microbeads with 17 different particle size intervals were prepared by using the sieving method as suspended mass solution samples. Three samples with unimodal, uniform, and random distributions were selected for comparison. By analysing the prior parameters of the ECAH model and ultrasonic phenomena, 10 features, such as the concentration of the suspended mass solution, attenuation coefficient, ultrasonic voltage and amplitude after Fourier transformation, were selected as the characteristic parameters for the random forest algorithm. A prediction model was developed through training. The characteristic parameters of the three samples were input into the model to obtain the prediction results. Finally, the model’s performance was evaluated on the basis of the error of the median particle size diameter and the determination coefficient. This work aims to simplify the particle size distribution solution process by combining particle characteristics with a random forest algorithm, using characteristic parameters and particle size distribution label data to achieve accurate and rapid measurement of the particle size distribution of suspended masses.
Dataset production
Overall research approach
The methodology adopted in this research is divided into two primary parts: dataset production and model training. First, data were collected through ultrasonic attenuation experiments. Parameters related to particle size were selected on the basis of theoretical models, such as the ECAH model and empirical observations. These parameters were used to create the training and validation datasets. The feature selection process was conducted manually, considering both theoretical and experimental relevance, ensuring that the selected features are strongly correlated with the particle size distribution (PSD). The training dataset was used to develop the predictive model using the random forest algorithm, whereas the test dataset was used to validate the model’s performance. The random forest model was trained to predict the PSD on the basis of the selected characteristic parameters, and its effectiveness was evaluated using key metrics, such as the RMSE, MAE and R2. The overall research workflow is illustrated in Figure 1.
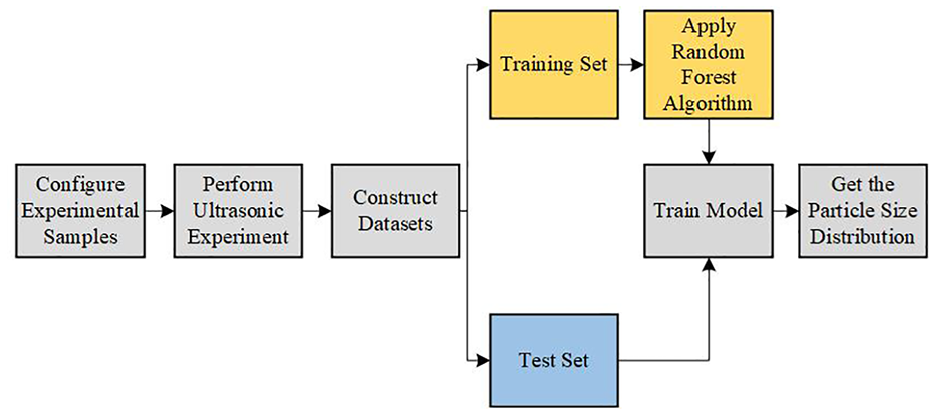
Overall research ideas.
To mitigate the inherent variability and noise introduced by the differing physical properties of sediment samples directly collected from natural water sources, this study used glass microspheres as experimental samples. Glass microspheres were selected for their consistent physical properties, which closely resemble those of natural sediments while minimising experimental noise and variability during inversion analysis.
The sieving method, a traditional technique for determining particle size distribution, was employed for sample preparation. In this method, particles are separated using mechanical vibration and passed through sieves with varying pore sizes. By comparing the mass of particles retained on each sieve with the total mass, the particle size distribution can be accurately determined. For this study, the experimental samples were prepared by using the sieving method, with standard sieving applied to glass microspheres through meshes of varying sizes. The target particle size ranges included <60, 60–65, 65–75, 75–80, 80–90, 90–110, 110–120, 120–140, 140–160, 160–180, 180–190, 190–200, 200–220, 220–250, 250–280, 280–320 and >320 µm, resulting in 17 sample groups, designated as a through q.
Following sieving, the mass of each mesh group was precisely measured by using a precision balance, and the samples were mixed to create the desired distributions. To simulate a variety of particle size distribution scenarios, 37 different sample groups with distinct distributions were configured as the experimental groups. Additionally, three control groups representing unimodal, uniform, and random distributions were prepared for comparison. This setup allowed us to assess the performance of our proposed method across a range of controlled and realistic particle size distribution conditions.
Experimental apparatus
A schematic diagram of the ultrasonic suspended mass parameter measurement system is shown in Figure 2. The system is composed of three main components: the signal generation module, the measurement module, and the data acquisition module. The core of the system includes two focused ultrasonic transducers, each with a spherical projection diameter of 90 mm, a wall thickness of 2.5 mm and a centre frequency of 750 kHz, constructed from PZT82 material. These transducers are positioned 170 mm apart and mounted on opposite sides of a plexiglass tank with inner dimensions of 400 mm × 200 mm × 170 mm and a wall thickness of 10 mm.
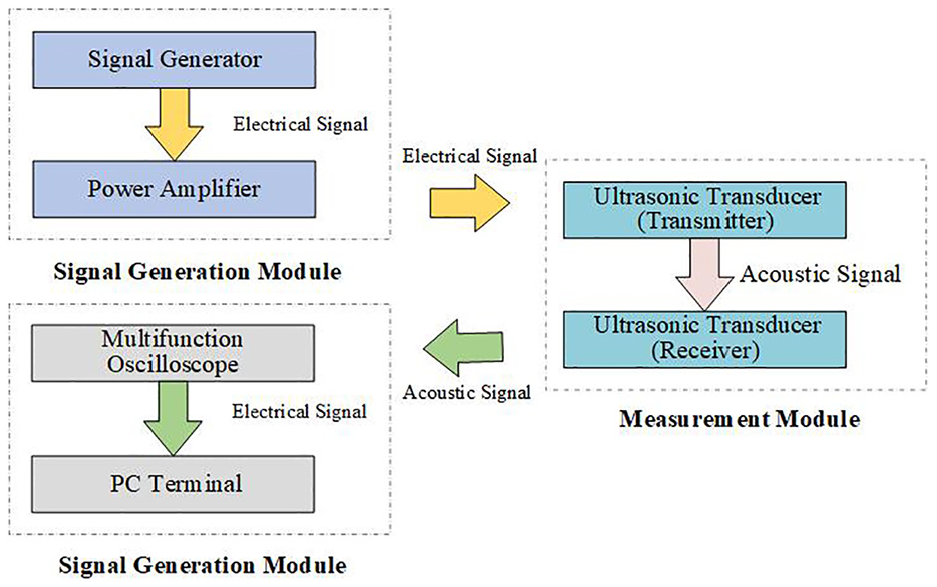
Schematic diagram of suspended sedimentation parameter measurement system.
The primary function of ultrasonic transducers is to convert acoustic signals into electrical signals and vice versa. The transmitter transducer transforms electrical signals generated by the power amplifier into ultrasonic waves, which travel through the suspended mass solution. As the ultrasonic signals propagate through the medium, they undergo attenuation and upon reaching the receiver transducer, partial reflections occur, generating echoes. The attenuation of the ultrasonic signals is observed as a stepwise reduction in the echo voltage amplitude.
The attenuation process is analysed by collecting the voltage amplitude changes from the receiver transducer using an oscilloscope while the transducer is immersed in the suspended mass solution. The measured voltage amplitudes provide valuable data for determining the particle size distribution by evaluating the attenuation characteristics of the ultrasonic waves as they propagate through the medium.
The ultrasonic suspended mass parameter measuring device is shown in Figure 3. The specific experimental steps are as follows: First, the suspended mass sample is added to the tank, and the solution is stirred using an electromagnetic stirrer to simulate the state of water flow under natural conditions. The signal generator is configured to produce a burst wave with the following parameters: 4 cycles, an amplitude of 2 Vpp, and a frequency determined by the experimental requirements. Finally, the oscilloscope collects the voltage signal from the focusing transducer at the receiving end.
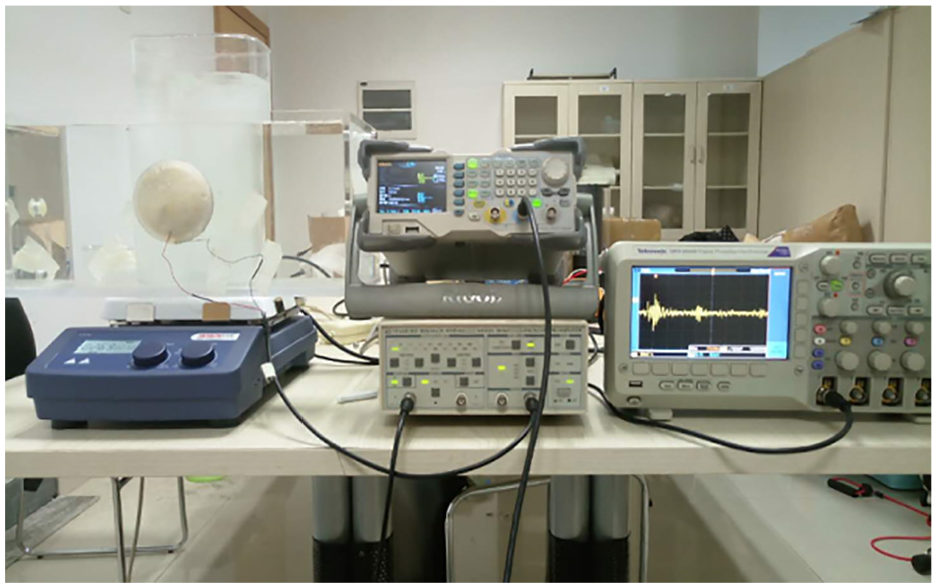
Suspended mass parameter measurement system.
The ultrasonic attenuation signal obtained from the experiment is depicted as the original signal in Figure 4. Each peak in the figure represents the voltage amplitude when the ultrasonic signal reaches the receiving transducer. Due to the presence of noise and the extremely weak intensity of the fourth signal, which renders it unreadable, only the third echo voltage is selected for further analysis.
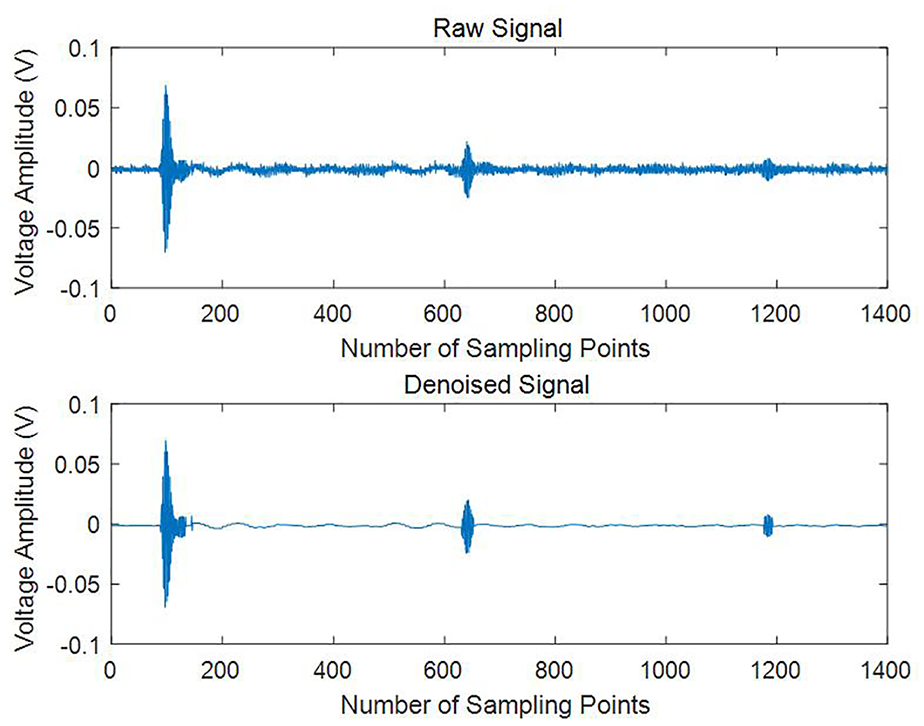
Original signal and denoising signal.
To facilitate accurate calculations, the wavelet threshold method is applied for signal denoising. 26 The denoising process involves the following steps:
1) Signal Decomposition: The original signal is decomposed into four distinct layers of components using wavelet transformation. This step enables the separation of noise from the true signal.
2) Threshold Filtering: A global threshold is applied to filter each layer of components. The threshold is selected to suppress noise while preserving the essential characteristics of the original signal that are relevant for particle size distribution analysis.
3) Signal Reconstruction: After filtering, the remaining components are reconstructed to produce the denoised version of the original signal. The resulting denoised signal is also shown in Figure 4, which illustrates significantly reduced noise and a clearer representation of the true attenuation pattern.
By employing the wavelet threshold method, the reliability and clarity of the ultrasonic attenuation data are substantially improved, thereby improving the accuracy of subsequent particle size distribution calculations.
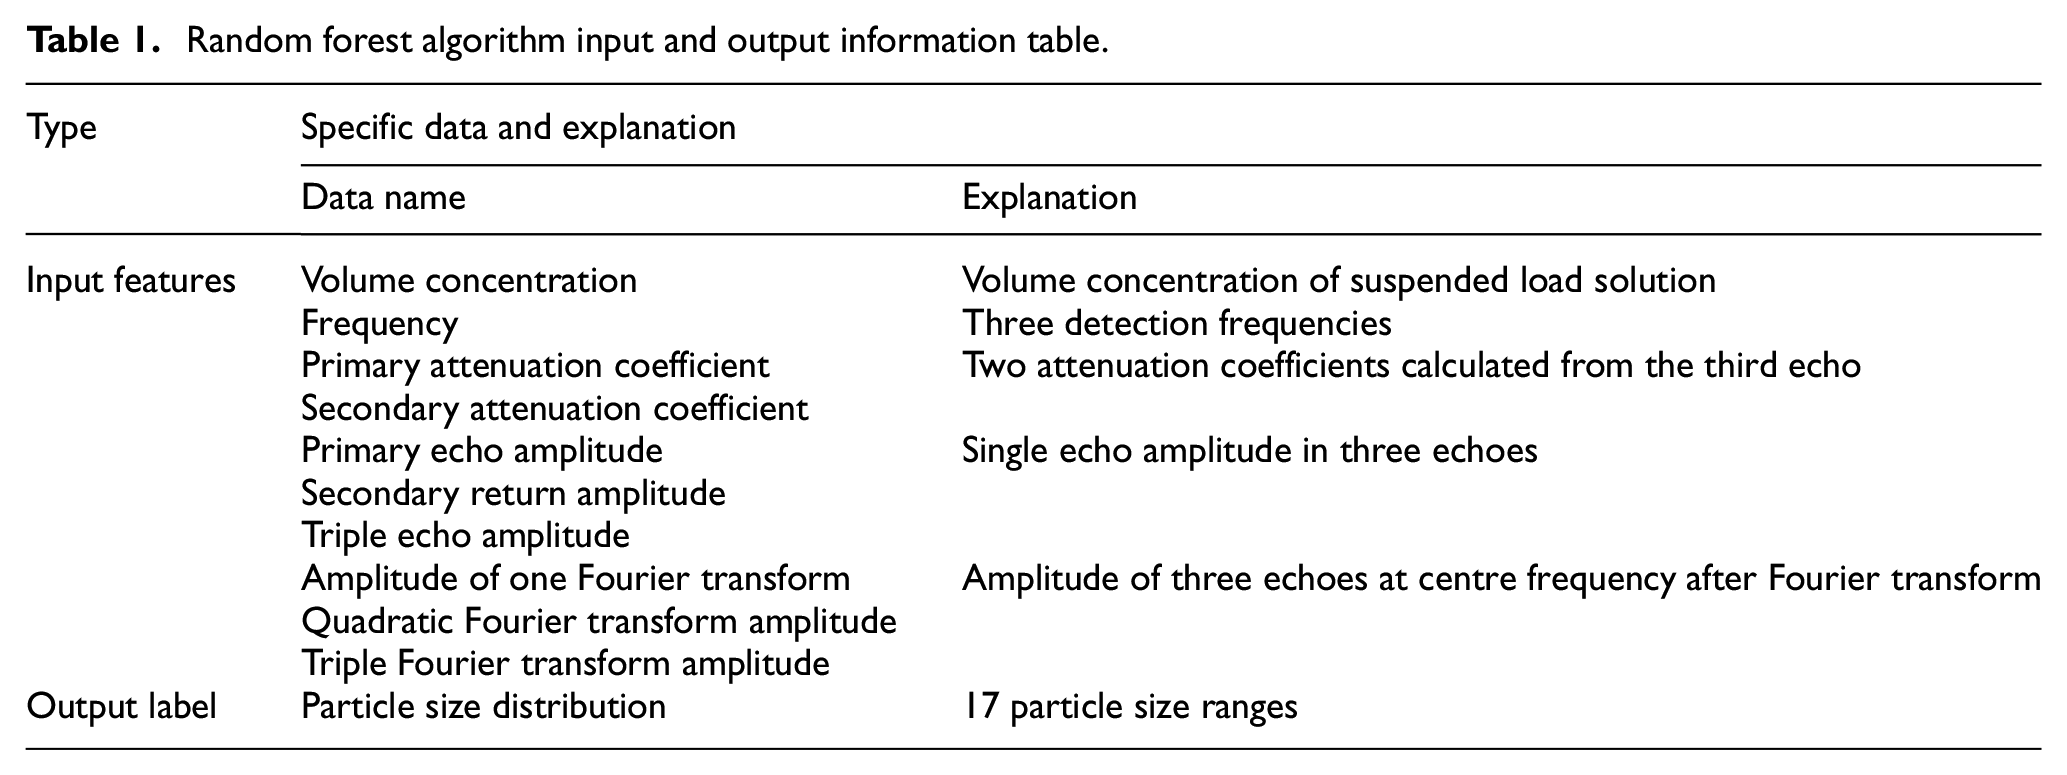
Feature selection
Before using the random forest algorithm, both the training and test datasets must be prepared. The dataset is divided into two components: characteristic parameters (features) and label parameters (targets). The label parameters represent the 17 particle size intervals determined previously, whereas the characteristic parameters were selected on the basis of previous knowledge from the ECAH model and ultrasonic attenuation phenomena. These include 10 parameters, such as the volume concentration of the suspended mass solution, acoustic attenuation coefficient, frequency, voltage amplitude and Fourier transform amplitude. These parameters were selected due to their theoretical and experimental relevance to the particle size distribution.
The ECAH model accounts for the combined effects of viscous attenuation, thermal attenuation and scattering attenuation of ultrasonic waves in aqueous solutions, describing the coupling relationships among the particle size distribution, concentration, and attenuation coefficient. This method is well-suited for the suspended sediment solution environment used in this experiment. When selecting features, the ECAH theoretical model can be combined with ultrasonic attenuation experiments to manually identify features that are closely related to particle size. The specific calculation relationship is shown in equation (1):
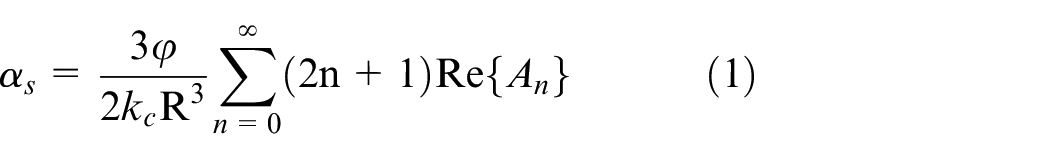
where
As shown in equation (1), suspended solutions with different particle size distributions and volume concentrations exhibit varying attenuation conditions. The particle size can therefore be derived from the acoustic attenuation coefficient and volume concentration. For this reason, these parameters are selected as characteristic parameters in this paper. The volume concentration is determined during the preparation of the suspended solution sample and is expressed as the percentage of the sample mass relative to the volume of the solution. The acoustic attenuation coefficient is calculated using the triple echo in Figure 5. To reduce the influence of clean water on ultrasonic attenuation, the acoustic attenuation coefficient of clean water is subtracted during the calculation. This yields the two-time acoustic attenuation coefficient of the ultrasonic signal in the suspended mass solution, as shown in equation (2).
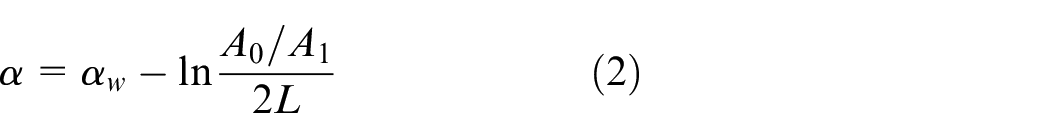
where
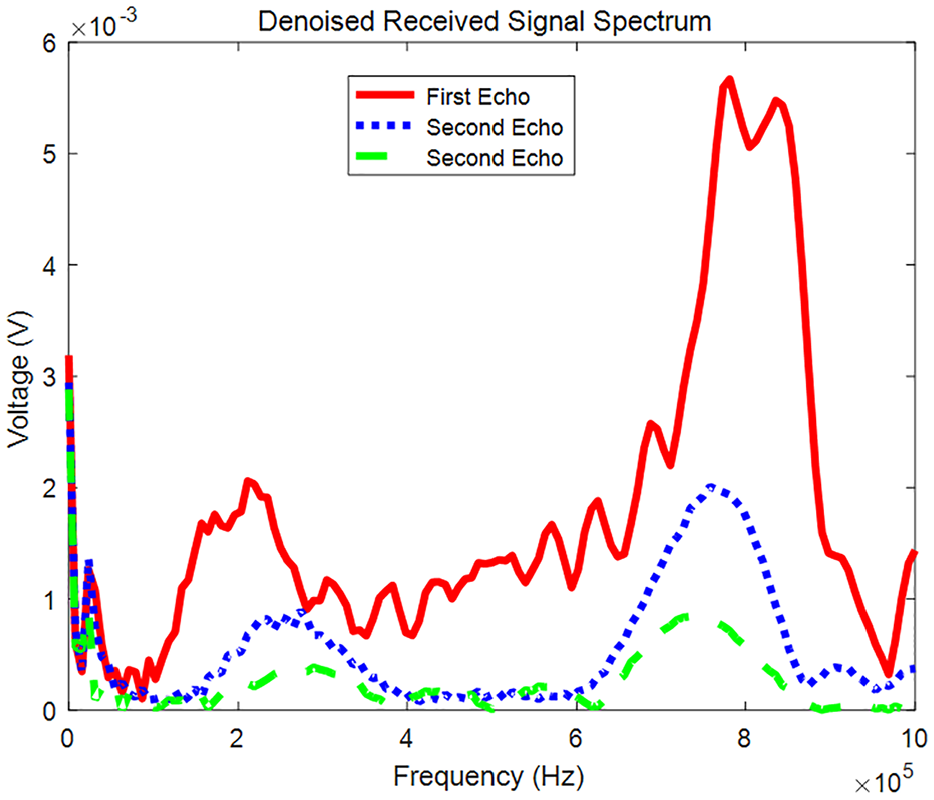
Fourier transform result.
The attenuation process of ultrasound in a suspended mass solution is characterised by the voltage changes observed in the triple echo at the receiving transducer. For suspended mass solutions with varying frequencies and particle size distributions, distinct ultrasonic attenuation conditions result in different triple echo patterns. To account for the influence of the transducer’s centre frequency, a Fourier transform is applied to the triple echo to extract the amplitude at the centre frequency. The Fourier transform results, shown in Figure 5, where highlight that the maximum value of each echo corresponds to the energy at the centre frequency, providing insight into the attenuation behaviour of the ultrasonic signal as it reaches the focused transducer. Consequently, the six parameters – including the peak values of the three-cycle waves and the maximum values after the three Fourier transforms – are influenced by the particle size and attenuation conditions in different suspended solutions. These amplitude differences serve as key indicators in the ultrasonic attenuation experiment. To enhance the reliability of our ultrasonic measurements, three distinct frequencies – 630, 750 and 830 kHz – were strategically selected. These frequencies span the operational range of the ultrasonic transducers, in which the energy contrast is more pronounced within the 600–900 kHz range. This selection mitigates potential interference that could arise from using a single frequency. We acknowledge that the results may vary with different frequencies and emphasise that frequency selection significantly influences ultrasonic attenuation and scattering properties. Consequently, the peak value of the triple echo voltage, the amplitude of the Fourier transform, and the frequency are selected as key characteristic parameters for the model.
To address potential issues of feature dimension discrepancies during random forest training, data preprocessing is performed. One-hot encoding is applied to convert the frequencies (630, 750 and 830 kHz) into categorical values (1, 2, and 3, respectively). The remaining data features are normalised using deviation, mapping them to the range of [0, 1]. The conversion formula is provided in equation (3).
In summary, 10 parameters closely related to particle size distribution calculation are selected as the input characteristic parameters for the dataset, and their data are preprocessed. Moreover, the 17 particle size intervals determined using the screening method are used as the output label parameters. Detailed information on the input and output parameters of the finalised dataset is presented in Table 1.
Random forest algorithm input and output information table.
Random forest algorithm
Traditional particle size distribution inversion problems have primarily focused on employing more accurate models and optimised algorithms to solve the first-kind Fredholm integral equation. This work introduces the concept of machine learning into particle size distribution inversion calculations by employing a random forest algorithm and a dataset to construct a black box model. This method aims to establish a mapping relationship between physical parameters, ultrasonic attenuation experimental parameters and the particle size distribution. Ultimately, particle size distribution results can be calculated on the basis of the corresponding feature parameters. The random forest algorithm is an ensemble learning model based on bagging, which involves repeatedly sampling equal-sized subdatasets from the training dataset to construct multiple decision trees. The prediction result of a single decision tree is general, but the combination of decision trees improves overall prediction performance. The mainstream algorithms include the C4.5 decision tree algorithm, the iterative dichotomizer 3 (ID3) and the classification and regression tree (CART), each with its own advantages and disadvantages. In accordance with the characteristics of multiple regression analysis for particle size distribution prediction, CART is selected as the decision tree algorithm in this paper.
The CART decision tree is a tree-like prediction tree primarily used for regression prediction in this paper. It partitions feature positions using the least square method, dividing the set of possible values of the variable space into nonoverlapping subplanes. The criterion for each partition is defined in equation (4), aiming to minimise the sum of squares calculated from the input features at the segmentation position. Then, the optimal decision tree can be divided through continuous recursion. Finally, the corresponding subspace is identified based on the input features, and the prediction result is generated.
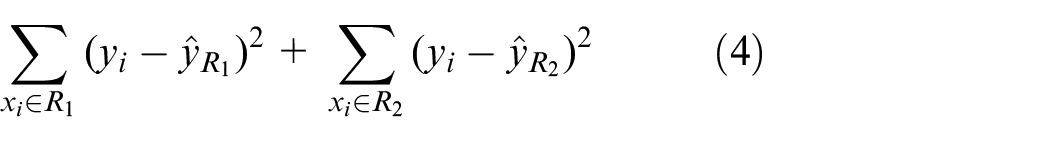
In the equation,
The random forest algorithm combines multiple CART decision trees to create a prediction model. The training steps are as follows:
1) Sampling to create the training set: The bootstrap method is used to repeatedly sample from the training dataset. In each iteration, n training samples are randomly selected, resulting in k training sets.
2) Training decision tree models: For the k training sets, k CART decision tree models are trained.
3) Decision tree combination: The random forest algorithm combines multiple decision tree models.
4) Output result: For the particle size distribution problem, the average of the prediction results from multiple decision trees is used as the final prediction result.
The process of applying the random forest algorithm to predict the particle size distribution is shown in Figure 6. The training dataset input consists of a matrix with 10 feature parameters. This matrix contains a total of 99 rows, with each column representing a different feature. The label is a predetermined particle size distribution, obtained through the sieving method and formatted as a matrix. Each row of the data consists of 17 particle size interval parameters corresponding to the features, totalling 99 rows. The test dataset is consistent with the training dataset but contains only 9 datasets. The characteristic parameters serve as inputs to the model, and three predictions are generated for each sample. The average of the three predictions is then calculated and compared with the particle size intervals determined by the sieving method.
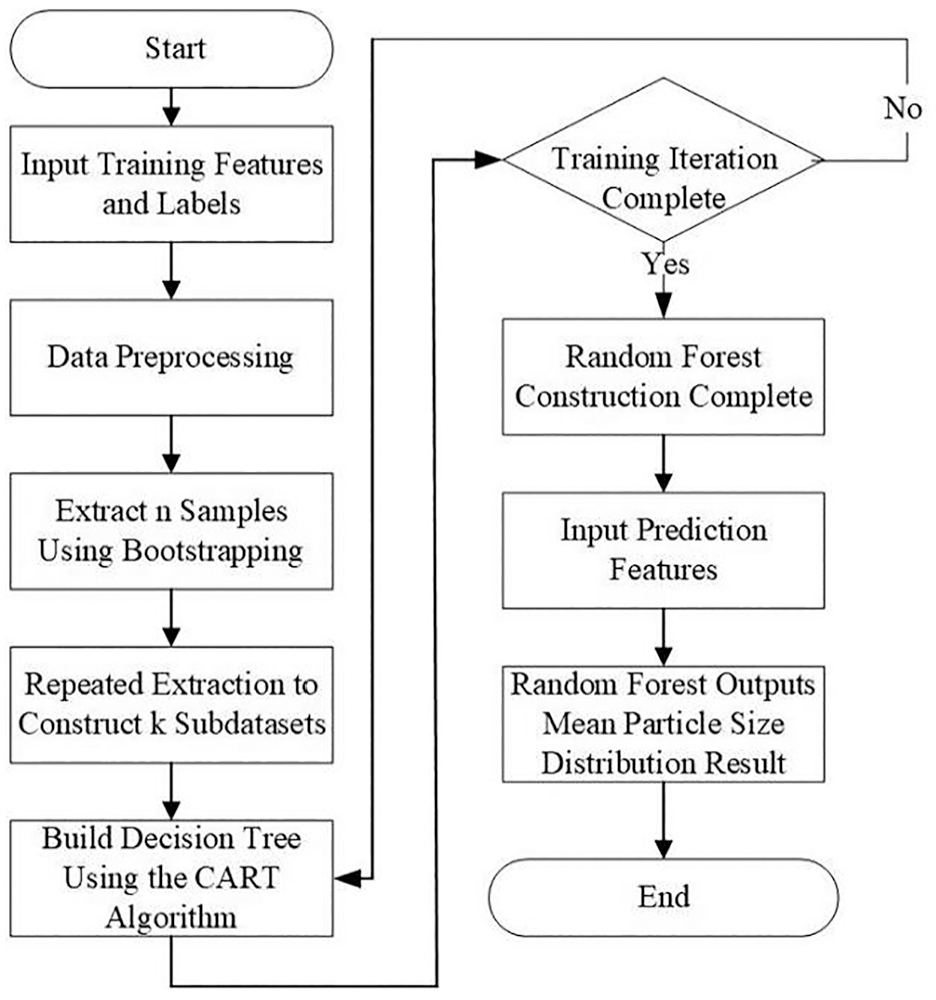
Flow chart of random forest algorithm application.
The prediction model trained using the training dataset and the random forest algorithm is a black box model, for which the output is a function of the input. By providing a set of experimental parameters as vector inputs, the model generates a prediction result vector representing the particle size distribution. The prediction form is expressed in equation (5).

In the equation, R is the particle size distribution vector, consisting of the values corresponding to the 17 particle size intervals, which is the prediction result we obtained.
Result analysis
For evaluating the prediction results, the coefficient of determination is used as a standard to evaluate the model’s predictive ability, whereas the median diameter error (
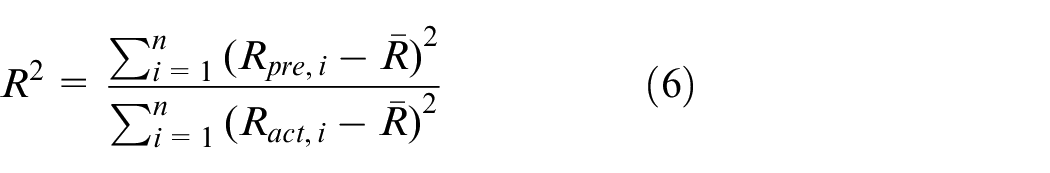
In this equation,
In this work, 37 sample groups were used for training, whereas 3 groups with uniform, irregular, and normal distributions were used for validation to evaluate the effectiveness of the random forest model. The prediction results for these three distributions were also compared with those obtained using the artificial bee colony algorithm. Figures 7 to 9 present a comparison of the predicted particle size distribution and the actual particle size distribution for samples A through C, including the results from both the random forest algorithm and the artificial bee colony method. The figures demonstrate that the particle size distribution trend predicted by the random forest algorithm aligns with that obtained using the screening method and the artificial bee colony method, although some shortcomings exist. The errors of samples A and B are greater when the particle size is small, and the errors of the particle size are smaller in the middle region. The result for sample C is more reliable, with predicted values closely matching the actual values.
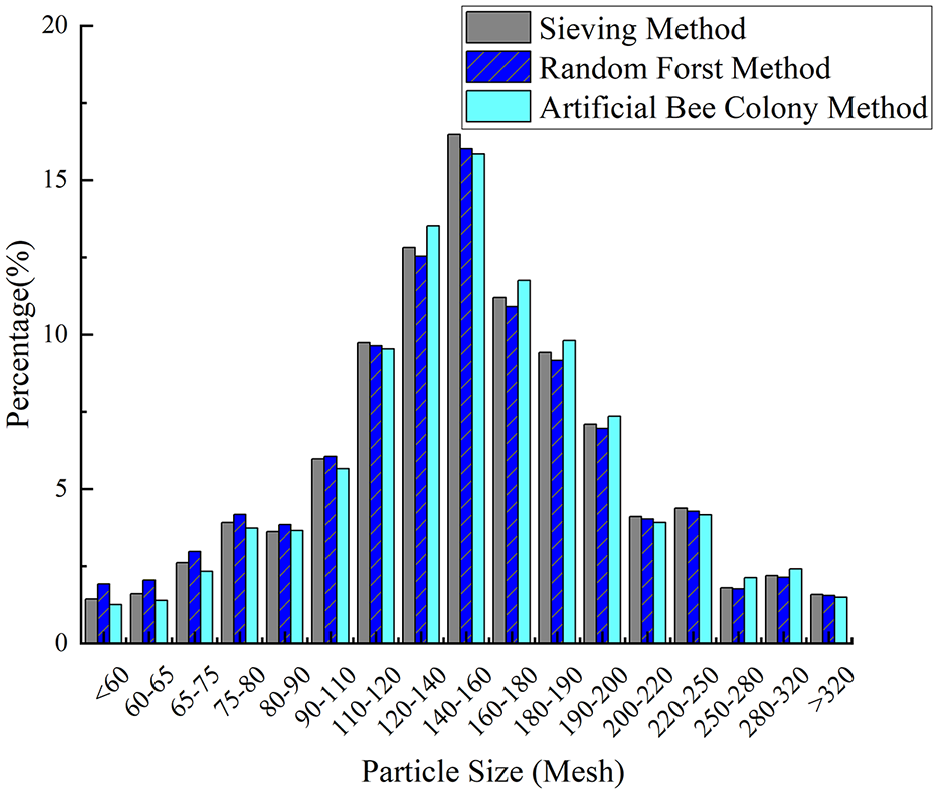
Sample A comparison of results by two methods.
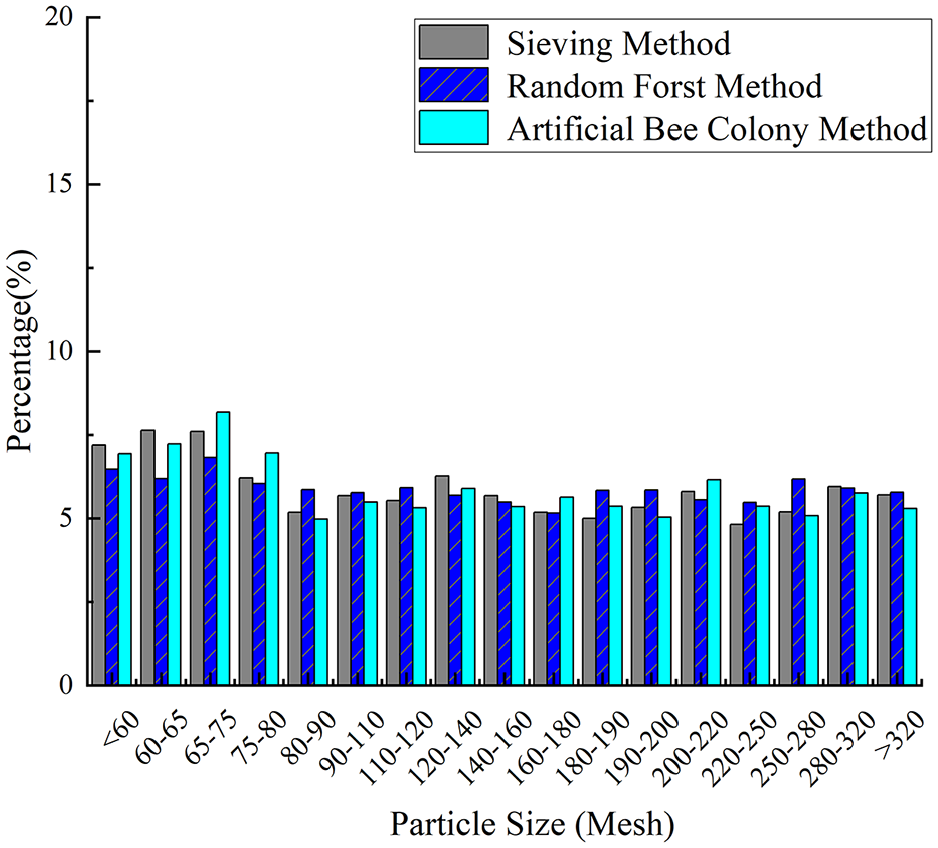
Sample B comparison of results by two methods.
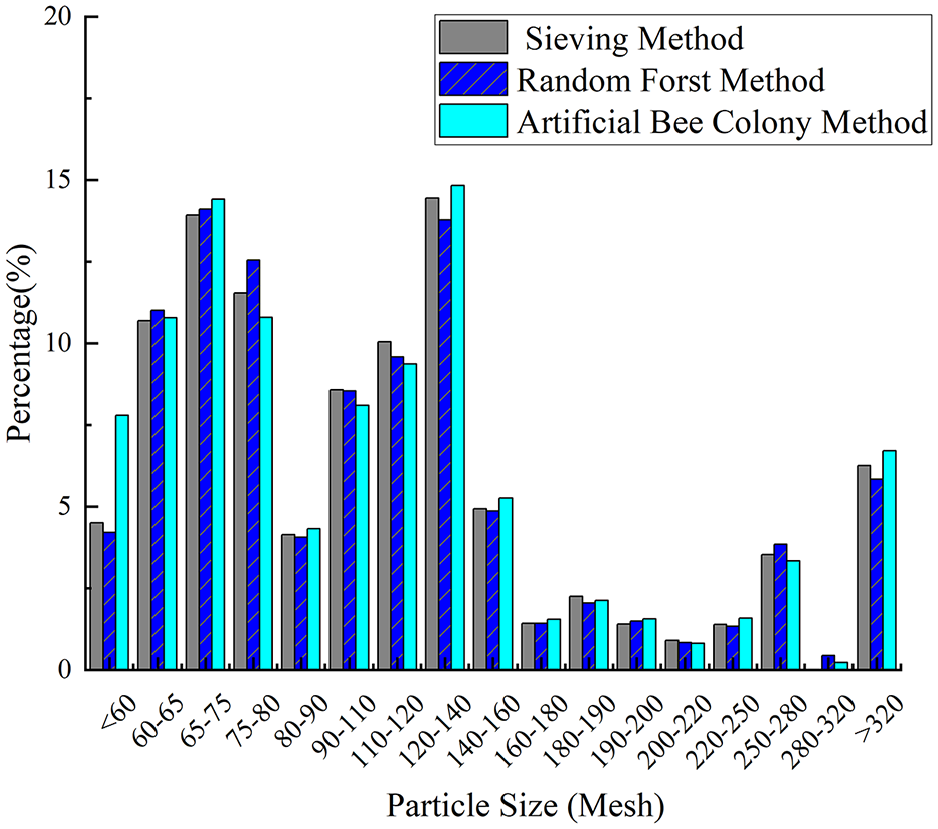
Sample C comparison of results by two methods.
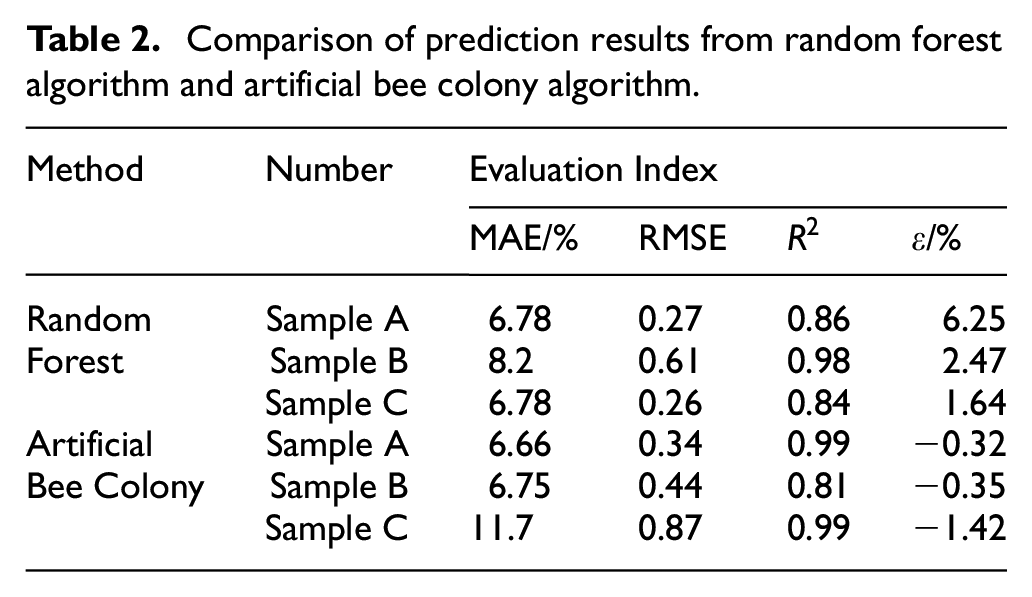
Table 2 provides a comparison of the results between the random forest and artificial bee colony algorithms, highlighting the strengths and weaknesses of each approach. The random forest algorithm achieves a coefficient of determination greater than 0.8 for all three samples, indicating strong regression performance. The median diameter errors (D-50) are 6.25%, 2.47% and 1.64%. The particle size prediction results align closely with those obtained using the sieving method, demonstrating the high feasibility of the proposed method. A comparison between the two methods reveals that the random forest algorithm provides greater precision in calculation results than the artificial bee colony algorithm. The RMSE of the single particle size interval predicted by the random forest is lower than that calculated by the artificial bee colony algorithm, whereas the coefficients of determination for all three samples demonstrate good consistency between the methods. However, a larger deviation in the coefficient of determination is observed for the uniform distribution sample when the artificial bee colony algorithm is used. This can be attributed to the algorithm’s greater deviation at smaller particle size intervals. Upon analysis, the random forest algorithm demonstrates an advantage during training, producing predictions closer to the actual particle size distribution. Its precision is directly related to the volume of data available in the training set. In contrast, the artificial bee colony algorithm, which relies solely on physical parameters rather than training data, is more suitable for particle size distribution calculations in scenarios in which data are limited.
Comparison of prediction results from random forest algorithm and artificial bee colony algorithm.
Conclusion
This paper presents a method of particle size distribution (PSD) measurement based on ultrasonic attenuation and a random forest algorithm. Data collected from ultrasonic attenuation experiments, combined with previous information, such as the ECAH model, were used to select 10 parameters closely related to particle size as the input features for the dataset. Additionally, 17 particle size intervals determined using the sieving method served as output labels. We calculated the 95% confidence intervals for the median diameter predictions using the bootstrap method, resulting in the following intervals for samples A, B and C: 5.5%, 7%], [1.8%, 3.1%] and [1%, 2.3%], respectively. The random forest algorithm was used to train the prediction model, and PSD results were obtained by measuring three different distributions of suspended mass samples. The inclusion of confidence intervals further supports the reliability of the median diameter predictions. The coefficients of determination (R2) for the three samples were all greater than 0.8, and the median diameter errors were 6.25%, 2.47% and 1.64%, respectively. These results indicate that the proposed method achieves strong predictive performance within the experimental range and demonstrates high consistency with the results obtained using the sieving method.
To further evaluate the effectiveness of the random forest algorithm, its performance was compared with that of the artificial bee colony (ABC) algorithm. The comparison revealed that the random forest algorithm achieved higher predictive accuracy, particularly for smaller particle sizes, as demonstrated by lower RMSE values and more consistent median diameter error results. This proposed method simplifies PSD measurement by emphasising the extraction of key experimental parameters, thereby eliminating the need for the complex calculations inherent in traditional inversion methods. In addition, it provides a new reference framework for future particle size distribution measurements, particularly in contexts in which data-driven approaches offer greater flexibility and efficiency.
Prospect
This work employed data obtained from ultrasonic attenuation experiments to train a random forest model for predicting PSD. Although the experimental results are promising, several areas for improvement are identified, which can be addressed in the following ways: (1) The current study is based on the ECAH model, which does not account for interactions between particles. For more complex suspended mass solutions, in which diverse physical properties are mixed, alternative theoretical models should be explored. In addition, the corresponding features should be reevaluated to better capture the underlying particle interactions. (2) The experimental data used in this paper were derived from self-configured samples. Although 40 sets of experimental data were configured, these samples represent only a small subset compared with natural sediment conditions. To enhance the applicability of this method to more complex natural environments, integrating previously recorded suspended sediment PSD data and training the model on a larger and more diverse dataset could improve both the prediction accuracy and robustness.