
Abstract
Every car comprises thousands of parts, is expected to operate reliably for many years, and this reliability depends on the production process. Measuring production is complex and costly; measurement times often exceed part production time. Statistical Process Control (SPC) enables reliability monitoring rather than measuring entire parts, and the fundamental instruments for this method are 3D Coordinate Measuring Machines (CMMs). However, the CMMs’ requirement for a vibration-free floor necessitates that measurements be taken in specialized laboratory conditions, away from the production line. This requirement poses a significant challenge for manufacturers, who often require their own “control fixtures” (CFs) for their production lines. However, these CFs, custom-built for each mass-produced part, can be complex and relatively expensive. This article introduces operator-assisted automated part measurement near the production line using a cobot-mounted profile laser and simplified CFs fixtures. The system automatically performs measurement and data collection after the operator simply loads/unloads the part and scans the QR code. The proposed system, a hybrid of a CMM and a control fixture, is termed the Control Fixture Measuring Machine (CFMM). In this research article, the basic working principles of CFMM are explained, and as a “Gage,” its reliability and repeatability are evaluated through a Type 1 Gage Study. During the experiments, the prototype is placed near a machine tool. The results show that the measurements obtained with this new concept of checking control points on a simplified control fixture with a profile laser are satisfactory under shop floor conditions, aided by a simple Kalman filter.
Introduction
In industrial production, having an effective measurement process is crucial to control dimensional properties and ensure quality. In the automotive industry, dimensional measurement systems for serial production parts (excluding handheld tools) can be grouped into three main categories:
CMM: Coordinate Measuring Machines
CF: Control Fixtures
EMG: Electronic Measuring Gages
CMMs are accurate and flexible systems, but they require controlled environments (e.g. air conditioning, vibration-free floors, skilled operators), which makes them unsuitable for use near the production line.
Control Fixtures (CFs), on the other hand, offer part-specific solutions that can be used close to the production area. While they are more practical and cost-effective, their manual nature requires longer measurement times and operator dependency.
EMG systems provide fast and accurate in-line measurements but are typically used only in powertrain applications due to their high cost and complex automation requirements.
This study introduces a method to automate the manual CF approach using a profile laser mounted on a collaborative robot (cobot), enabling dimensional checks close to the production line. Unlike CMMs, the proposed system does not measure part coordinates, but instead measures the distance between two defined points. Both the start (reference) and end (target) points must be visible to the laser. Therefore, this system is not a CMM, but rather an automated version of a control fixture—referred to as a Control Fixture Measuring Machine (CFMM).
How CFMM differs from existing systems
CFMM combines the flexibility of CMMs with the practicality of CFs on production line. However, unlike current cobot-based systems, it does not perform coordinate-based measurements. Instead, it focuses on automating the distance checks typically performed manually with CFs. This allows CFMM to operate with simpler and low-cost fixtures, without the need for complex software or specialized sensors. It offers an efficient and sufficiently accurate solution for applications such as body part measurement in automotive mass production. In this sense, CFMM can be considered a new category of measurement system, positioned between CMMs, CFs, and EMGs.
Recent innovations
In fact, in 1994, Amirat et al. 1 published the idea that three cameras could measure an axis system with four calibrated points attached to the robots to overcome the mechanical gaps of the robots and read their exact positions. During the 2000s, Paziani et al. 2 and Rejc et al. 3 tested attaching sensors to robots like CMM. During the following decades, Sousa et al. 4 and Al Khawli et al. 5 used 2D sensors to calibrate robots’ own TCP. However, contemporary robots still lack the dexterity to replicate the human action of placing and referencing a digital dial gage within an H7 hole. Therefore, even today, in sensitive needs, the robot task can never go beyond “pick, carry, and place.” Saeidi-Aminabadi et al. 6 had to fix their confocal sensor and develop a robot emulating “EMG” to ensure measurement reliability. To ignore sensitivity, Wienand et al. 7 (from ISRA Vision) received their patent to find the robot’s position and stance angles by looking at defined points at certain angles.
In the following years, some other non-contact technologies became more prominent. These were generally based mainly on the logic of scanning the surface and modeling it as a point cloud. In this context, two standard methods for part scanning stand out:
“Image processing” is the first method of calculating the 3D point cloud by tracing various spacing and angle grid images on the part and processing these images with a double lens. This method works by image accumulation.
“Laser triangulation” is the other method of combining the profile laser cross-sections obtained by the triangulation approach, reading at extremely high speed, to get only a single point distance or a 2D/3D point cloud. Cloud creation works with point and/or cross-section accumulations.
In this context, the studies of Wieczorowski et al. 8 in 2014 define a robotized methodology that includes one rotary table by evaluating point clouds without touching the part. Kuts et al. 9 2016 investigated separate point clouds obtained by laser triangulation and zebra lighting methods, comparing the errors to the mathematical model.
Despite the rich data provided by point clouds, robust algorithms for extracting precise, specific metric values have yet to be fully developed. However, these methods can easily create visual information for the part’s global conformity and are suitable for reverse engineering.
Recently, in 2017, Luxen and Erxleben 10 from ISRA Vision and Mian et al. 11 from Int. Elec. Mach. Corp. took similar patents for modeling and measuring deformation information from the deformities of multiple parallel laser lines fired at a piece in space. These were steps of extracting an exact specific value from the point cloud, and later, recent new works came:
Tran and Ha published 12 a methodology for gap and flush measurement; Minnetti et al., Belani et al.13,14 designed a handheld miniature laser line and camera; Feng et al. 15 suggested to use HDR filter and logistic function for edge region measurements; Pham et al.16,17 did a system that reads ArUco marker or the line laser, directly with a phone camera; Long et al. 18 developed an algorithm for extracting gap and flush from the 3D cloud; Zhao et al. 19 proposed a theoretical radius fitting for very narrow gaps; Kholkhujaev et al. 20 did direct measurement tests on the car body with robot; and Chunfu et al. 21 studied how to filter and evaluate a data profile.
Need to part check, not only the assembly
Although assembly measurements consistently determine gaps and alignments between adjacent parts, they do not guarantee the dimensional accuracy of individual components. Even if two defective parts yield a correct assembly gap, it is not possible to identify which part caused the deviation. Therefore, measurement methodologies must be applicable to both assemblies and individual part dimensions.
A control fixture is a specially designed and calibrated device that secures a part under its actual vehicle assembly conditions using defined reference points (datums). It incorporates virtual reference surfaces and the vehicle axis, enabling the sensor to simultaneously capture both the part and the calibrated reference surface. Consequently, measurements are evaluated as relative errors with respect to the actual assembly configuration.
In the automotive industry, plastic and sheet metal components are typically verified on the production line using such fixtures, as measurements are unreliable due to insufficient rigidity or free-state deformation. The fixture ensures repeatable and reliable part positioning, allowing verification of critical dimensions even when measurements are one-dimensional. During any measurement, if the CMM is not used, the sensor must simultaneously observe the part and the calibrated reference surface representing the vehicle axis. Artificial reference surfaces, calibrated according to three primary reference points, define a virtual vehicle axis, and all measurements are interpreted as relative errors based on this axis.
However, because CFs are still manual systems, we propose automating their use with a cobot. In the prototype setup (see Figure 1), a UR5 collaborative robot (cobot) from Universal Robotics is used. This model was selected for its ability to work safely alongside humans, automatically stopping in the event of a collision and eliminating the need for a safety fence. The primary task of the cobot is to carry a 2D laser profile sensor and position it at the most appropriate viewing angle for each measurement point. The selected laser profile sensor is the MLSL122 model from Wenglor. This model was selected for its cost-effectiveness, as it provides the required measurement accuracy and a suitable scanning area for this application. Additionally, it delivers the repeatability required for the Type 1 Gage Study conducted in this research. These combined features make the MLSL122 a reliable and appropriate choice for the CFMM configuration. MLSL122 can read more than 2800 slices per second with its embedded FPGA system. In the Z-axis, the field of view is 65 mm far from the laser and 60 mm deep. Each laser slice consists 1280 points, and these points are evenly distributed at the closest limit across 40 mm (with∼33 μm step) and at the farthest limit across 58 mm (with∼47 μm step).
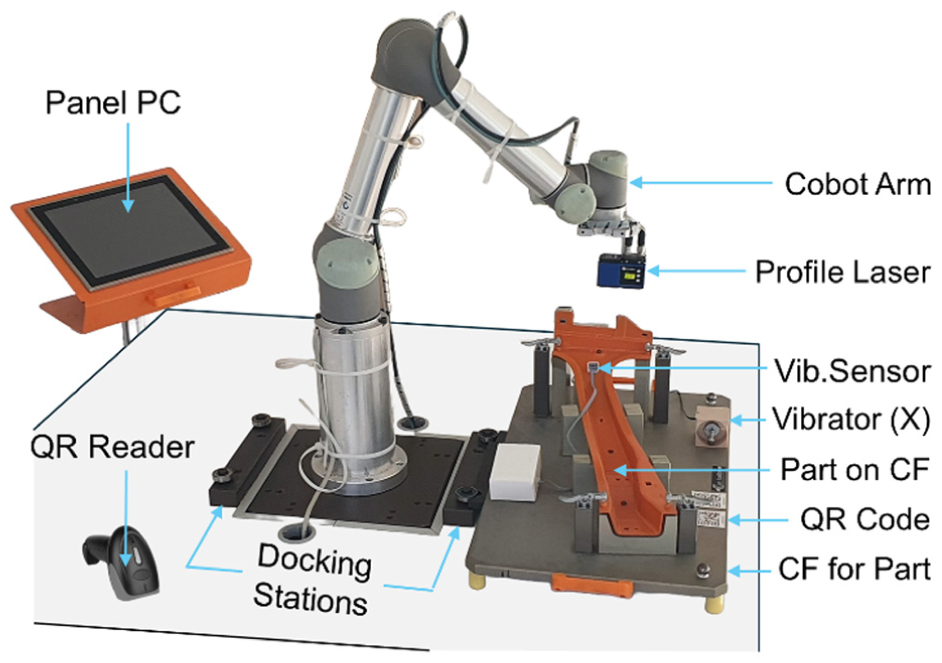
A prototype (and test setup) of CFMM.
A panel PC is placed in the corner of the platform for cobot control and data collection purposes. A wireless QR code reader is also added to deliver parameters or commands to the PC. According to the reach capacity of the Cobot arm, “CF docking and referencing” stations are placed around the cobot on the platform (in our case, two stations at 180° intervals, but could be four at 90°, or more if arm length permits). A local area network connects all units (see Figure 2).
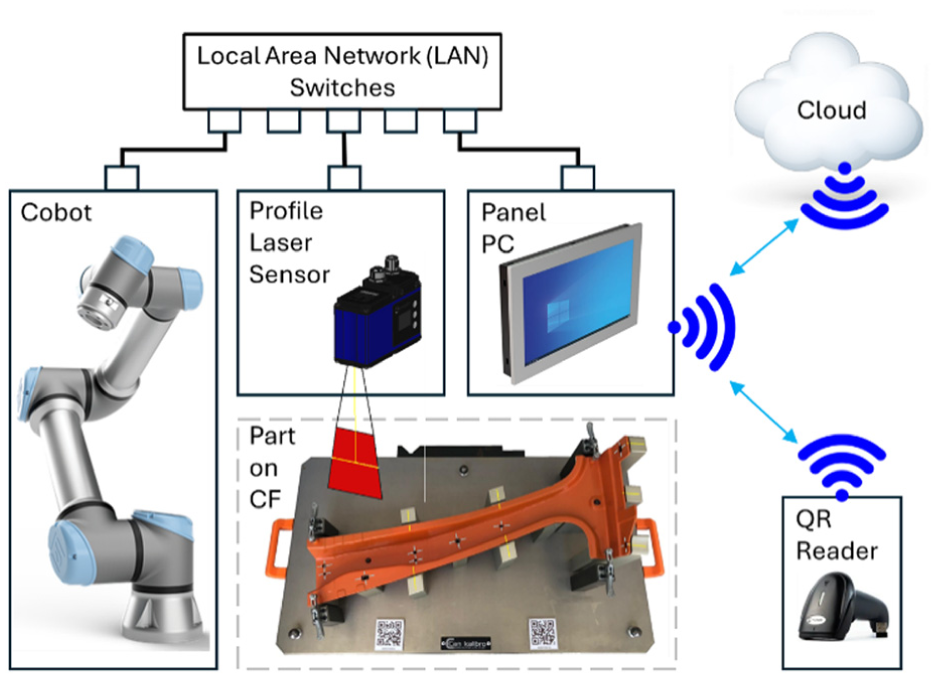
CFMM system diagram.
Data readings
While robots themselves are unsuitable as precise measuring instruments due to inherent joint clearances, they can effectively act as carriers for measurement sensors. This allows for the simultaneous capture of both the reference and target points just like in manual measurements made on CFs.
For this, a special CF is created (see Figure 3) that fixes the part in the same position each time so that the cobot sensor sees and simultaneously measures both the part measurement point and the measurement reference in its field of view while taking measurements from the part. The concept of “measurement reference,” defines a mini plane (flush) that is the tangent continuation of the part surface, at the point to be measured. This plane is a certain distance (gap) away from the part trim line. All shall enter the sensor’s field of view.
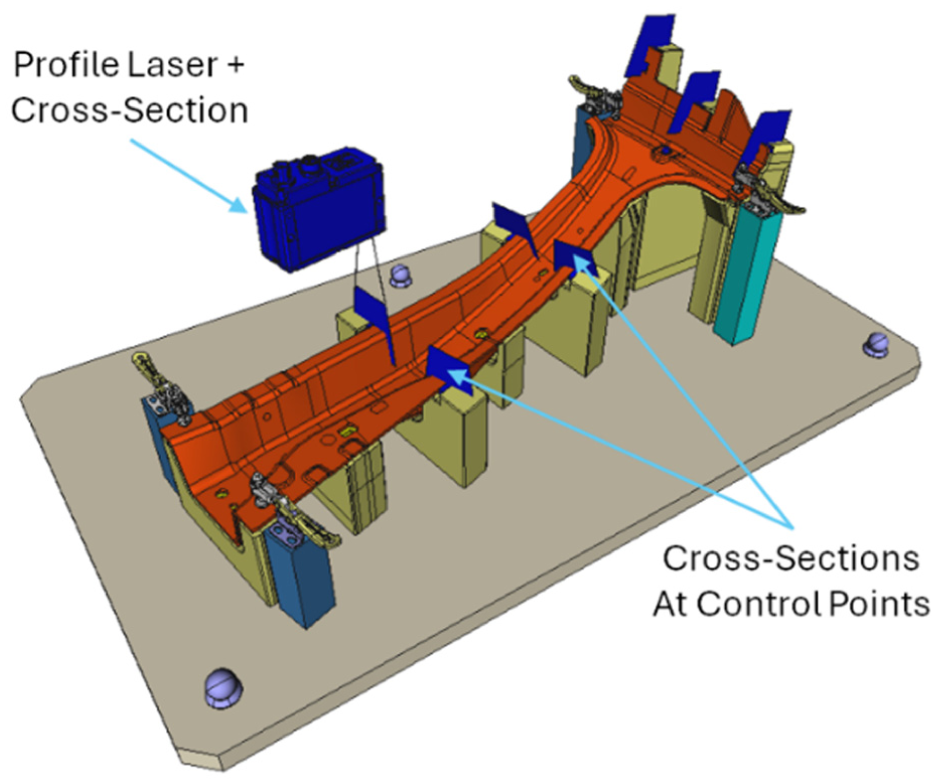
Simplified CF (by Can Kalibro): gap and flush measurements are made simultaneously at control point with a single scan of the cobot-carried profile laser.
Each reference consists of block parts, processed, calibrated, and placed on the CF along the part trims, in line with the measurement points. Therefore, for the measurement sensor to perform the measurement task of both the part itself and the part reference in an ideal way, it is necessary to design a “special CF for the betting measurement process.” In addition, the cobot must position the profile laser cross-section so that the projection of the measurement point to the reference edge is perpendicular to the reference plane and the part cut edge. There should be no obstructions between the laser scan line and the sensor camera that sees this line.
These careful adjustments allow a list of cobot positions at the measurement points to be created (see Figure 3), and like this the trajectory of the cobot arm is determined during the CF design phase. This list can be placed in the “measurement object,” thus eliminating the need for operator programing.
A part positioning and referencing fixture (see Figure 3) is more straightforward, lighter, and cheaper than traditional control fixtures (see Figure 4). Additionally, depending on the precision required, the system can be built using alternative or printable materials, making it more flexible and accessible for different use cases. This approach can further simplify the design while maintaining accuracy and functionality. The conversion of profile laser cross-section data into measurement data involves several stages. Profile laser scanning cameras utilize embedded microchips with FPGA technology to enable high-speed data acquisition and local storage. However, the communication speeds within the computer network and the calculations required for measurements are relatively slow. Therefore, the reading speed of the measurement is determined by the duration of taking cross-section stages, including raw data reading (Figure 5(a)), parsing (Figure 5(b)), and curve fitting (Figure 5(c)).
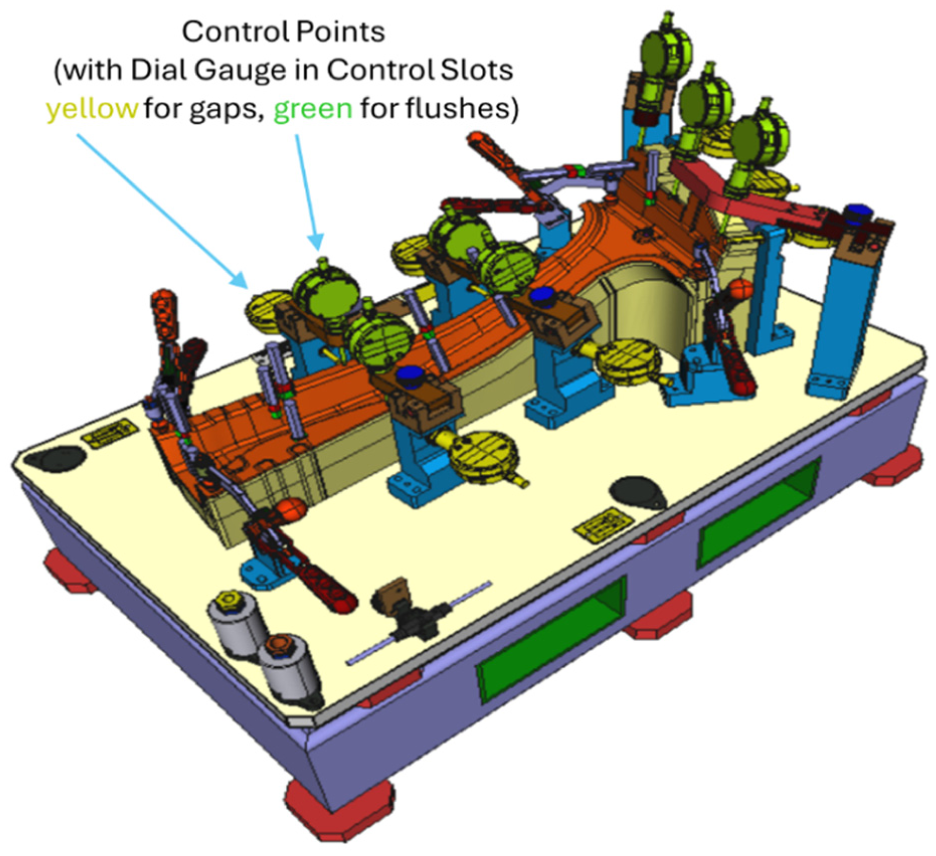
Classical CF (by Can Kalibro): the operator performs gap and flush measurements separately in a total of 14 locations by inserting and removing the dial gage into separate control appropriate slots for 7 gaps (yellow) and 7 flushes (green).
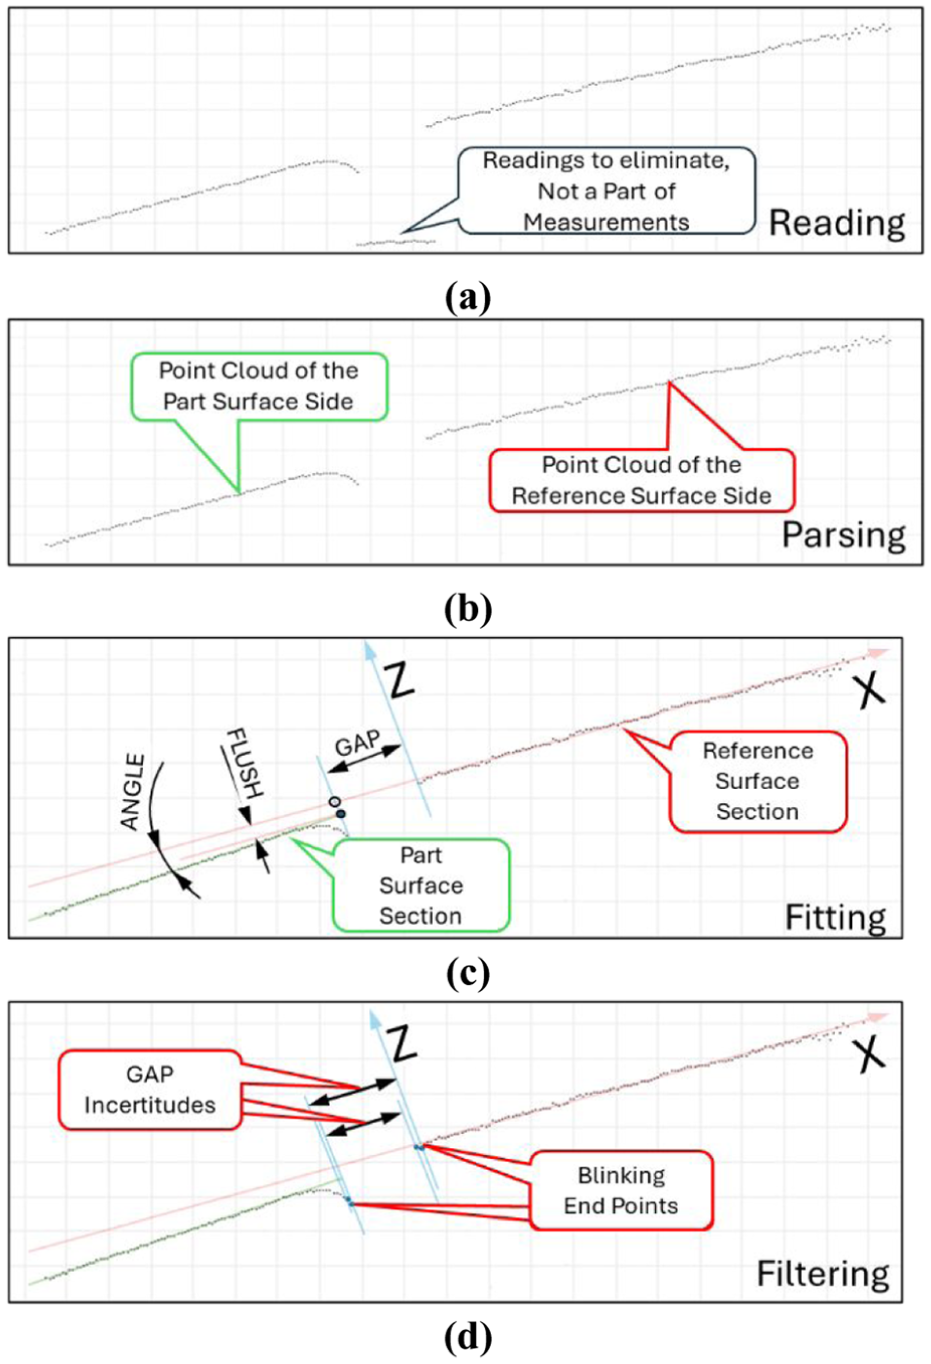
Profile sensor reading sequences, (a) raw data (reading), (b) fragmentation (parsing), (c) calculation (fitting), (d) gap incertitude (filtering). (by Can Kalibro).
In addition, a Kalman filter 22 applied to multiple sequential readings will increase the accuracy and reliability of the results, especially in shaking environments, to minimize errors caused by the flashing of the reference points and to follow the measurement changes (Figure 5(d)).
Part inspection process
The CFMM system enables an operator-assisted automated part measurement process, where the measurement sequence, fixture identification, and data acquisition are fully automated after minimal operator input. The operator’s role is limited to loading/unloading parts and scanning QR codes to initiate the process; no manual positioning or measurement is required during inspection. The system currently operates in an open-loop manner—measurement results are not used to adjust cobot motion or control in real time.
The setup consists of a cobot carrying the measuring sensor, interchangeable control fixtures (CFs), and docking stations for these CFs. While the cobot inspects a part at one station, another CF or part can be replaced at another station, ensuring operational continuity. An easy reference mechanism allows for fast CF replacement. Each station has a unique “QR code” label, and multiple “Inspection QR codes” can be defined for each CF. Scanning the station QR code and the inspection QR code of the CF placed at that station triggers the inspection process and adds it to the CFMM measurement queue.
Profile laser sensor readings are obtained by calculating the Cartesian coordinates of each laser point projected onto the surface. The actual measurements to be read are the distances between the coordinates of the profile endpoints. Therefore, even if there is a change in the sensor’s viewing angle (
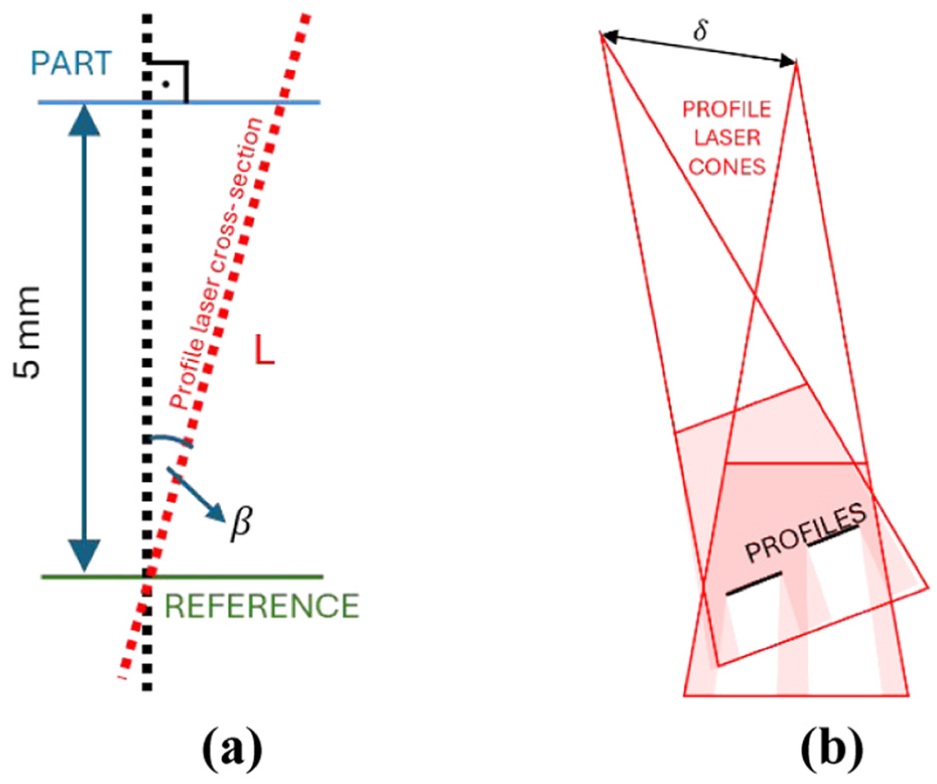
Sensor positioning errors. (a) Angular error,
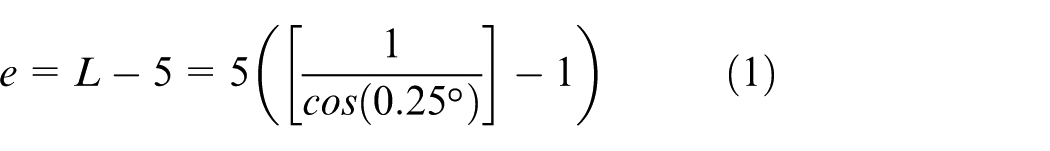
Even if the cobot shifts slightly up/down or left/right, the profile laser sensor captures the same cross-section slightly displaced or differently oriented; curve fitting and calculation procedures still produce the same results. The image above illustrates a case where changes in orientation and position are “quite significant.” Besides that, in recent cobots, joint-based angular position accuracy is generally around 0.1°–0.5°, but for the cobot used in this study, this value was 0.25°. Whereas the cobot is expected to hold the profile laser perpendicular to the gap measurement. The reading error that may occur in this case can be calculated using the following equation, using Figure 6(b):
In our case, this calculation yields a very small measurement error of approximately 0.0475 mm.
On the other hand, preparing to measure on a CFMM to verify the suitability of a part for assembly does not require the operator to program the cobot. But it needs careful consideration of the CF design processes. CFMM assumes that certain measurement information is determined in the design conditions and translated into a set of procedures. These include: the CF design must meet the conditions for the part to be mounted on the vehicle, reference the part in the same position each time it is mounted, ensure that the sensor reaches the part measurement points, and optimize the paths between measurement points to prevent sensor collisions. In addition, if multiple measurements can be taken at a point, they should all be read simultaneously for efficiency. When designing the CF, the designer must also foresee the locations of all cross-sections, the locations of all reference blocks, and all appropriate routines to use for measurement. Dimensions for the ROI must be defined, and a list of positions must be created for the cobot motion order. In the final stage of the CF design, everything is packaged in an “inspection object” containing all the necessary information for the inspection process, which is then added to the “CF object” as a QR code. If different inspections need to be performed on the CF, the QR code corresponding to each inspection is introduced separately. In the CFMM usage process, the operator is only responsible for loading the CF into the station, fixing the parts to be measured on the CF, and reading the appropriate inspection QR code. After scanning the QR code, the CFMM reaches the corresponding inspection object in the database and adds it to the queue for execution.
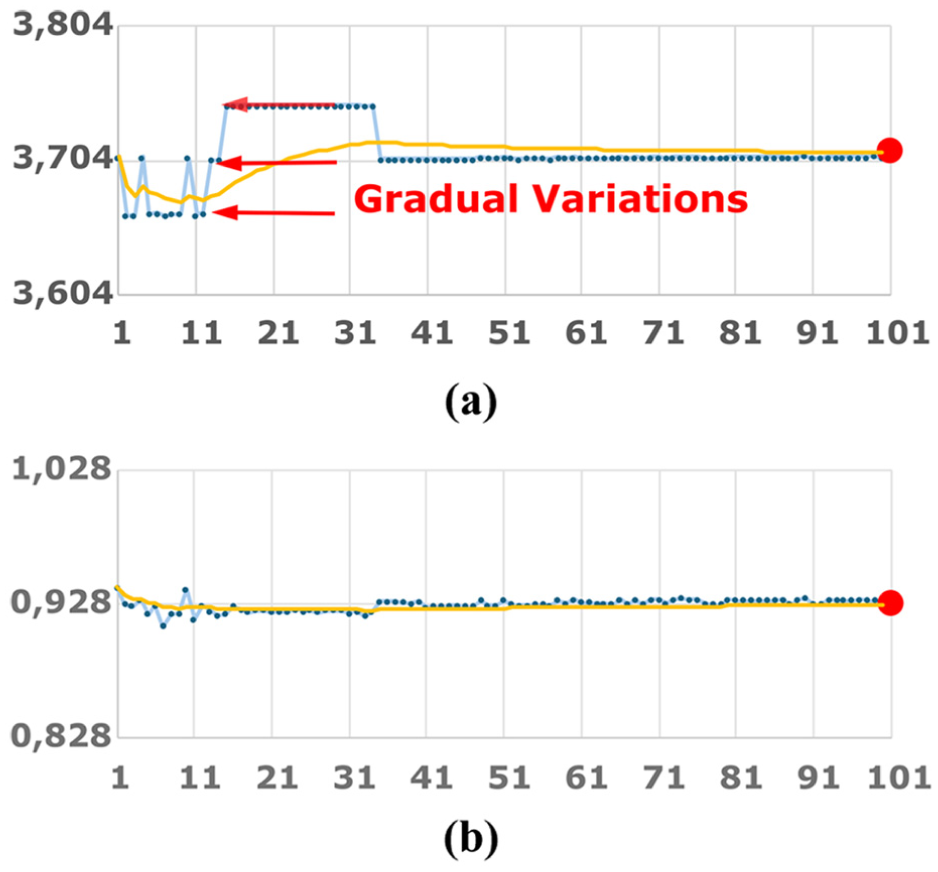
The CFMM system can measure various dimensions, including gaps, flushes, angles, positions, concentricity, and other geometric tolerances (see Figure 7). Measurement data is automatically stored after each reading and can be displayed anytime (see Figure 8(a)). In addition, the system can display statistical graphs and distribution histograms for any individual measurement requested and can calculate reliability parameters like Cp/Cpk (see Figure 8(b)).
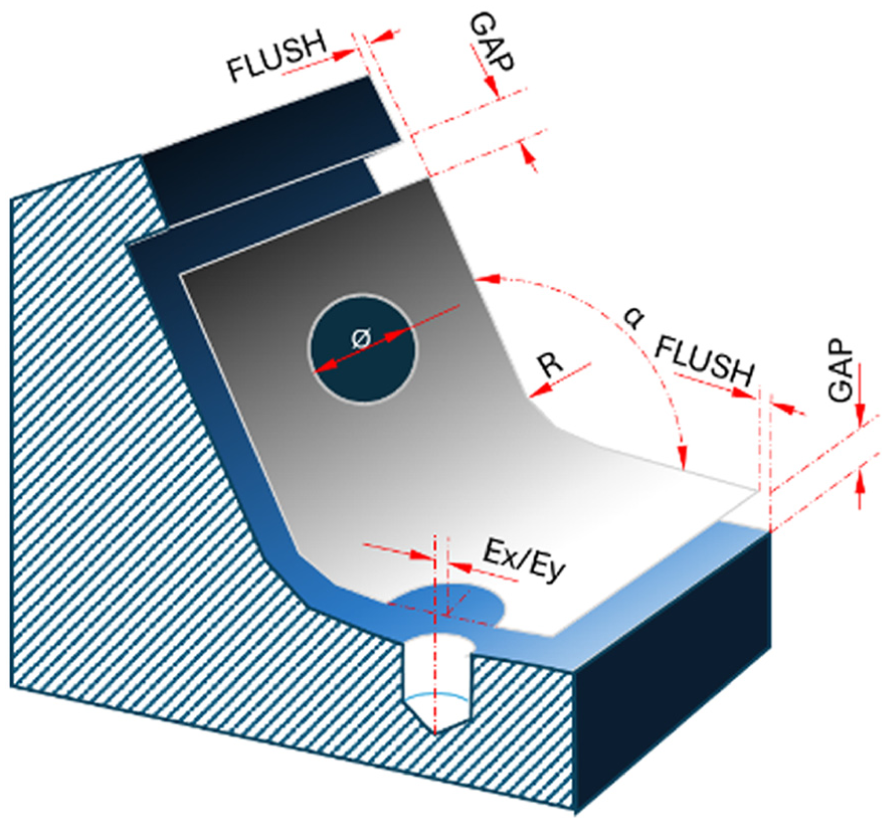
Measurable dimensions (by Can Kalibro).
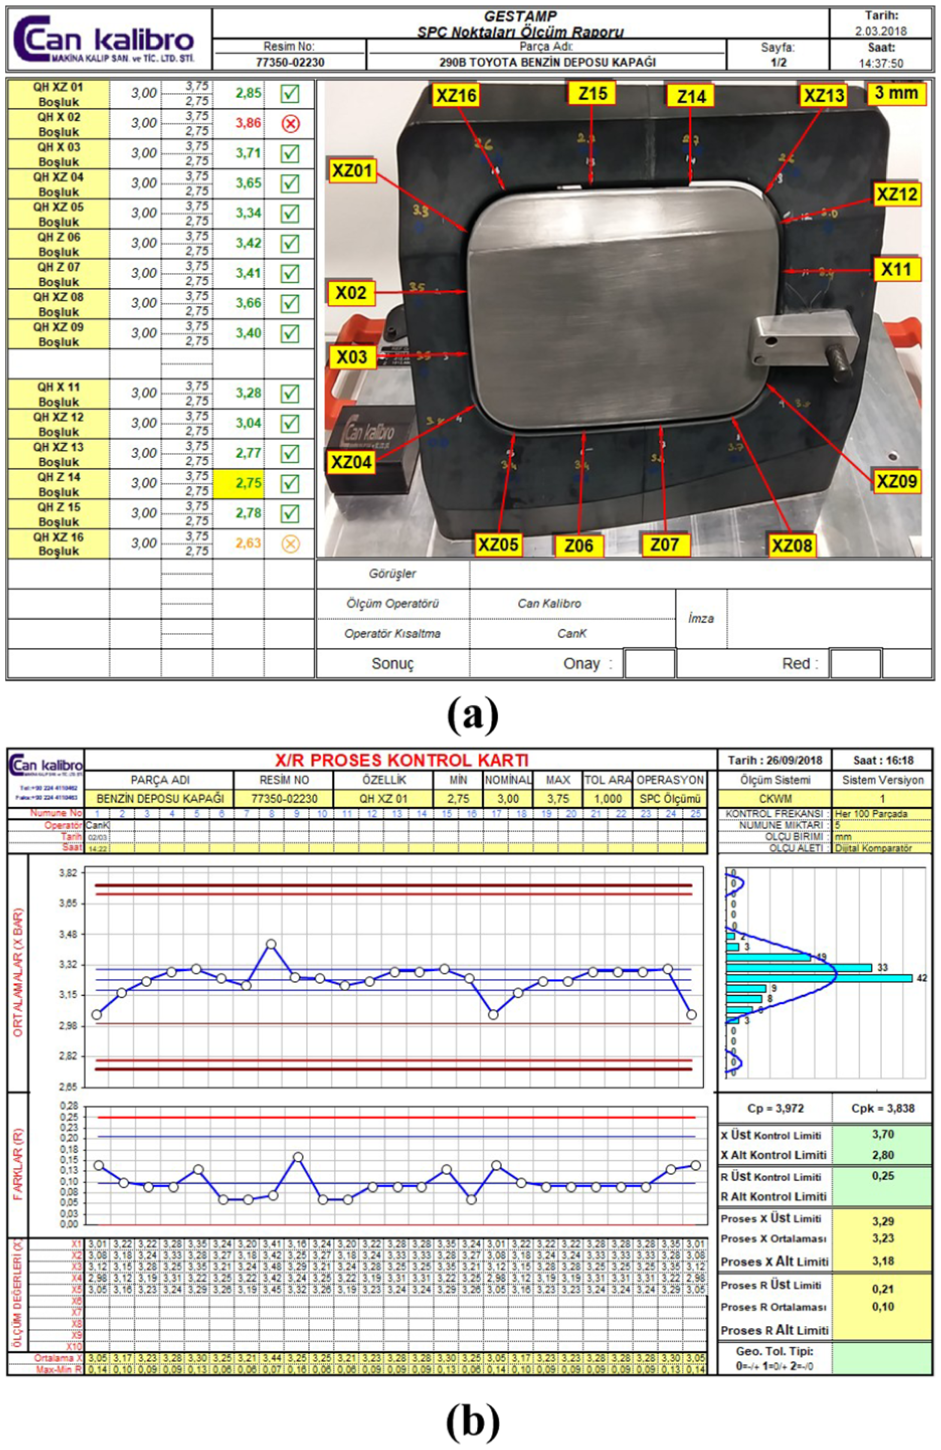
Data visualization, (a) inspection data, (b) SPC data (by Can Kalibro).
Repeatability tests
The system described in the previous paragraphs was built as a prototype (see Figure 1) to test the general concept, focusing on measurability and repeatability. To simulate a worst-case scenario, tests were conducted using a profile laser sensor with accuracy near the acceptance limit. The sensor was mounted on a sigma aluminum base and positioned indoors, just 5 m away from a powerful milling machine.
For testing, a “faulty” car sheet metal part of the lateral B-pillar was selected to measure gap and flush values at seven sections perpendicular to the trimmed perimeter, the tolerances were around ±0.7 mm. For simplicity and as a worst-case assumption, both gap and flush measurements were assigned a narrower tolerance of ±0.5 mm at each cross-section. This value was chosen based on typical tolerances for car body parts, which generally have coarser specifications compared to moving parts like engines or suspensions. Additionally, it simplifies the analysis by providing a total tolerance of 1 mm. A specific fixture for the CFMM system was designed to fix and reference the part during measurements (see Figure 3).
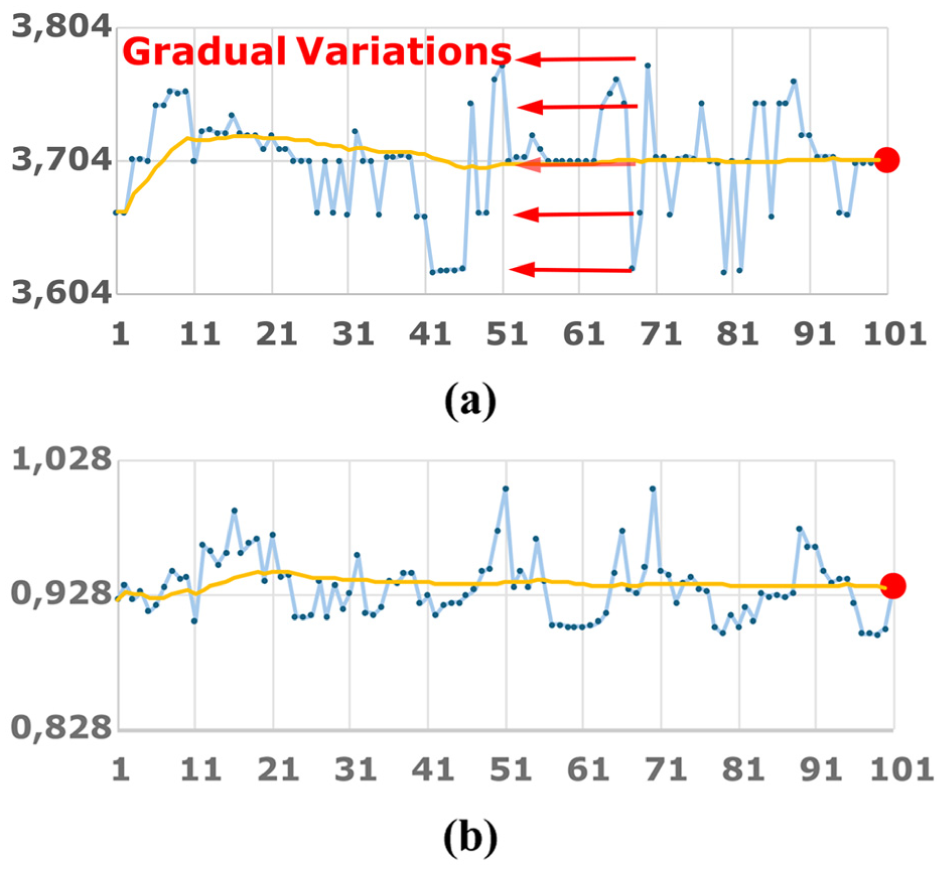
Since the CFMM functions as an automated gage. The “observation of one measurement moment” is done during 100 consecutive readings after the cobot stops till it reaches its steady state. All these 100 readings are plotted (See Figures 9 and 10) in “blue” to study the behavior of vibrations transmitted through the cobot motion and/or ground. A “1D Kalman filter” (see Ref. 22 ), which simulates a “mean filter,” had also been added in “orange” (See Figure 9(a) and (b)) to these plots. This filter is one of the simplest ones that corresponds exactly to the mean of all previous readings.
Raw and filtered data from laser profile sensor measurements per scan (by Can Kalibro): Raw data (blue)/with Kalman (orange). (a) Gap, (b) Flush.
Raw and filtered data from laser profile sensor measurements per scan (vibration motor rotation about the Y-axis) (by Can Kalibro): Raw data (blue)/with Kalman (orange). (a) Gap, (b) Flush.
During these “gap tests” (see Figure 9), which correspond to X-axis variation, at the beginning of the stopping stage, we observed that the profile laser readings were coarse enough to cause “gradual variations.” After the cobot “stop signal” until the steady stay stage, we observed jumping between, for instance, three distinct values corresponding exactly to sensor uncertainty. As indicated in Figure 5(d), these jumps are due to sparse placement of profile laser measuring cells, which leads to jitter effects at the gap edge points during cobot “full stopping behavior”; we observed the Kalman curve, which effectively mitigates this phenomenon and tracks the distribution as a median value (see orange curve in Figure 9(a)).
On the other hand, this weakness cannot be noticed so obviously for flush measurements because “the Z axis characteristics of the sensor are 5 to 7 times more precise than the X axis.” You can see it perfectly on the unfiltered flushes (blue) readings in Figure 9(b).
The last big red points on Figure 9(a) and (b) show the Kalman final measurement value after 100 successive readings, and we use it as the measurement result.
Type 1 gage study
To do “Type 1 Gage Study 23 ,” all part 7 sections’ gap and flush measurements were taken 50 times, each obtained after 100 successive readings with a simple 1D Kalman filter. With the Type 1 Gage Study, there are seven rules to check. But during measurements, some values are predefined, like:
Measurement Number, N = 50
Measurement Total Tolerance, TotTol = 1 mm
Profile Laser Max. Accuracy, MeasAcc = 0.047 mm
Standard Deviation of N Measurements = σ
Here are the rules for the Type 1 Gage Study:
Always True because: [0,047≤0,05*1]
[(MaxMeas-MinMeas)≤0,20*TotTol]»
[p-Val=TDIST(|MeanVal-NomiVal|*√N/σ;N-1;2)]»
(TDIST: T-Distribution function from MS Excel)
[Cg=0,20*TotTol/6/σ≥1,33]»
[%Variability(Repeatability)=20/Cg≤15]»
[Cgk= (0,10*TotTol-|Bias|)/3/σ≥1,33]»
[%Variability(Repeatability,Bias)=20/Cgk≤15]»
Type 1 gage study test results
Table 1 below shows the measurement results compiled in the Can Kalibro factory workshop vibration environment for the Type 1 Measurement Study rules.
Type 1 gage study under factory shop floor vibration environment.
An initial inspection of Table 1 indicates that all criteria were met, and the results fall within the specified target limits.
Even upon closer inspection, we do not see any significant measurement change between the Flush and Gap measurements despite the gradual change in Figure 9(a) and the “weakness” phenomenon noted in Figure 5(d). Although the tests were carried out in workshop conditions and with a low-sensitivity sensor, we obtained results that exceeded our expectations.
On the other hand, even in the case of p-Val ≥ 0.05, the whole system looked good for an acceptable bias despite the mentioned weakness. Here is our p-Val calculation with MS Excel notations:


But this vision may be hiding a subtle weakness from another perspective. To make a concrete comment, let’s think in reverse and look for the “real limits” of the acceptable measurement of p-Val ≥ 0.05?
Her is this reverse calculation:


Then the measurements limits and null bias delta band of the Table 1 will be as follows (see Table 2):
Measurement limits for no bias p-Val.
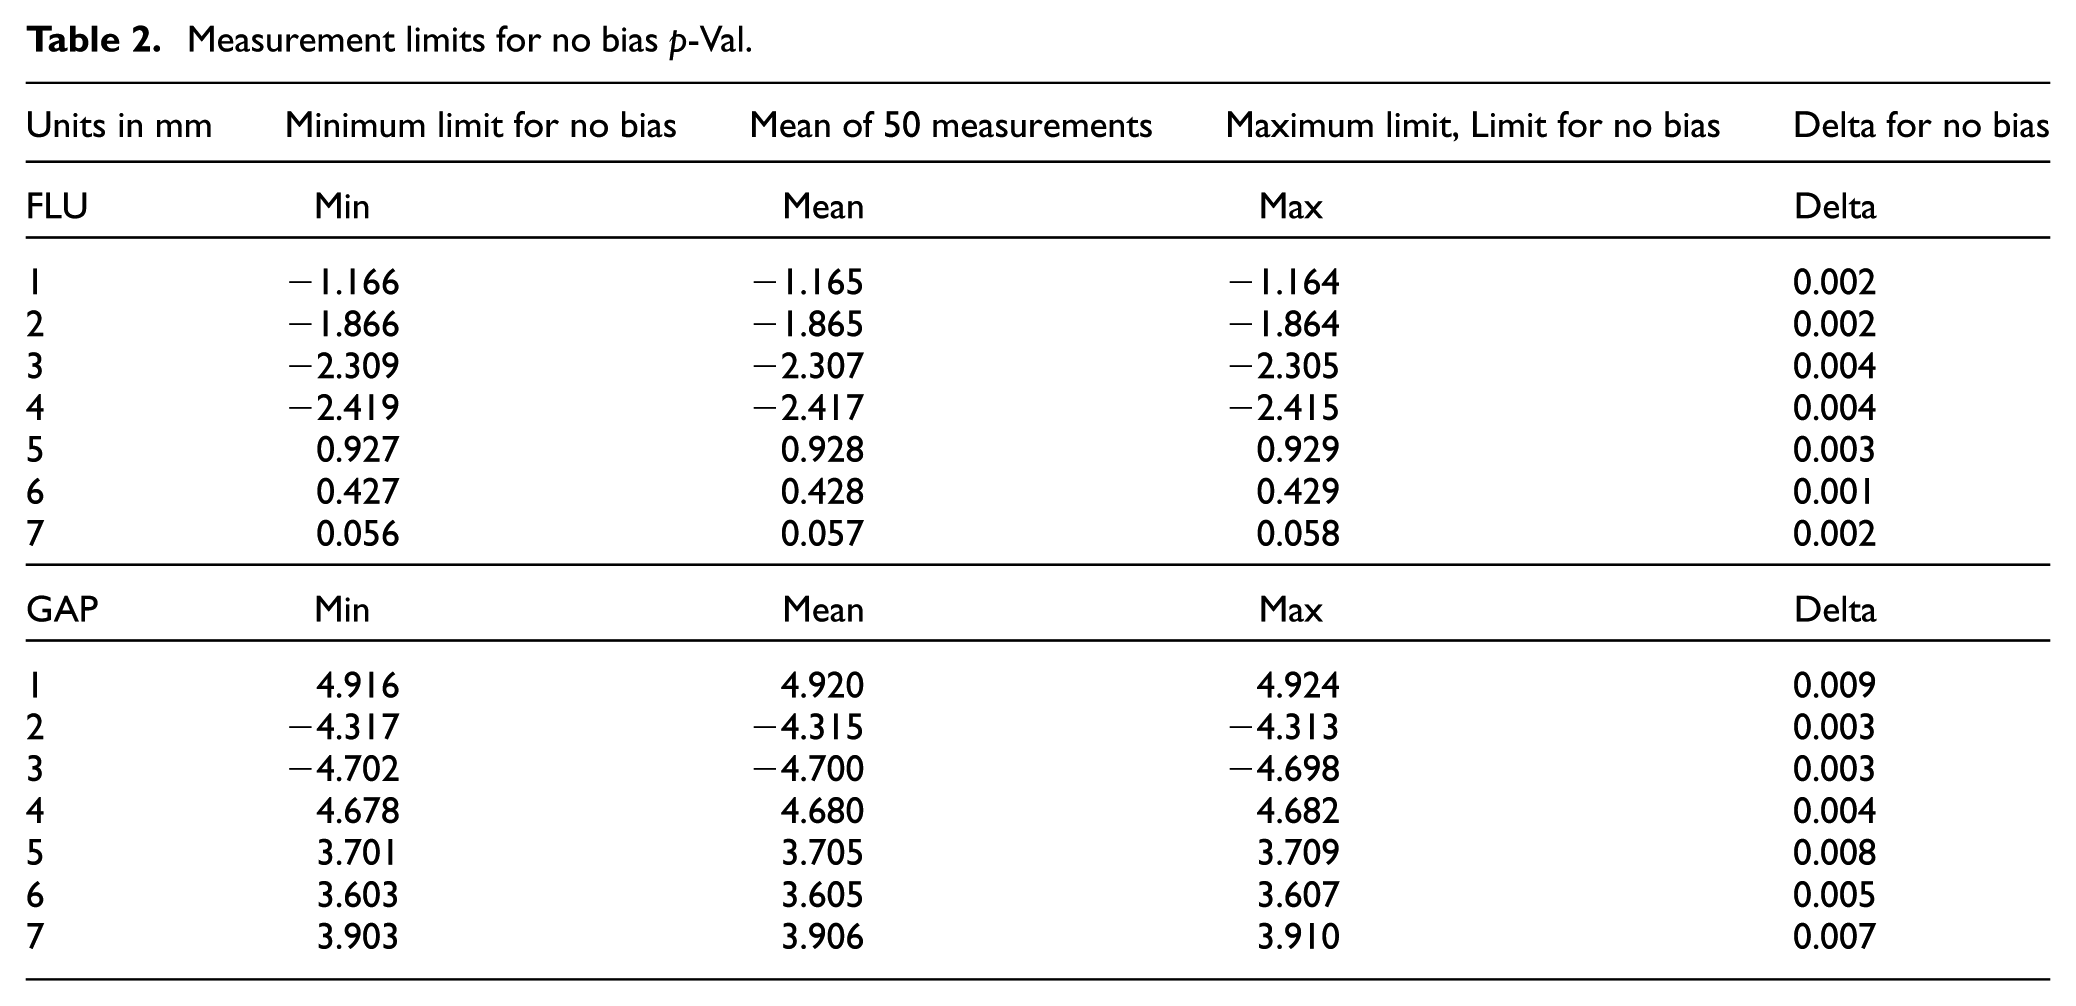
First of all, let’s observe the correlation between “%Variabilities of the Table 1” and “Delta for no bias of the Table 2”.
See that the deltas are only a few microns (see the last column); our system seems prone to bias in these conditions. Although the measurements obtained near the machine tool appear stable, there is no guarantee that deviation will not occur under stronger environmental influences.
In these conditions, to simulate and see non-ideal shop floor conditions, it will be necessary to apply artificial vibrations to the system. A vibration motor was mounted on the fixture holding the test part and a three-axis analog accelerometer was directly attached to the part near the measurement area (see Figure 1). A 50 g eccentric mass was attached to a DC motor and positioned 3 cm away from the motor axis. As the motor speed gradually increased, the induced vibrations were observed using data collected from the analog accelerometer. Resonance behavior was observed at certain frequencies, and vibrations of approximately 0.2 g RMS (the test part was subjected to an average acceleration of about 0.2g in a fluctuating manner) were recorded.
All vibration tests were performed under these resonance conditions, where the measured part experienced maximum acceleration. The motor was rotated separately along the X, Y, and Z axes (It is shown around X axis in Figure 1). While the motor rotated along one axis, harmonic artificial vibrations appeared in the other two axes. Although this method does not fully simulate real production line vibrations—especially those originating from mechanical presses—it was used to demonstrate the robustness of the measurement method under controlled disturbances. We finally obtained three additional results tables similar to Table 1. Instead of presenting raw numbers, we summarized the outcomes using a color-coded scheme indicating rule conformity in green or red, along with our interpretations.
Table interpretations
Table 3 summarizes the Table 1 data, and the vibration test results around each XYZ axis, if either compliant (green) or not (red) with the Type 1 Gage Study guidelines. Remember that Table 1 data (N) is fully green.
Type 1 gage study under artificial vibrations generated by the rotation of an eccentric mass about the X, Y, and Z axes.
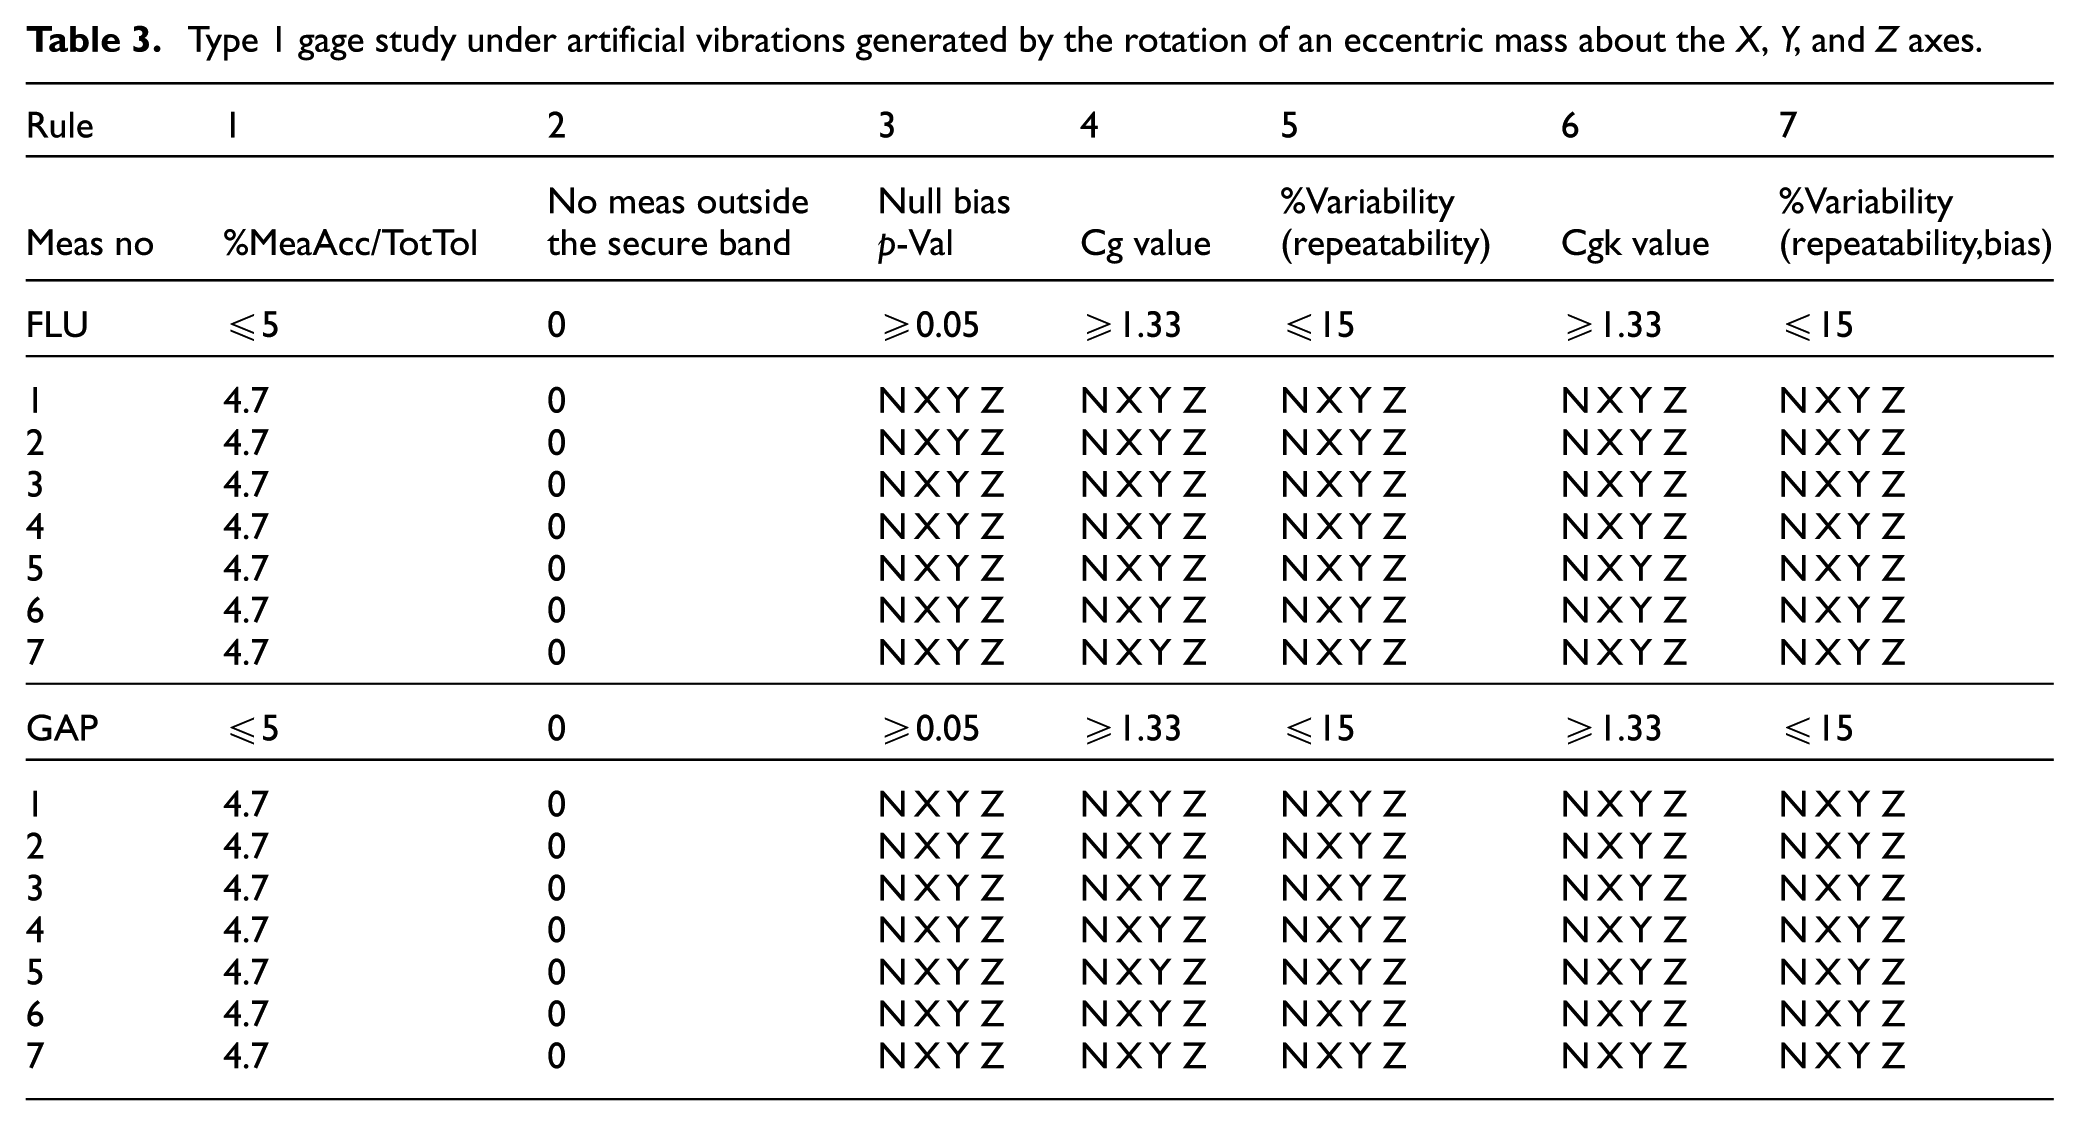
During the excitation around the X axis, as expected, almost all p-Vals ≤ 5%, and most are even zero; therefore, a potential for bias exists. But all the other rules look perfectly appropriate.
During the excitation around the Y axis the behavior is similar. The other rules are also appropriate, except at point no 5, “the measurement capability” and “the variation of repeatability” are both slightly beyond tolerance limits. Focusing on this point specifically, we observe that some extra vibrations occur in the flush direction due to part local resonance, such as the “membrane effect.”
During the excitation around the Z axis, as expected, almost all p-Vals ≤ 5%, and most are even zero; there is a “bias” probability. Due to the axis changing of the vibration, the “membrane effect” behavior of point 5 is now visible on the gap measurement. New flush and gap variations appeared at points near the vibrator fixing area, all due to Cgk and its Bias Variability.
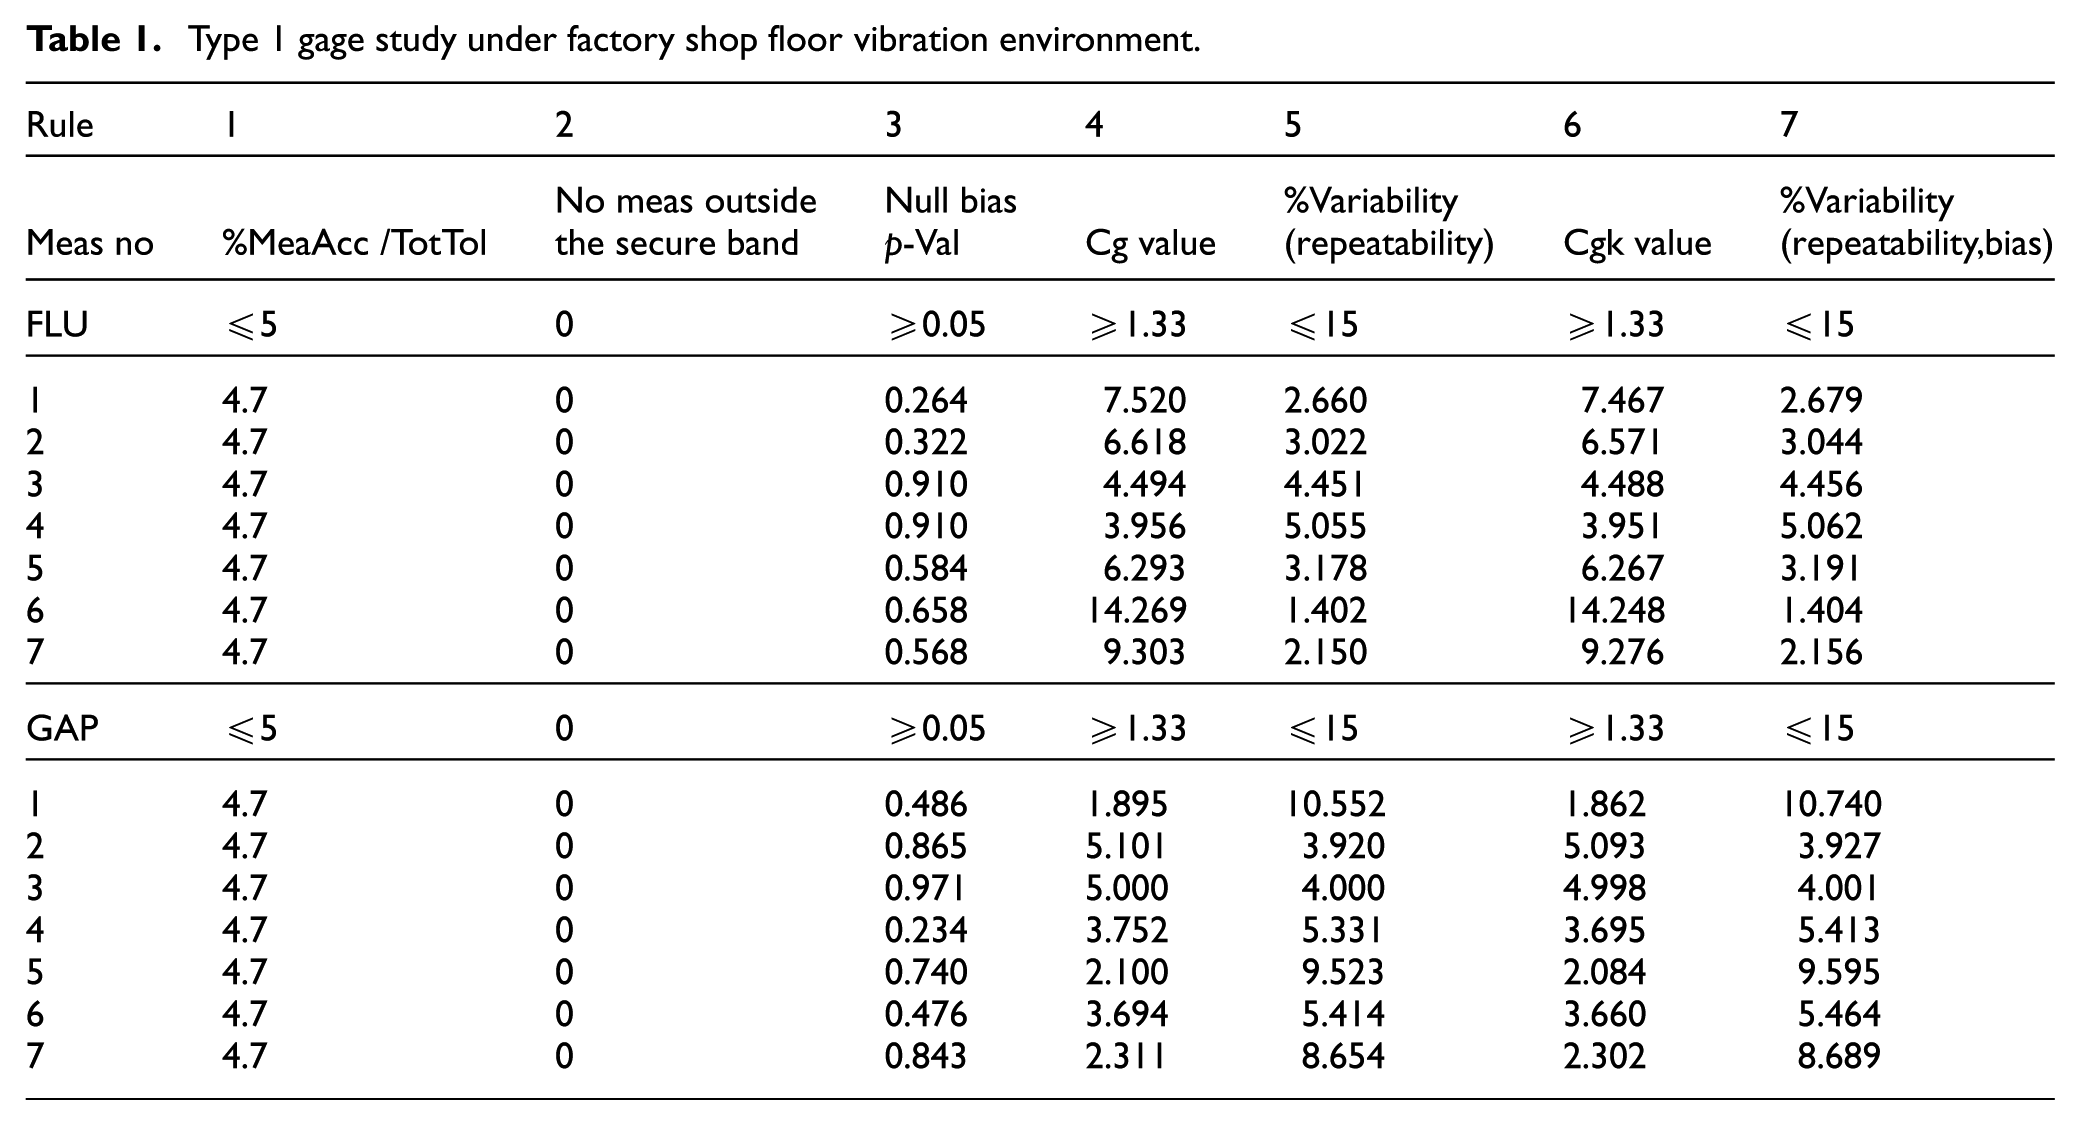
Remember Figure 9(a) and (b) which are 5’th section gap and flush dimensions. They were showing 100 successive measurements and Kalman effects closer. And check now the same gap and flush dimension measurement graphics with “around Y the axis vibrations” (See Figure 10(a) and (b)).
As shown in the graph, the introduction of vibration resulted in new levels of gradual variations in the gap measurements and that no damping occurs as in the previous measurement processes without vibration. This is blinking end point effect under vibration (See Figure 5(d)).
Notice that the flush measurement is an amplified version of the flicker-free case. However, the Kalman filter behaves the same way, converging to the same value with a very small bias.
Measurement uncertainty isn’t just caused by vibrations from an artificial vibrator or the external environment. In fact, we should note that there are also some sources of uncertainty within the measurement system itself. For example, the UR cobot, like all other robots, uses servo motors to reach a given position, and once there, it does servo compensation for any deviations to maintain its position. Therefore, it cannot provide a “stop signal.” Even when external vibration occurs, it attempts to suppress it with servo movements. Therefore, the cobot itself is a source of vibration which causes the profile sensor blinking end point effect of Figure 5(d).
Conclusions
In conclusion, the proposed method demonstrates practical applicability in the field of part measurement and offers a promising approach for automated part verification. While traditional measuring devices and robots are often considered limited by joint gaps and environmental factors such as vibration and temperature, our CFMM prototype shows that, with appropriate precautions and filtering, robots have the potential to achieve measurement accuracy comparable to CMMs when used with simplified reference control fixtures. The system records the measurement and its reference simultaneously within the same field of view, enabling reliable and repeatable results even under worst-case conditions. In CFMM, a cobot carrying a profile sensor replaces the human operator in reading reference points, with the computer evaluating profile data using suitable algorithms.
Tests conducted under artificial vibrations demonstrated that, despite minor bias tendencies, repeatable measurements remained reliable. Further improvements—such as higher-precision sensors, enhanced filtering, or additional measurement points—could reduce vibration-induced errors even more. Future research will prioritize evaluating the system under actual shop floor conditions and systematically gathering user feedback to validate its industrial applicability. Furthermore, the research agenda will encompass a comprehensive analysis of measurement errors, validation against third-party data, experimental investigations on production lines, and the development of a portable prototype designed for industrial deployment.
As future research work, the effects of cobot positional uncertainties on measurement accuracy can be investigated more comprehensively. Specifically, instead of a single profile laser, by using more than one positioned parallelly or at a certain angle, the perpendicular distance in the gap can be calculated using geometric relationships, eliminating the requirement for the cobot to hold the laser perpendicular to the cross-section. This approach is considered a potential improvement that could enhance measurement accuracy and increase the device’s operational flexibility.
While the effects of thermal expansion can currently be mitigated by using compatible materials, it is also possible to integrate temperature sensors into the system to account for thermal expansion during measurement and automatically update the data via software. This approach offers significant potential for future work to improve measurement accuracy and reduce uncertainty.
Footnotes
Acknowledgements
The authors would like to express their sincere gratitude to Can Kalibro for their valuable support throughout this study. Prototype development and implementation were made possible entirely through the technical and material contributions of Can Kalibro.
Ethical considerations
This research did not involve any human or animal subjects and therefore did not require ethical approval.
Consent for Publication
Not applicable. This study does not involve human participants or patient data.
Funding
The authors disclosed receipt of the following financial support for the research, authorship, and/or publication of this article: This research was fully supported by Can Kalibro, which provided all the technical and material resources required for prototype development. No other external funding was received.
Declaration of conflicting interests
The authors declared no potential conflicts of interest with respect to the research, authorship, and/or publication of this article.
Trial registration number/date
Not applicable. This study does not involve a clinical trial.