
Abstract
This paper proposes a new fractional-order type-2 fuzzy logic control (FO-T2FLC) technique for maximum power point tracking (MPPT) in a wind turbine system based on doubly fed induction generators (DFIGs). Type-1 fuzzy logic control (T1FLC) and traditional proportional-integral (PI) techniques have limitations in terms of accuracy, reaction time, and resilience under fluctuating wind conditions. The suggested FO-T2FLC combines type-2 fuzzy logic with fractional calculus to enhance dynamic performance, minimize steady-state error, and increase system flexibility, all without requiring a precise mathematical description of the system. The MATLAB simulations are used to evaluate the control strategy under step, random, and fault-like wind speed fluctuations. Comparative analyses show that FO-T2FLC outperforms PI and T1FLC by more than 99% in terms of performance indices, including Integral Absolute Error (IAE), Integral Time Absolute Error (ITAE), Integral Squared Error (ISE), and Integral Time Squared Error (ITSE). It also minimizes tracking error and converges to the optimal tip speed ratio more quickly. The results demonstrate that the FO-T2FLC-based MPPT approach significantly enhances the robustness, stability, and efficiency of DFIG wind energy conversion systems, making it a viable option for contemporary wind power applications.
Keywords
Introduction
Renewable energy (RE), particularly wind energy (WE), has become a critical key in the global effort to minimize greenhouse gas emissions, decrease dependency on fossil fuels, and mitigate the impacts of climate change.1–3 WE, as a clean, abundant, and sustainable resource, play a central role in transforming the global energy mix. Unlike fossil fuels, WE produces no direct emissions of carbon dioxide or other pollutants, making it an environmentally friendly alternative that significantly lowers the carbon footprint of energy production. These benefits have driven significant expansion in offshore WE, with global offshore wind capacity reaching 64.3 GW by 2022, representing 7.1% of the world’s total WE installations. 4 This growth highlights the potential for WE to serve as a cornerstone in the RE sector, providing reliable and scalable power that helps countries achieve their climate and sustainability targets.
WE present various economic and environmental benefits beyond emissions reductions. Economically, the wind sector has become a major source of job creation and investment, especially in regions where other industries may decline. According to the International Renewable Energy Agency, the RE industry will employ over 13.7 million people worldwide in 2022, 5 with this number projected to rise as more countries pursue renewable energy pathways. Additionally, as WE is naturally sourced, it reduces dependence on imported fuels, enhancing energy security and stabilizing energy prices. This aspect is particularly important for countries seeking to minimize the economic impacts of volatile oil and gas markets.
On the environmental front, WE significantly reduces air pollution, water consumption, and land degradation associated with fossil fuel extraction and combustion. Each megawatt-hour of wind-generated electricity offsets nearly a ton of CO2 emissions, making it a valuable resource for reducing air pollutants that contribute to respiratory illnesses and environmental degradation. Furthermore, unlike thermal power plants, wind turbines (WTs) do not require water for cooling, which conserves freshwater resources in areas susceptible to droughts. Technological advancements in WT design, control strategies, and grid integration have made WE more efficient, cost-competitive, and adaptable to various environments, from onshore to offshore installations.6–8
Maximum power point (MPP) tracking (MPPT) is essential in WT systems for optimizing energy capture across varying wind conditions. The power output of a WT is directly related to wind speed (WS), and due to the highly variable nature of wind, it is challenging to continuously harness maximum power. MPPT techniques address this by dynamically adjusting the turbine’s operating parameters, particularly the generator speed, to maintain an optimal tip speed ratio (TSR). This ensures that the WT extracts the maximum available energy from the wind at any given moment, significantly improving overall efficiency.9–12
Without effective MPPT, turbines may either operate below their potential, wasting available WE, or at conditions that cause mechanical strain, potentially shortening their lifespan. The MPPT strategy, based on a proportional-integral controller (PIC), is often used to control WT operation.13,14 This strategy does not require knowledge of the precise mathematical model of the WT. It also offers the advantages of simplicity, lower costs, rapid dynamic response, and ease of implementation. This strategy is used to determine the reference value for active power in WE generation. However, the use of a PIC regulator makes the MPPT strategy unsatisfactory in the event of a turbine malfunction.
MPPT algorithms, especially advanced methods that incorporate artificial intelligence or adaptive control,15–18 offer improved responsiveness to rapid wind fluctuations, maintaining optimal power extraction even in turbulent conditions. By maximizing energy capture, MPPT contributes to a more reliable and consistent power output, enhancing the economic viability of WE. In the context of large-scale wind farms, effective MPPT not only increases energy yield but also supports grid stability, making it indispensable for efficient, cost-effective WE systems.
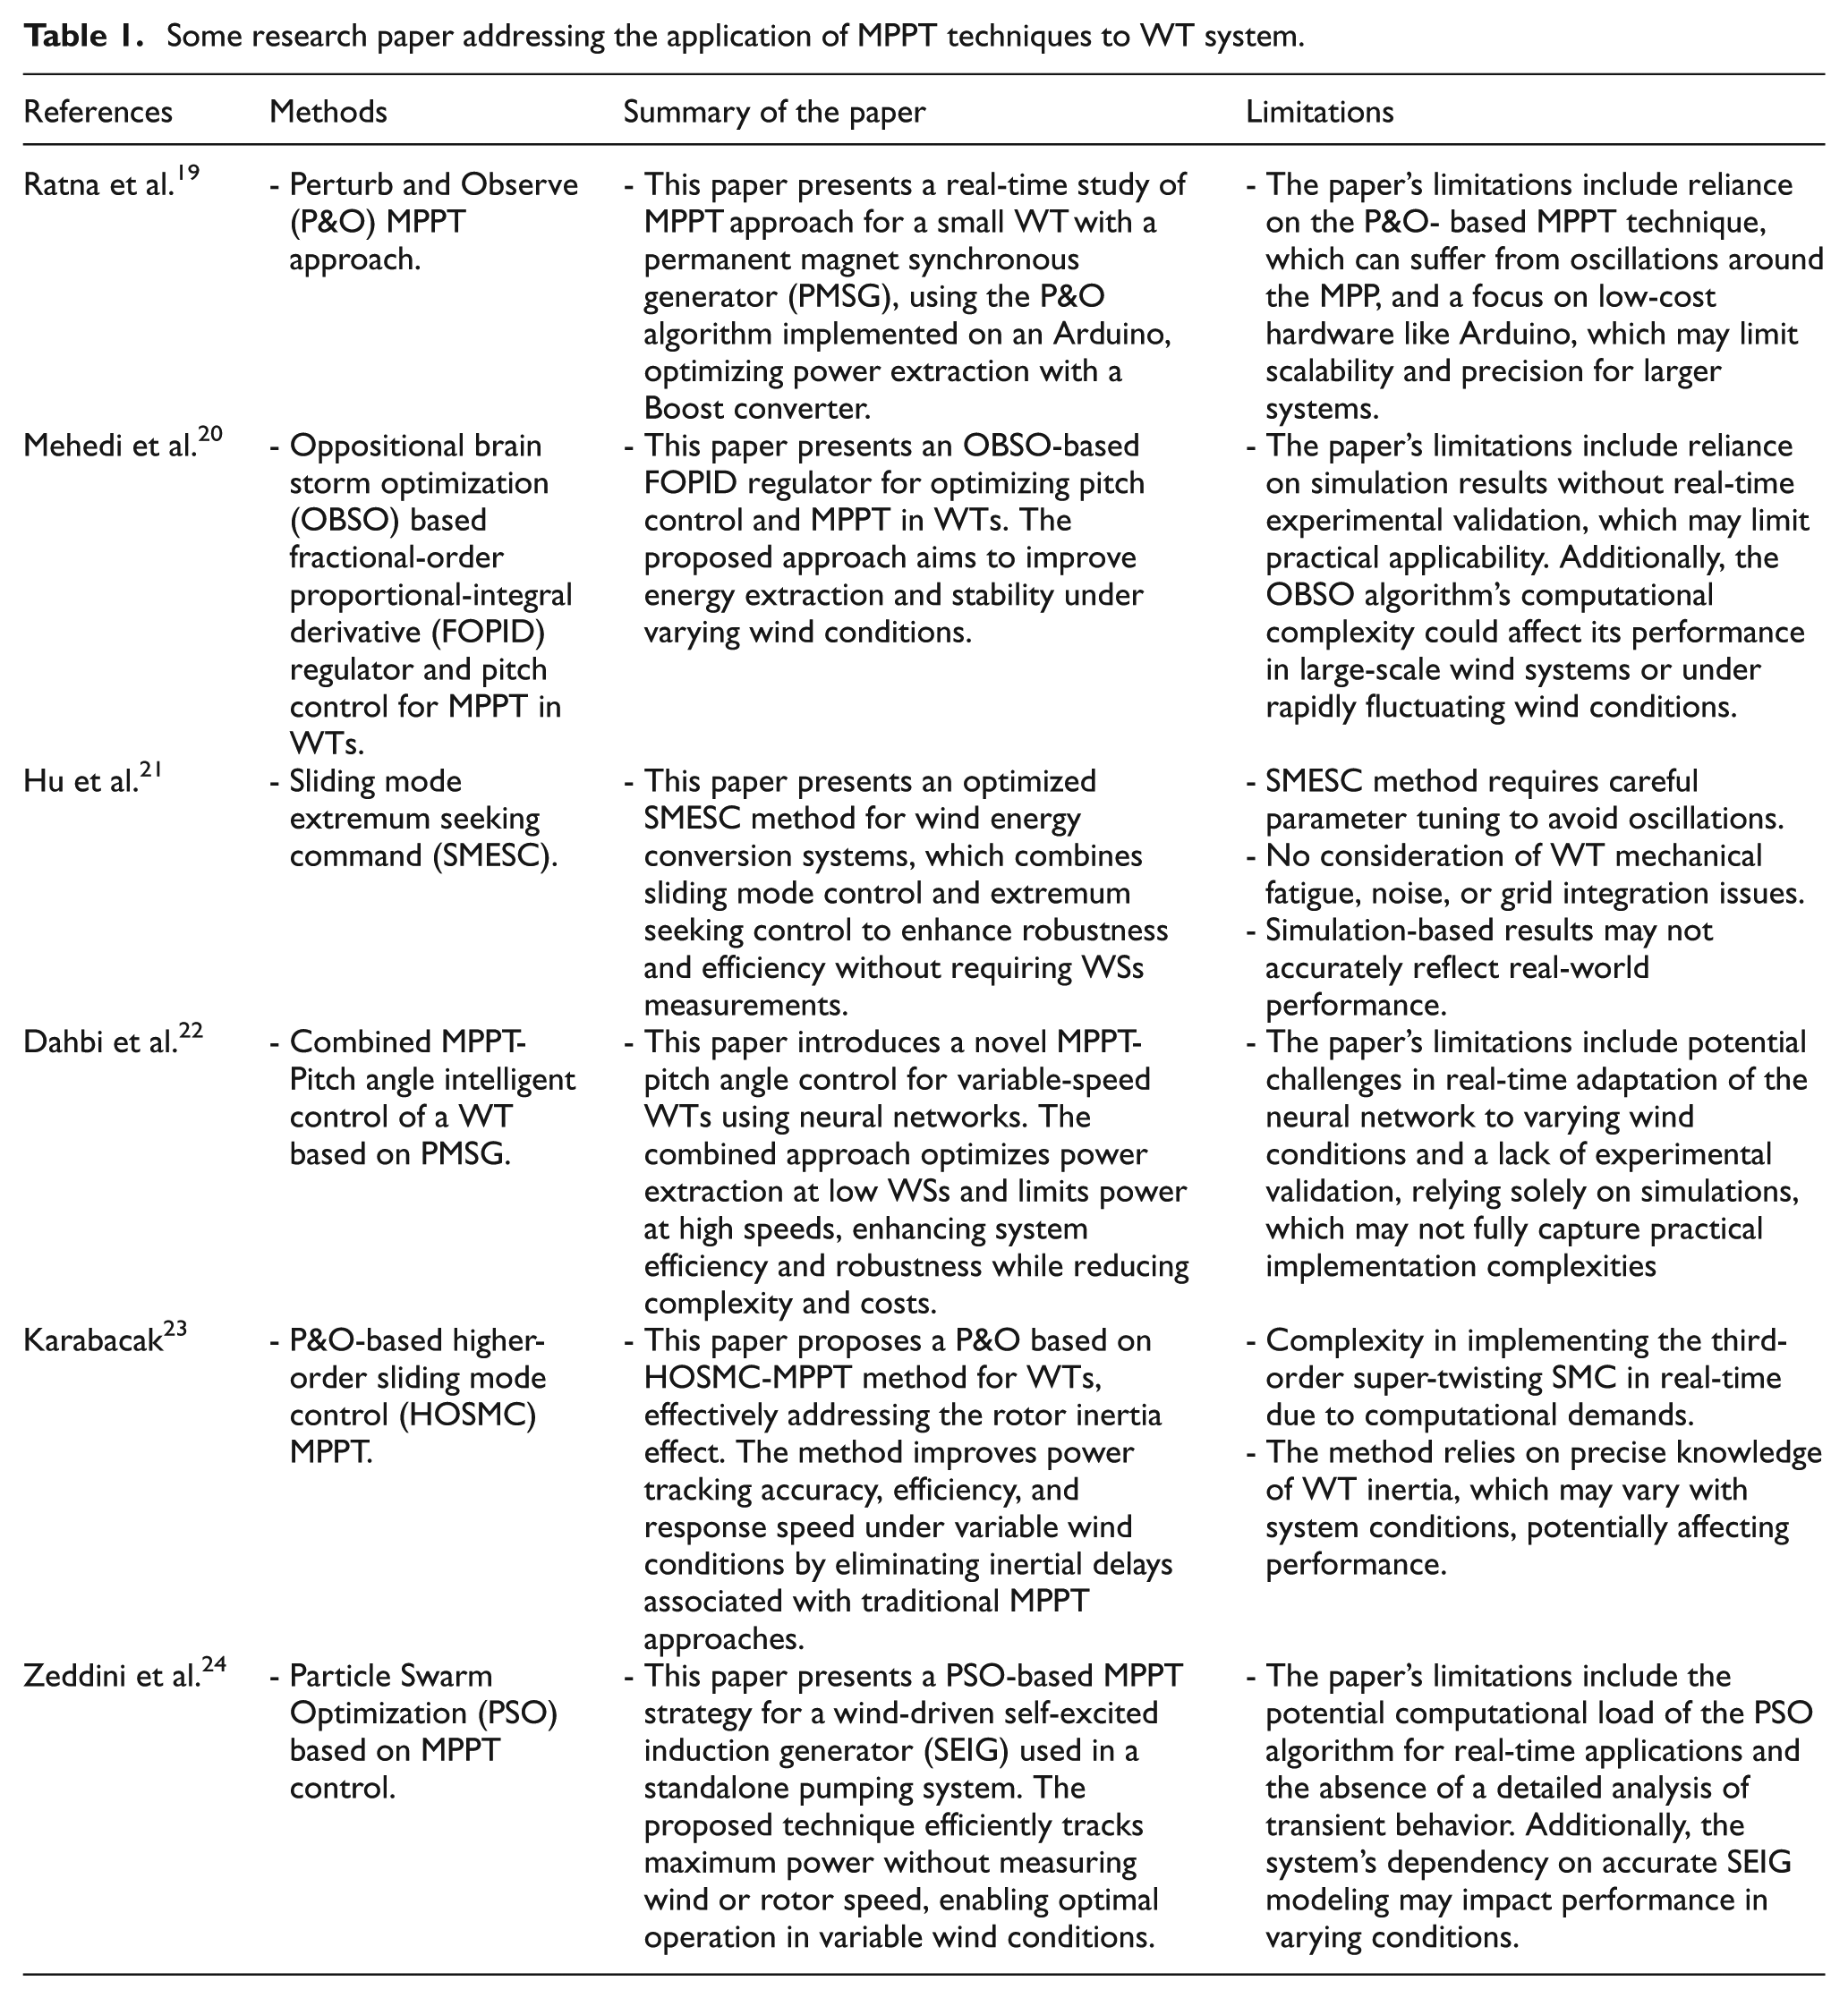
Table 1 illustrates several research articles that show MPPT control strategies applied to extract maximum energy from WT systems. These studies highlight various approaches to optimizing energy capture through advanced algorithms, demonstrating the effectiveness of MPPT in adapting to changing wind conditions. By employing these strategies, researchers aim to enhance the efficiency and reliability of WE systems, ultimately contributing to greater energy production and sustainability.
Some research paper addressing the application of MPPT techniques to WT system.
The MPPT strategy is one of the most prominent options used for controlling photovoltaic systems.25,26 Using this strategy allows for maximizing the output voltage. To implement the MPPT strategy for photovoltaic systems, the incremental conductance 27 and P&O algorithms 28 are often used. Despite the performance offered by these algorithms, some challenges hinder the MPPT strategy from achieving satisfactory results. The most prominent challenges hindering the widespread use of the MPPT strategy are its low robustness and high ripples. Several more effective and efficient solutions have been proposed in the literature to improve the properties of the MPPT strategy. Feed-forward function neural networks (FFNN) are an algorithm proposed to overcome the problems encountered in the MPPT strategy in. 9 This algorithm relies heavily on experience to achieve better performance, as its use does not require in-depth data of the system under study. The results demonstrate the effectiveness of using the FFNN technique in improving the robustness and operational performance of the MPPT strategy. This strategy can be relied upon for controlling multi-rotor turbines. In, 29 a new controller based on the combination of Genetic algorithm (GA) and backstepping controller (BC) was proposed to create a new approach that has the potential to improve the characteristics of the MPPT strategy. The use of this solution allows for increasing the operational performance of the MPPT strategy, as this performance is evident in the reduction of power factor fluctuations. However, this solution is characterized by a greater degree of complexity, which makes it experimentally expensive. Another MPPT strategy proposed in 30 is based on combining PSO and neuro-fuzzy algorithms. This strategy is characterized by high performance and efficiency in reducing output voltage ripples. The use of this new strategy depends largely on experience. Compared to the traditional approach, this strategy is more complex, requiring a strategy that can balance high performance, high robustness, and simplicity while maintaining ease of implementation. In, 31 neural networks and the BC method were combined as a suitable solution to enhance the properties of the MPPT strategy. The resulting strategy exhibits high performance and great robustness, as demonstrated by simulation results under various operational conditions. However, despite this operational performance, some drawbacks hinder the spread of this approach. The most prominent drawbacks are the significant number of gains and the high degree of complexity, which makes this solution expensive. The crow search algorithm is the solution adopted in the work 32 to overcome the problems of the MPPT strategy. Using this solution does not require complex calculations or knowledge of the mathematical model of the system in question. This solution is used to determine the optimal values for the MPPT strategy, allowing for a significant increase in operational performance compared to the traditional technique.
There are insufficient studies on MPPT strategies for WE conversion chains in the technical literature. Protecting WT infrastructure and achieving optimal control are significant challenges. Control strategies based on combining artificial intelligence algorithms and nonlinear strategies are highly recommended.
The fractional-order control technique is one of the most prominent nonlinear strategies that has demonstrated exceptional performance. It is mathematically based, and its application does not require precise data of the system model. 33 Its use in controlling WTs remains largely unexplored. This strategy has been used in several fields, especially in the field of RE. In, 34 the fractional-order control-based PIC strategy was used to control the power of a turbine system. Using this strategy led to a significant improvement in the efficiency of the PIC controller and a significant increase in power quality. Also, fractional control was applied to improve the characteristics of the photovoltaic system in. 35 Using this strategy led to a significant improvement in the quality of the output power, which demonstrates the effectiveness of using this strategy. A combination of fuzzy logic controller (FLC) and fractional-order control has been proposed in 36 to improve the power quality and characteristics of the generating system. This resulting strategy exhibits high performance and robustness. Furthermore, this strategy does not rely on the mathematical model of the system under consideration, making it a promising option. Results have demonstrated the effectiveness of this strategy under all different operating conditions compared to the conventional approach. This strategy has been proven to perform in other systems,37,38 where it significantly reduced torque and current ripples compared to conventional strategies.
Another proposed combination of neural control and fractional-order control was 39 for controlling an asynchronous generator integrated into a multi-rotor WT system. Two fractional-order neural regulators were proposed to control the power, with the outputs representing reference voltages. A PWM strategy was also used to convert the reference voltages into pulses to drive the machine’s inverter. The effectiveness of the fractional-order neural regulator was compared with the conventional approach and some related work. The comparison demonstrated significant superiority of the fractional-order neural regulator in terms of reducing ripple values, overshoot, and steady-state error (SSE) of power. Furthermore, the use of the fractional-order neural regulator significantly improved robustness compared to the conventional regulator. In, 40 the author combined sliding mode control and fractional-order control to optimize the MPPT characteristics of a WT. Using this strategy significantly improved performance and efficiency. Furthermore, using this designed approach maximized power output and significantly improved power quality compared to the traditional strategy. Simulation results showed that the proposed controller achieved a climb time of 1.8 s, a settling time of less than 3.2 s, and a relative tracking error of less than 1.1%. These results reflect improved transient response and tracking accuracy compared to conventional strategies, especially under wind turbulence. Another work on the application of fractional calculus in, 41 where a FOPID controller based on the root tree optimization algorithm was proposed for power control of an asynchronous generator. This approach significantly improves the current and power quality compared to the conventional approach. In, 42 a simple dual-mode fractional order regulator is proposed as a solution to replace conventional regulators in the control field. The gain values of this controller were calculated using a sine-cosine optimization algorithm to increase the operational performance of the designed fractional-order regulator. Simulation results demonstrated the efficacy of the proposed fractional-order technique compared to the conventional regulator in improving the characteristics of the studied power system. The fractional integral controller is a designed solution for controlling power systems in operation. 43 This controller is based on fractional calculus, making it more robust and efficient. Test results have proven the durability of this regulator and its effectiveness in improving power quality and reducing current ripples compared to conventional regulators.
Recently, several strategies have emerged in the field of artificial intelligence that have provided satisfactory operational performance compared to traditional strategies.44,45 Type 2 FLC (T2FLC) is the most prominent of these strategies, which has provided high performance in the field of control, 46 especially in the field of RE. In, 47 the use of a T2FLC regulator based on GAs was proposed to improve the quality of the power output of a WT system. The results demonstrated the effectiveness of this new strategy in improving power quality and reducing the total harmonic distortion (THD) of current. Furthermore, using this strategy significantly improves robustness, making it a suitable choice for control applications. In, 48 the use of a T2FLC regulator is proposed to improve the properties of the MPPT strategy used to control a multi-level quadratic DC-DC boost converter. The designed MPPT strategy differs from the conventional strategy in that MATLAB is used to verify its effectiveness. The performance of this strategy is evaluated with both incremental conductance-based MPPT and FLC-based MPPT. The results showed that the MPPT strategy based on the T2FLC regulator gave satisfactory results in terms of performance and effectiveness compared to other strategies, making it a promising solution that can be relied upon in other fields. Therefore, these results attract industrial interest in applying the T2FLC-based MPPT strategy to WT systems. Combining this strategy with other strategies remains largely unexplored, which is one of the motivations for preparing this research paper.
In this research paper, an innovative approach known as the fractional order control-based type 2 FLC (FOT2FLC) was proposed to enhance the performance of MPPT in a DFIG-based WT system. This new strategy is designed to replace the use of the traditional MPPT strategy. The method combines the strengths of the T2FLC technique and fractional calculus to achieve robust and adaptive control. Therefore, the FOT2FLC controller is considered the first major contribution of this paper. This proposed controller is new and has not been used previously, as it differs from the controllers mentioned above. It is characterized by simplicity, high performance, great durability, and ease of use. Using the FOT2FLC controller does not require knowledge of the mathematical model of the turbine or generator, which gives it the ability to give good results in the durability test. This controller was applied to the MPPT strategy of DFIG-WT to increase competence and effectiveness. Therefore, the MPPT-FOT2FLC strategy is the second contribution of this paper. Using this strategy allows us to significantly improve the effectiveness and performance of the DFIG-WT system compared to the traditional algorithm. The MPPT-FOT2FLC strategy is characterized by simplicity, great efficiency, ease of realization, being inexpensive, high performance, great durability, and does not require data from the mathematical model of the studied system. The MPPT-FOT2FLC strategy is a development of the traditional algorithm, and MATLAB was used to verify its effectiveness and ability against both MPPT-PIC and MPPT-T1FLC.
In this work, different WS files are used to evaluate the efficiency and effectiveness of the MPPT-FOT2FLC approach compared to other strategies. Robustness testing is also used to verify the robustness of the designed approach to changes in system parameters. The use of the MPPT-FOT2FLC algorithm allows for improving the characteristics and performance of the DFIG-WT system, making it a promising solution in the future for other industrial applications. In the following points, the goals achieved by using the MPPT-FOT2FLC algorithm in the studied energy system are listed.
The use of the MPPT-FOT2FLC algorithm allows the energy gained from the wind to be greatly maximized compared to other algorithms.
Significantly improve response time.
Increasing the durability of the greatly studied energy system.
Reducing the values of IAE (Integral of Absolute Error), ITAE (Integral of Time-weighted Absolute Error), ISE (Integral of Squared Error), and ITSE (Integral of Time-weighted Squared Error) compared to the PIC approach and T1FLC technique.
Improving system stability compared to other algorithms.
Reducing the value of exceeding the limit value significantly compared to other algorithms.
This paper has 8 sections. The second section deals with modeling a turbine, where the necessary equations are given to implement this WT in the MATLAB program. The MPPT algorithm is discussed in Section 3. This section discusses the use of both PIC and FLC to improve the characteristics of the MPPT algorithm, mentioning the negatives and positives. In the fourth section, the proposed FOT2FLC algorithm is discussed, mentioning the details necessary to implement it. The MPPT algorithm based on the FOT2FLC approach is listed in Section 5, where the performance is compared with the T1FLC approach. In Section 6, the designed approach is implemented in MATLAB using various WS models. Limitations and challenges of the work are listed in Section 7. Finally, Section 8 discusses all the conclusions drawn from this work.
WT model
WTs are devices designed to convert the kinetic energy of wind into mechanical energy, which is then transformed into electrical energy through a generator. This conversion process is fundamentally influenced by several factors, including WS, the aerodynamic design of the WT blades, and air density. The efficiency with which a WT extracts energy from the wind depends on key aerodynamic parameters such as the tip-speed ratio, blade pitch angle, and power coefficient. Accurate modeling of these interactions is essential for the design, optimization, and performance prediction of WE systems.49–52
The power produced by a WT is directly proportional to the kinetic energy available in the wind, which is dependent on the WS and the area swept by the WT blades. This aerodynamic power can be mathematically expressed as49,53:
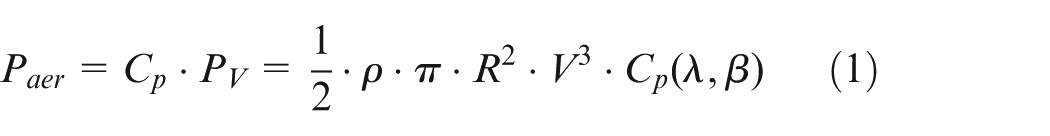
In this equation, P aer represents the aerodynamic power, Cp is the power coefficient, ρ is the air density (approximately 1.225 kg/m2), R is the blade radius, and V is the WS. The key factor here is the power coefficient Cp, which represents the turbine’s efficiency in converting WE into mechanical power. This coefficient depends on the tip-speed ratio λ and the blade pitch angle β, with a theoretical maximum value (Cpmax) of 0.48, achieved when λopt is about 8.1 and β is 0°, as shown in Figure 1.49,50,53
Bloc diagram of WT system. 49
In practice, the Cp cannot exceed this limit due to the Betz limit, which states that a WT cannot capture more than 59.3% of the wind’s kinetic energy.49,50,53

The term λ refers to the ratio of the blade rotational speed, given by the following relationship49,50:
With:
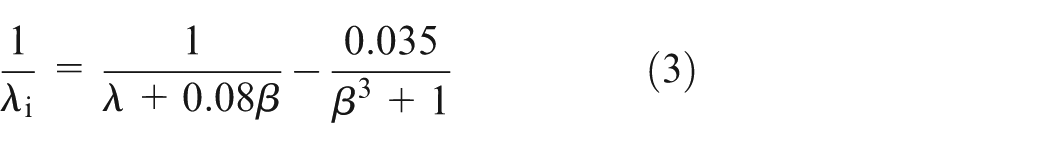
Where Ω t is the angular velocity of the WT in radians per second. This rotational speed, coupled with the WS, directly influences λ, which is a key parameter in determining the overall efficiency of the system. An optimal tip-speed ratio λopt is critical for maximizing energy conversion.49,53
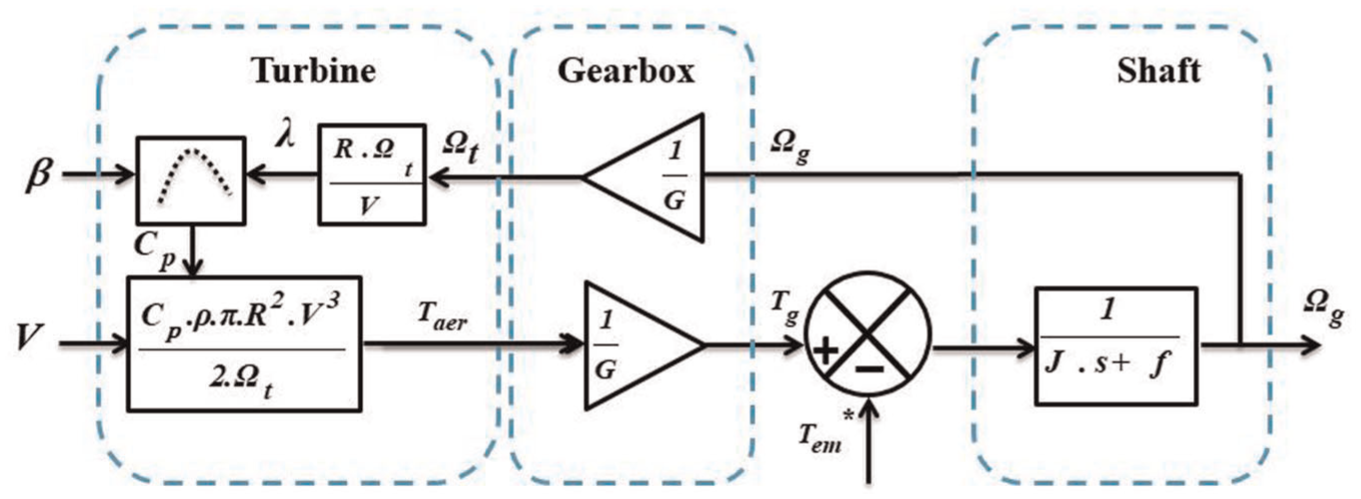
In addition to aerodynamic modeling, it is also important to describe the mechanical aspects of the WT. The mechanical dynamics of the WT can be expressed in terms of rotational speed, mechanical torque, and the electromagnetic torque generated by the generator (Figure 2). The overall mechanical behavior of the turbine is modeled by the following equation51, 52:
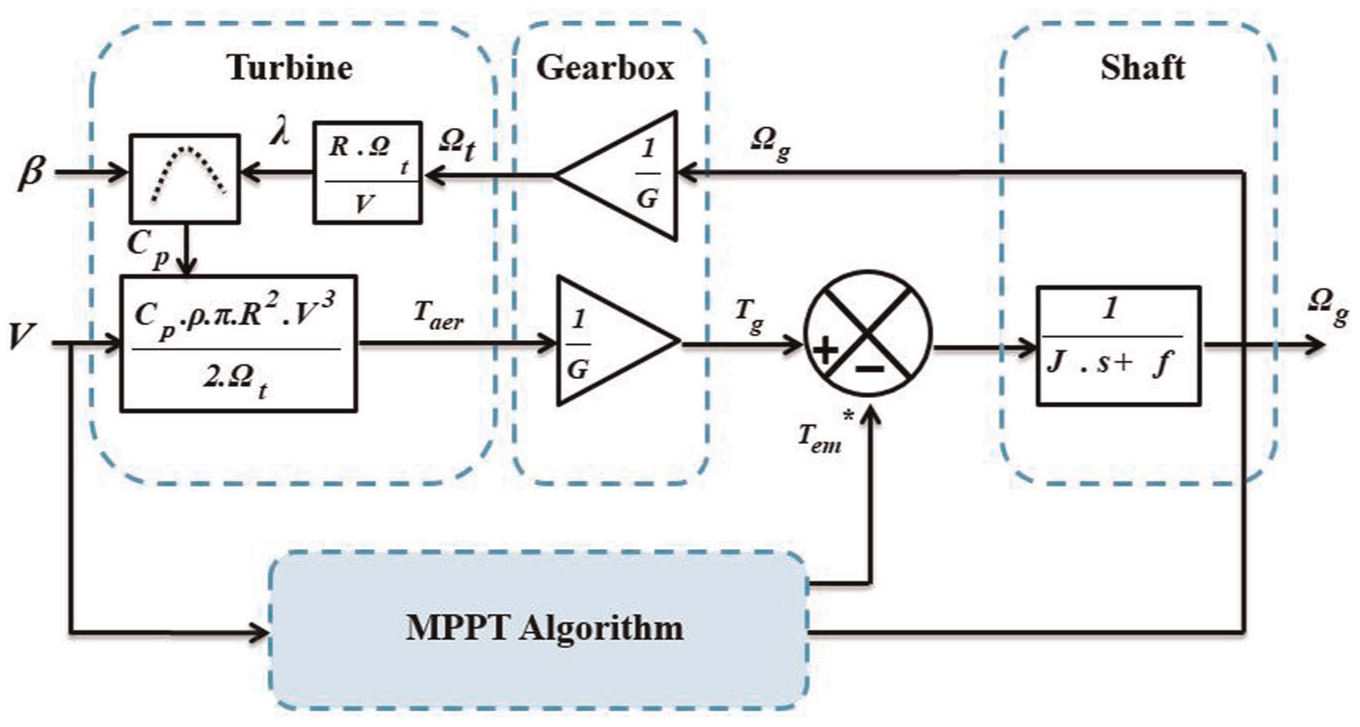
Bloc diagram of MPPT algorithm . 53
With:

Where J represents the total moment of inertia of the system, Ω g is the angular velocity of the generator, T g is the mechanical torque applied by the WT to the generator, T em is the electromagnetic torque generated by the electrical machine, and f is the friction coefficient that models mechanical losses in the system. The equation describes how changes in torque and rotational speed influence the turbine’s dynamics.
The total moment of inertia J is composed of the generator’s inertia J g and the turbine-transferred inertia J t modulated by the gearbox ratio G and can be expressed as follows49,53:
The gearbox ratio G allows the slower rotational speed of the WT to be adjusted to the higher speed required for electricity generation at the generator level.
MPPT approach
The MPPT approach plays a vital role in the control of WTs, as it is designed to optimize the extraction of power from available wind resources. This technique continuously adjusts the operating conditions of the WT to ensure maximum aerodynamic power capture under varying WSs. One of the key variables it modifies is the generator torque, which is critical in aligning the system with the optimal power curve at different wind conditions.53,54
There are two main categories of MPPT control strategies. The first type operates without directly controlling the mechanical speed of the WT; instead, it relies on estimates or assumptions of constant WS, leading to simplified control but potentially lower efficiency in varying wind conditions. The second category involves mechanical speed control, where feedback from the generator is used to adjust the rotor speed dynamically. This approach allows for real-time adaptation, optimizing power output by synchronizing the rotor speed with fluctuating WSs to stay closer to the MPP. 55
In this study, the MPPT technique is employed to fine-tune the turbine’s performance, leveraging mechanical speed control to enhance power extraction, as demonstrated in Figure 2. The approach ensures that the WT operates efficiently across a broad range of WSs, contributing to improved overall energy conversion efficiency.
Proportional-integral controller
The PIC regulator is implemented for managing the system due to its effective response to control inputs, noise sensitivity, and ability to reject disturbances. One of the main advantages of this controller is its relatively simple design, which allows it to eliminate SSEs and regulate speed. Unlike a proportional-integral-derivative (PID) regulator, the PIC omits the derivative component, reducing the system’s sensitivity to noise that can arise from the derivative action.56–58 The PIC controller of the MPPT algorithm is depicted in Figure 3.
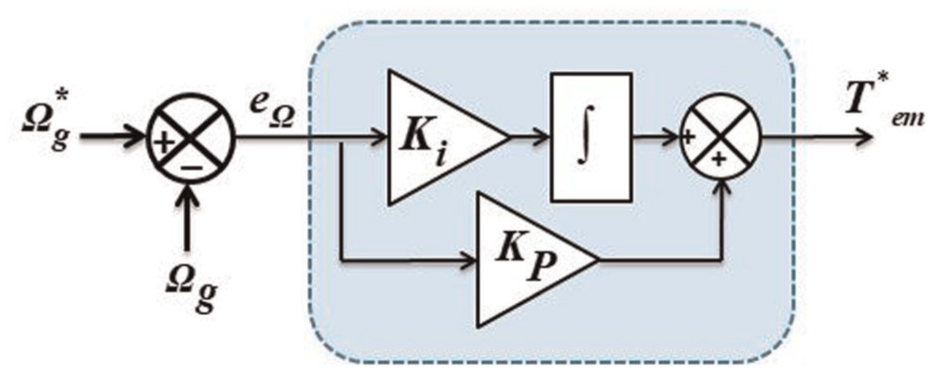
Bloc diagram of the PIC.
Despite its widespread use in industrial applications, the PI regulator has certain limitations. One of the major drawbacks is its tendency to produce significant overshoot during transient states, potentially leading to instability. Additionally, it does not inherently consider system disturbances in its design, making it less effective under changing external conditions. Another critical issue is that the integral action, while essential for eliminating SSEs, can induce phase shifts in the control loop, increasing the risk of system instability. Furthermore, the controller’s dependency on system parameters makes it less robust when these parameters undergo variations, thereby reducing its performance in scenarios where system dynamics change over time.56,57
The transfer function, which represents the relationship between the rotational speed Ω and the electromagnetic and mechanical torques T e m and T m , respectively, based on the mechanical equation, is given by53,59:
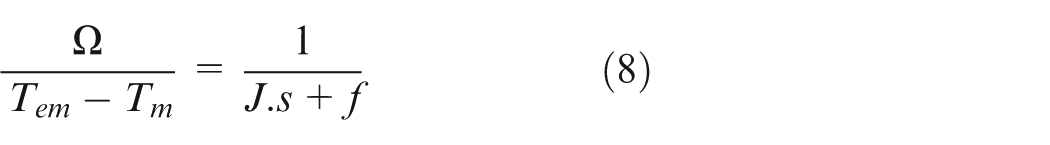
Where s represents the Laplace variable.
The closed-loop system transfer function, which describes how the controlled variable speed follows its reference input, is expressed as:
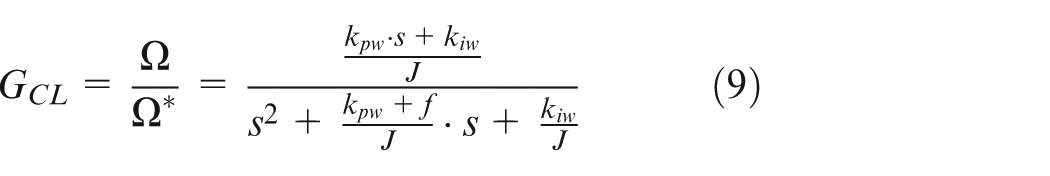
Where, Ω * is the reference speed, K p w and K i w are the proportional and integral gains, respectively.
The canonical form of the closed-loop transfer function is described as 53 :
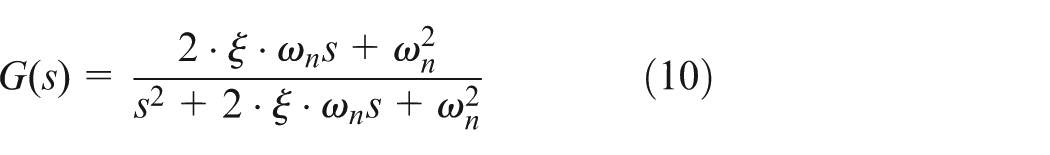
In this expression, ξ is the damping ratio and ω n is the natural frequency of the system.
The control parameters are then derived as53,59:
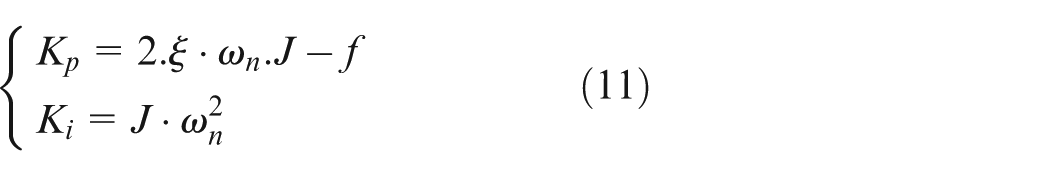
Once the proportional K p and integral K i gains are calculated, they are integrated into the system to regulate the mechanical speed. These control gains help the system maintain stability and ensure that the mechanical speed tracks the desired reference accurately, compensating for disturbances and parameter variations within the operational limits.
Fuzzy logic controller
Fuzzy logic systems (FLSs) are commonly used for managing uncertainty and nonlinearities in control applications originally developed by Lotfi Zadeh over 30 years ago. 60 In, 61 fuzzy logic is applied to improve the properties of the strategy field-oriented control of induction motor. In this work, an adaptive PI controller with gain adaptation based on FLC technique was designed to improve the performance of electric propulsion systems against parameter changes. The effectiveness and efficiency of the FLC method were verified using MATLAB. The results obtained demonstrated the effectiveness and robustness of the use of FLC method against load torque disturbances and rotor resistance variations compared to conventional PI control and adaptive control. Another application of the FLC controller was proposed in work 62 to improve the characteristics of the sliding mode control strategy used for controlling induction motors. The FLC controller was used to compensate for the sign(u) function, where the use of this method allows to significantly reduce the chattering phenomenon and thus improve the operational performance of the motor. In, 63 the author uses 49 rules to model the fuzzy logic used to improve the control characteristics of an induction motor. The author believes that 49 rules are suitable for improving control characteristics and increasing durability. Test results demonstrate the effectiveness of this regulator in improving dynamic response and torque ripples. According to the work done in, 64 the FLC approach yielded superior performance under various operating conditions for induction motors compared to the conventional approach. The author believes that using the FLC approach does not require any complex calculations or knowledge of the mathematical model of the system under study. Furthermore, using the FLC approach increases operational performance and allows for improved dynamic response, making it an effective choice.
The type 1 FLSs (T1FLSs) are the most commonly employed. These systems are built on a framework that requires expert knowledge and data for constructing fuzzy rules and membership functions (MFs), which can be based on either linguistic descriptions or numerical data. T1FLS are useful when dealing with systems where inputs and outputs can be represented with well-defined FLSs. These systems follow a structured design process that includes fuzzification, application of a fuzzy rule base, and defuzzification.65–69
Despite their effectiveness, type 1 systems can struggle in scenarios involving significant uncertainty because they assume exact MFs. To address this limitation, type 2 FLSs (T2FLSs) have been introduced. These systems can better manage uncertainty, offering more robust performance in situations where the available information is imprecise or incomplete. In T2FLS, FLSs have an additional layer of uncertainty, represented by a footprint of uncertainty (FOU), which provides a range of possible membership values rather than a single value. This characteristic allows type 2 systems to outperform their type 1 counterparts in environments where uncertainty is prevalent.67,69,70
T1FLC approach
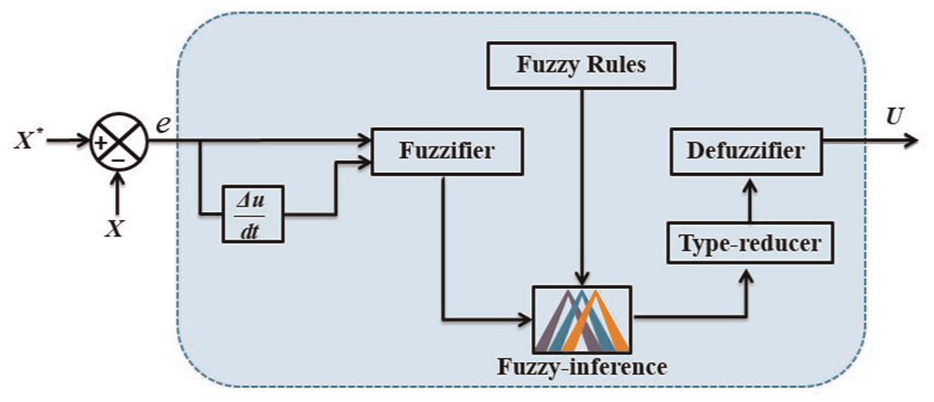
The T1FLC is composed of three primary stages: fuzzification, fuzzy inference, and defuzzification, presented in Figure 4.65–69
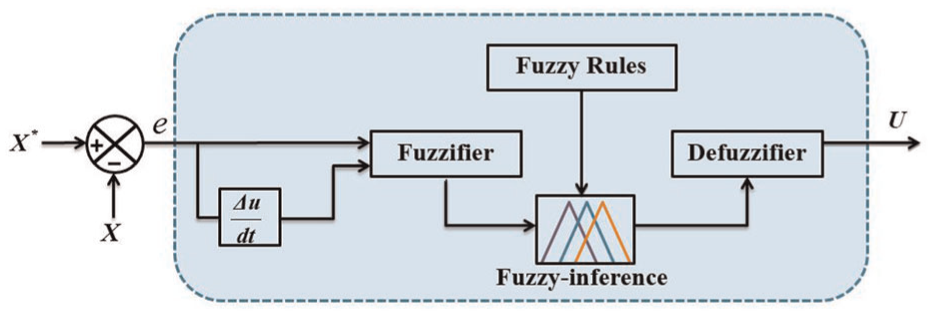
Bloc diagram T1FLC process. 65
During fuzzification, input values are converted into fuzzy linguistic terms based on predefined MFs.70–72
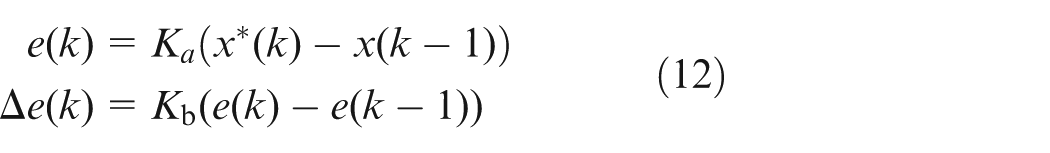
The inputs to the system are the error (e) and its variation (Δe), which are normalized using specific gain factors for both the error and its change. The normalization equations are expressed as follows73,74:
The output of the FLC represents the change in the control law (ΔU), which is calculated using:

Where, ΔU signifies the output change of the FLC, and Kc denotes a denormalization gain.
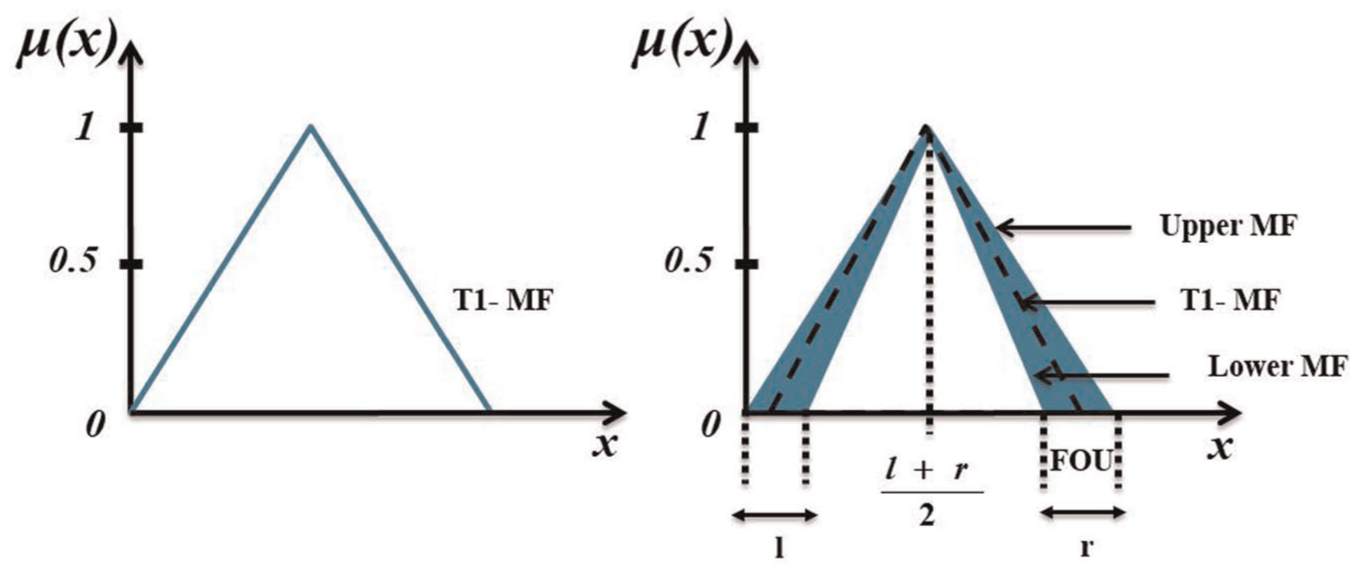
A common approach in T1FLC is to use symmetric triangular MFs for both input and output variables (Figure 5). These functions are designed to provide high precision and are defined over a normalized range of [-1, 1], which simplifies calculations and ensures balanced control behavior. 70
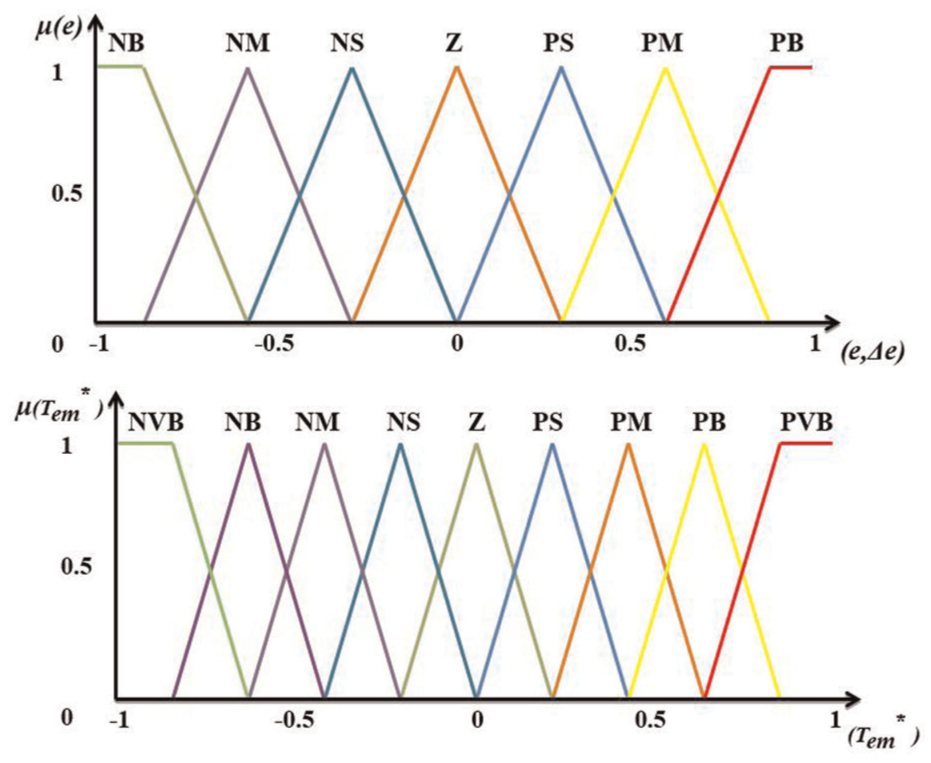
MFs of the inputs and the output of the proposed FLC system.
These fuzzy inputs are processed through a set of rules in the inference engine, typically in the form of “if-then” statements. In this context, the Mamdani-type inference method is commonly used due to its simplicity. This approach allows the controller to produce control actions based on a set of fuzzy rules, which often include terms like Negative Big (NB), Zero (Z), Positive Small (PS), and Positive Big (PB), presented in Table 2.75–77 In this work, we tested the use of 49 rules to embody the T1FLC controller. This number was chosen to reduce computational complexity, achieve high performance, fast dynamic response, and use less memory. As is well known, using a larger number of rules in FLC leads to system slowdowns and greater memory usage. Furthermore, using a large number of rules significantly increases computational complexity. Therefore, a suitable number of 7 × 7 rules was used, as is commonly used and proven in the literature.
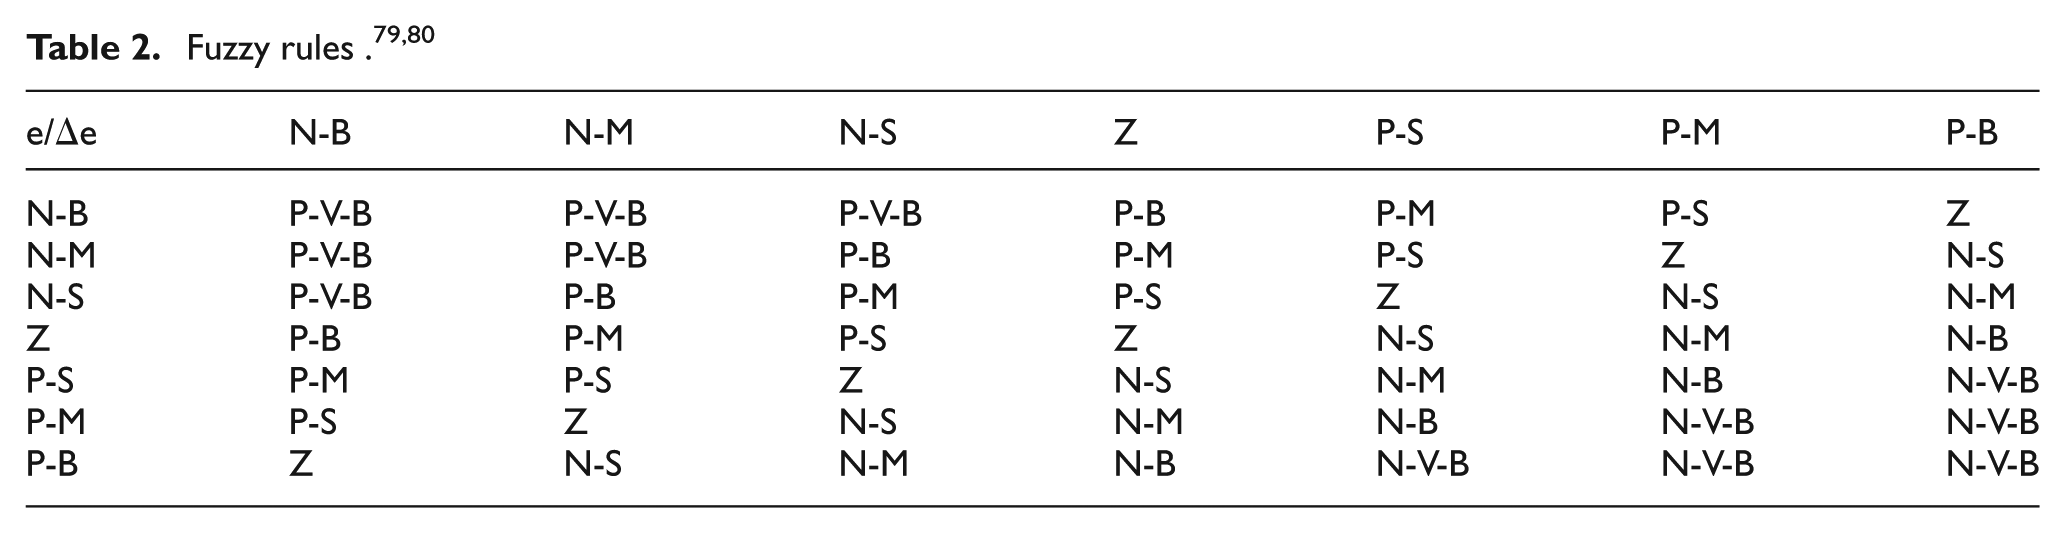
The final stage in FLC systems, known as defuzzification, involves converting the fuzzy output back into a precise, crisp value. This is typically achieved through methods like the centroid or center of gravity calculation. One commonly used approach for noise reduction in fuzzy systems is the center of gravity method, expressed by the following equation 78 :

N represents the number of rules, U is the output, and μ refers to the MF.
One of the main advantages of T1FLC is its robustness in handling noise and disturbances without requiring a highly precise model of the system. However, its performance is limited in situations where the system faces high degrees of uncertainty because it assumes the MFs are precisely known. 70
T2FLC approach
T2FLSs extend the capabilities of type 1 systems by incorporating fuzzy sets that have uncertainty in their MFs. Unlike type 1 systems, where each element has a specific degree of membership, type 2 systems define MFs using an upper and lower MF, creating the FOU between them (Figure 6), which allows type 2 systems to handle more complex uncertainties, making them more robust and stable in dynamic and uncertain environments.69,70
Bloc diagram T2FLC process. 70
The structure of a T2FLC is similar to that of a type 1 system, with a few key differences. In addition to the fuzzifier, inference engine, and rule base, the T2FLC includes a type-reducer, which reduces the type 2 fuzzy sets to type 1 fuzzy sets before the defuzzification process (Figure 7). This extra step allows the system to manage the uncertainties more effectively. The type-reducer plays a critical role in ensuring that the final output represents the combined effects of all possible MFs within the FOU. After type reduction, a standard defuzzifier converts the resulting type 1 fuzzy set into a crisp output, as done in type 1 systems.69,70
MFs of the proposed T2FLC in comparison to T1FLC. 69
The defuzzified output for the T2FLC is calculated as follows:

Where l and r are the indices corresponding to the switch points.
The use of T2FLC systems improves performance in environments characterized by high levels of uncertainty, such as sensor noise, changing system dynamics, or imprecise input data. The T2FLS’s ability to account for these variations makes it more reliable and adaptable compared to type 1 systems, particularly in real-world applications where exact modeling is challenging.69,70
The proposed FOT2FLC technique
To enhance the durability and performance of the T2FLC, a fractional-order control technique is employed. Although FOC is one of the older control methods, it has unique attributes and advantages that make it highly effective in various domains, including electronics and control systems. This approach has been utilized in numerous applications to enhance overall system efficiency and performance.59–69 The integration of FOC with T2FLC marks a significant step forward in control strategy design, especially when applied to systems requiring high precision and adaptability.72–85
In this study, a novel nonlinear control method termed the FOT2FLC is introduced. The primary goal of this approach is to improve the quality and increase the overall efficiency of the MPPT technique. By combining the strengths of both T2FLC and fractional calculus, the FOT2FLC inherits the robustness and simplicity of these individual methods. This hybrid strategy offers a significant enhancement over conventional FLC by incorporating the flexible nature of fractional calculus, which allows for fine-tuning system behavior through parameter adjustments.
The FOT2FLC essentially modifies the T2FLC by integrating fractional calculus into its structure, thus offering better control over system dynamics. The controller can be described mathematically by the following equation, where the gain parameter α plays a critical role in determining the system’s response:

In this equation, α is a positive gain associated with the FOC. When α = 1, the FOT2FLC behaves as a standard controller, but with different values of α, the control response can be adjusted to optimize performance. The key requirement for using this method is that α > 0, ensuring the system maintains high efficiency while significantly reducing fluctuations in the electromagnetic torque, especially in WE conversion systems.
Figure 8 illustrates the structure of the FOT2FLC, demonstrating its simplicity compared to other complex nonlinear strategies such as SMC and BC. Despite its straightforward design, the FOT2FLC offers high performance and robustness, making it an ideal choice for systems that are sensitive to parameter changes. The combined advantages of T2FLC and FOC contribute to a controller that not only addresses the limitations of traditional FLC but also offers improved efficiency and reliability for a wide range of applications.
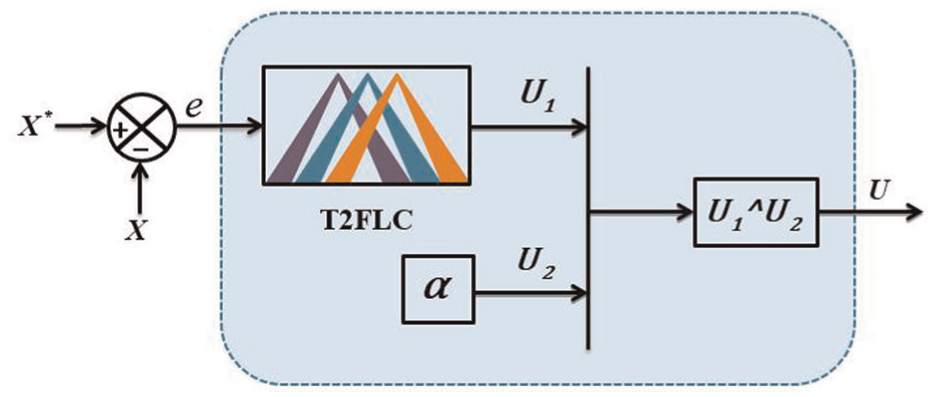
Bloc diagram FOT2FLC process.
In terms of computational complexity, the proposed FO-T2FLC regulator is moderate and suitable for immediate implementation. Compared to T1FLC, T2FLC adds additional processing overhead, but the use of a type 2 divider structure with simplified secondary membership functions significantly reduces the computational burden and allows for increased operational performance. Furthermore, the fractional ordering is implemented using a fixed-order Austalop approximation, making it possible to handle standard digital signal processors (DSPs) or FPGAs. The designer’s approach can maintain the rate update rate without exceeding computational limits, ensuring immediate payout capability. Compared with model-based or neural network-based predictive MPPT methods, the proposed FO-T2FLC offers a better balance between computational load and control performance.
MPPT algorithm based on FLC approaches
The proposed MPPT using FLC is summarized in:
Using the FLC to pick the appropriate value of reference torque (Tem*).
Choosing the error signal between Ωg* and the calculated Ω g as the first input for FLC, and the derivative of this error as the second input to achieve a fast estimation.
Figure 9 shows the proposed algorithm for controlling WT, which uses the FLC (T1FLC and FOT2FLC) strategy. This proposed algorithm has been used to control speed. This algorithm is easy to use, uncomplicated, easy to implement, inexpensive, has excellent performance, and high durability.
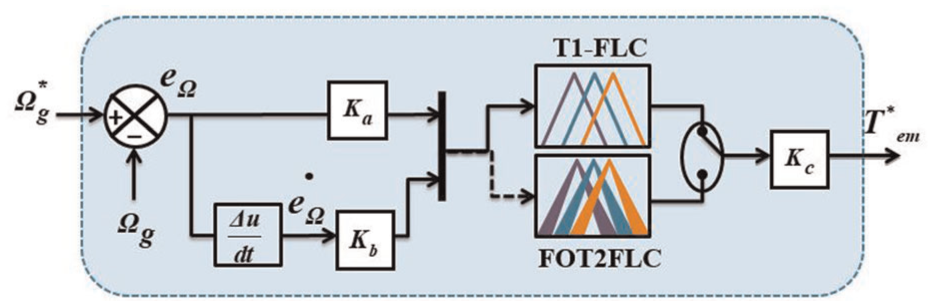
Bloc diagram of MPPT-FLC speed control.
The gains values of the proposed algorithm can be calculated using smart strategies, as the GA can be relied upon to calculate them. The use of a GA depends on writing a program and takes a long time to obtain values with distinctive performance. Therefore, the method of experimentation and simulation was used to determine the values of these gains. This method is simple, easy to use, and does not require writing complex programs. Values were taken for gains that gave excellent results in terms of dynamic response and effectiveness in improving the characteristics of the studied system.
In the next section, MATLAB is used to implement the proposed algorithm and compare it with other strategies.
Results
In this study, two key tests were performed to evaluate the performance of different MPPT strategies: PIC, T1FLC, and FOT2FLC, for a WE system, where the system’s parameters are listed in the Appendix.49,50
The first test involved a step-variable wind profile, while the second focused on a random wind profile. In the third test, the three strategies designed in this paper were tested in terms of the variation in the moment of inertia. These tests provide a fairly comprehensive analysis of the control system’s responses under varying wind conditions. In all the tests performed, graphical and numerical results were extracted, along with calculations of improvement percentages, in order to show the most superior strategy. Also, an analytical study was carried out on the results of important performance indicators such as response time (in seconds), constant errors, IAE, ITAE, ISE, and ITSE.49,59,69
Test 1: Step variation wind profile
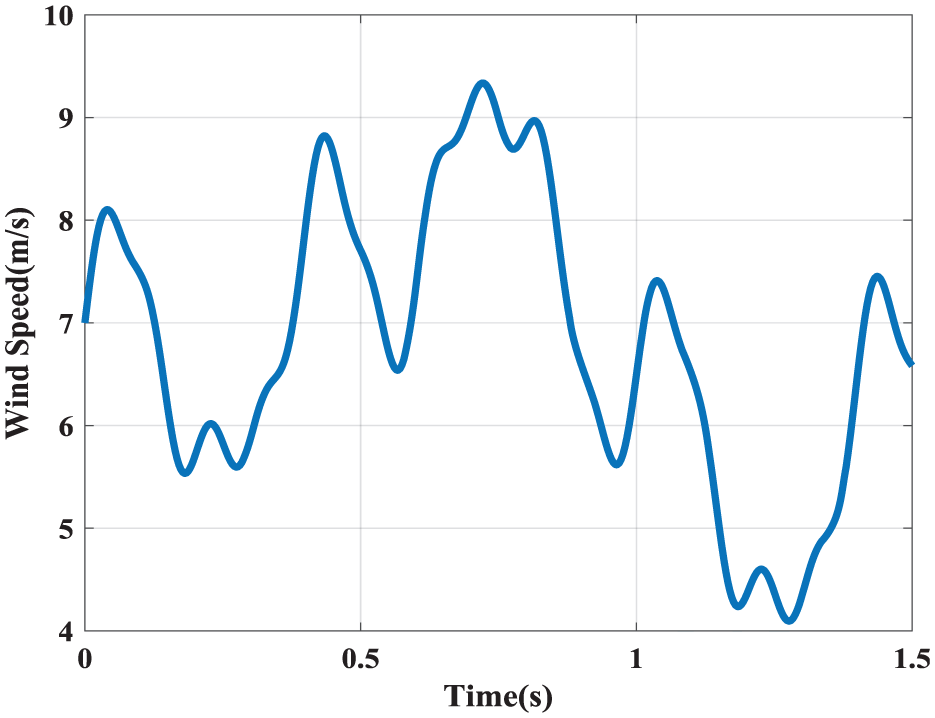
The performance and effectiveness of the three strategies designed in this paper are first tested under a step WS variation model. This first test aims to study the dynamic response and effectiveness of these strategies under conditions of rapid WS changes. Figure 10 represents the WS variation pattern used in the first test. Figures 11 to 15 present the graphical results for the three controls. These figures display the aerodynamic torque, rotational speed, Cp, TSR, and speed tracking error. Also, numerical results and improvement ratios for the three strategies are extracted to identify the best approach that provides the highest performance. These numerical results are listed in Tables 3 and 4.
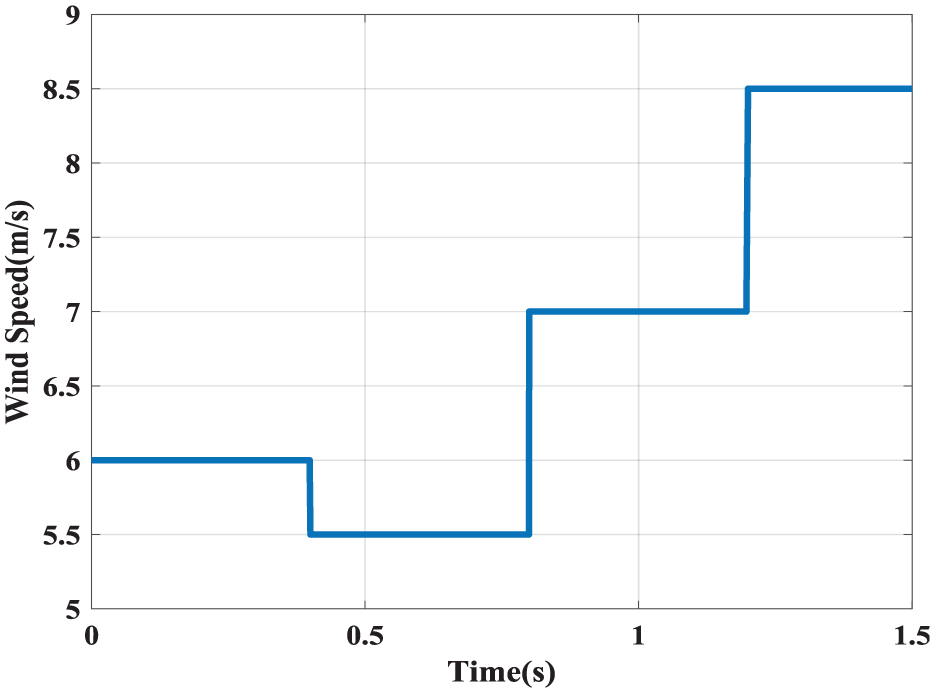
The step wind profile.
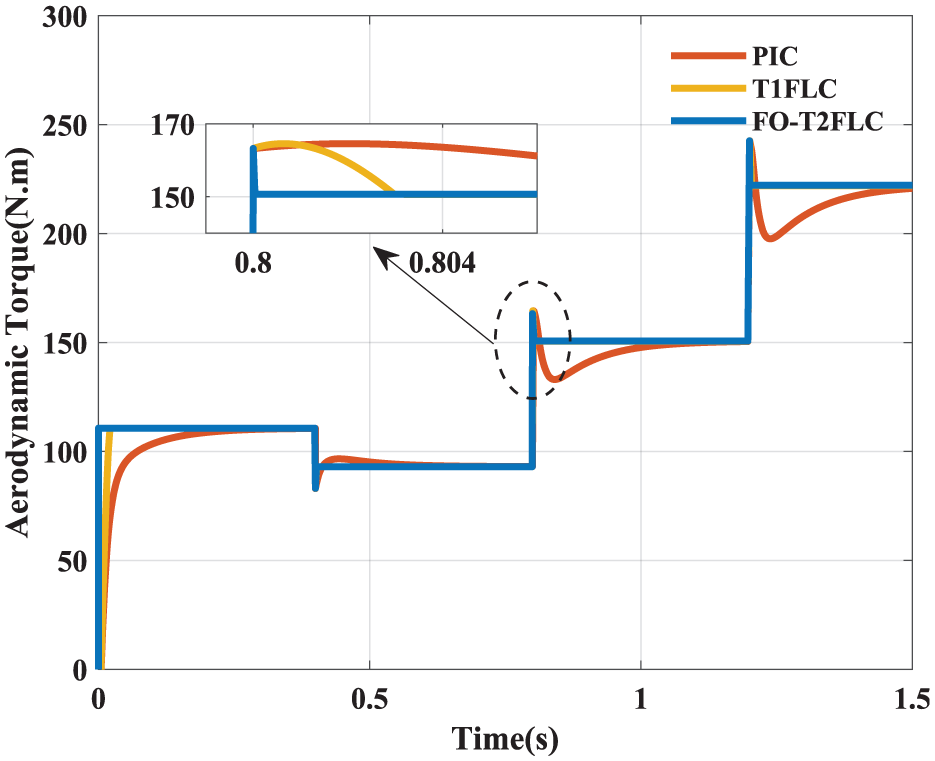
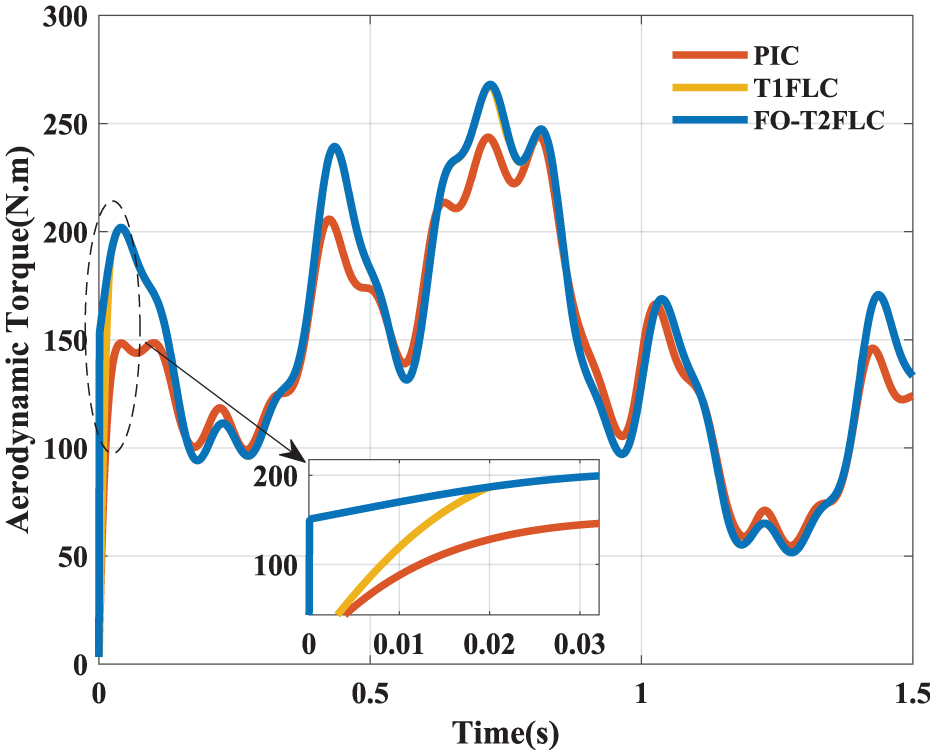
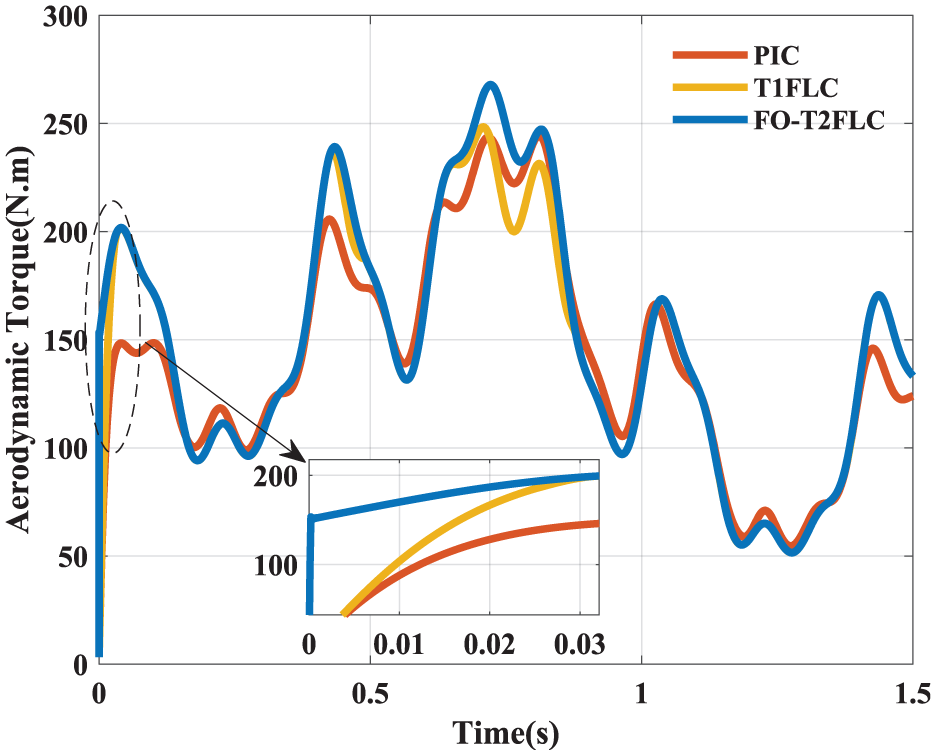
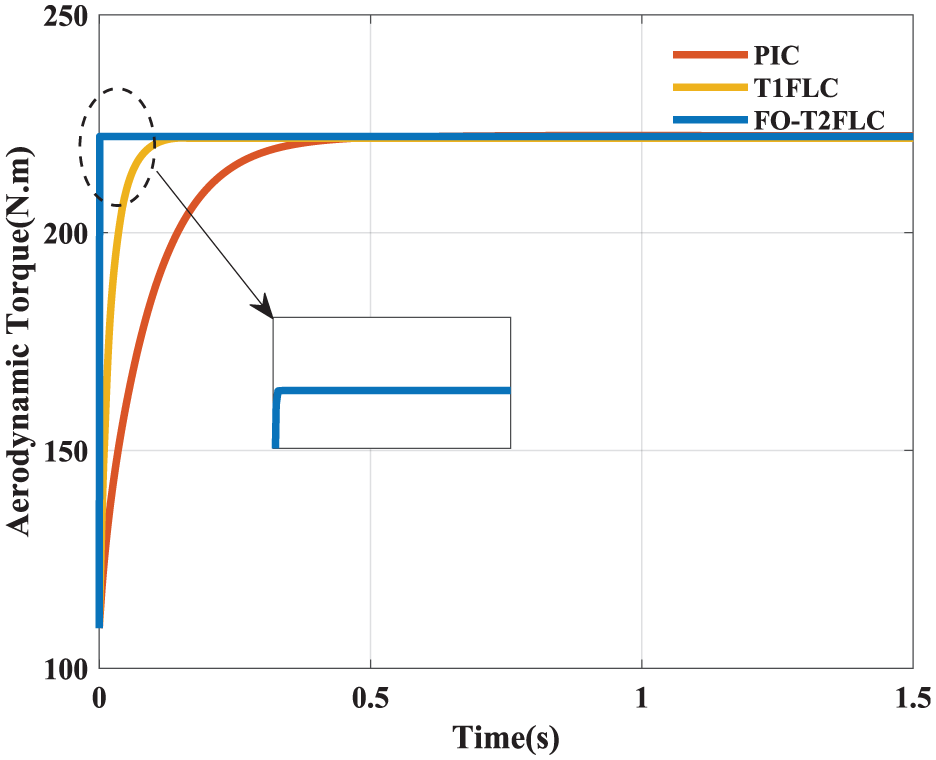
Aerodynamic torque (Test 1).
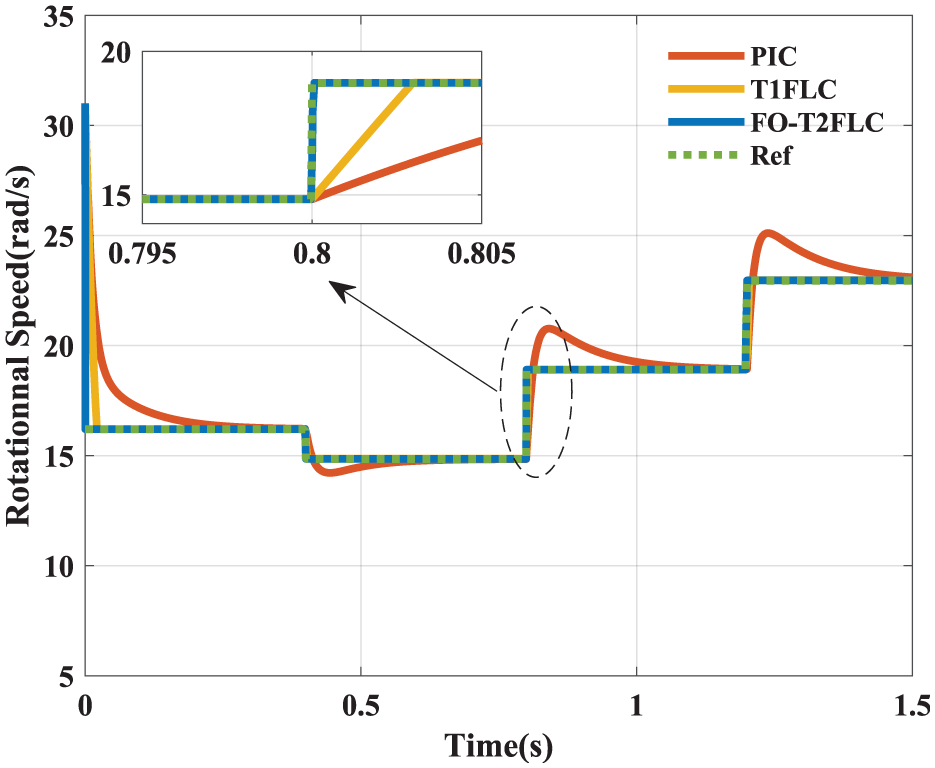
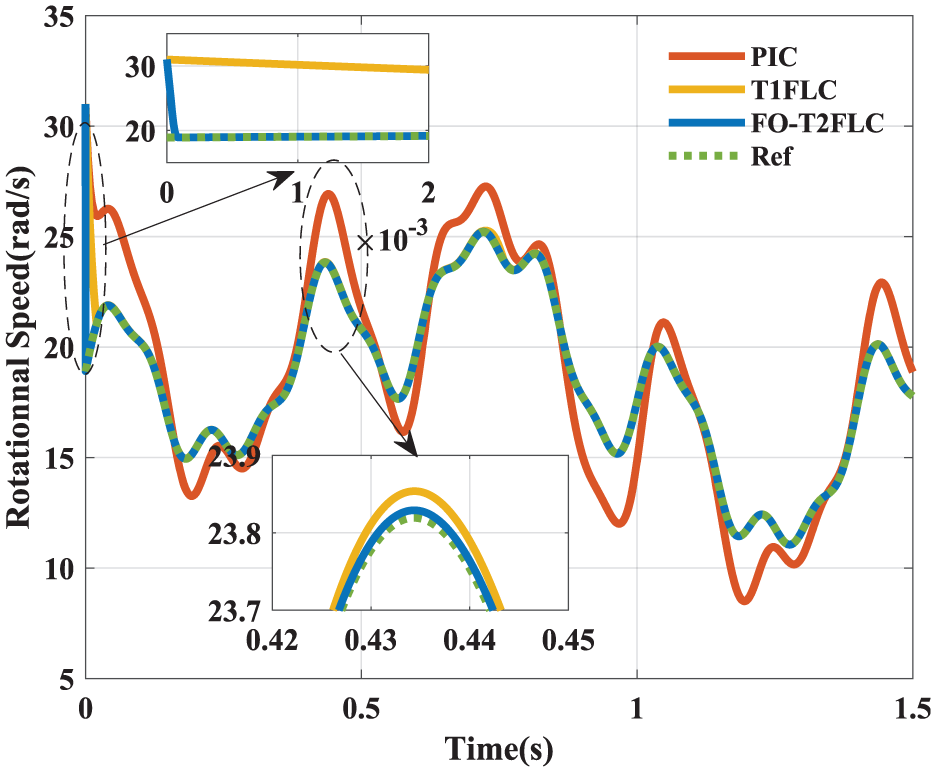
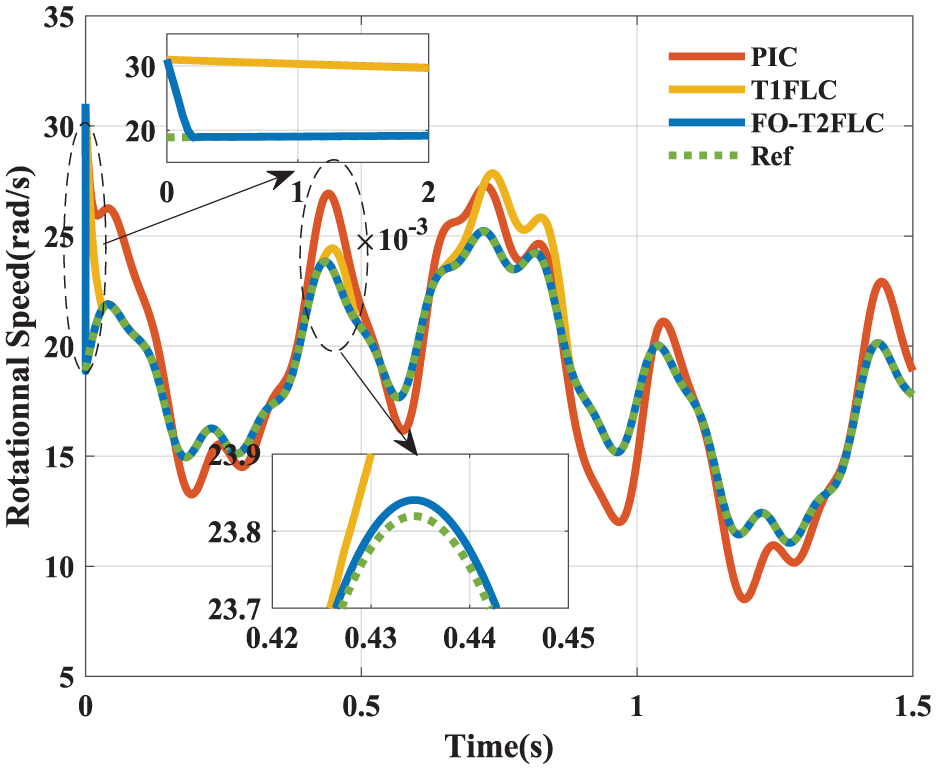
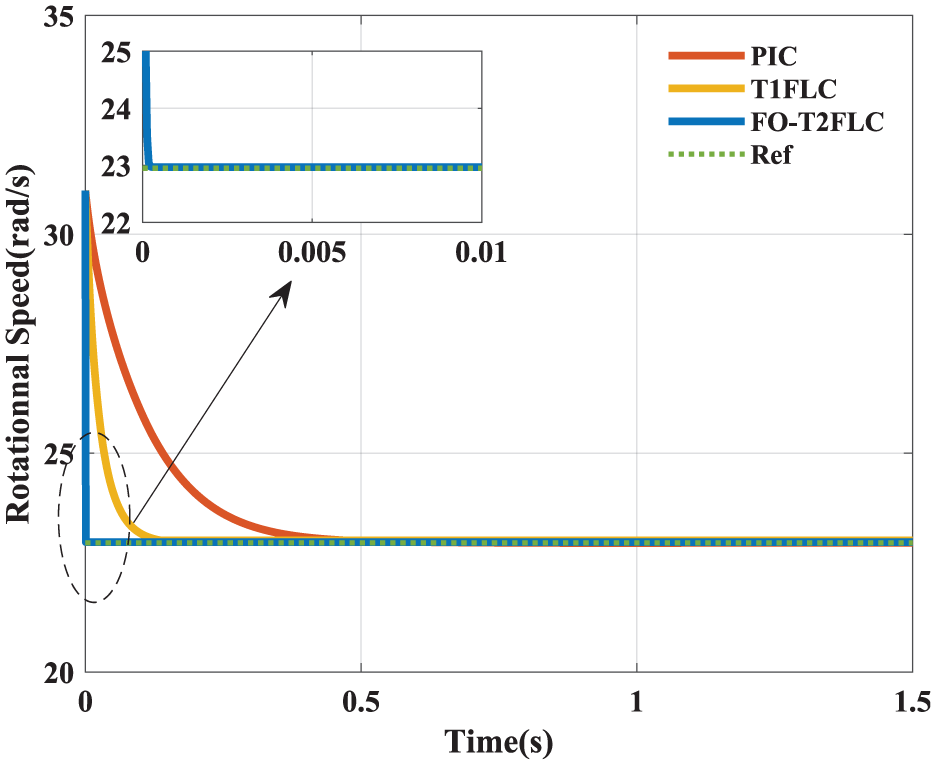
Rotational speed (Test 2).
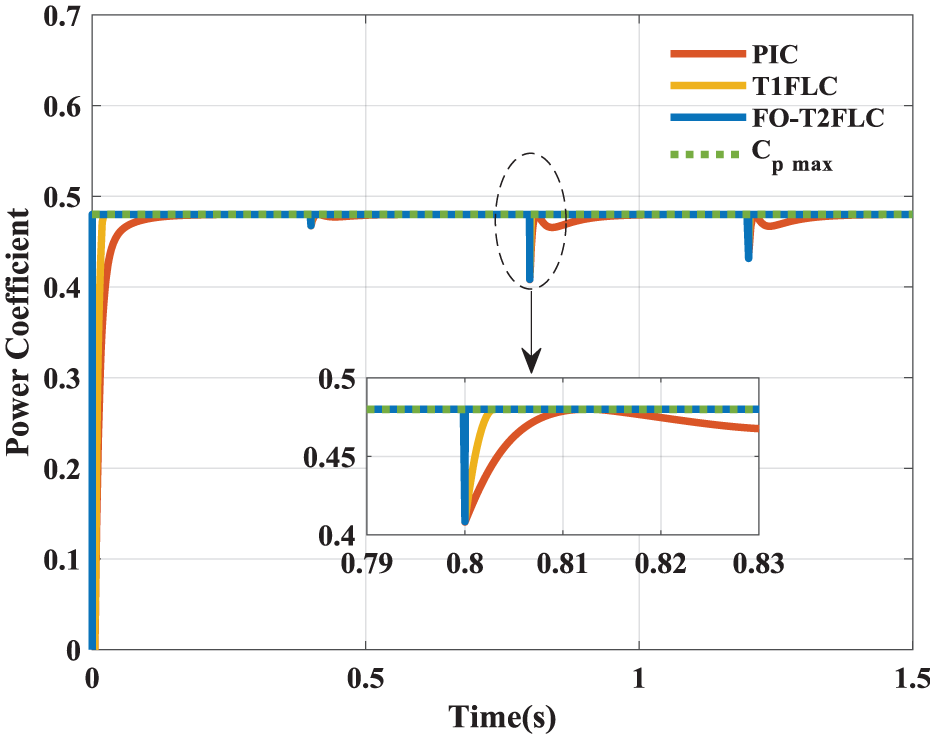
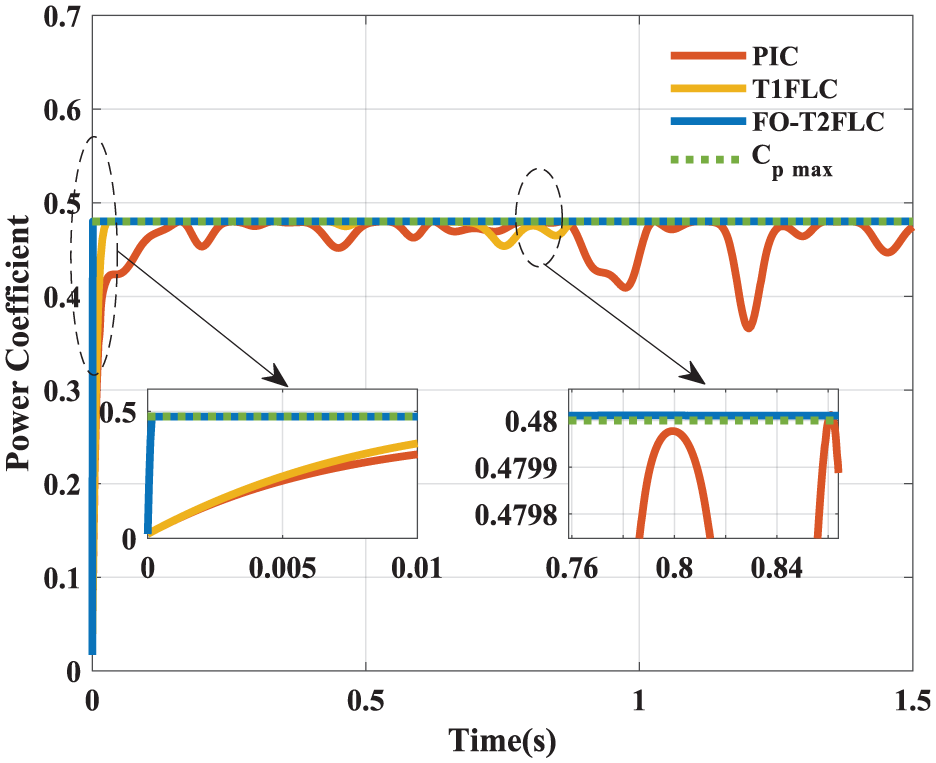
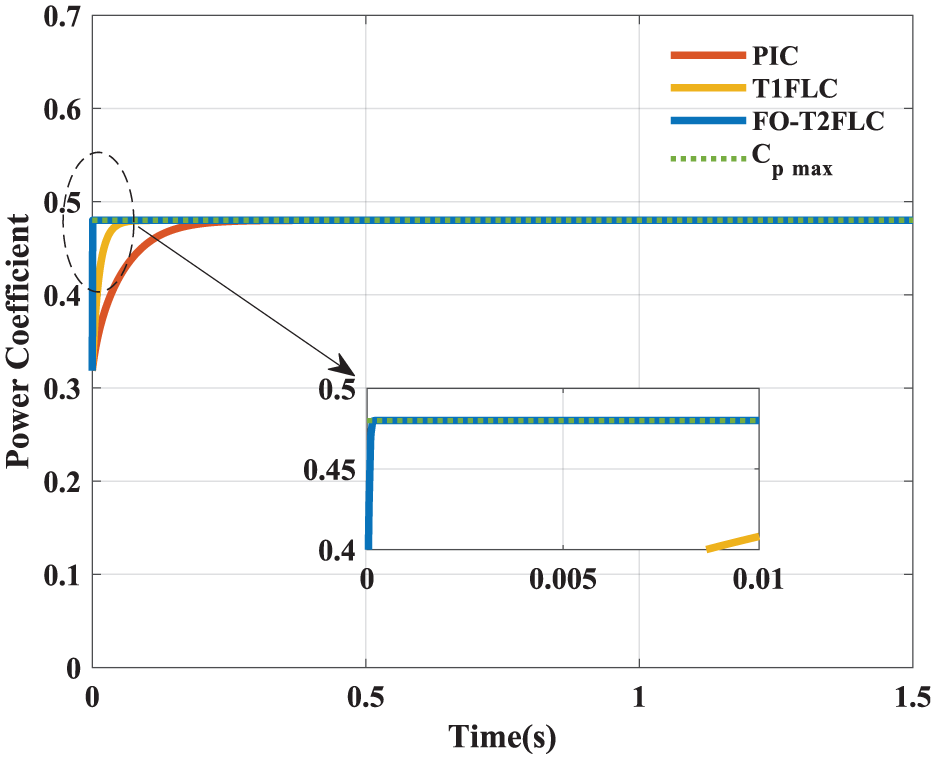
Power coefficient (Test 1).
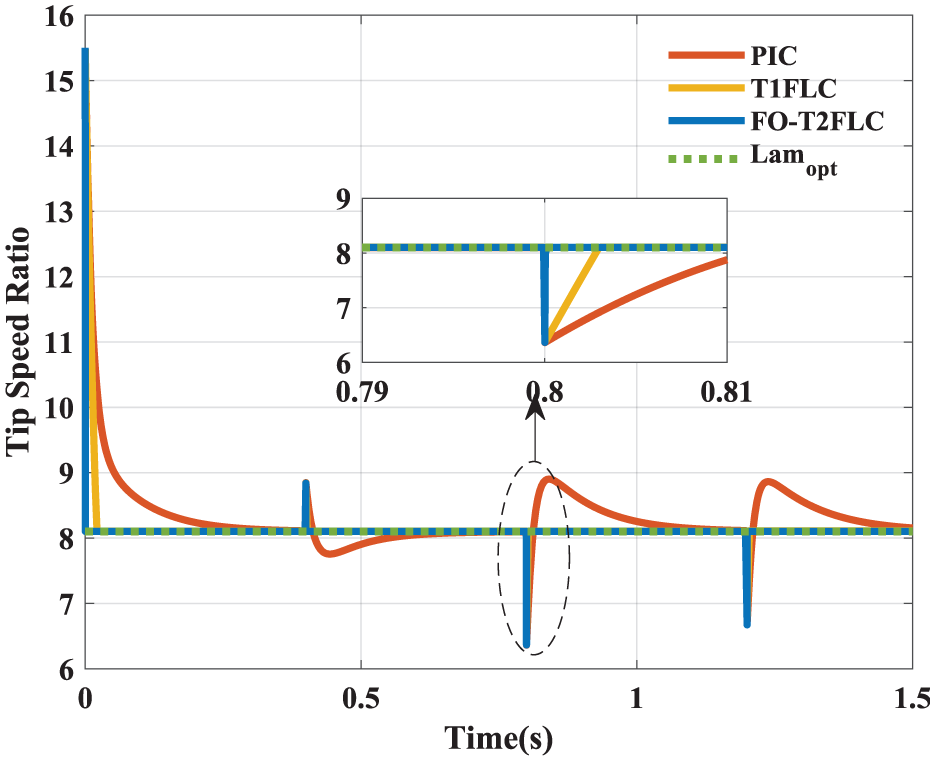
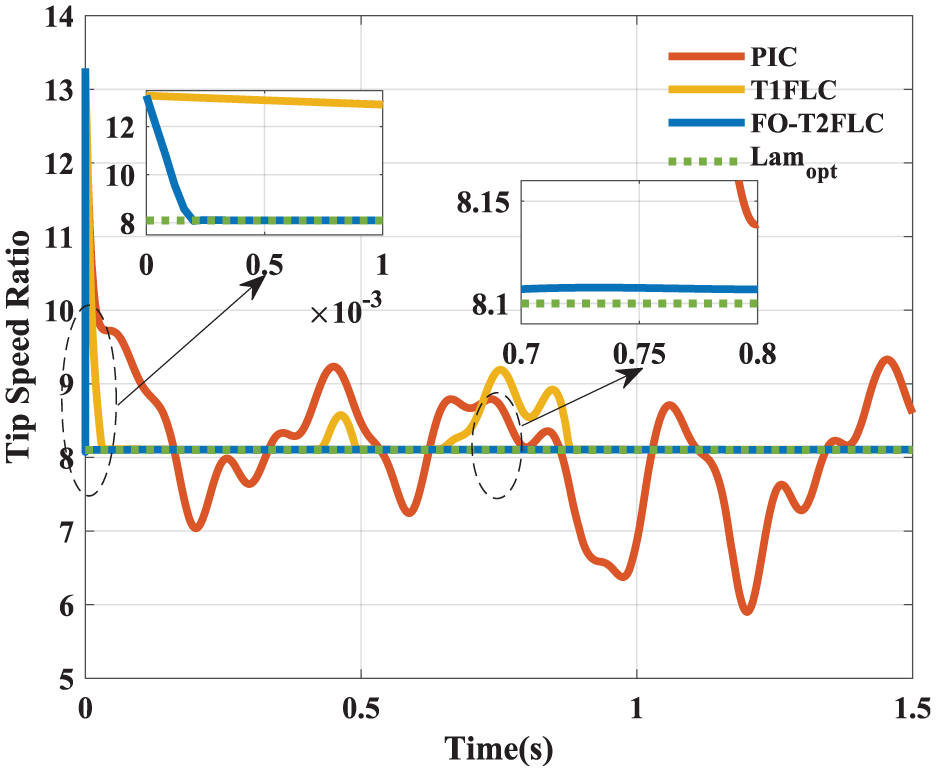
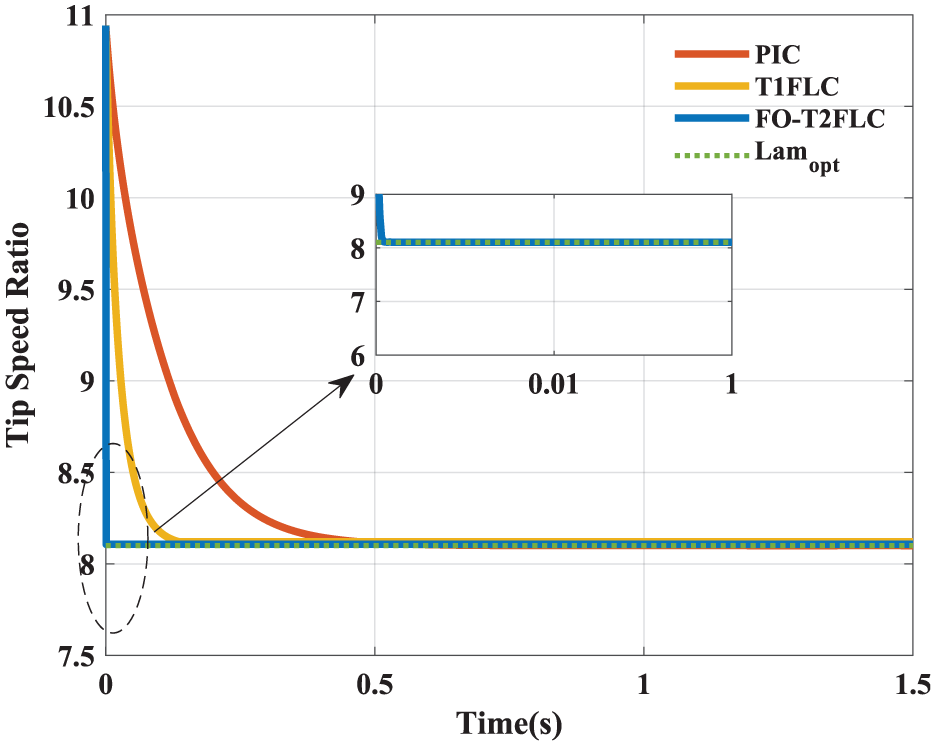
Tip speed ratio (Test 1).
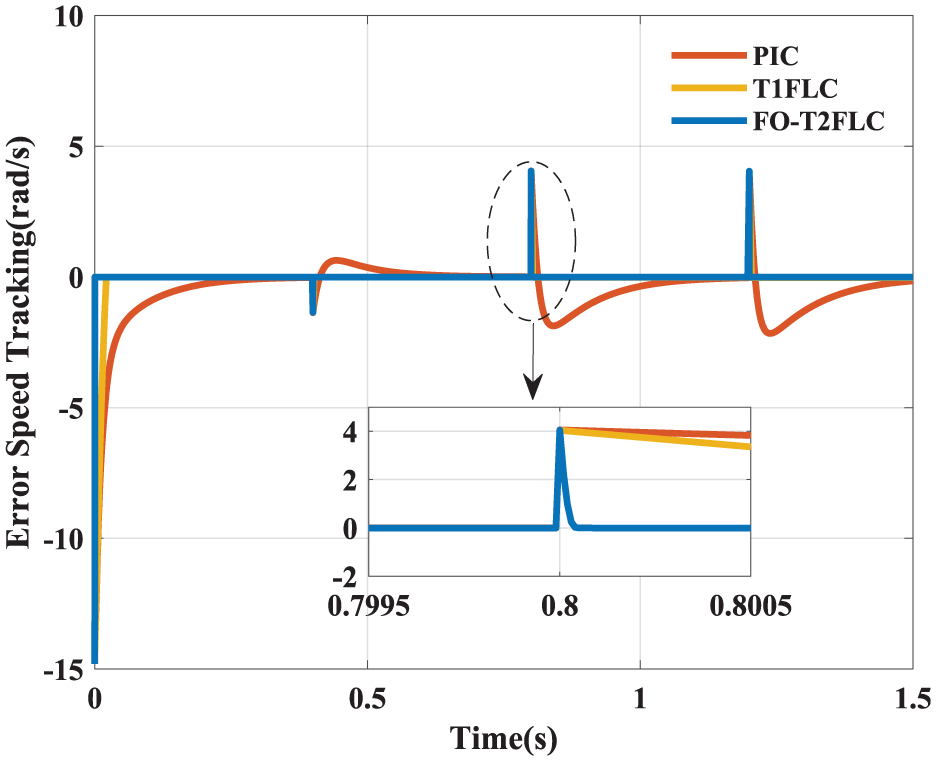
Error speed tracking (Test 2).
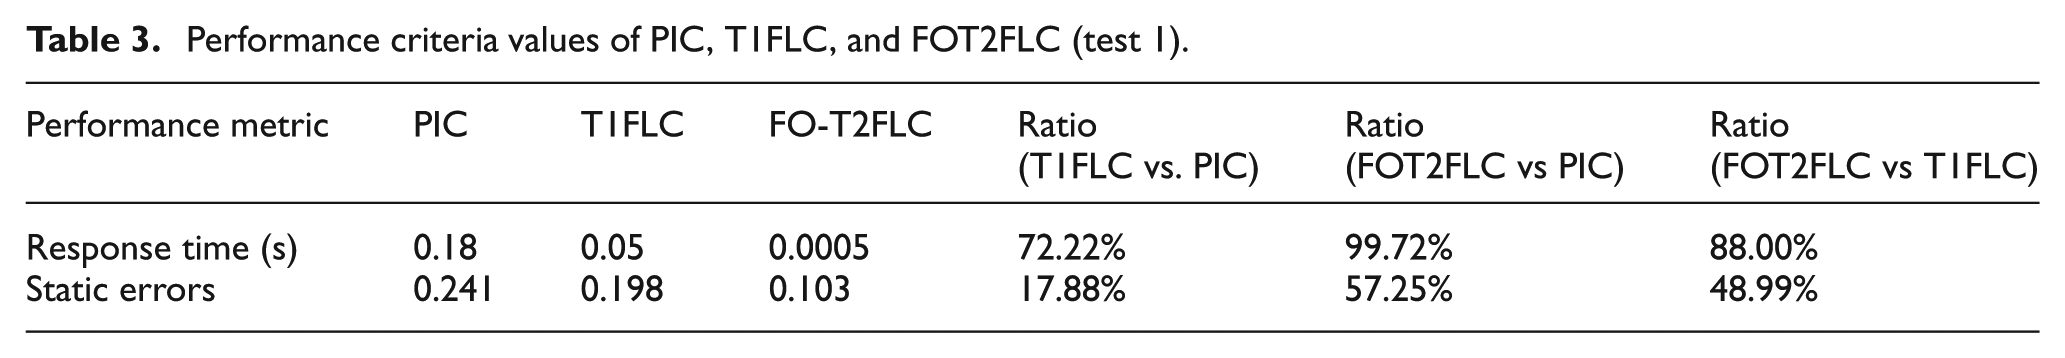
Performance criteria values of PIC, T1FLC, and FOT2FLC (test 1).
Value of IAE, ITAE, ISE, and ITSE of proposed techniques (test 1).
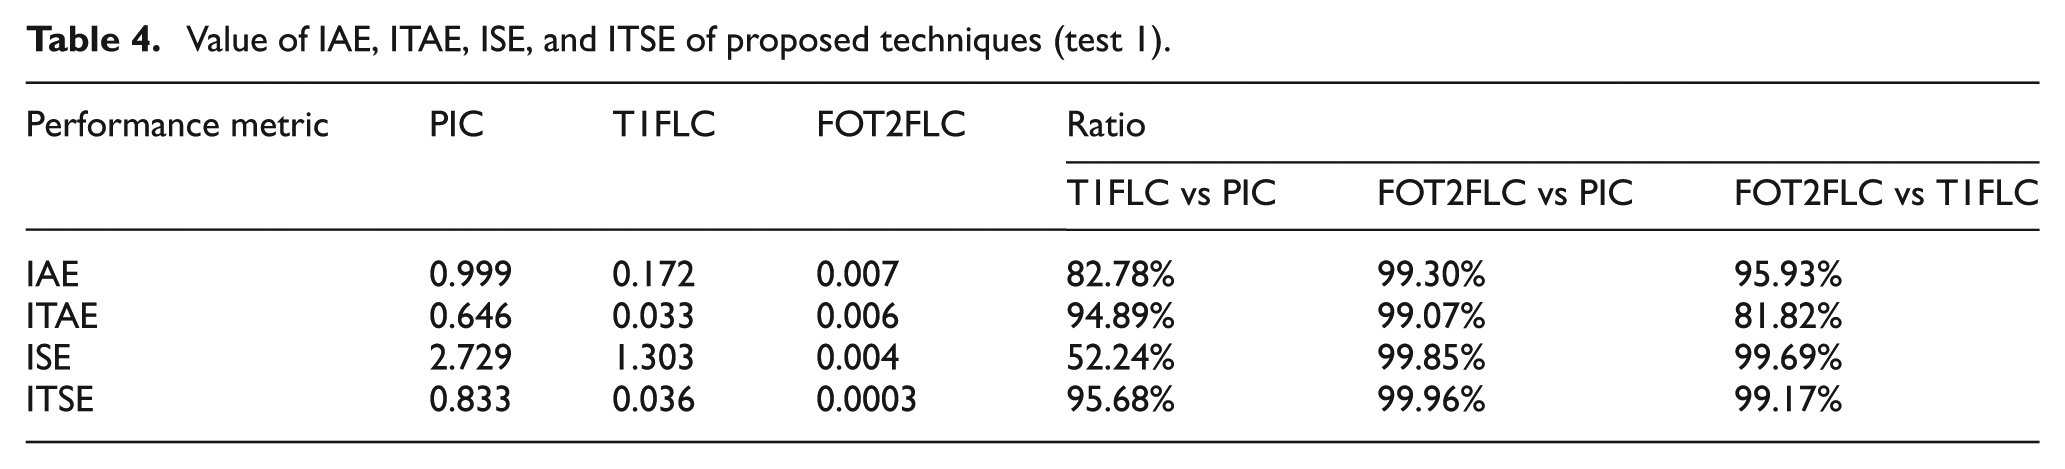
Figure 11 illustrates the aerodynamic torque variations for the three controllers under varying WSs. From this figure, it is evident that the torque varies with the WS, decreasing and increasing as the WS decreases and increases. It is also evident that the torque has a rapid dynamic response to changes in WS, with the FOT2FLC controller having an advantage over the PIC and T1FLC in terms of response time.
Figure 12 illustrates the variation of the WT rotational speed over time for the three controls. Based on this figure, the variation in rotational speed corresponds to the variation in WS. Figure 12 demonstrates the presence of overshoot when using a conventional regulator, while using other strategies largely eliminates the overshoot problem. It’s also worth noting that using the FOT2FLC controller provides more stable speed regulation and faster recovery from step variations, outperforming both the PIC and T1FLC. Furthermore, this controller offers significantly better RPM response time than other strategies, highlighting its superior efficiency.
Figure 13 represents the variation of the Cp value over time for the three controls when WS is used in steps. This figure demonstrates the WT’s efficiency in converting WE energy into mechanical energy. It is also noted that the Cp value remains constant across all three controls, with the optimum value exceeded at points where WS changes. Furthermore, Figure 13 shows that the response time to Cp is significantly better with the FOT2FLC compared to both the T1FLC and the conventional controller. These graphs demonstrate the superior performance of the FOT2FLC in maintaining optimal power extraction across different WS levels.
Figure 14 illustrates the variation in the TSR value when using all three proposed controllers under rapidly changing wind conditions. From this figure, it is clear that the TSR value remains constant regardless of the WS variation, being approximately eight when using all three controls. Furthermore, overshoot is observed when using three controls due to rapid and sudden changes in WS. Furthermore, the FOT2FLC approach outperforms other strategies in terms of response time, indicating that this approach has a very fast dynamic response, making it a promising solution for industrial applications.
Figure 15 shows the speed tracking error when using the three designed regulators. This error is the difference between the desired rotor speed and the actual speed. From this figure, it is evident that the FOT2FLC controller exhibits a significantly lower tracking error compared to the PIC and T1FLC controllers, demonstrating its superior control accuracy. Figure 15 illustrates the presence of an overshoot in the speed tracking error value due to a sudden and rapid change in WS. It is also noted that the response time to the speed tracking error is much shorter when using the FOT2FLC controller compared to other strategies.
Table 3 provides a comparative synthesis of the performance metrics among the PIC, T1FLC, and FOT2FLC based on the results from test 1. The metrics assessed include response time and static errors, which are critical for evaluating the effectiveness of each control strategy. The results indicate that both T1FLC and FOT2FLC significantly outperform the traditional PIC controller in terms of response time and static errors. Specifically, T1FLC demonstrates a 72.22% improvement in response time compared to PIC, achieving a rapid response of 0.05 s. FOT2FLC further excels, with an impressive response time of just 0.0005 s, representing a remarkable 99.72% reduction over PIC. In terms of static errors, T1FLC reduces errors by 17.88% relative to PIC, indicating improved accuracy. FOT2FLC further enhances performance, achieving a static error of 0.103, which corresponds to a 57.25% improvement over PIC and a substantial 48.99% improvement over T1FLC.
The results of test 1 reveal that the FOT2FLC delivers superior performance in managing step variations in WS, consistently surpassing both the PIC and T1FLC. FOT2FLC shows notable advantages in terms of faster response times, reduced oscillations, and enhanced power extraction efficiency. It excels in minimizing errors, particularly in tracking rotational speed and power coefficient, while maintaining an optimal tip speed ratio. Both T1FLC and FOT2FLC exhibit significant improvements over PIC across all performance metrics; however, FOT2FLC stands out as the most effective approach, demonstrating exceptional robustness, precision, and the highest percentage reductions in error, making it the most promising control strategy for this scenario.
Table 4 represents the IAE, ITAE, ISE, and ITSE values for the controls performed in this work. The percentage improvements for each control strategy have been calculated to highlight the advancements over the baseline PIC method.
The analysis of the performance metrics reveals significant improvements across all error types when comparing the advanced control strategies. For IAE, T1FLC enhances the IAE by 82.78% compared to the PIC. The FOT2FLC further elevates this performance with a remarkable 99.30% reduction in IAE. Notably, FOT2FLC achieves an additional 95.93% improvement over T1FLC, demonstrating its exceptional capability in minimizing absolute errors. In terms of ITAE, T1FLC shows an impressive 94.89% enhancement over PIC, while FO-T2FLC surpasses this with a 99.07% reduction. The improvement of FOT2FLC over T1FLC stands at 81.82%, emphasizing its efficiency in addressing time-weighted errors.
When examining the ISE, T1FLC achieves a 52.24% reduction relative to PIC, yet FO-T2FLC significantly outperforms both methods, achieving an astounding 99.85% reduction. This positions FOT2FLC with a substantial 99.69% improvement over T1FLC, highlighting its effectiveness in minimizing squared errors that directly impact overall system precision. Lastly, for the ITSE, T1FLC reduces this metric by 95.68% compared to PIC, while FOT2FLC reaches an outstanding 99.96% reduction. The improvement of FO-T2FLC over T1FLC is noted at 99.17%, underscoring its robustness in minimizing time-weighted squared errors, which is crucial for ensuring system stability and response accuracy. Overall, these results highlight the superior performance of FOT2FLC as an optimal control strategy for enhancing the efficiency and reliability of WT systems.
Test 2: Random wind profile
In the second test, a stochastic wind model, as shown in Figure 16, was used to evaluate the adaptability of the control strategies designed in this work to variable and unpredictable wind conditions. The graphical results obtained from this test are shown in Figures 17 to 21. The results for aerodynamic torque, rotational speed, and coefficient of power, TSR, and speed tracking error are graphically extracted. Also, the numerical results for IAE, ITAE, ISE, and ITSE are extracted and listed in Table 5.
The wind profile.
Aerodynamic torque (Test 2).
Rotational speed (Test 2).
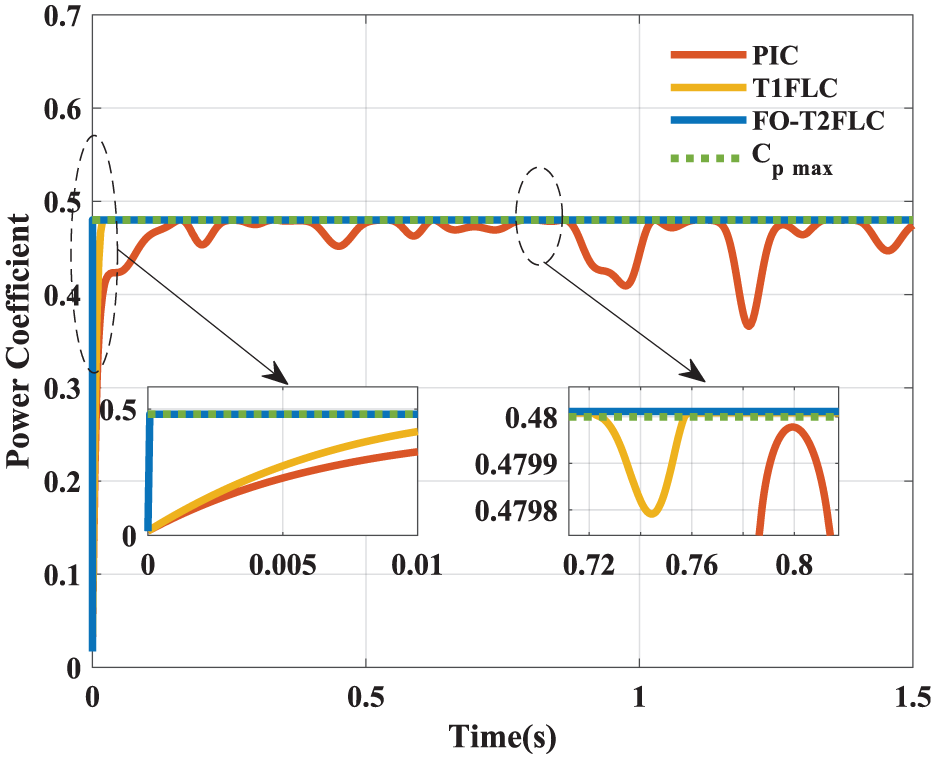
Power coefficient (Test 2).
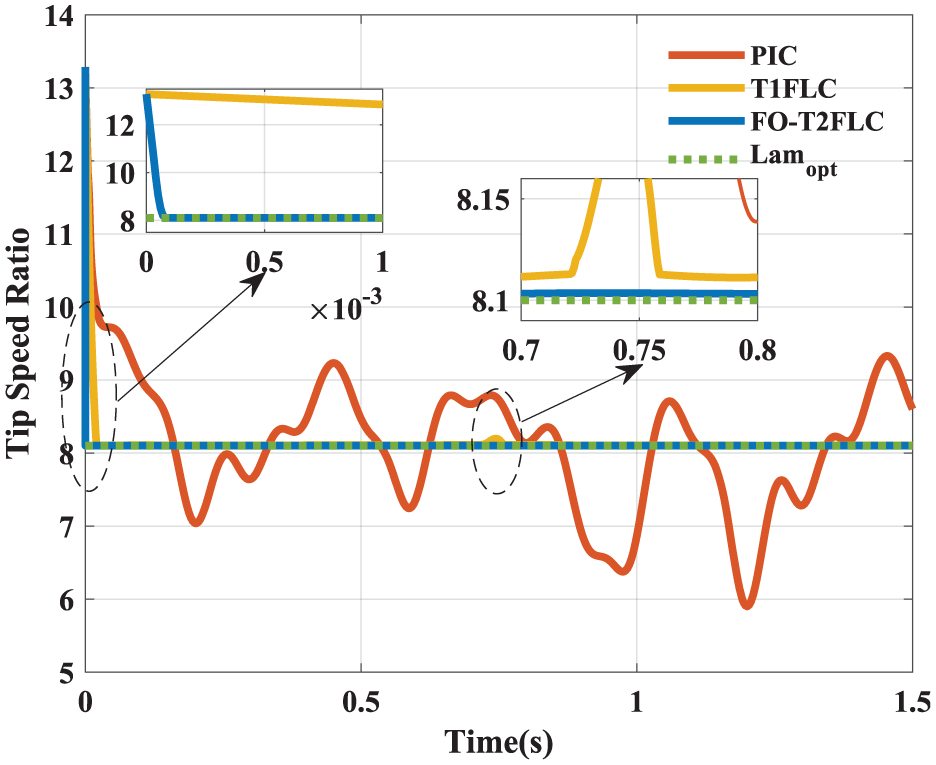
Tip speed ratio (Test 2).
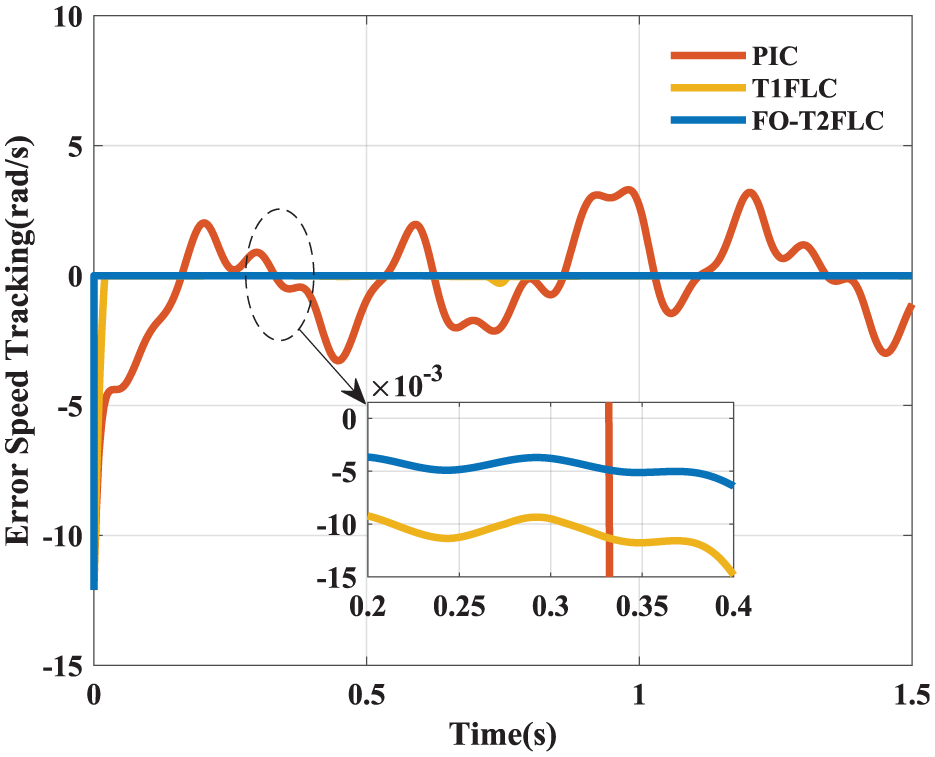
Error speed tracking (Test 2).
Value of IAE, ITAE, ISE, and ITSE of proposed techniques (test 2).
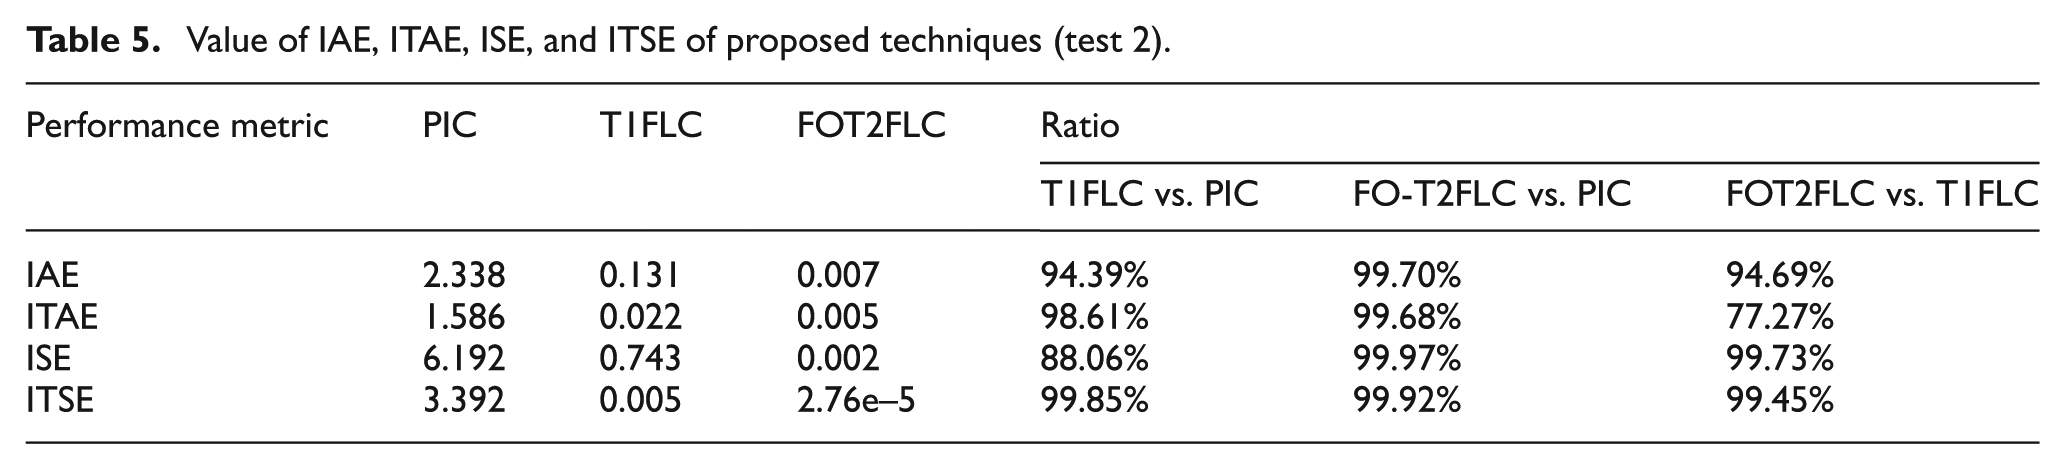
Figure 17 illustrates the aerodynamic torque for the three controls under random WS. This figure demonstrates that the torque varies with the WS changes under all three strategies. Figure 17 also demonstrates that the FOT2FLC regulator performs significantly better than the other strategies in terms of torque fluctuations and response time. Furthermore, the FOT2FLC regulator offers faster stability following wind changes than other strategies. Compared to the PIC regulator, the FOT2FLC and T1FLC regulators yielded higher torque values, demonstrating their effectiveness and ability to optimize wind energy.
Figure 18 represents the rotational speed variations for the three controllers under random wind conditions. This figure shows that the rotational speed variations are similar to the WS variations, with the rotational speed increasing and decreasing as the WS increases and decreases. It is observed that the rotational speeds for the three controllers closely follow the reference value, with the FOT2FLC controller having an advantage over the other strategies in terms of response time and SSE. Also, Figure 18 shows that the FOT2FLC regulator is smoother and more stable, with faster adjustments to random changes, while the PIC and T1FLC exhibit slower recovery times and larger speed fluctuations.
Figure 19 represents the variation of the power coefficient for the three controls under random WS conditions. This figure demonstrates that the power coefficient for the three controls remains constant, approximately 0.48, with ripples. These ripples are larger for the PIC controller than for the T1FLC and FOT2FLC. Figure 19 shows that the FOT2FLC regulator has a great ability to maintain a constant coefficient under random wind conditions with a very fast dynamic response compared to other strategies. Compared to Figure 13, it is noted that the power coefficient value is better when using the step wind pattern, and the FO-T2FLC regulator achieves the best results in maintaining the Cp value close to its optimum value under different WS conditions, which indicates its high efficiency. Compared to Figures 19 and 13, it is noted that the PI regulator gave larger power coefficient ripples in the case of variable WS compared to step WS, which indicates a decrease in the performance of this regulator in the case of random WS.
Figure 20 represents the variation of the TSR value over time under variable WSs. From this figure, it is evident that the TSR value remains constant and does not change with changes in WS. When using a conventional regulator, the TSR fluctuations are larger than when using the FOT2FLC and T1FLC regulators. Figure 20 shows that the FOT2FLC regulator provided better response time and greater stability of TSR than the other strategies, demonstrating superior control of aerodynamic efficiency, even in the face of random wind disturbances.
Figure 21 shows the tracking error for each control strategy under random wind changes. This figure demonstrates that this error stabilizes at zero for both T1FLC and FOT2FLC, demonstrating the effectiveness of these controllers. However, when using a traditional controller, large fluctuations are observed in the Error speed tracking, indicating the ineffectiveness of this controller compared to other strategies. Figure 21 also shows that the FOT2FLC controller achieved greater stability and a significantly better response time than the T1FLC and PIC. These graphical results highlight the high efficiency and effectiveness of the FOT2FLC controller, making it a promising and reliable solution for control applications.
Table 5 represents the comparison between PIC, T1FLC, and FOT2FLC based on the results of the second test, which used a random wind profile.
The results from Test 2 highlight remarkable performance enhancements across all metrics for the advanced control strategies (T1FLC and FOT2FLC) when compared to the traditional PIC.
The performance comparison reveals significant advancements across various metrics, underscoring the effectiveness of the control strategies employed. For IAE, T1FLC demonstrates a substantial improvement of 94.39% over PIC, while FOT2FLC achieves an exceptional reduction of 99.70%. Notably, FO-T2FLC also shows a 94.69% improvement over T1FLC, highlighting its superior capability in minimizing absolute errors under variable conditions. In terms of ITAE, T1FLC reduces this metric by 98.61% compared to PIC, whereas FOT2FLC shows an impressive 99.68% reduction, with a 77.27% improvement over T1FLC, illustrating its efficiency in addressing time-weighted absolute errors.
When examining ISE, T1FLC reduces ISE by 88.06% from PIC, while FO-T2FLC excels with a staggering 99.97% reduction. The improvement of FOT2FLC over T1FLC is notable at 99.73%, demonstrating its effectiveness in minimizing squared errors, which are crucial for enhancing the precision of control systems. Lastly, for ITSE, T1FLC achieves a reduction of 99.85% compared to PIC, whereas FOT2FLC attains a remarkable 99.92% reduction. The improvement of FOT2FLC over T1FLC stands at 99.45%, indicating its robustness in minimizing time-weighted squared errors, thereby contributing to improved stability and responsiveness of the control system.
In test 2, the introduction of a random wind profile adds complexity to the system’s dynamics, necessitating that control strategies adapt quickly and effectively. FOT2FLC excels in this scenario, demonstrating faster response times, reduced tracking errors, and superior management of torque and speed fluctuations. The results indicate that FOT2FLC is more robust in handling unpredictable wind variations, maintaining optimal performance in power extraction and system stability. While both T1FLC and FOT2FLC outperform PIC, FOT2FLC emerges as the most efficient and precise control approach for WT systems operating in highly variable environments, making it an ideal solution for enhancing overall operational reliability.
Test 3: Robustness test
The designed approach is tested in this test under a change in the moment of inertia (J), where its value varies by a factor of 40%. The same wind variation pattern used in the second test is used in this test. This test aims to determine the effectiveness and efficiency of the designed approach in the event of a turbine failure. In this test, the moment of inertia value was chosen to be varied because its value is related to both the turbine and the generator. The results of this test are presented in Figures 22 to 26, and the numerical results are presented in Table 6. Figure 22 shows the variation of aerodynamic torque for the three controllers as a function of moment of inertia. This figure demonstrates that the aerodynamic torque varies with wind speed, despite the change in moment of inertia. It is also evident that the dynamic response to aerodynamic torque is better with the FOT2FLC controller than with the other controllers. When comparing this figure with Figure 17, it is noticeable that the aerodynamic torque is affected by the change in the moment of inertia. This effect is most noticeable in the time range of 0.5–1 s when using both PIC and T1FLC.
Aerodynamic torque (Test 3).
Rotational speed (Test 3).
Power coefficient (Test 3).
Tip speed ratio (Test 3).
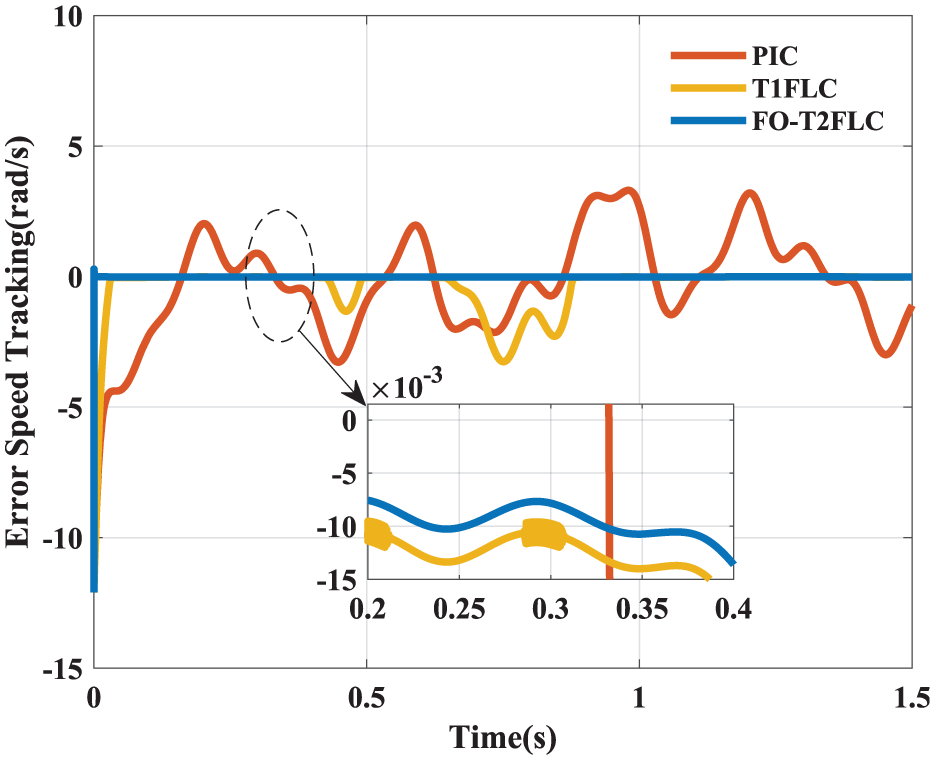
Error speed tracking (Test 3).
Value of IAE, ITAE, ISE, and ITSE of designed approaches (test 3).
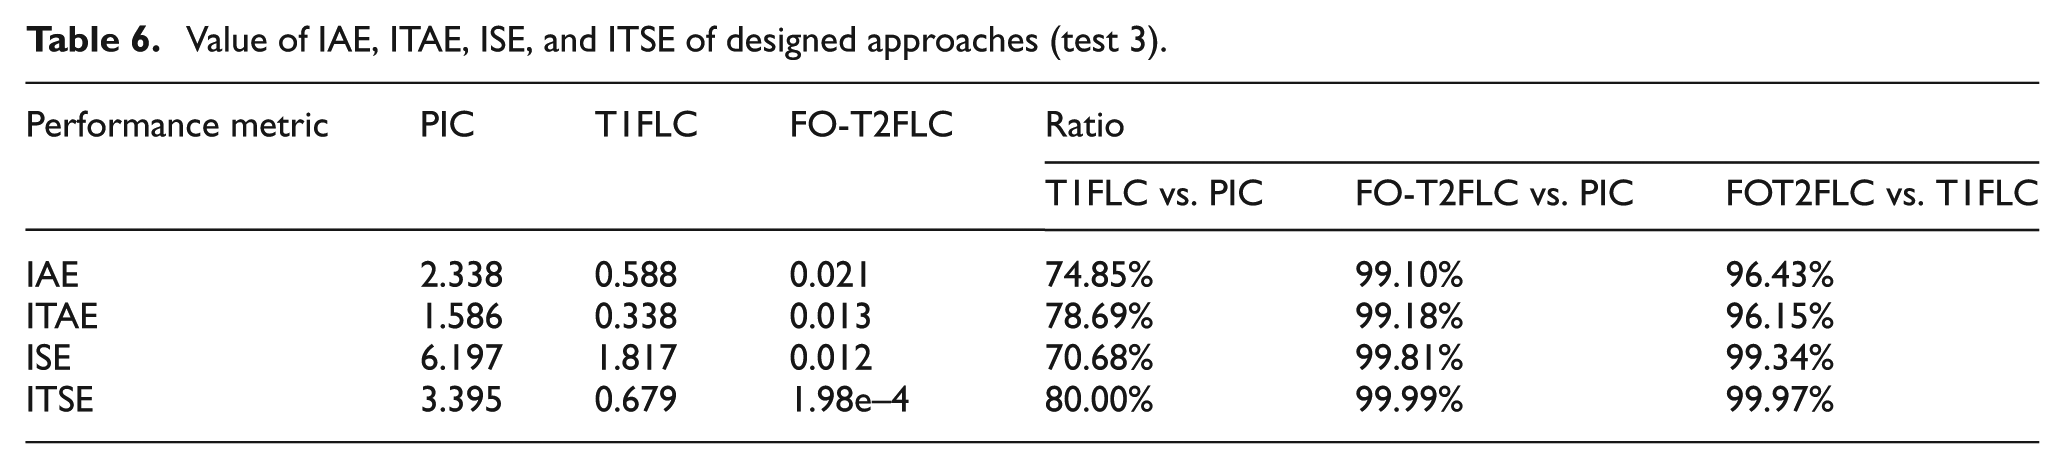
Figure 23 represents the change in rotational speed over time for the three controls as the moment of inertia value changes. From this figure, it is noticeable that despite the change in the moment of inertia value (a 40% increase), the rotational speed follows the reference value well, with a noticeable effect, especially in the time range of 0.42–0.45 s. This effect is most pronounced when using a PIC. In the 0.5–0.1 s timeframe, it is also noted that the speed was significantly affected by the T1FLC compared to the FOT2FLC, which achieved superior performance. This superior performance is demonstrated by its insensitivity to changes in moment of inertia, making it a promising solution.
Figure 24 represents the variation of the power coefficient over time for the three controls in the robustness test. This figure demonstrates that the power coefficient for the three controls follows the maximum value well, with ripples. Note that these ripples are larger for both the PIC and T1FLC compared to the FOT2FLC. Compared to Figure 19, it is noticeable that the PIC and T1FLC controls are significantly affected by changes in moment of inertia, with this effect being evident in the presence of large ripples. Figure 24 shows that the dynamic response of the power coefficient is much better with the FOT2FLC compared to the other controls.
Figure 25 represents the variation of the tip speed ratio over time for the controllers designed in this paper. This figure demonstrates that a change in the moment of inertia negatively affects the tip speed ratio when using both the PIC and T1FLC. This effect is most noticeable in the presence of large ripples. Compared to Figure 20, it is noticeable that the tip speed ratio was not affected when using the FOT2FLC, highlighting the effectiveness and robustness of this controller. It is also noticeable that the T1FLC was significantly affected in the 0.60–0.90 s timeframe. On the other hand, Figure 25 shows that the response time and the tip speed ratio are much better when using the FOT2FLC regulator compared to other regulators. Figure 26 represents the error speed tracking for the three controls in the robustness test. From this figure, it is noticeable that the FOT2FLC controller provided significantly better error speed tracking values than the other controllers in terms of response time, ripples, and overshoot. Figure 25 demonstrates that despite the change in moment of inertia, the FOT2FLC controller provided efficient and effective performance. Compared to Figure 21, it is noted that the error speed tracking in the case of using the T1FLC regulator was significantly affected, especially in the time range 0.45–0.85 s, which indicates that this regulator was affected and its durability decreased.
Table 6 presents the numerical values and reduction ratios for IAE, ITAE, ISE, and ITSE using the three controls. Comparing this table with the results in Table 5 reveals that the IAE, ITAE, ISE, and ITSE values were significantly affected in the third test by changes in the moment of inertia. This effect is most evident in the increased error values. Table 6 shows that the IAE, ITAE, ISE, and ITSE values are significantly better with the T1FLC than with the PIC. Thus, the T1FLC reduced the IAE, ITAE, ISE, and ITSE values by 74.85%, 78.69%, 70.68%, and 80.00%, respectively. These values are graphically represented in Figure 27(a). These figures also highlight the significant error reduction effect of the T1FLC compared to a conventional regulator.
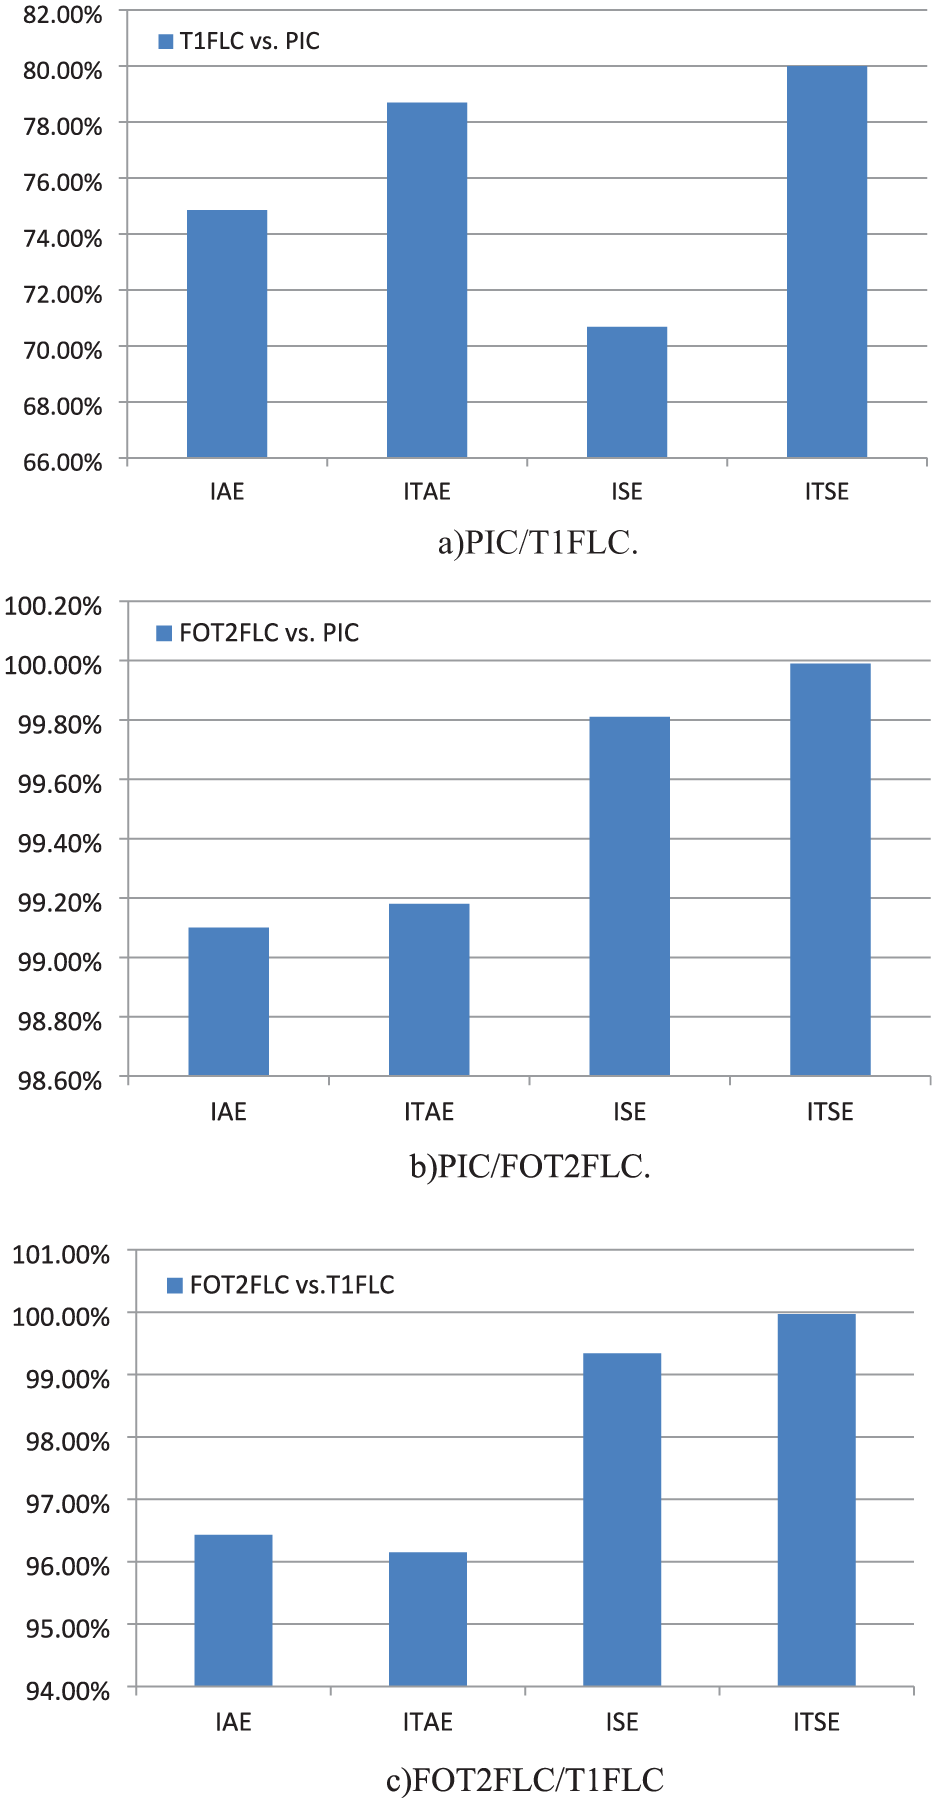
Graphical representation of error improvement: (a) PIC/T1FLC, (b) PIC/FOT2FLC and (c) FOT2FLC/T1FLC.
When comparing the IAE, ITAE, ISE, and ITSE values of the FOT2FLC and PIC regulators, it is noted that these values are significantly better with the FOT2FLC. Therefore, the designed regulator reduced the IAE, ITAE, ISE, and ITSE values by 99.10%, 99.18%, 99.81%, and 99.99%, respectively. These results are graphically represented in Figure 27(b). These high improvement ratios demonstrate the effectiveness of the FOT2FLC regulator and its ability to significantly improve errors compared to a conventional regulator. Table 6 also shows that the IAE, ITAE, ISE, and ITSE values are significantly lower with the designed regulator compared to the T1FLC. This designed regulator reduced the IAE, ITAE, ISE, and ITSE values by 96.43%, 96.15%, 99.34%, and 99.97%, respectively, compared to the T1FLC. Figure 27(c) shows the reduction percentages obtained compared to the T1FLC and FOT2FLC.
Test 4: Constant wind speed test
The effectiveness of the three strategies in this test is studied under constant WS. In this test, the WS is fixed at 8.5 m/s, as shown in Figure 28. The results of this test are presented in Figures 28 to 33. The numerical results are also presented in Table 7.
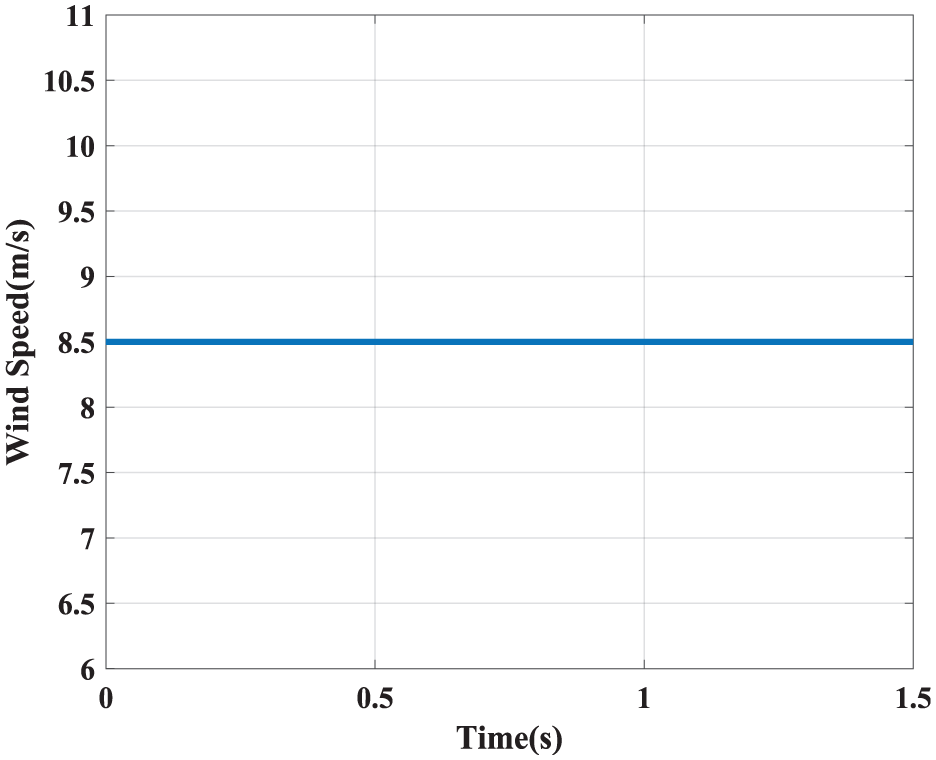
Constant wind speed profile.
Aerodynamic torque (Test 4).
Rotational speed (Test 4).
Power coefficient (Test 4).
Tip speed ratio (Test 4).
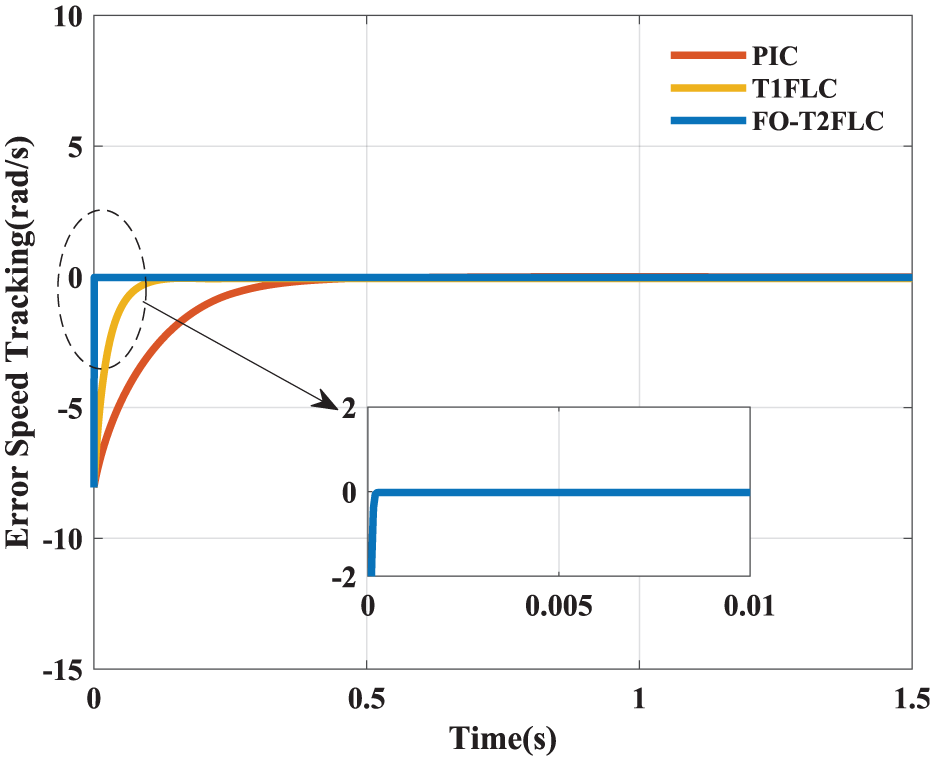
Error speed tracking (Test 4).
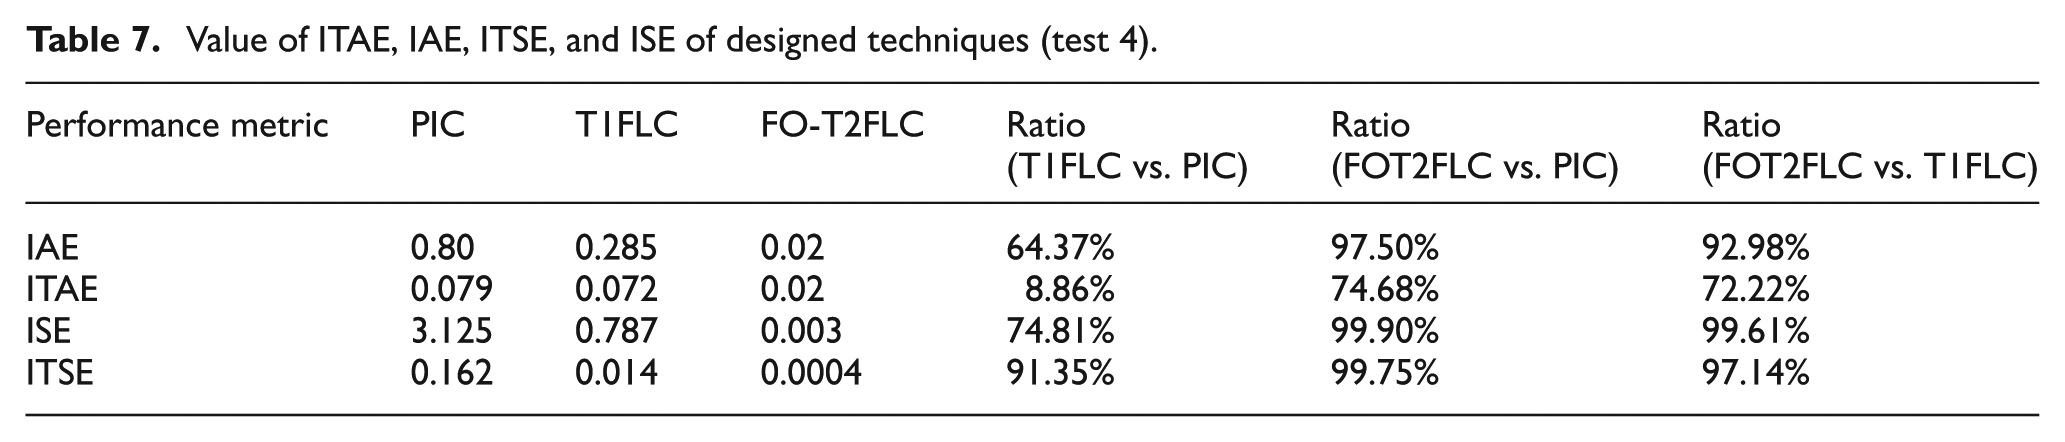
Value of ITAE, IAE, ITSE, and ISE of designed techniques (test 4).
In the case of using a constant WS, it is observed that the values of both the rotational speed and electromagnetic torque for the three controls take constant values, as shown in Figures 29 and 30. It is also observed that the response time for both the rotational speed and electromagnetic torque is significantly better in the case of using the FOT2FLC approach compared to the other strategies.
Figures 31 and 32 represent the variations in the power coefficient and tip speed ratio for the controls at constant WS. These figures demonstrate that the power coefficient and tip speed ratio values for the three controls follow the WS variation pattern, with no undulations compared to the variable WS case. It is also noticeable that the FOT2FLC approach yielded a significantly faster dynamic response compared to both the T1FLC and PIC approaches.
Figure 33 represents the variation in error speed tracking for the three controls under constant WS. From this figure, it is clear that the error speed tracking value is zero for all three controls, with the FOT2FLC approach having an advantage in response time over the other strategies. Compared to Figure 26, the error speed tracking ripples are zero when the T1FLC and PIC regulators are used at constant WS. Therefore, it can be said that at constant WS, the ripples in rotational speed, torque, error speed tracking, TSR, and coefficient of power are significantly reduced to the point of nonexistence compared to variable WSs.
Table 7 presents the reduction values and percentages for ITAE, IAE, ITSE, and ISE under constant WS. From this table, it is evident that the FOT2FLC approach yielded significantly better ITAE, IAE, ITSE, and ISE values than the other strategies.
Compared to the PIC approach, the designed regulator reduced ITAE, IAE, ITSE, and ISE by 74.68%, 97.50%, 99.75%, and 99.90%, respectively. Also, the designed regulator reduced ITAE, IAE, ITSE, and ISE by 72.22%, 92.98%, 97.14%, and 99.61%, respectively, compared to the T1FLC approach. Table 7 also shows that the T1FLC controller yielded significantly better numerical results than the conventional controller. Compared to the conventional controller, the T1FLC controller reduced the ITAE, IAE, ITSE, and ISE values by 8.86%, 64.37%, 91.35%, and 74.81%, respectively. These ratios are represented graphically in Figure 34. The obtained ratios indicate that the T1FLC and FOT2FLC regulators are significantly more efficient at reducing error values than the conventional approach, as shown in Figure 34. Meanwhile, the FOT2FLC approach yielded significantly better error values than the other strategies, making it a reliable solution for industrial applications.
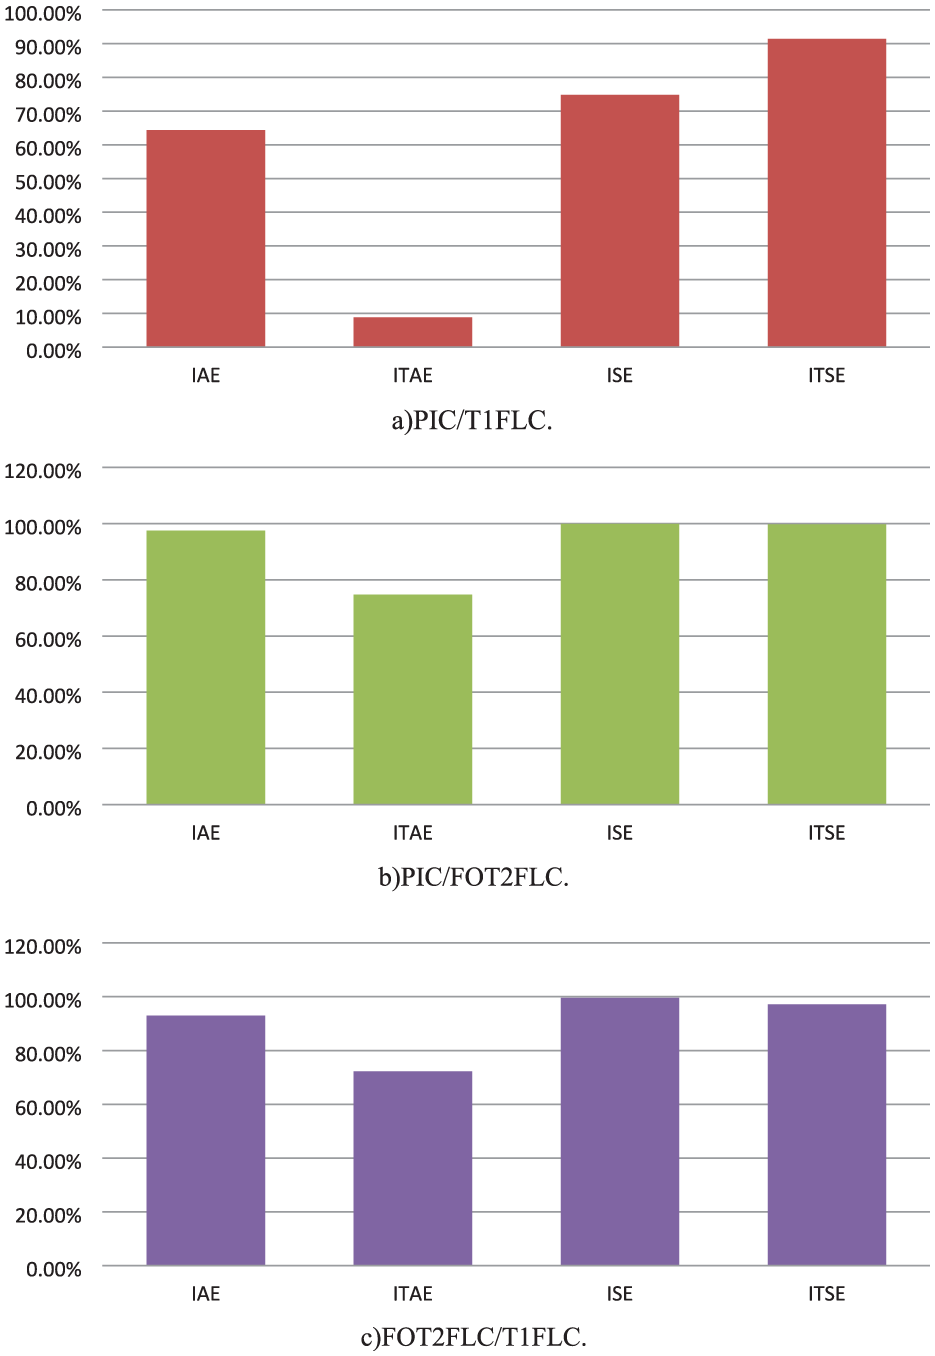
Graphical representation of error improvements at constant WS: (a) PIC/T1FLC, (b) PIC/FOT2FLC and (c) FOT2FLC/T1FLC.
These results highlight the effectiveness of this approach. This approach relies on both fractional-order control and T2FLC, and the fractional system. While each of these approaches offers performance advantages individually, combining them into a single MPPT control framework for wind turbines is novel and effective. The balance between performance and complexity is achieved using computationally efficient implementations. Compared with other advanced MPPT methods, such as sliding mode control technique, neural networks, or model-based predictive controllers, the proposed FOT2FLC provides a balance between robustness, high tracking accuracy, and low computational demand, making it practically applicable in integrated wind power systems.
In this paper, the designed regulator is tested at high sampling rates, which are typical in wind turbine systems, and the results confirm that it is suitable for use on embedded control platforms or digital signal processors (DSPs) without exceeding processing limits.
Compared with existing MPPT approaches—such as conventional P&O technique, T1-FLC, model-based or heuristic techniques—the proposed FO-T2FLC offers several key advantages:
Faster convergence to MPP with lower steady-state oscillations, improving power extraction efficiency.
Improved robustness and operational performance, especially under rapidly changing wind conditions, thanks to the memory effect of fractional order dynamics and the uncertainty effect of T2FLC technique.
It does not rely on detailed WT modeling or WS measurements, making the technique more adaptable to real-world conditions.
It is computationally cost-effective, offering better performance than highly complex approaches (such as neural networks or predictive control models), while maintaining its practical applicability.
These contributions highlight the novelty and practical importance of the proposed approach, making it a competitive and efficient solution for real-time MPPT in WE conversion systems.
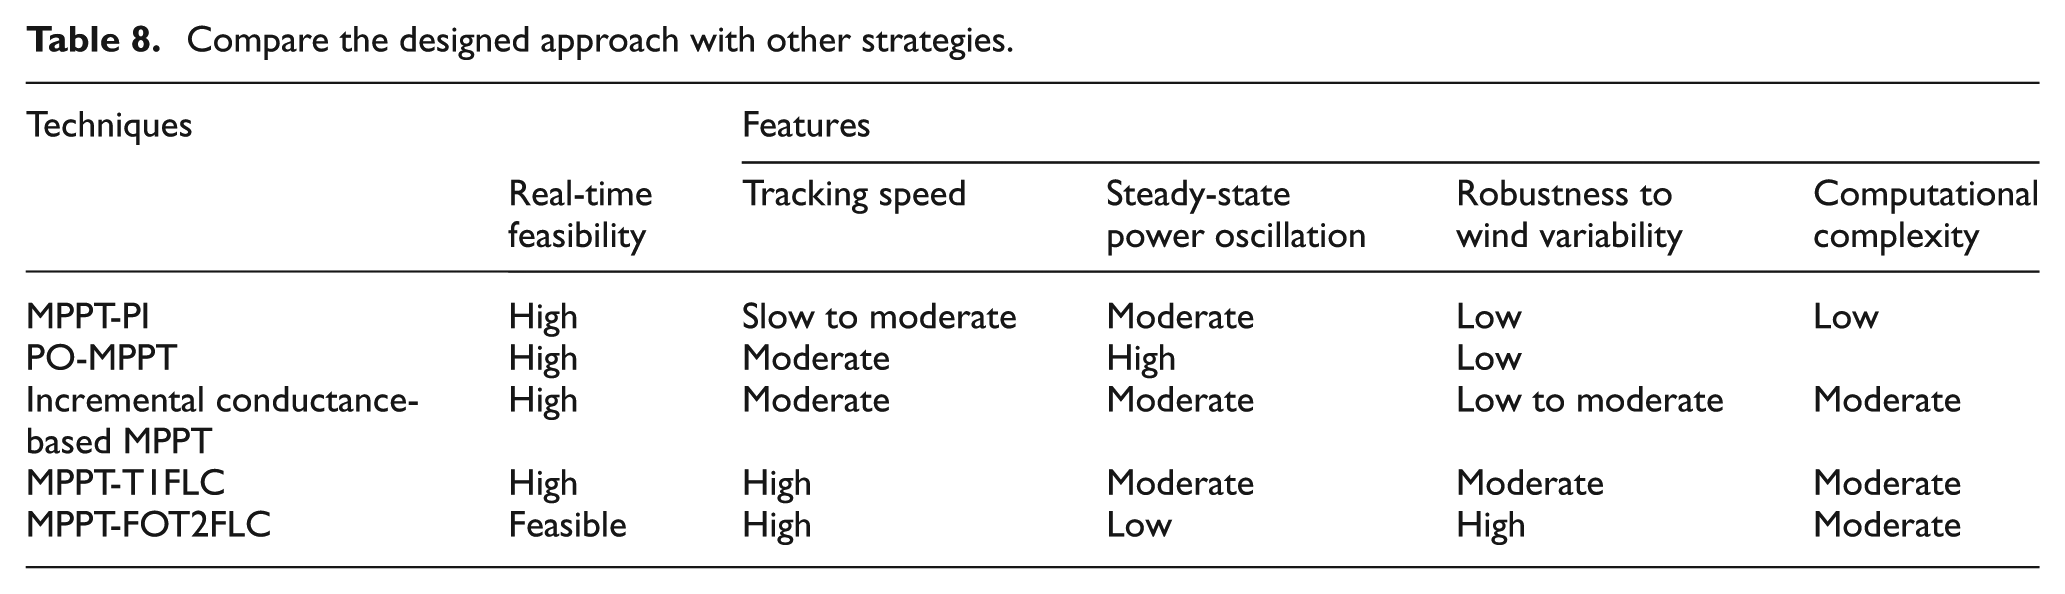
Based on the results of this paper and some strategies found in the literature, a comparison table is developed. This table includes the similarities and differences between the FO-T2FLC strategy and other MPPT techniques based on key criteria. This comparison is presented in Table 8, which demonstrates that the designed approach has superior operational performance compared to several strategies. Also, the designed approach is more complex than both the P&O and PI controllers. In terms of robustness, the designed approach is more robust than both the PI controller and incremental conductance. In terms of tracking speed, the designed approach is more efficient and effective than both T1FLC, P&O, and the PI controller. This comparison highlights the effectiveness and robustness of the designed approach, making it a reliable solution.
Compare the designed approach with other strategies.
Limitation work
The nonlinear MPPT technique designed for WT control introduces significant advances to address the challenges that characterize and hinder conventional MPPT strategies, such as the MPPT-PI strategy. There are several limitations that warrant further exploration and research. This approach has only been evaluated through simulations, requiring real-world validation to determine its effectiveness under actual operational conditions. Furthermore, the approach is computationally complex compared to traditional regulators such as PICs and T1FLCs, requiring advanced hardware. This requires further exploration and evaluation of its applicability to systems with low processing power. On the other hand, the operational performance of the designed regulator may be sensitive to the specific parameters of the WT system, requiring careful tuning for different system configurations. As is well known, simulations do not account for all real-world variations, such as operation at weak or strong WSs, which calls for further exploration. Looking ahead, future work could focus on applying the designed approach to multi-rotor WT control and conducting further applications to further understand its key capabilities and characteristics. Conducting experimental work on this designed approach will help verify its validity and effectiveness. Expanding the strategy to include other energy systems, such as photovoltaic systems and hydropower turbines, would enhance scalability. Enhancing the performance of the designer’s approach by relying on intelligent algorithms could provide an important path and a promising solution for further improving the operational performance of WTs.
Conclusions
In conclusion, this work presents a new nonlinear approach to overcome the problems and drawbacks of the MPPT strategy used for wind turbine control using a type 2 fuzzy logic controller combined with a fractional-order control strategy. The new approach improves response time, effectively reduces errors, and enhances system stability compared to both PIC and T1FLC controllers. By leveraging the fractional-order control’s ability to increase robustness and rapid response, the system can deliver high operational performance under changing and critical conditions, leading to more efficient and reliable operation. Test results demonstrate that the designed approach not only reduces errors but also significantly improves the torque ripples, tip speed ratio, and power coefficient of the turbine system. Despite the increased implementation complexity compared to both T1FLC and PIC, its benefits in terms of robustness, scalability, and accuracy make the designed approach a promising solution for wind turbine-based energy systems. Future work could explore further applications of this approach to multi-rotor wind turbines. Further research could explore extending the fractional-order control framework and improving fuzzy logic rules to accommodate broader applications and more complex scenarios.
Footnotes
Appendix
Table 9 represents the system parameters used in this work.
Acknowledgements
This research was supported by King Khalid University, Research Project RGP.2/108/46.
Institutional review board statement
Not applicable.
Ethical considerations
This research did not involve any human or animal subjects and therefore did not require ethical approval.
Consent for Publication
Not applicable. This study does not involve human participants or patient data.
Consent to participate
Not applicable.
Informed consent statement
Not applicable.
Funding
The authors received no financial support for the research, authorship, and/or publication of this article.
Declaration of conflicting interests
The authors declared no potential conflicts of interest with respect to the research, authorship, and/or publication of this article.
Data availability statement
The data that support the findings of this study are available from the corresponding author upon reasonable request.
Author Contributions
Conceptualization, S. K., H. B., A. Y., A. B. D., I. C., Z. M. S. E.; methodology, S. K., H. B., A. Y., I. C., Z. M. S. E.; software, S. K., H. B., I. C., Z. M. S. E.; validation, S. K., H. B.; formal analysis, S. K., H. B., A. B. D., I. C., Z. M. S. E., M. P.; investigation, S. K., H. B., A. Y., A. B. D., I. C., Z. M. S. E., M. P.; resources, S. K., H. B., A. Y., A. B. D., I. C., Z. M. S. E.; data curation, S. K., H. B., I. C., Z. M. S. E., M. P.; writing–original draft preparation, S. K., H. B., A. Y., A. B. D., I. C., Z. M. S. E.; writing–review and editing, S. K., H. B., A. Y., A. B. D., I. C., Z. M. S. E., M. P.; visualization, S. K., H. B., A. Y., A. B. D., I. C., Z. M. S. E., M. P.; su-pervision, S. K., H. B., A. Y., A. B. D., I. C., Z. M. S. E., M. P.; project administration, S. K., and H. B.; funding acquisition, H. B., Z. M. S. E., and M. P. All authors have read and agreed to the published version of the manuscript.