
Abstract
Researchers in the wind turbine sector have focused on condition monitoring due to challenging operating environments and high maintenance costs. This work suggests a hybrid signal processing and data-based strategy to construct a distinct integrated defect detection method for high-speed shaft bearing (HSSB) of wind turbines. The aim of condition monitoring is to increase the system reliability of a wind turbine. The study’s feature extraction techniques are grounded in the fundamentals of signal processing: time-domain metrics capture amplitude fluctuations caused by defect initiation; frequency-domain features utilize their ability to detect spectral changes indicative of damage; and wavelet transformations are employed for their capacity to localize transient occurrences in non-stationary signals. The extracted features are sorted using the proposed feature selection algorithm, designed to prioritize discriminative features before being input into a feedforward neural network model to predict the operational condition of bearings. The new fault diagnostic strategy is evaluated using bearing run-to-failure test data collected in the field. Results show that the proposed methodology outperforms traditional data-driven methods, achieving a sensitivity of 99.01% and a specificity of 98.99%. Using the Case Western Reserve University Dataset, the algorithm attained a sensitivity of 100%.
Keywords
Introduction
Over the past few decades, industrialization has advanced at an unmatched rate, which has increased demand for electrical energy significantly. 1 It increases the appeal of renewable energy sources for subsequent generations, particularly with reference to the generation of electricity. One of these renewable energy sources, wind power, currently the subject of heated discussion and is receiving more attention as a means of meeting the world’s rising demand for electricity. 2 An energy source that is good for the environment and clean is wind power. The goal of a wind turbine (WT) is to harness and transform wind kinetic energy into electrical energy. 3 However, the erratic and hardly unexpected activity of the wind, the distant locations of the wind farms, the lofty heights of the nacelles (+150 m), the insufficiency of standards and guidelines for preventative maintenance, and the exorbitant expenses associated with reactive maintenance for these structures, all combine to make the maintenance process more complicated and costly.4,5
Any systemic faults or abnormalities should be found, identified, and maybe isolated throughout the diagnostic procedure. It fits within the more comprehensive structure for control and supervision. 6 We must bear in mind that a wind turbine is a complex mechanical equipment, and issues can occur almost anywhere in this system and have varied degrees of severity, which can stop the generation of power. 7 Thus, it is essential to have surveillance systems for wind turbines that can spot flaws early on in the development life cycle. We may prevent potentially devastating breakdowns in the turbine and its surroundings in this way.8,9 Condition-based maintenance, also referred to as predictive maintenance, of WTs has in fact been acknowledged as the main opportunity to ensure the optimal maintenance of wind farms10,11 because it allows the detection of potential issues before they arise and because it may save valuable time and resources.
A wide variety of variables, including speed parameters, temperature parameters, viscosity, and vibration, are used to analyze the state of a monitored component. As a consequence of the application of artificial intelligence (AI) and machine learning (ML) techniques in the past few years, various solutions have been created. Over 70% of the remaining approaches relied on classification and were based on regression. 12 The most widely utilized techniques are decision trees, neural networks, and support vector machines (SVM). However, a key challenge with modern AI- and ML-based algorithms is their dependence on large datasets, a lengthy learning process, and significant processing costs is well known.12,13
Models are frequently created using machine learning-based approaches based on previous operational data gathered from multiple sensors and an algorithm to predict the behavior of the turbine when components may be deemed to be in good condition. The forecast errors are considered as signs of abnormalities and impending problems once these models are employed in real time to assess the value of a certain signal. These techniques were used to monitor the status of the diverse parts of the system. Several research emphasized the use of data analysis to track various components. We may single out Sun et al. 6 for its monitoring of the blades, Wang et al. 14 for its development of a health indicator to spot generator faults, and Pichika et al. 15 for its monitoring of gearboxes utilizing unprocessed acoustic and vibration signals. In order to create a health indicator, Jellali et al. 16 used temperature, viscosity, dynamic load, and fatigue damage to track the deterioration of wind turbine bearings.
In wind turbines, bearing failures are the most frequent flaw. The outer or inner rings, the balls, or the race 17 are just a few potential causes of the damage in this scenario. Since the condition of the bearings generates a particular vibration signature, when a fault arises, it changes regardless of whether the problem is in its beginning phases. 18 Vibration analysis is an essential method for keeping track of the bearings in wind turbines. The accuracy and effectiveness of wind turbine bearing vibration analysis have increased due to developments in sensor technology and data analysis techniques. Wavelet analysis has recently been employed in research to find defects in the bearings of WTs. 19 AI has also been employed to diagnose and predict faults in wind turbine bearings. 20 These cutting-edge techniques show how vibration analysis has the potential to enhance wind turbine dependability and safety, find damage early, and save maintenance costs. To maximize the use of vibration analysis in the field and investigate its application to other facets of wind turbine management and operation, more study is required. According to recent research, envelope analysis and modal analysis may both be utilized to extract relevant data from vibration signals and wind turbine bearings.21,22
A vibration-based fault detection method may be extremely effective due to the sensitivity of the vibration signal to the rotating machine flaw. The data are evaluated to identify signal content related to the condition of the monitored component in order to determine its status once the requisite physical amount from the monitored bearings, that is, the vibration signal, has been measured. A preprocessing stage of feature extraction and dimension reduction is designed to address the issue of large data consumption and decrease the amount of time required to process data. This step also gives us most of the information carried by the limited data set that we have.
The major contributions of this research are multifaceted. Firstly, it explores three distinct domains in signal processing to extract all feasible characteristics, ensuring a thorough analysis of the vibration signals for accurate fault detection. Secondly, an innovative ranking algorithm is developed to élite the most sensitive information from the extracted features, effectively reducing the dataset size while retaining critical information necessary for effective classification. Lastly, by feeding the reduced dataset into the classification algorithm, our approach significantly enhances the accuracy of health condition predictions for the monitored bearing. These contributions collectively improve the reliability and performance of bearing fault detection systems, offering a robust solution for real-world applications in wind turbine maintenance.
Our proposed approach stands out by integrating multi-domain feature extraction with advanced feature selection and feedforward neural network techniques. This combination allows for a more comprehensive capture of signal characteristics and improves the accuracy of fault detection. Unlike traditional methods that rely on a single domain for feature extraction, our approach leverages the complementary strengths of time, frequency, and time-frequency domains.
The rest of the paper is structured as follows: The approach for feature extraction and the proposed algorithm for feature ranking are described in Section 2 along with a review of signal processing techniques. The feedforward neural network that was used as a classification algorithm is highlighted in Section 3; the proposed approach, which combines a signal processing-based with a machine learning-based condition monitoring algorithm is presented in Section 4; and the results analysis and a comparison with prior work are presented in Section 5; and the study is summarized in Section 6.
Signal processing
Condition monitoring techniques who are based on signal processing are founded on the idea that, when a failure first appears, the measurably parameters of the system, electrical or mechanical change.23,24 These traits have predictable temporal and frequential distributions that correlate to either a normal condition or recognized failures. By contrasting the signatures of the reference and current systems, we may assess whether or not a fault exists. Based on the applications for which they are used, signal processing tools are divided into three groups: time, frequency, time-frequency.
The theoretical foundation of our method is based on the principles of signal processing across multiple domains. Time-domain analysis captures amplitude variations and transient events, frequency-domain analysis identifies periodic patterns and resonances, and time-frequency domain analysis provides localized signal characteristics. By combining these techniques, we ensure a holistic feature set that enhances fault detection capabilities.
Feature extraction
Several signal processing techniques may be employed to derive valuable insights from a recorded signal. The main challenge of condition monitoring is determining which signal processing algorithms are best suited to each activity. In addition, the nature of the signal to be studied influences the type of analysis to be performed as well as the selection of analysis parameters. In our scenario, we’re tinkering with a non-stationary signal which is the vibration record.
Failure detection is a two-pronged strategy: feature extraction and fault mode identification. 25 This dual approach allows us to extract valuable information from vibration signals with high precision and accuracy. We delve into three domains for investigation: time domain, frequency domain, and time-frequency domain, each offering distinct insights into the signal characteristics. The feature set was intentionally broad to ensure sensitivity to early fault signatures. However, redundancy is mitigated by the subsequent feature selection stage, which discards irrelevant features and retains only the most discriminative ones.
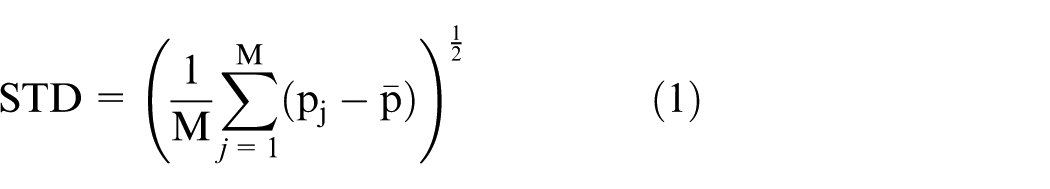
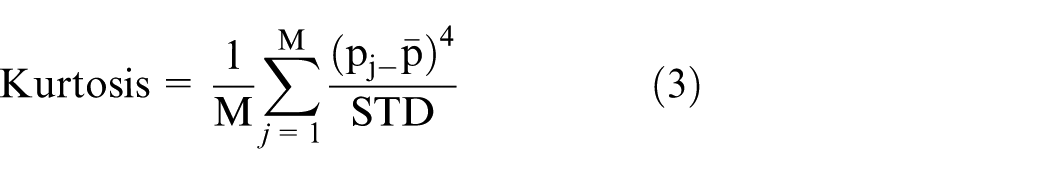
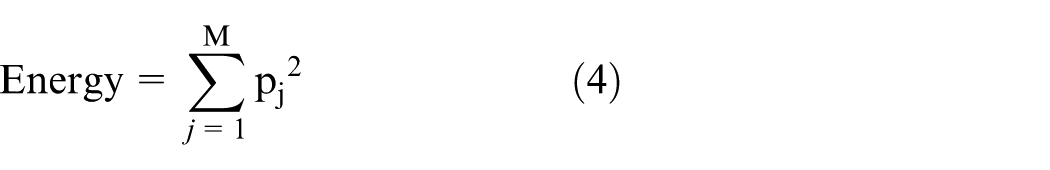
The time-domain feature extraction, a key component of our method, is specifically designed to detect the significant initial changes in the signal that signify the onset of mechanical faults. This approach is not only simple but also powerful, computing standard statistical characteristics such as Energy, Crest factor, Standard deviation (Std), Margin factor, Kurtosis, Skewness, Mean, Peak to peak, Impulse factor, RMS, and Shape factor.
What sets our method apart is the comprehensive set of features it computes, some of which are detailed in equations (1)–(4). Here,

In our research, we focus on the phenomenon where collisions between rolling components in bearings and local defects generate a shockwave. This shockwave triggers high-frequency resonances throughout the structure, extending from the bearing to the response transducer. 26 This process underscores the pronounced nature of shock impulsivity in the frequency domain.
Our approach is rooted in spectrum analysis, which is instrumental in identifying Spectrum Kurtosis (SK). Defined as the Kurtosis of the signal’s spectrum components, SK is recognized as an effective method to detect impulsive bearing signals. This is particularly crucial as these signals can often be obscured by other vibration sources, such as gears and mechanical misalignments.
What distinguishes our study is our recommendation to adopt SK, as defined in equation (5). By doing so, we enhance the detection accuracy of impulsive bearing signals, thereby bolstering the overall reliability of our method.
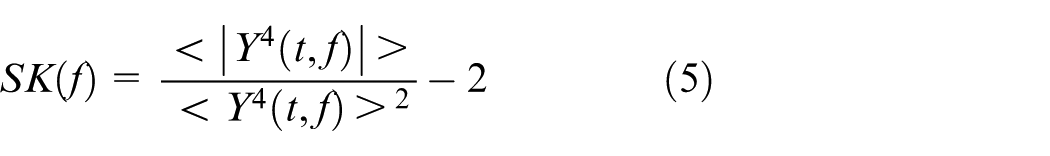
The operator for time-frequency averaging is <•>. The fourth order of the band-pass filtered signal y(t) centered on the frequency f is represented as
In our research, we address the non-stationarity in vibration signals by representing it as a two-dimensional function of time and frequency. We employ the wavelet transform, a powerful signal processing technique that uses a series of low-pass and high-pass filters to separate power signals into multiple frequency bands. This allows us to identify unusual conditions effectively.
The wavelet transform (WT) technique is used to extract additional features beyond the time domain and frequency domain characteristics previously discussed. This contributes to building a robust and reliable feature database. Wavelets are favored in various fields because of their capacity to flexibly customize time and frequency resolutions for signal processing.
The HAAR wavelet was chosen for this study due to its effectiveness in detecting transients or abrupt changes in vibration signals, which are often indicative of early-stage faults in rotating machinery. Additionally, HAAR wavelets have low computational complexity, making them efficient for processing large volumes of real-time data. Their simplicity also allows for straightforward feature extraction.
In this study, a three-level decomposition was performed using the formula log2(Sampling Frequency/Default Frequency), ensuring the capture of relevant frequency components for accurate fault detection. These characteristics make the HAAR wavelet an ideal choice for our diagnostic approach. At each stage of the decomposition, we use four parameters: energy, variance, entropy, and standard derivation. This approach enhances the comprehensiveness of our feature set, thereby strengthening the overall reliability of our method.
Feature ranking
We have successfully generated a comprehensive data feature set comprising 31 distinct features. This achievement is a direct result of our innovative methodology employed in the preceding stage. However, recognizing that not all parameters are sensitive to the flaws in the vibration signal, we have prioritized the selection of the most significant feature that accurately represents the health state of the monitored bearing.
Our method introduces an approach to feature selection by employing two distinct metrics, Trendability and Monotonicity, as outlined in equations (6)–(7). These metrics serve as robust indicators of each feature’s relevance and effectiveness in determining the health status of the bearing.27,28
Monotonicity (MN), a key component of our method, is utilized to quantify the monotonic trend in condition indicators as the system evolves. The strength of this metric lies in its simplicity and effectiveness, providing a result that ranges from 0 to 1. A score of 1 signifies a completely monotonic feature, whereas a rating of 0 indicates a non-monotonic feature.
Similarly, Trendability (TR) serves as a powerful metric for comparing the trajectory of features obtained from different run-to-failure tests. A more trendable feature yields projections with the same basic form, further enhancing the reliability and accuracy of our method. The values for this metric also [0 to 1], with 1 denoting perfect trendability, 0 indicating complete non-trendability for a feature.
Through the advanced use of these metrics, our method offers a robust and reliable approach to feature selection in bearing health monitoring, setting a new standard in the field.
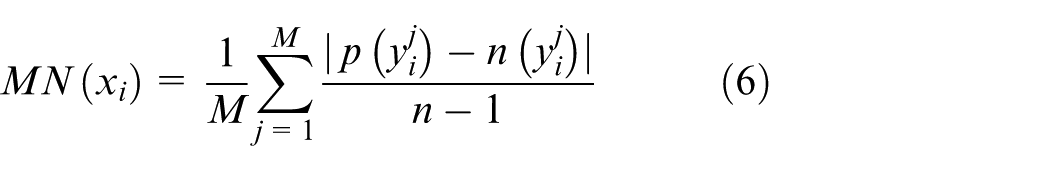

In our case M = 1, which designs the overall count of monitored machines, and the total number of features (n = 31).
Accordingly, in this part, a new feature ranking algorithm depicted in Figure 1, is constructed. This approach is based on the following principle: the higher the μ value of a feature (mean of the monotonicity and trendability), the better its performance is. To be more specific, while ranking N features, the μ scores (in the [0,1] range) are first examined for each feature. Then, N features are sorted by their μ values, such that the μ value of the
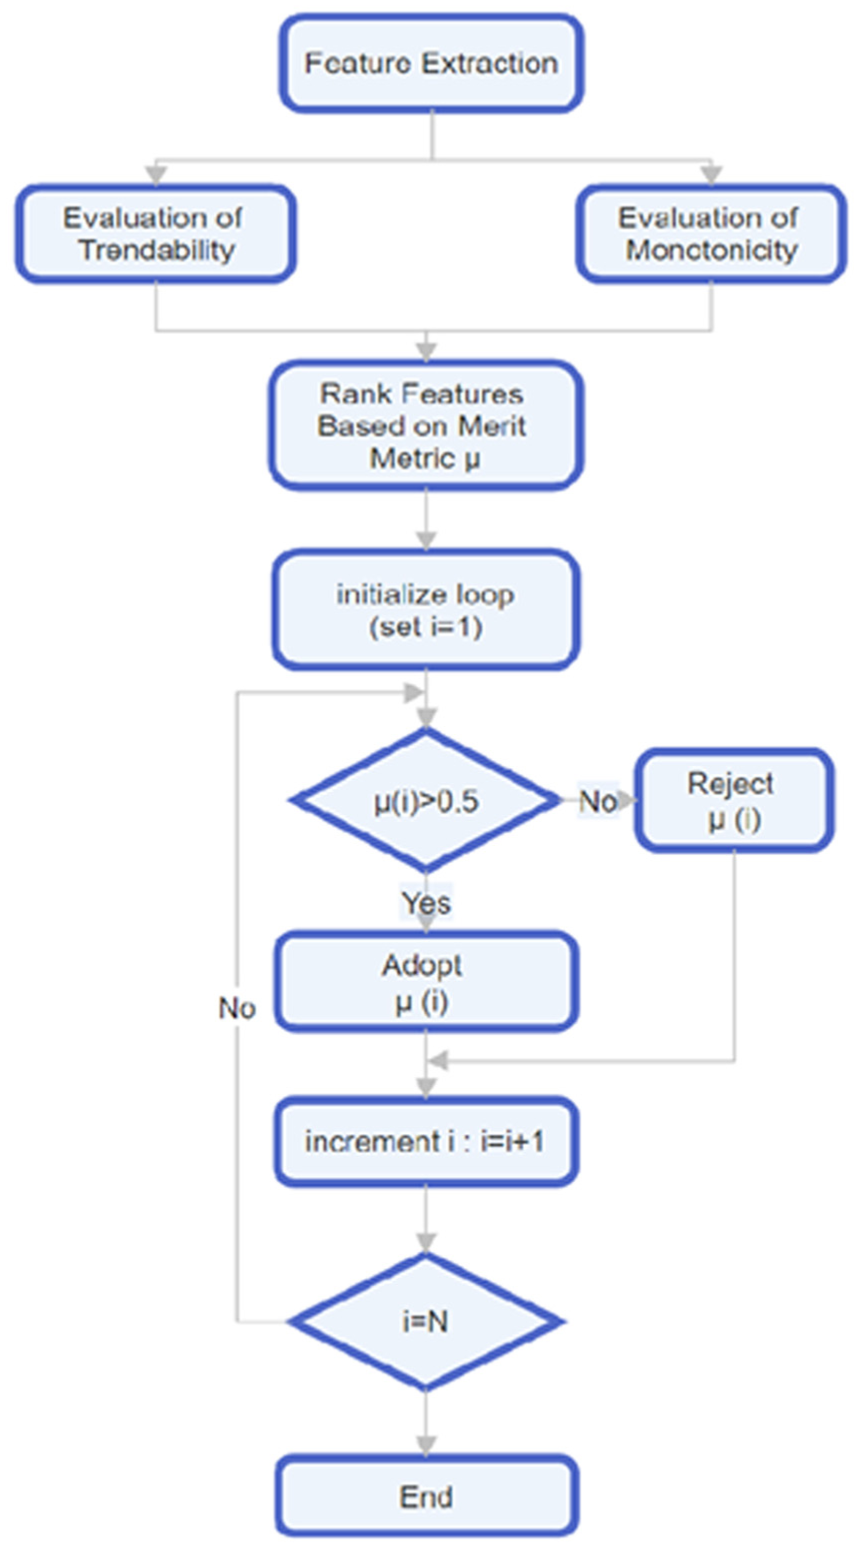
Feature ranking algorithm.
Feedforward neural network
Deep learning (DL) is a subsection of machine learning (ML), that in itself is a subfield of artificial intelligence (AI). A machine may mimic human behavior thanks to AI technology. 27 ML is a method of attaining AI through the use of data-taught algorithms. Last but not least, DL is a subset of ML that takes its cues from how the human brain is structured. This structure is a synthetic neural network in terms of DL. The neural network chooses the properties that allow two classes to be discriminated against without requiring human intervention, in contrast to ML.24,27
The objective of the DL model is to map input features x to an output y, which represents the fault class of the bearing. This is modeled probabilistically as:

where
One of the most popular and commonly utilized subtypes of deep neural networks are feedforward neural networks (FFNs). They are sometimes referred to as multilayer perceptrons (MLPs), and they feature a straightforward, linear structure with a single route of information flow from input to output. They can learn hierarchical representations of data where high-level abstractions are learned from lower-level features, they can model intricate non-linear connections between inputs and outputs, and they are simple to train with common optimization algorithms like stochastic gradient descent. They also perform well on a variety of tasks including image classification, speech recognition, and natural language processing. A sizable community of scholars and practitioners has contributed to the creation of FFNs, which are extensively utilized and well-researched.
The proposed fault detection approach
The recommended approach combines feedforward neural network’s aptitude for identifying the nature of the input—in this situation, the state of a wind turbine bearing that is being monitored—with signal processing techniques in multiple domains.
Data set and sensor
The scenario used to test and confirm the effectiveness of the suggested technique is a series of vibration signals measured on an actual WT’s run-to-failure HSSB. The turbine under test is a three-bladed, upwind unit with a rated output of 2 MW. This set is measured every day for 50 days for 6 s. An inner race problem was confirmed by analysis of the inspected bearing within the last day.22,29
The vibration signal gathered from the monitored bearing installed in a real Wind Turbine have been measured using a sophisticated monitoring system developed and constructed by the Green Power Monitoring Systems located in the United State of America. This system uses a MEMS accelerometer (ADXL001) with a bandwidth of 32 kHz and a resonance of 22 kHz and a sensitivity of 70 gs. The data was sampled by an ADS1271 24-bit Sigma Delta ADC. The operating speed of the bearing was approximately 30 Hz. The MEMS accelerometer was installed radially on the high-speed shaft at the gearbox bearing support to capture the vibration perpendicularly to the shaft. After the inspection of the bearing, an inner race defect has been detected. 25 The division of the dataset is made by its owner Bechhoefer et al. 30 as in the first 10 days the monitored bearing is considered as healthy, on day 11 the degradation began to reach the faulty state on day 25.
Since genuine bearing fault signals in offshore wind turbines are typically commercially confidential, we validated the suggested fault-diagnosis approach using the publicly available information available from Case Western Reserve University’s Bearing Data Center (CWRU). The CWRU bearing dataset has been extensively used in several studies and has a solid track record in research related to defect diagnostics in high-speed bearings for wind turbines. At a particular bearing position, the fault point design employed EDM technology with sampling frequency of 12 kHz and fault depths of 0.1778, 0.3556, and 0.5334 mm. By using overlapping sampling, 10,000 groups with 864-long samples each were created from the data. 31
Preprocessing and feature extraction
Our research delves into the intricate process of feature extraction, a method that uncovers valuable information hidden within vibration signals. This information is crucial in defining the operational condition of the monitored bearing. By extracting features from multiple domains, we increase the likelihood of identifying the most expressive characteristics.
As depicted in Figure 2, the input data undergoes a signal processing step where a total of 31 features are extracted. This includes 11 primary statistical features from the time domain, four features from the frequency domain extracted from the spectral kurtosis, and 16 features from the time-frequency domain using the third order HAAR wavelet.
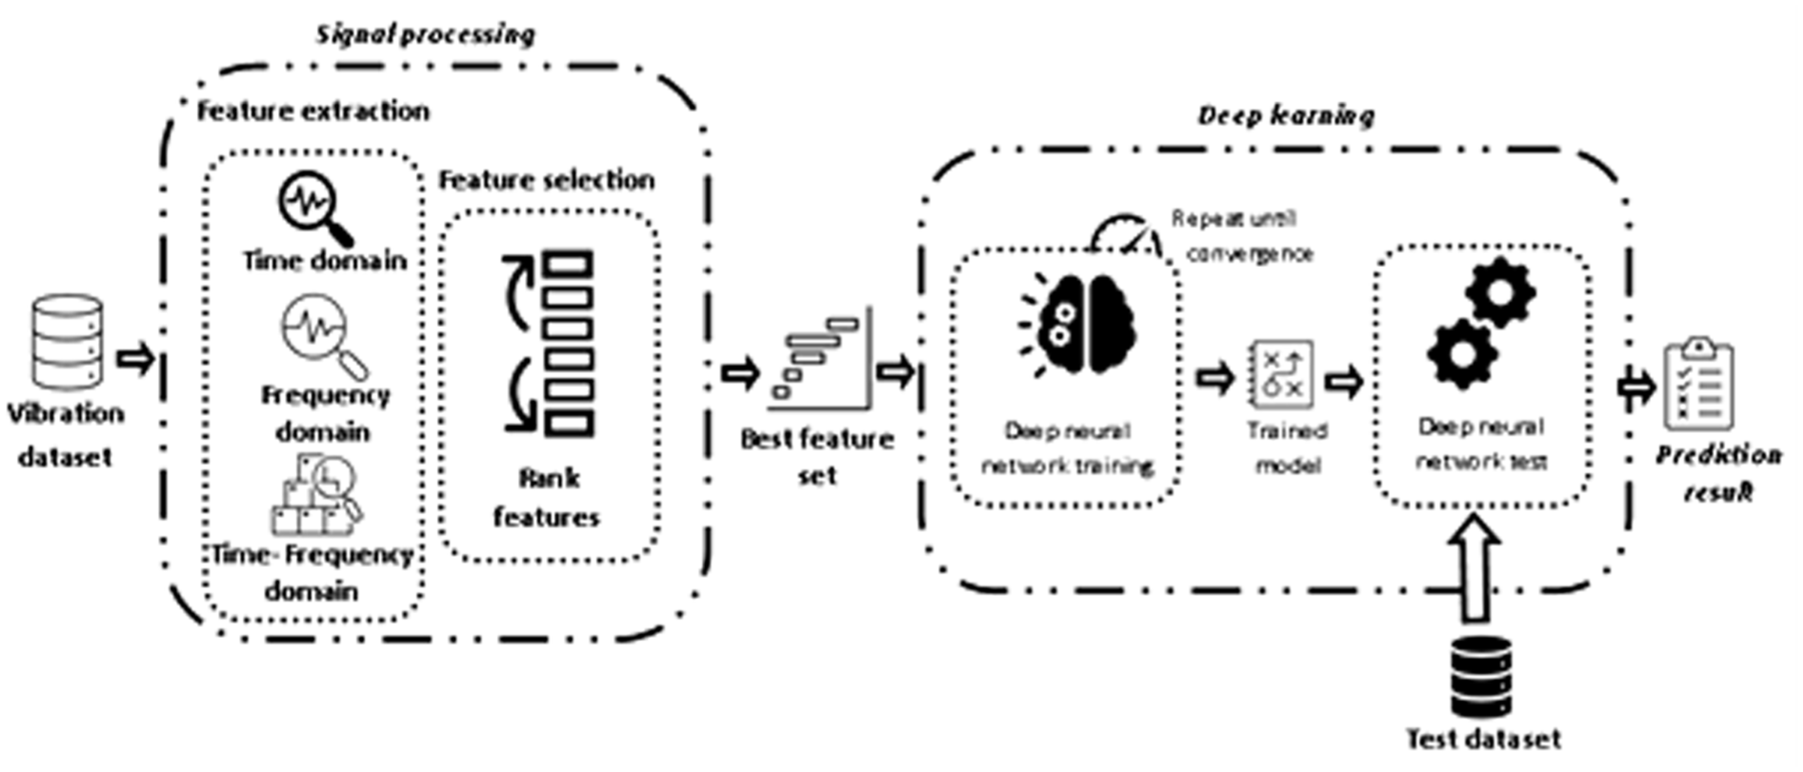
A WT bearing fault detection algorithm based on signal processing and feedforward neural network.
Figure 3 presents the input vibration signal, clearly showing its evolution over a 50-day period. The acceleration at the start of monitoring, ranging around −10 and 10, represents a healthy state. However, as defects develop, this range shifts to [−20, 20] by the end of the 50-day period, indicating a failed state. This variation underscores the accuracy of vibration signals as a parameter for assessing the monitored component, making the derivation of statistical features from the time domain a powerful tool in determining the bearings’ health state.
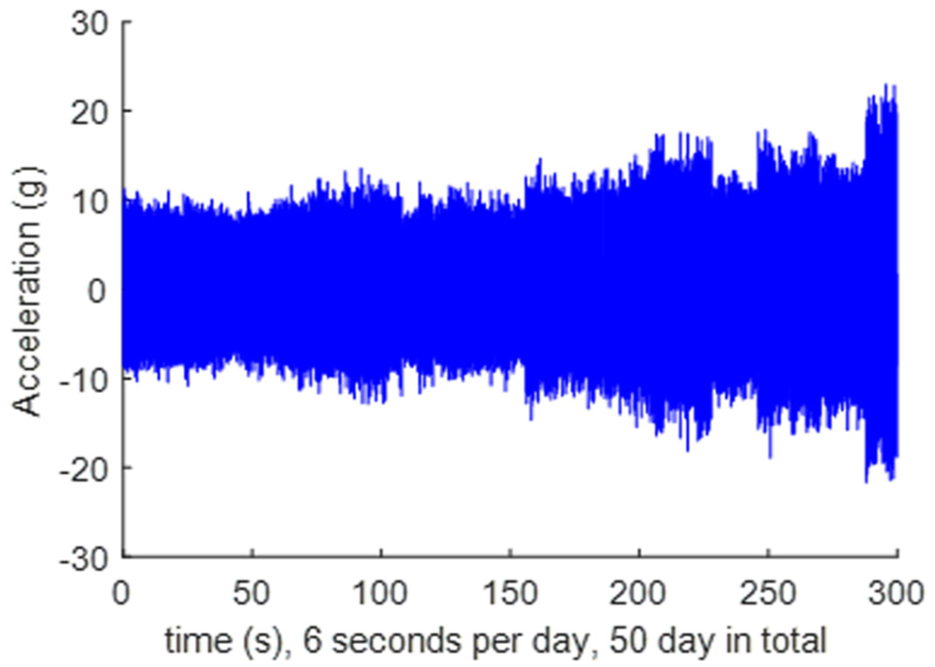
High speed shaft bearing vibration signal in a run-to-failure scenario.
Spectral kurtosis, a tool for spectral analysis, is applied in the frequency domain. The kurtosis spectrum, vividly contrasting the normal and faulty states, and marking the beginning and end of the monitoring journey. This highlights the efficiency of the kurtosis spectrum in monitoring.
While features from the time domain and frequency domains are highly effective at predicting the health condition of a monitored component, we’ve incorporated the time-frequency domain to enhance the extraction process of the information contained in the sensor data. Each level is subject to entropy, energy, standard derivation, and variation.
Once all the features from the three domains have been extracted, a crucial selection phase is initiated to identify the characteristics that are correlated to the condition of the bearings and filter out the non-sensitive ones. As a result, only 8 out of the 31 features produced by the feature extraction process pass through the feature selection stage. These selected features form a streamlined dataset that is then utilized to train the feedforward neural network algorithm, thereby ensuring an efficient and robust approach to bearing health monitoring.
Each vibration signal was sampled at 97,656 Hz, as specified in the dataset documentation and determined by the acquisition hardware. For every daily measurement (6 s duration), 31 statistical, spectral, and time-frequency features were extracted without overlap, producing one 31-dimensional feature vector per day. Across the 50-day monitoring period, this resulted in a dataset of size 50 × 31, which was used as input to the FNN (training and test). The choice of a daily, non-overlapping window is consistent with the acquisition protocol and ensures that the progressive degradation of the bearing is captured while maintaining computational efficiency.
Feedforward neural network architecture for fault detection
The proposed approach for defect detection relies on a fully connected feedforward neural network (FNN). This network is specifically designed to process the features that were extracted from the vibration signal and deliver accurate, reliable predictions about the bearings’ condition. We chose the fully connected feedforward neural network since the characteristics we retrieved are in tables and don’t have any spatial or sequential relationships that would need convolutional or recurrent designs. This structure preserves computing efficiency while enabling each feature to make a meaningful contribution to the classification process. Initial tests using different topologies, including recurrent or convolutional networks, greatly raised the processing cost and did not enhance classification accuracy. Therefore, the FNN offers the best possible balance between efficiency, interpretability, and accuracy for tracking the condition of wind turbine bearings.
Its architecture includes an input layer with 31features, a hidden layer with ReLU activation for capturing complex patterns, and an output layer with three neurons representing the health state classes, followed by a softmax function for classification. To optimize its performance, the network is trained utilizing the Adam optimizer with a starting learning rate of 0.001, minimizing prediction errors to achieve robust results.
Network architecture
The design was selected primarily for its ability to handle tabular data acquired from vibration signals. The training and validation results proved the network’s capacity to reliably recognize bearing defects, as seen in Figure 4.
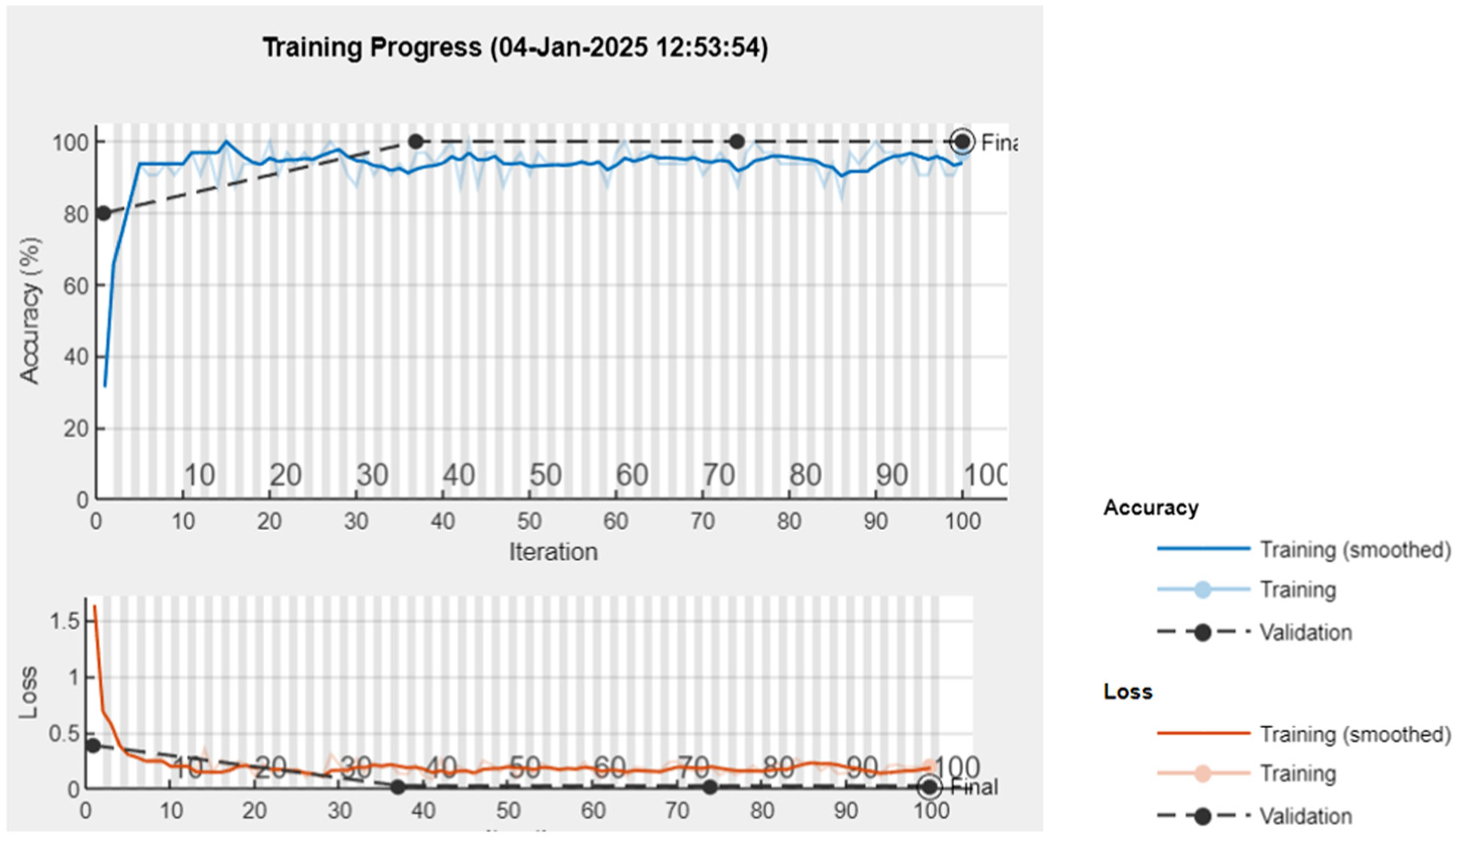
Training process.
The proposed FNN has the following components:
Input layer:
- A feature input layer processes the retrieved signal features.
- Input characteristics are standardized using the Z-score method to ensure consistent and efficient training.
Hidden Layer:
- A fully connected layer with 100 neurons.
- A batch normalization layer used to stabilize the learning process by normalizing activations.
- A ReLU activation layer is used to introduce nonlinearity and prevent vanishing gradients.
- A dropout layer with a dropout probability of 30% reduces the risk of overfitting.
- The second fully connected layer has 50 neurons.
- Additional batch normalization, ReLU activation, and dropout layers are applied in sequence.
Output Layer:
- A fully connected layer with an equal number of neurons as classes (C)
- A softmax layer is used to transform logit values into classification probabilities.
- A classification layer that calculates the loss for the categorical cross-entropy function.
Training process
The network is trained via supervised learning, with data shuffled at every epoch to enhance generalization and prevent overfitting, and divided into three partitions: training (70%), validation (10%), and testing (20%) subsets.
Training takes place throughout several epochs, with dynamic learning rate scheduling (every 10 epochs, the learning rate is reduced piecewise by a factor of 0.5), and early termination after 10 consecutive validation tests that show no change. An illustration of training progress sheds light on how accuracy and loss measurements converge.
This method was effective in determining the real class of the monitored bearing throughout the whole test data set. For this kind of monitoring, reliable and exact outcomes are crucial. This is a useful tool that may be used to forecast a bearing’s condition and head off any issues. It is feasible to see potential problems early and take action to prevent them from becoming significant difficulties by keeping an eye on the bearing’s health. This could keep equipment operating efficiently and save expensive downtime.
Results analysis
The output of the proposed FNN classifier is the health state of the bearing, categorized as healthy, degraded, or faulty. Because the input data set is randomized each time the program is executed, the train, validation, and test data sets are unique each time. To confirm the efficacy of this strategy, we evaluated the algorithm’s precision 20 times in succession.
Consequently, out of a total of 200 attempts, the algorithm was successful in detecting the real class 198 times. As shown in Figure 5, this is a very impressive success rate and indicates that the algorithm is very effective at correctly identifying the class of a monitored component. Sensitivity and specificity are crucial metrics for assessing a classification algorithm’s effectiveness.
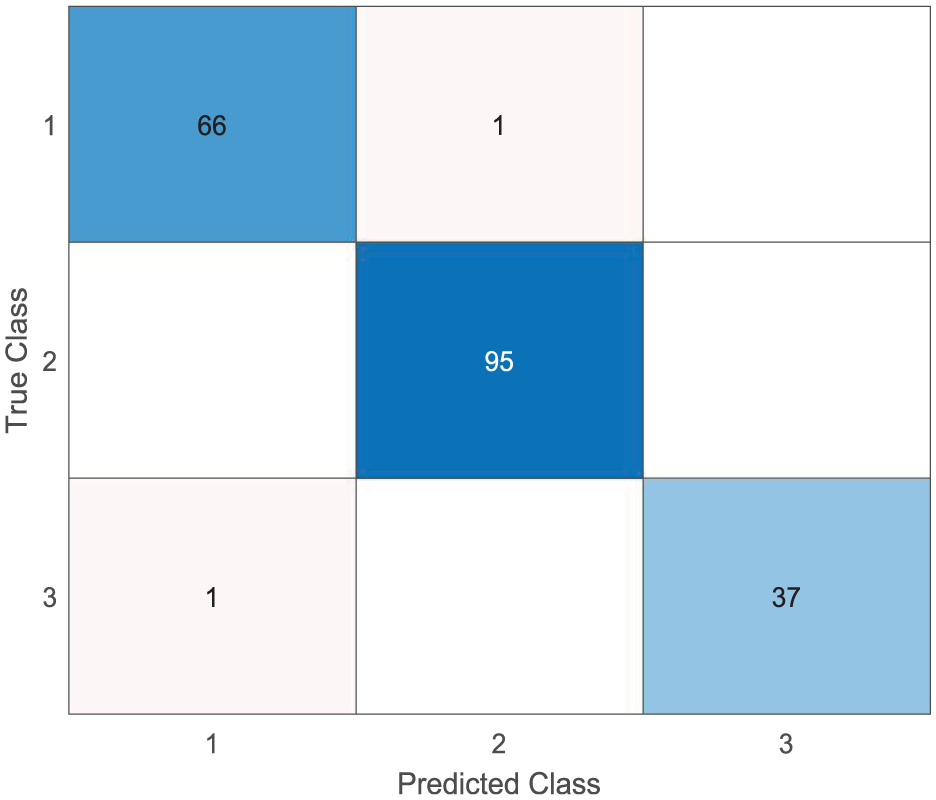
Classification results.
The ratio of real positives (i.e. properly categorized problematic bearings) to all actual positives is measured by sensitivity, whereas the ratio of true negatives (i.e. correctly classified healthy bearings) to all actual negatives is measured by specificity. In our study, we computed the sensitivity and specificity of our algorithm using both our original dataset and the Case Western Reserve University Dataset. The findings demonstrate the great sensitivity and specificity of our algorithm, demonstrating its capability to distinguish between healthy and defective bearings with accuracy. Using the Case Western Reserve University Dataset, our algorithm attained a sensitivity of 100% and specificity of 100%, whereas on our original dataset, it achieved a sensitivity of 99.01% and specificity of 98.99% (Figure 6).
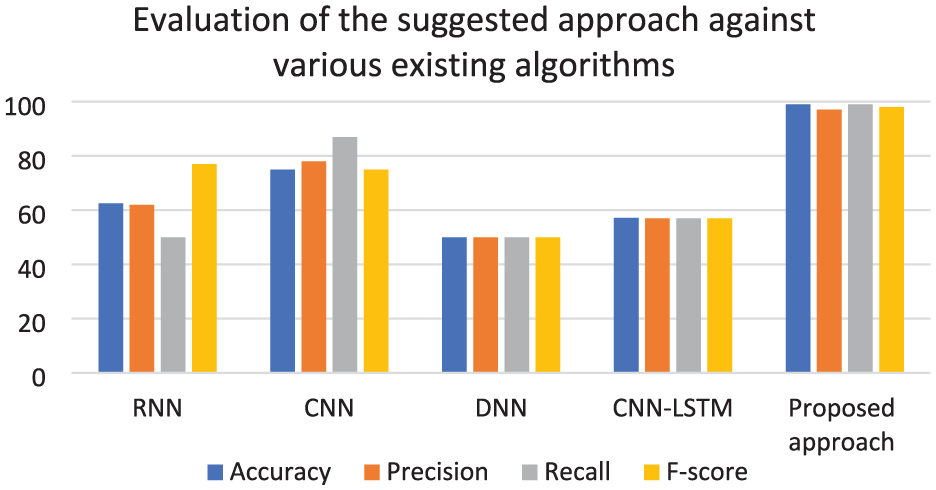
Evaluation of the suggested approach against various existing algorithms.
For fair comparison, all baseline models (RNN, CNN, DNN, and CNN-LSTM) were trained and evaluated using the same dataset, preprocessing pipeline, and training setup (including optimizer, learning rate, batch size, and number of epochs) as our proposed method. The table presents key performance parameters, including accuracy, precision, recall, and F-score, in a comparative study between the proposed approach and existing methods. Each method is evaluated, ranging from conventional architectures such as RNN and DNN to more complex models like CNN and CNN-LSTM. Notably, the proposed approach outperforms all others, achieving an accuracy of 99%, a precision of 97.06%, a recall of 99%, and an F-score of 98.02. These results highlight the advantages of the proposed method and confirm its effectiveness in fault detection. The poor performance of other approaches can be attributed to the difficulty in distinguishing different states, as the data set used follows a run-to-failure scheme, where the differences between states are extremely subtle. This scientific presentation provides a clear and quantitative comparison, validating the outstanding performance of the suggested model across all evaluation criteria. To underscore the performance of our method in predicting the health condition of a WT’s HSSB, it’s essential to draw comparisons with related work in the field (Table 1).
Comparative analysis of classification accuracy comparison of different literatures.
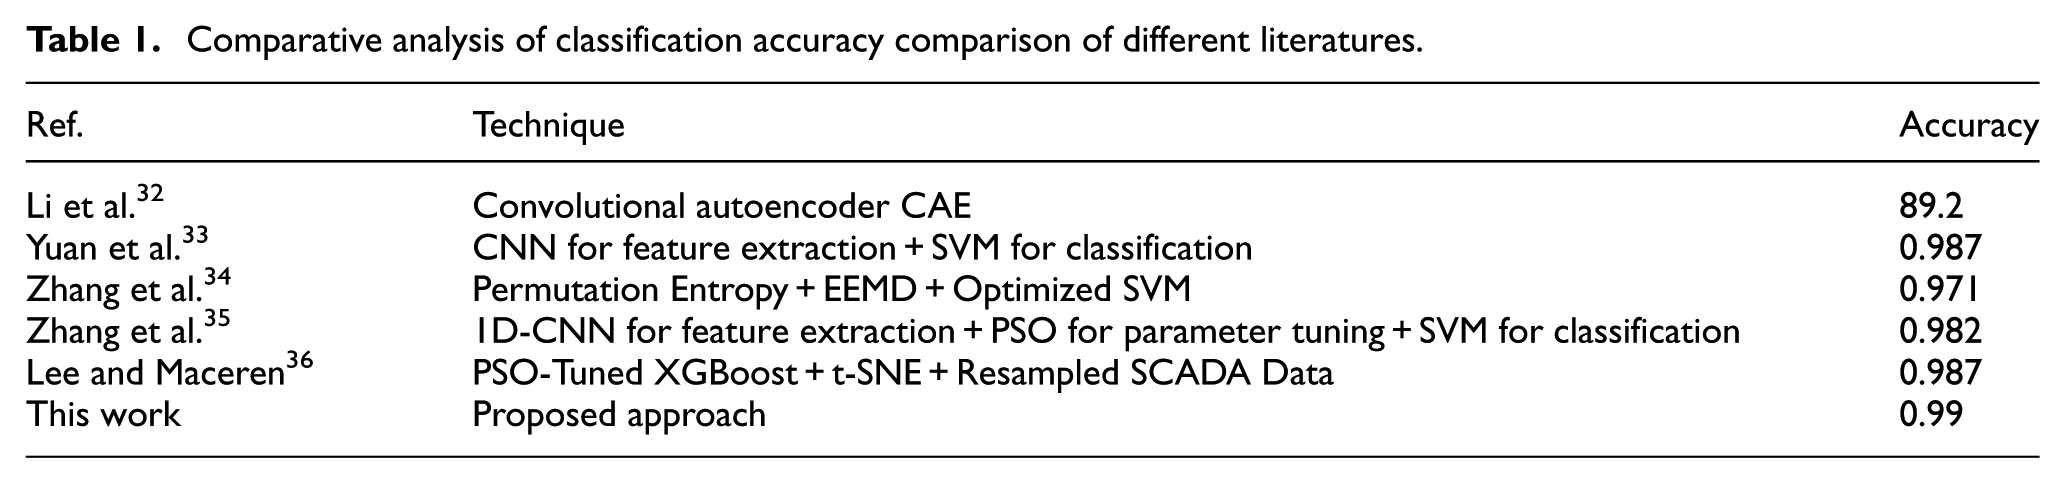
For instance, Li et al. 32 aimed at a defect diagnostic approach based on transfer learning and convolutional autoencoder (CAE). This technique underwent testing and achieved an accuracy percentage of 89.2%. Interestingly, when the authors of the same research employed SVM to investigate the same strategy, the outcome was 76%.
In another study, Yuan et al. 33 utilized A CNN-based feature extraction combined with an SVM classifier achieved an accuracy of 0.987, while a model integrating permutation entropy, ensemble empirical mode decomposition (EEMD), and an optimized SVM reached 0.971. 34 Another study proposed a hybrid model using a 1D-CNN for feature extraction, PSO for parameter tuning, and SVM for classification, attaining an accuracy of 0.982. 35 Additionally, a method utilizing PSO-tuned XGBoost with t-SNE and resampled SCADA data demonstrated an accuracy of 0.987. 36
In comparison, the proposed method achieves an accuracy of 0.99, outperforming all the referenced approaches. This improvement suggests that the method effectively captures relevant features and optimizes classification performance. The results highlight its potential for enhancing predictive maintenance in wind turbine systems, contributing to improved reliability and reduced downtime.
These comparisons highlight the competitive edge of our proposed method, demonstrating its potential to deliver accurate and reliable predictions in the field of WT bearing health monitoring.
The proposed model’s robustness is demonstrated by its exceptional performance on a real-world run-to-failure dataset, which inherently encapsulates challenging operating conditions and high variability. This suggests that the method has practical potential; however, it will be crucial to conduct further validation in various turbines and environments in the future.
The proposed method required 244 s for preprocessing and feature extraction, 33 s for training, and only 0.5 s for testing on a standard laptop (Intel Core i7-8550U, 8 GB RAM, no GPU). These results highlight the computational efficiency and indicate that the framework is suitable for real-time or near real-time deployment in turbine health monitoring systems.
Conclusion
Our research findings affirm that the suggested approach is capable of effectively monitor the health status of a high-speed shaft bearing. This serves as a valuable tool for preempting issues and ensuring the smooth operation of the shaft bearing.
The strength of our method lies in its utilization of signal processing techniques, investigating three domains to optimize the feature extraction process. Furthermore, we employ feedforward neural network for categorization, forecasting the health state of the observed bearing. This amalgamation of signal processing and machine learning makes our approach a potent tool in this field.
The efficacy of our novel method was validated through an experimental investigation involving a wind turbine bearing run-to-failure test. When benchmarked against other approaches, our method demonstrated superior performance. The experimental results underscored a significant enhancement in terms of efficiency and accuracy, attesting to the robustness of our approach.
Footnotes
Acknowledgements
Princess Nourah bint Abdulrahman University Researchers Supporting Project number (PNURSP2025R831), Princess Nourah bint Abdulrahman University, Riyadh, Saudi Arabia.
Ethical considerations
Ethical approval was not required for this study.
Consent to participate
Not applicable.
Consent for publication
Not applicable.
Funding
The authors received no financial support for the research, authorship and/or publication of this article.
Declaration of conflicting interests
The authors declared no potential conflicts of interest with respect to the research, authorship, and/or publication of this article.
Data availability statement
The authors thank Green Power Monitoring Systems (GPMS) in the USA for sharing their bearing data.
Trial registration number/date
Not applicable.