
Abstract
To address the issue of low prediction accuracy in neural networks due to limited data for forecasting the low-temperature lifespan of wind turbine stators, this study proposes a multi-optimization model based on Partial Least Squares-Dung Beetle Optimizer-Radial Basis Function (PLS-DBO-RBF) neural network. PLS is used for dimensionality reduction and feature extraction to address overfitting issues in small sample data; RBFNN serves as a nonlinear mapping tool, with its network parameters globally optimized by the DBO algorithm, thereby enhancing model generalization ability. The experiment collected stator insulation aging data after four groups of low-temperature treatments with different cycles, with 12 samples in each group. The monitoring indicators include breakdown voltage, dielectric loss, etc. Under the same training set and test set partitioning, the performance differences between PLS-DBO-RBF and two single models (RBF optimized only by DBO, RBF reduced dimensionally only by PLS) were compared. The results show that the comprehensive optimization method has better accuracy than the single optimization method in predicting stator insulation life under low-temperature conditions, which is confirmed by multiple evaluation indicators.
Keywords
Introduction
The generator is an important part of the power system and is applied to all walks of life. Generators are important tools for social development and people’s normal lives. 1 Stator insulation is a key component for the safe operation of generators. Once it fails, it damages the motor and is difficult to repair. 2 Therefore, it is important to diagnose the insulation state of a large generator stator and accurately predict the life of the generator.
Domestic and foreign scholars have carried out extensive research on the prediction of generator stator insulation life and have proposed a variety of methods. Based on the experimental design method, Lahoud et al. established a theoretical life model of insulation aging of a rotating motor under partial discharge. The effect of each factor on life was analyzed using the Weibull distribution, and it was found that voltage and temperature had the greatest influence and significant interaction. 3 Shi used the Weibull distribution to fit the accelerated life test data of electrical aging and generalized thermal aging of F-grade insulation, and used reliability statistics and nonlinear regression methods to determine the characteristic parameters of its life formula. 4 Sun established a universal mathematical model for predicting the service life of stator winding bars under electrical stress in motors. This model provides methods for evaluating the lifespan through electrical aging tests, electrical breakdown tests, and stepwise breakdown tests. It enables rapid assessment of the electrical lifespan and distribution status of different types of tests. 5
There are many factors affecting the insulation life of motors, which are complex, strongly coupled, and nonlinear. Neural networks have strong nonlinear mapping capabilities and generalization abilities, and have been applied to predict the insulation life of stators, yielding good, and accurate prediction results. Zeng et al. proposed a prediction method based on fruit fly algorithm optimization of BP neural network, and used this method to predict the remaining life of three-phase asynchronous motors. 6 Lai and Guan proposed a predictive model combining dilated convolutional neural networks, bidirectional long short-term memory networks, and attention mechanisms to predict the remaining insulation life of motor windings, and verified it through experiments. 7 Zhan Jianhua optimized the parameters of the RBF neural network model using an improved particle filter algorithm, establishing an optimal contactor remaining life prediction model. 8 Li combined partial least squares with RBF neural networks to establish an improved RBF network model for predicting the breakdown voltage of large motor stator insulation, achieving good prediction results. 9 However, in practical applications of RBF neural networks for motor insulation life prediction, the small amount of data and the selection of network parameters have had some impact on the prediction accuracy.
Partial least squares method is a data analysis technique suitable for datasets with multicollinearity among variables and limited sample sizes. 10 The dung beetle optimization algorithm is an efficient approach for solving global optimization problems, particularly effective for complex nonlinear issues. 11 Therefore, considering the limitations of RBF neural networks, 12 this paper employs partial least squares method to extract key information from small datasets, uses the dung beetle optimization algorithm to optimize parameters within the neural network, and establishes a PLS-DBO-RBF neural network-based predictive model to enhance the accuracy of predicting the lifespan of wind turbine stators under low-temperature conditions.
PLS-DBO-RBF neural network model
Radial basis function neural network
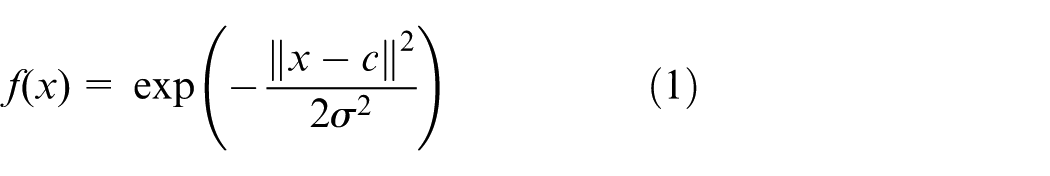
The radial basis function neural network is a three-layer feedforward neural network consisting of an input layer, a hidden layer (radial basis), and an output layer. 13 The input layer receives the original data and transmits them to the hidden layer. The hidden layer contains multiple neurons, and each neuron corresponds to a radial basis function center point. The hidden layer calculates the Euclidean distance between the input data and each center point, and then performs a nonlinear transformation through the radial basis function. The output value of the hidden layer neuron is transmitted to the output layer, and the output layer uses the gradient descent method to weigh and sum these values to obtain the final result. The gradient descent method takes the prediction error as the objective function, and gradually adjusts the weight of the output layer along the negative direction of the objective function gradient until the weight with the smallest error is obtained. The working principle of radial basis function neural network is illustrated in Figure 1.
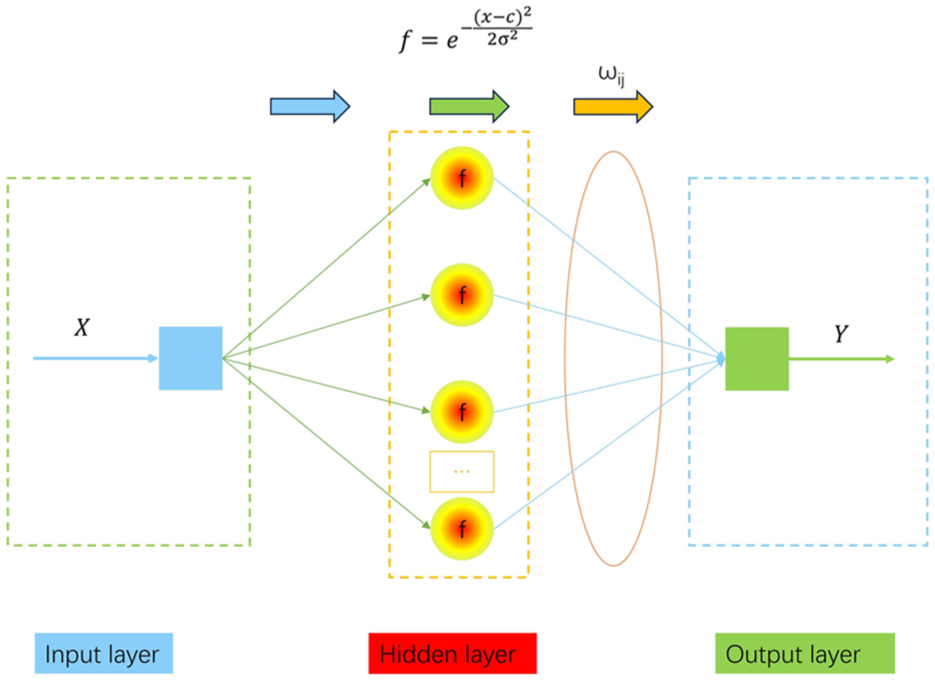
RBF neural network schematic structure.
In the figure,
The parameters of the radial basis function neural network are: the number of hidden layer neurons, width of the radial basis function, and learning rate of weight correction. These parameters have a direct impact on the prediction, though they are typically determined through experiential judgment.
Dung beetle optimization algorithm
The dung beetle optimization algorithm is a swarm intelligence optimization algorithm based on the foraging behavior of dung beetles. The algorithm simulates the multiple behaviors of dung beetles in searching for food and habitat and finds the optimal solution by constantly exploring and utilizing environmental information. 15 Different proportions of multiple behaviors were allocated to achieve a balance between global and local exploration. The dung beetle optimization algorithm first defines the solution space and initializes the number, position, and behavior ratio of the dung beetles in the solution space. Each dung beetle corresponds to a feasible solution, and its fitness is determined according to the fitness function. Dung beetles roll balls, lay eggs, eat, and steal until termination conditions are met. 16 These four behaviors are expressed in terms of (2), (3), (4), and (5).

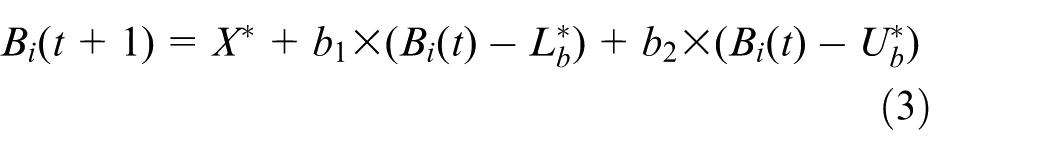
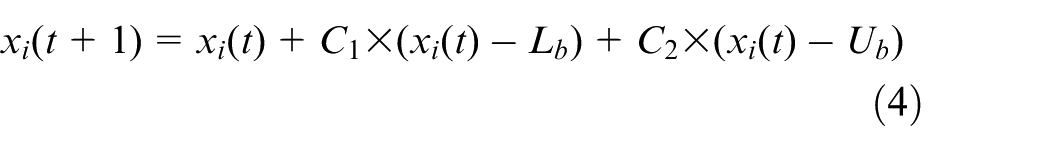

Where
Partial least squares method
The partial least squares regression method is a multivariate statistical data analysis method that combines the characteristics of principal component analysis, canonical correlation analysis and multiple linear regression. 17 It can deal with the regression modeling problem of multiple dependent variables to multiple independent variables simultaneously. It is especially suitable for cases where there is multiple collinearity between variables, and the sample size is small. The steps are as follows:
Extracting ingredients
Let the independent variable be
a) t1 and
b) the correlation between
Establish the model
The regression of


Extraction of residual components
The above steps are repeated with


Least squares regression equation
Assuming that the absolute value of the residual matrix is approximately zero after extracting the


By taking all the extracted components of

After four steps, the partial least squares method completes the extraction of key information. At present, the partial least squares method has been proposed in a variety of update forms. 18 In this study, the most suitable nonlinear iterative algorithm for a computer was adopted and K-fold cross-validation was added to optimize the number of principal components. The K-fold cross-validation method divides the data into K subsets, performs the combined verification of K-1 training set / 1 test set, and uses the mean RMSE of K verifications as the evaluation standard. The number of components with the smallest error in the cross-validation method is selected.
PLS-DBO-RBF neural network prediction model
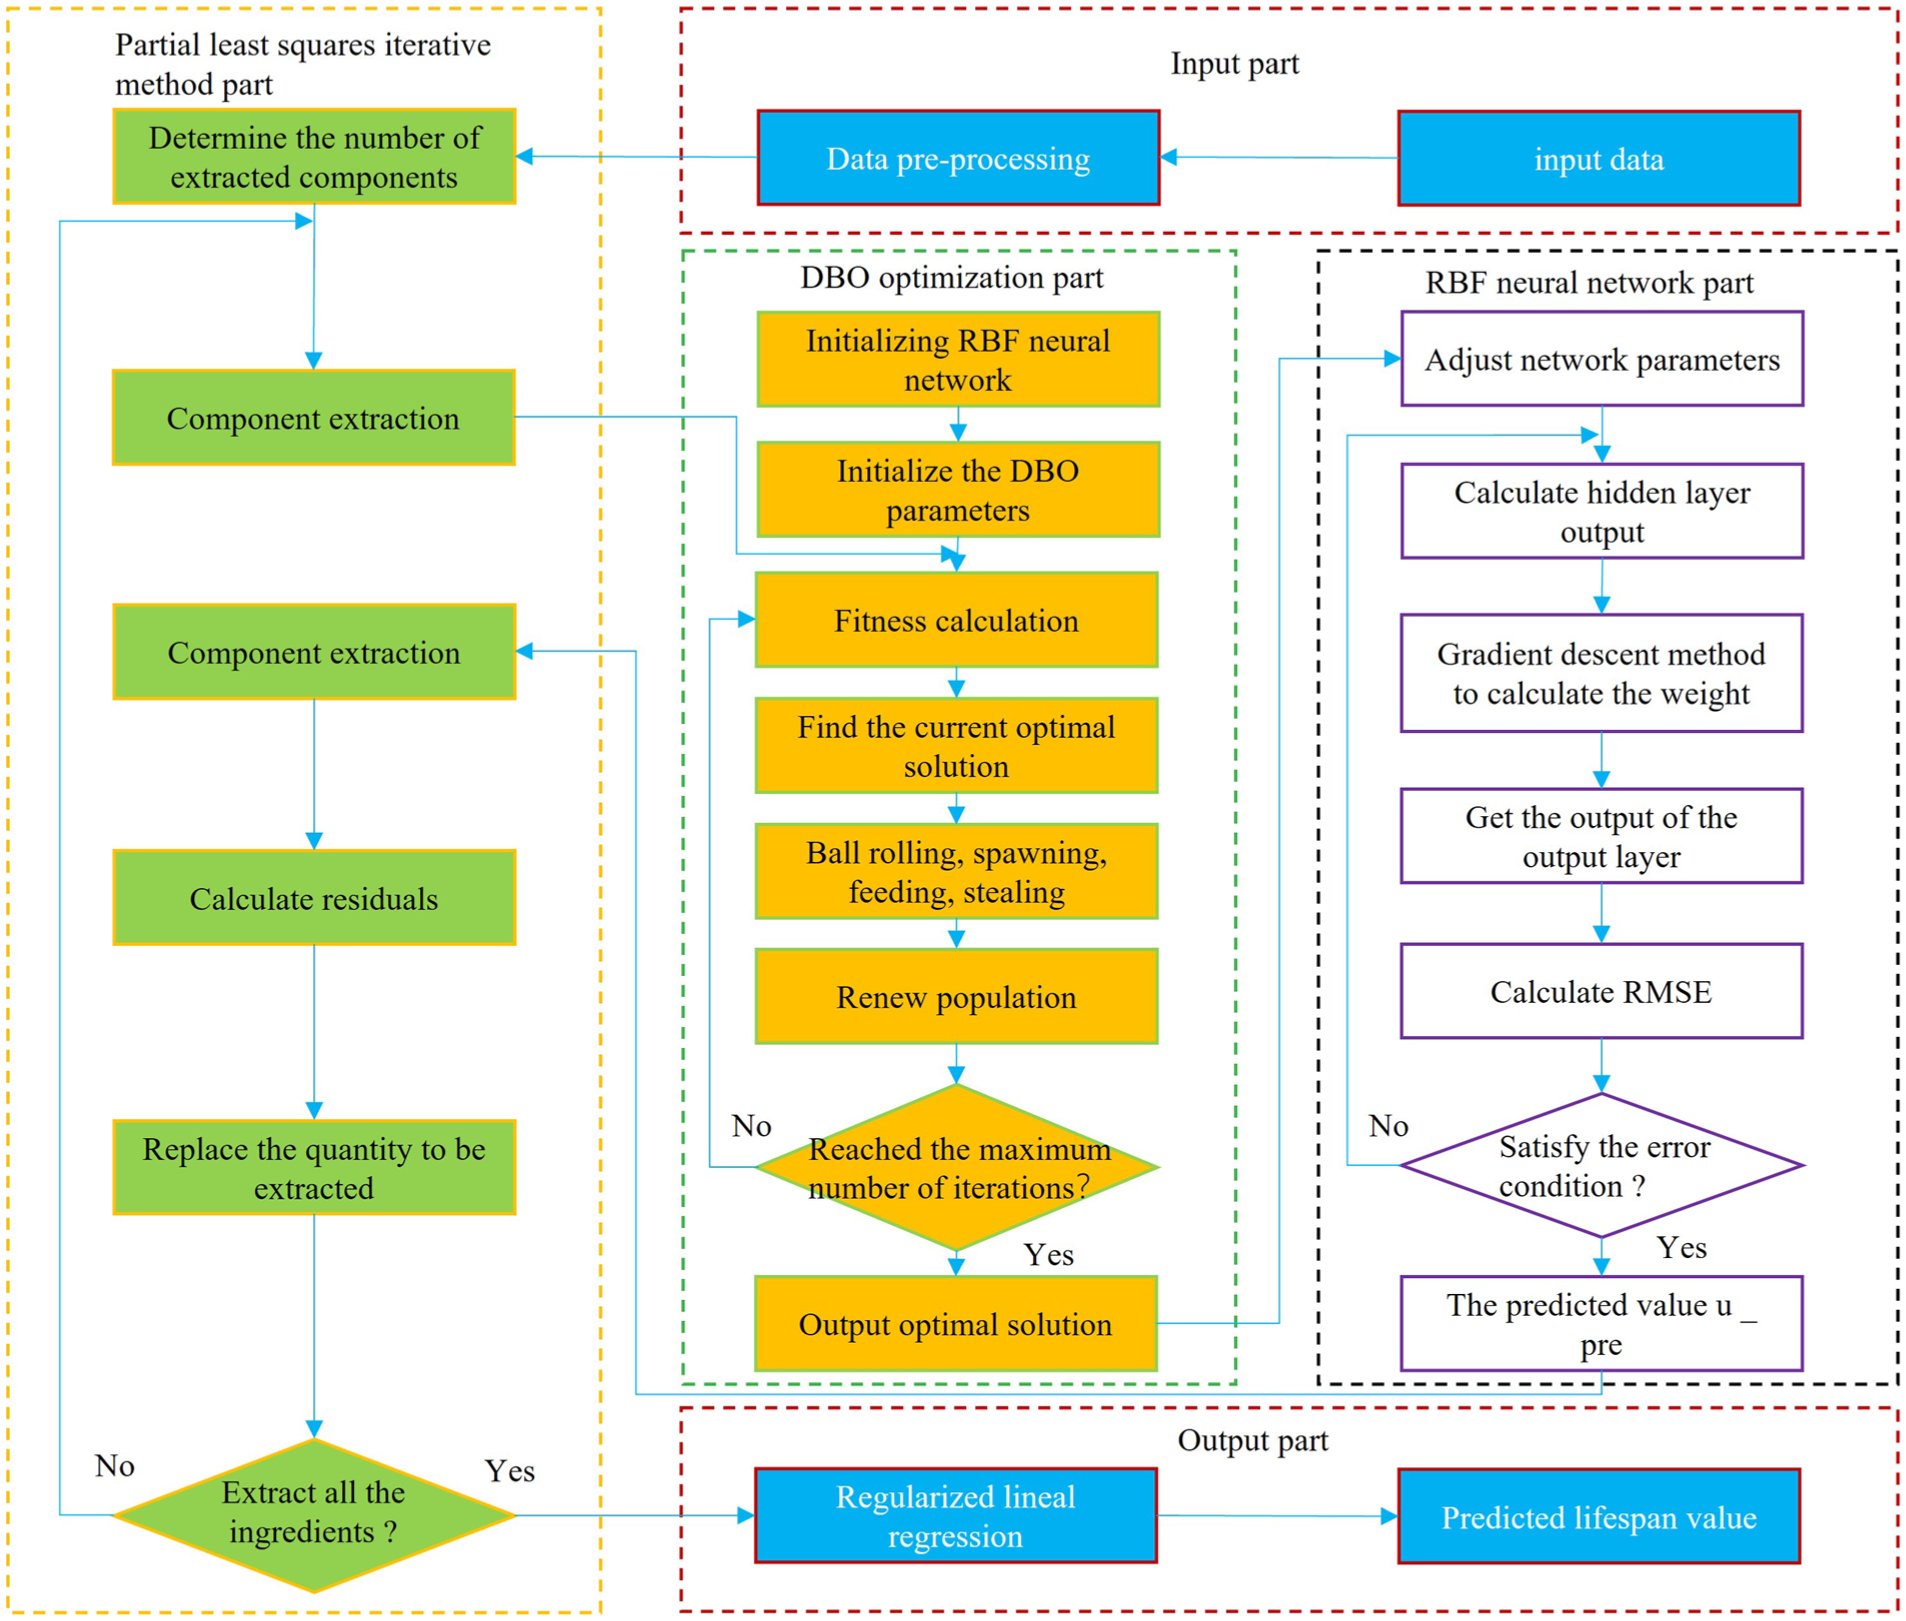
The PLS-DBO-RBF neural network is a radial basis function network that combines the partial least squares method and dung beetle optimization algorithm. First, the key components of the input data were extracted using PLS dimensionality reduction. Then, the DBO algorithm is used to synchronously optimize the three parameters of the hidden layer nodes; the width of the basis function, the weight learning rate of the RBF network, and the collaborative optimization of features and parameters is realized by double optimization. Figure 2 shows the complete flow chart of the PLS-DBO-RBF neural network prediction model. The prediction process of the PLS-DBO-RBF neural network is as follows:
(1) To determine the number of extracted components, the K-fold cross-validation method was employed to compute the neural network prediction error for each candidate component count, and the number of components yielding the minimal error was selected.
(2) Based on the input data, the empirical formula initializes the neuron counts in the input, hidden, and output layers of the RBF neural network, and further determines the optimization range, population size, and iteration number for the DBO algorithm.
(3) Compute the feature and result data components using the partial least squares iterative formula.
(4) Initialize the DBO algorithm population and evaluate the fitness of each individual in the current population. The fitness of the dung beetle is determined by a fitness function, which selects the mean square error between the predicted and actual values of the neural network.
(5) Identify the dung beetle individual exhibiting the highest fitness within the current population.
(6) The dung beetle population performs ball-rolling, spawning, feeding, stealing, and position-updating behaviors.
(7) Determine whether the iteration limit is reached. Otherwise, return to step (4); otherwise, output the highest-fitness dung beetle individual as the optimal solution.
(8) The hidden layer neuron count, radial basis function width, and gradient descent learning rate of the RBF neural network are adaptively adjusted based on the obtained optimal solution.
(9) Compute the centroid of each hidden layer node and, then derive the hidden layer outputs through a radial basis function transformation.
(10) Apply gradient descent to optimize the hidden layer weights and, subsequently calculate the response of output layer.
(11) The-root-mean-square error between the predicted and actual values was evaluated. If the error threshold is not met, revert to step (9); otherwise, terminate with the final prediction output.
(12) The extracted dataset is updated using output predictions computed via a partial least-squares iterative formulation.
(13) Verify the component extraction completion status. If incomplete, revert to step (3); otherwise, compute the final prediction through regularized linear regression by the weighted summation of all components.
PLS-DBO-RBF neural network prediction mode.
Establishment of low temperature life prediction model of wind turbine stator based on PLS-DBO-RBF neural network
Characteristic parameters of stator insulation life prediction
In the field of life prediction of stator insulation systems, an evaluation method based on non-destructive parameters has become a research hotspot. 19 The non-destructive characteristic parameters commonly used in existing stator insulation life prediction methods are: insulation resistance, dielectric loss, dielectric loss increment, partial discharge, warpage, and power frequency partial discharge. 20
According to the existing prediction methods and the characteristics of the wind turbine stator, a low-temperature aging test for the wind turbine stator is designed, and the upper layer insulation resistance (
The test data originates from the “Low-Temperature Performance Testing and Failure Prediction of Wind Power Stator Insulation System” project at Harbin University of Science and Technology. The test samples consist of 48 stator insulation bars of H-grade temperature resistance from the same batch. These samples undergo cyclic low-temperature testing, with each cycle lasting 168 hours. All samples are divided into four groups: the first group undergoes one aging cycle, the second group increases to two cycles, and so on. After low-temperature treatment, the stator insulation bars are subjected to aging tests, and relevant parameters are recorded.
In neural network prediction, it is necessary to standardize the original data to eliminate the dimensional effect and ensure that different data parameters have the same influence. This study used the Z-score method to standardize the data. The Z-score converts the original data into a distribution with a mean of 0 and a standard deviation of 1. 21 The core formula is (13):
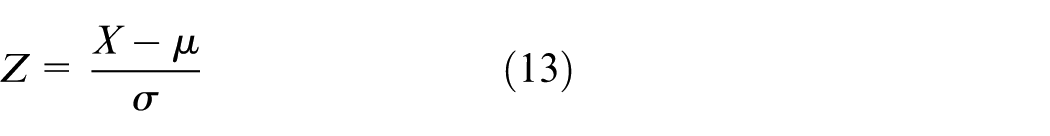
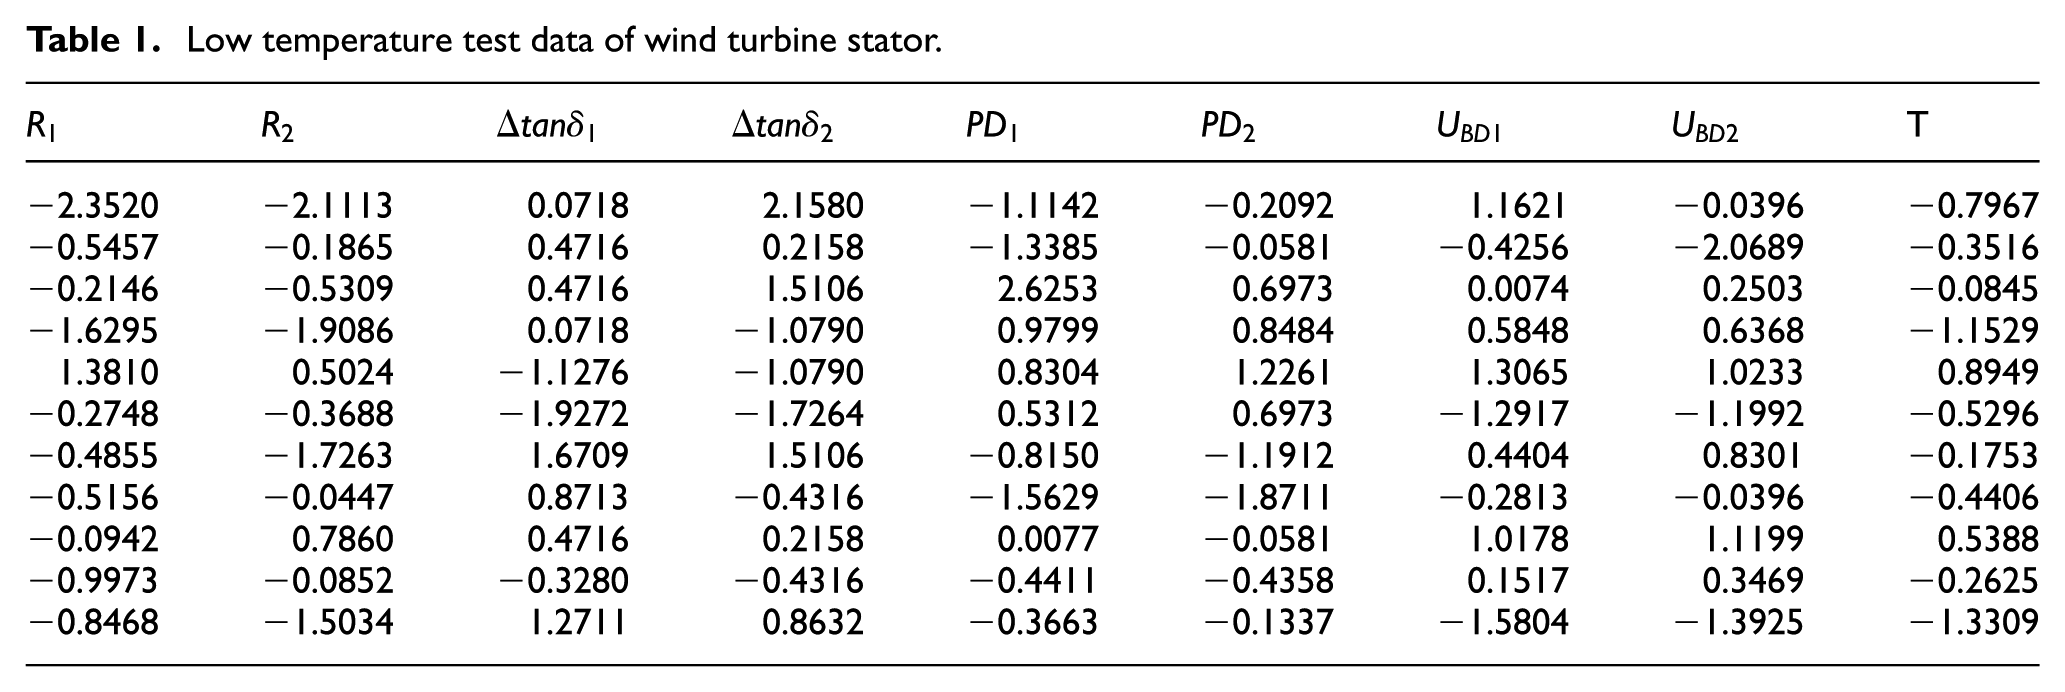
Some of the standardized data are shown in Table 1:
Low temperature test data of wind turbine stator.
The number of components extracted by partial least squares method
In partial least squares modeling, the selection of the number of components directly affects the performance of the model. This model used the K-fold cross-validation method (
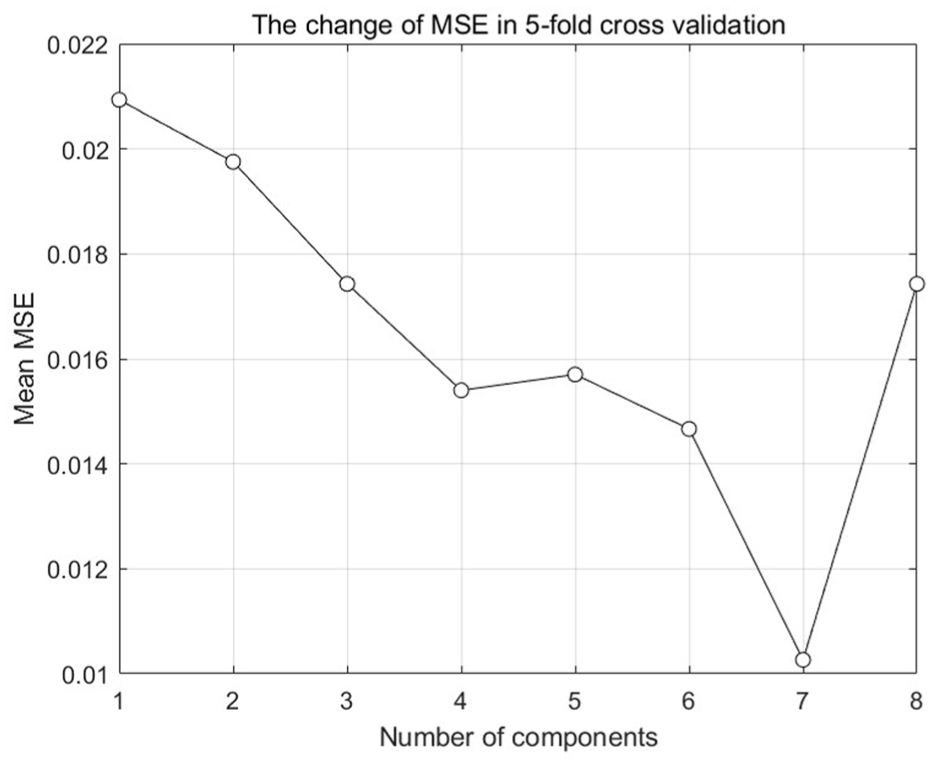
The change of MSE with the number of principal components in 5-fold cross validation.
Radial basis neural network parameter initialization
After applying the formula to extract the components of the aging characteristic parameters and life data, a radial basis neural network was used to establish the mapping relationship between the two. The network uses a radial basis function to map low-dimensional aging features into a high-dimensional space to achieve complex pattern separation. The hidden layer nodes are activated according to the distance between the input and center point to form local response characteristics, and the output layer completes the life prediction by a weighted combination of these responses. The output layer weight is optimized using the gradient descent method, and its learning rate directly regulates the weight update step size.
According to the experimental data and the relevant empirical formula of the radial basis function, the number of input layer neurons of the radial basis function is 1, the number of hidden layer neurons is 10, and the number of output layer neurons is 1, forming a radial neural network of 1-10-1. The width of the radial basis function was set to 0.5, and the learning rate of the gradient descent method was set to 0.01.
Parameter determination of DBO-RBF neural network
The mapping effect of the RBF neural network is significantly affected by the number of hidden layer neurons, width of the radial basis function, and learning rate. 23 The dung beetle optimization algorithm was used to dynamically optimize these key parameters to improve the performance of the model.
The dung beetle optimization algorithm first determines the number of dung beetle populations and iterations. According to the classification characteristics of the algorithm, the population size N can only take integer multiples of 30. By testing population sizes of 30, 60, and 90 respectively, the population size is determined to be 30. The iteration number T is selected within the range of [10, 40]. The results indicate that when the iteration number is less than 15, the prediction error is relatively large; when the iteration number is between 15 and 21, the error gradually decreases; and when the iteration number continues to increase, the computation time increases significantly. Therefore, the iteration number is determined to be 20.
The range of optimization was determined according to the parameters initialized by the RBF network. The range of the number of hidden layer neurons (
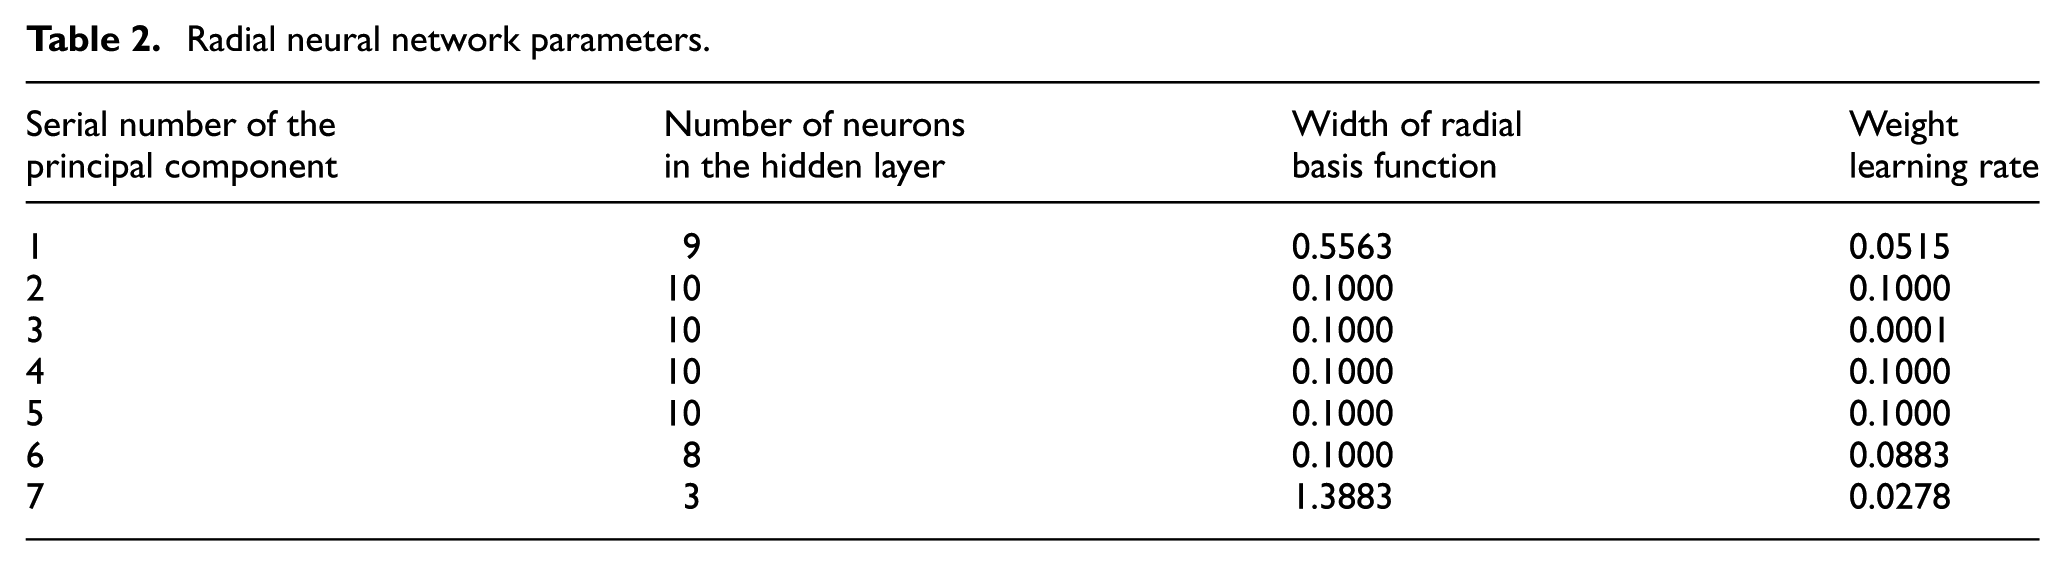
Next, the parameters within the testing range are evaluated, with the root mean square error (RMSE) of the neural network prediction results serving as the parameter assessment criterion. The minimum RMSE value is identified, and the corresponding parameters are determined as the optimal parameters. Finally, the parameters of the neural network for 7 component extractions were determined as shown in Table 2.
Radial neural network parameters.
Evaluation index of prediction model
The evaluation index is a standardized measurement tool used to quantify the performance of the model, and reflects the difference between the predicted results and the real situation through objective values. Three evaluation indices were used in this study, the mean absolute error (MAE), root mean square error (RMSE), and coefficient of determination (R2). The calculation methods are shown in equations (14)–(16).
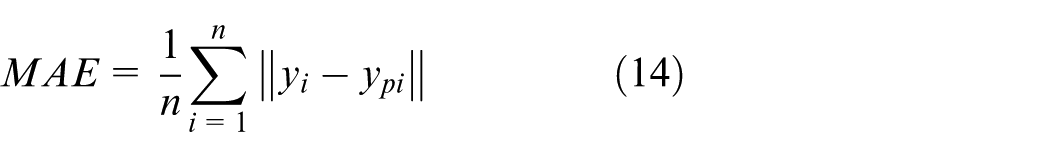
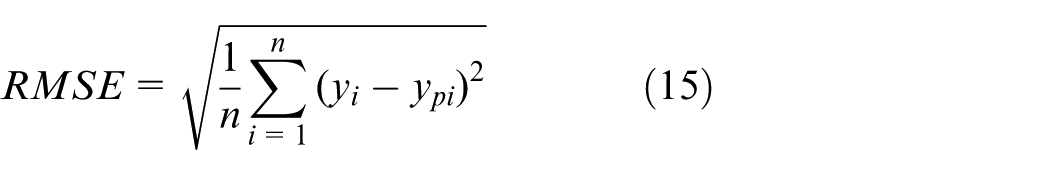
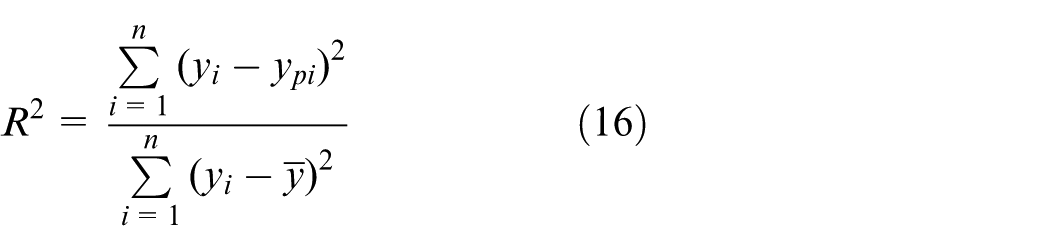
Where
Schematic diagram of the overall model prediction process
The construction of the low-temperature life prediction model for wind power stator based on the PLS-DBO-RBF neural network has been accomplished. The flowchart of low-temperature wind power stator life prediction model based on PLS-DBO-RBF is presented in Figure 4.
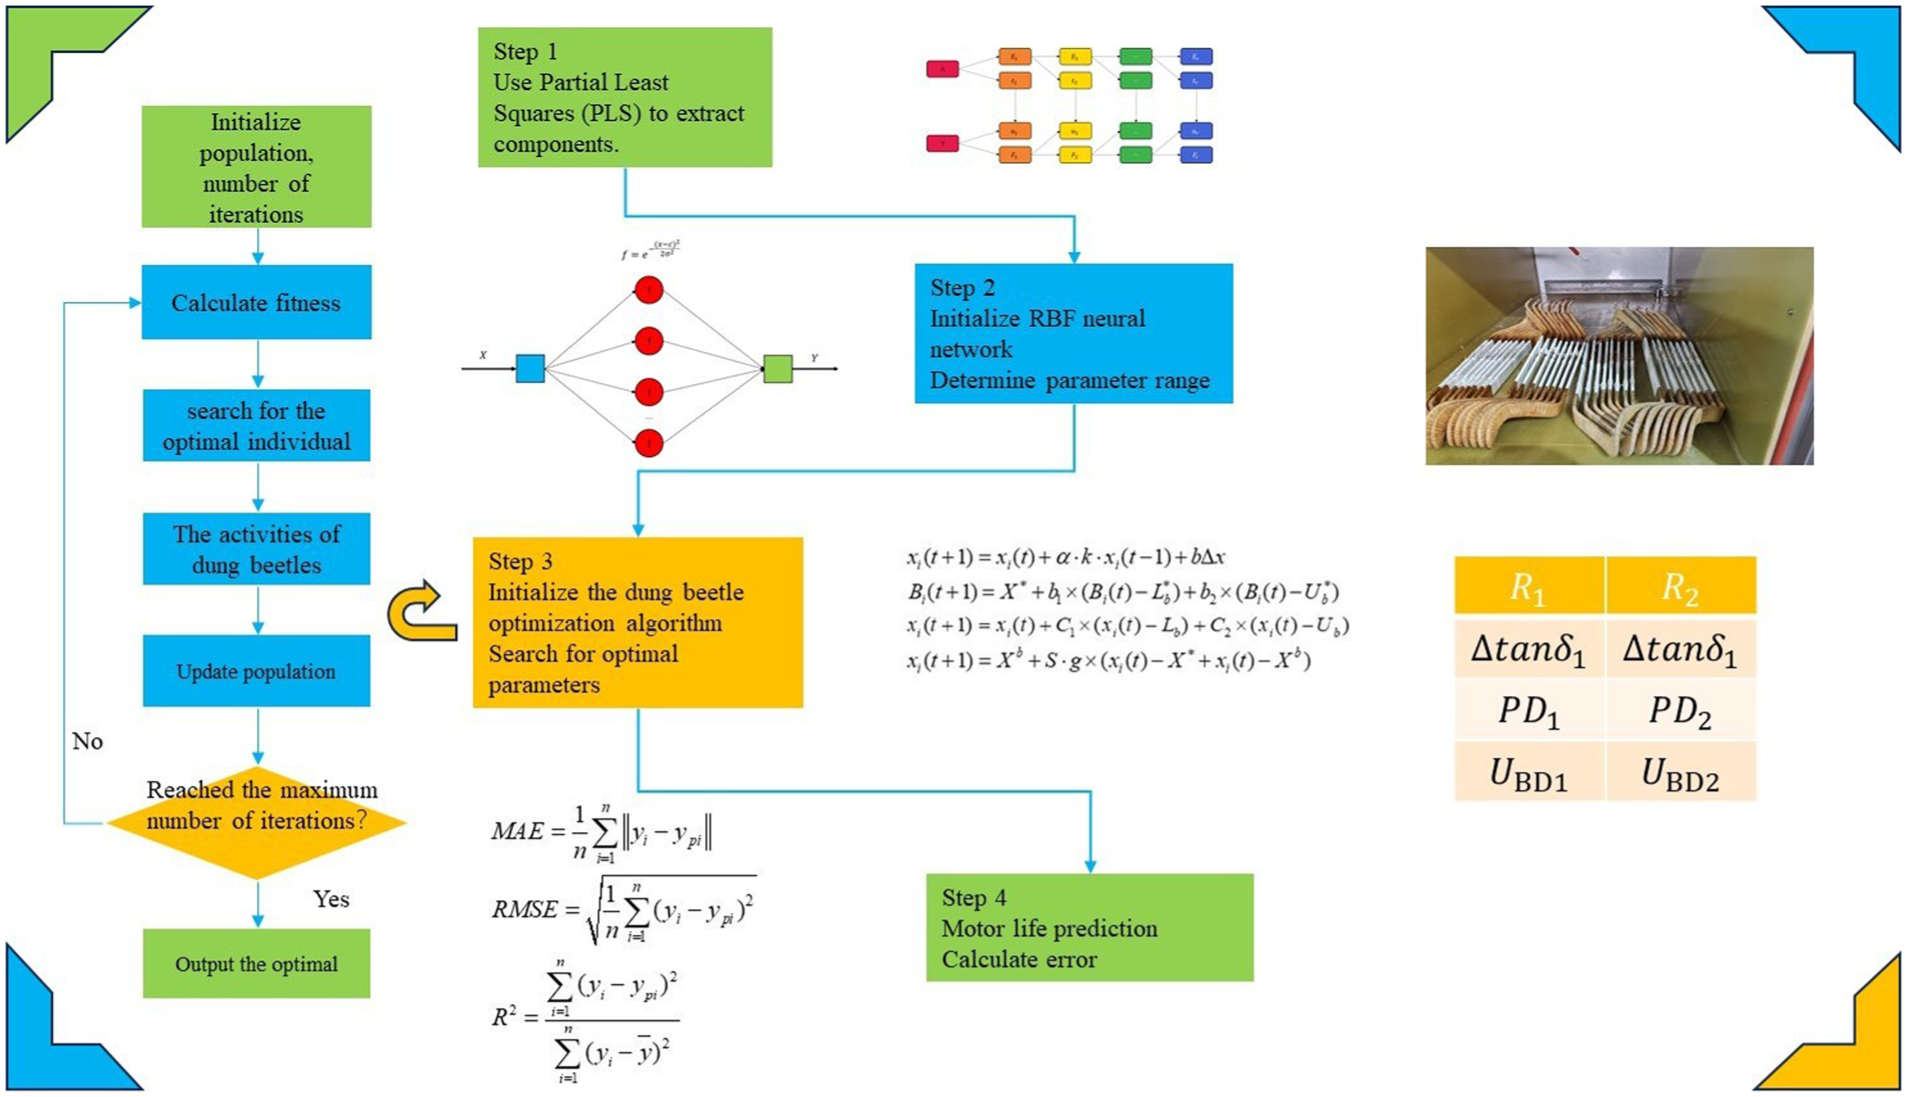
Flowchart of low-temperature wind power stator life prediction model based on PLS-DBO-RBF.
Model prediction results and analysis
Model prediction results
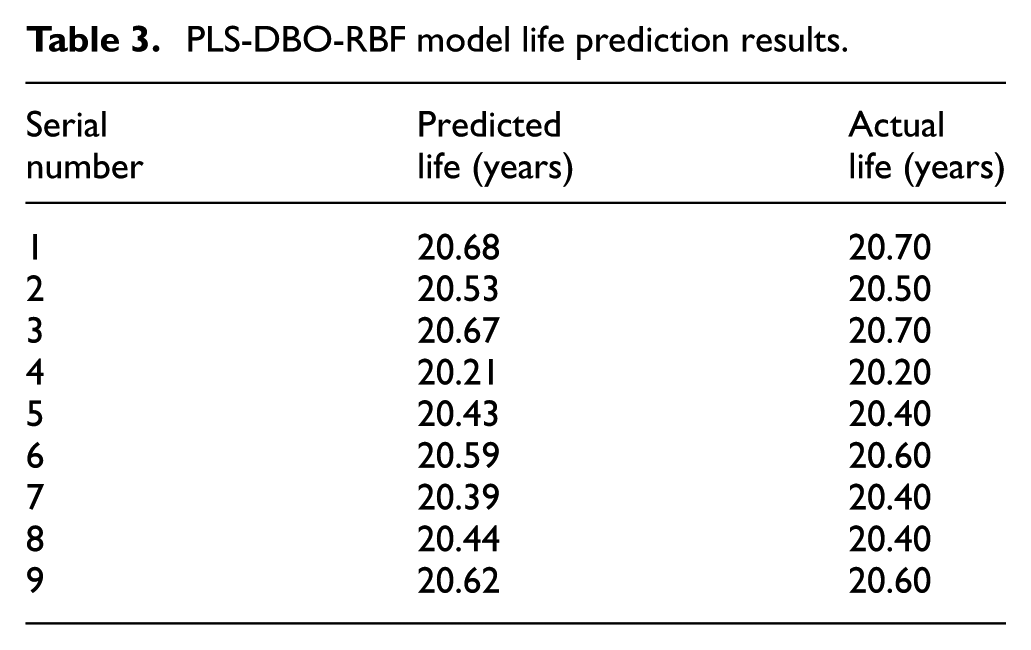
To quantitatively evaluate the prediction accuracy of the PLS-DBO-RBF model and facilitate subsequent comparative analysis, the trained model was employed to predict the remaining life of nine independent test samples that were excluded from the training dataset. The predicted results were systematically compared with the actual measured values, as presented in Table 3.
PLS-DBO-RBF model life prediction results.
Comparison of model predictions
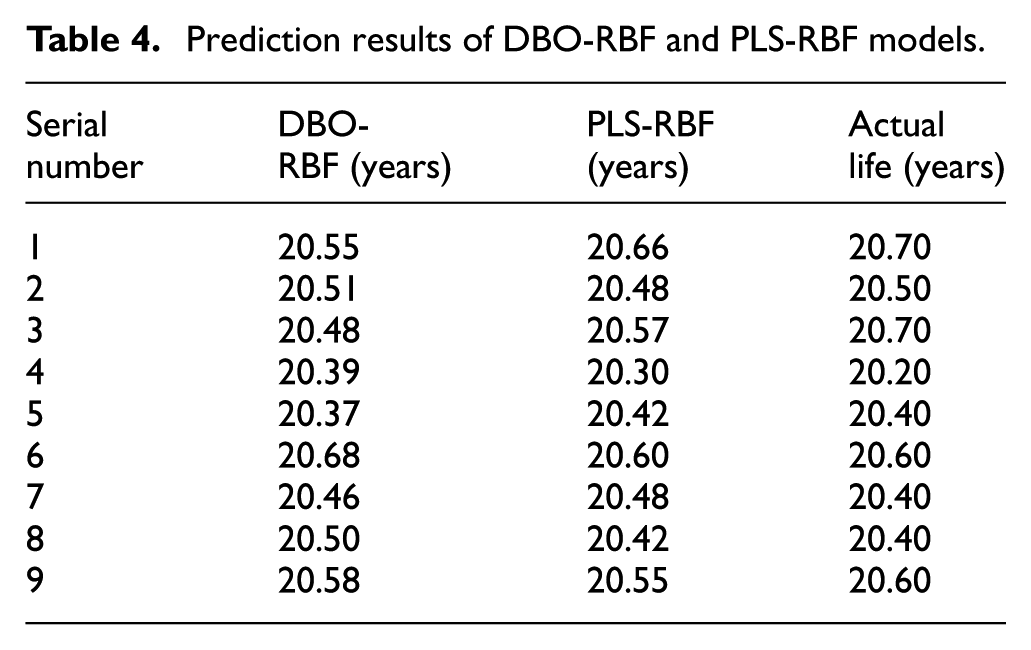
To verify the effectiveness of the optimization model, the DBO-RBF neural network model with only the dung beetle optimization algorithm and the PLS-RBF neural network model with only the partial least squares method were used for training. Then, the same nine samples were used for life prediction, and the prediction results shown in Table 4.
Prediction results of DBO-RBF and PLS-RBF models.
Furthermore, combined with the prediction results of the three models, the images of the prediction results of the three models are shown in Figure 5.
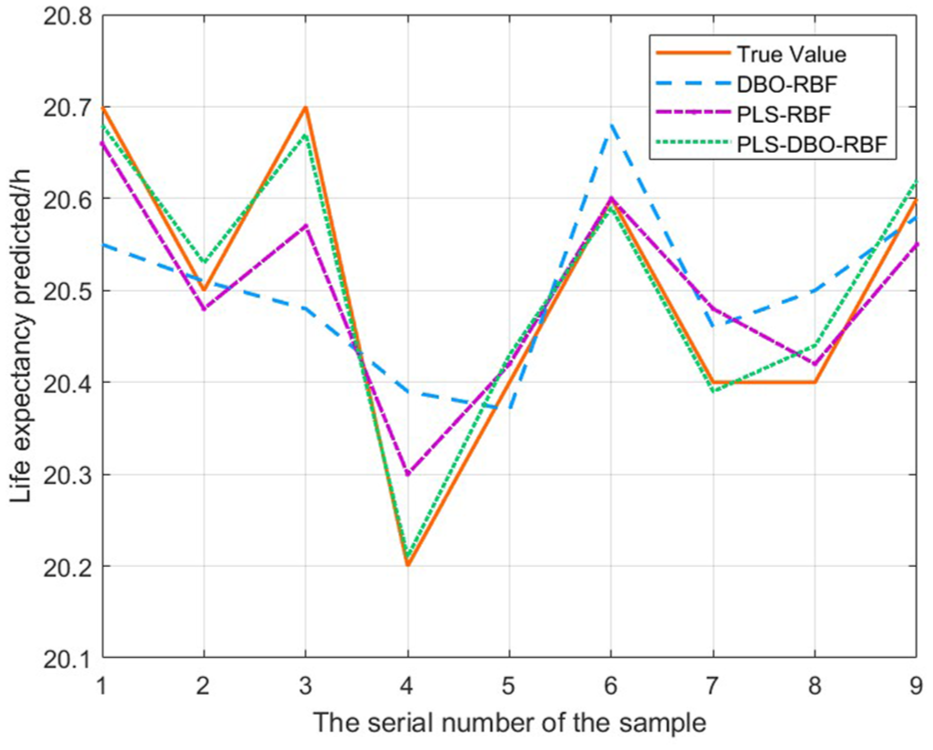
Comparison of model prediction results.
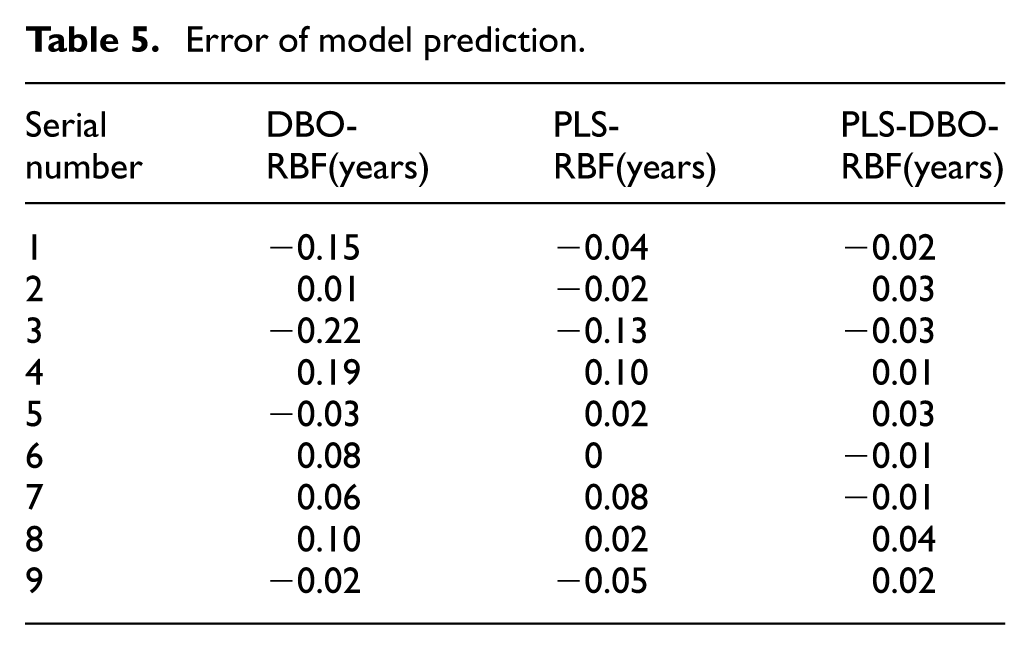
The error values (predicted value-actual value) of the three models for sample prediction are calculated, and Table 5 is obtained. The error images of the three models are presented in Table 3 and shown in Figure 6.
Error of model prediction.
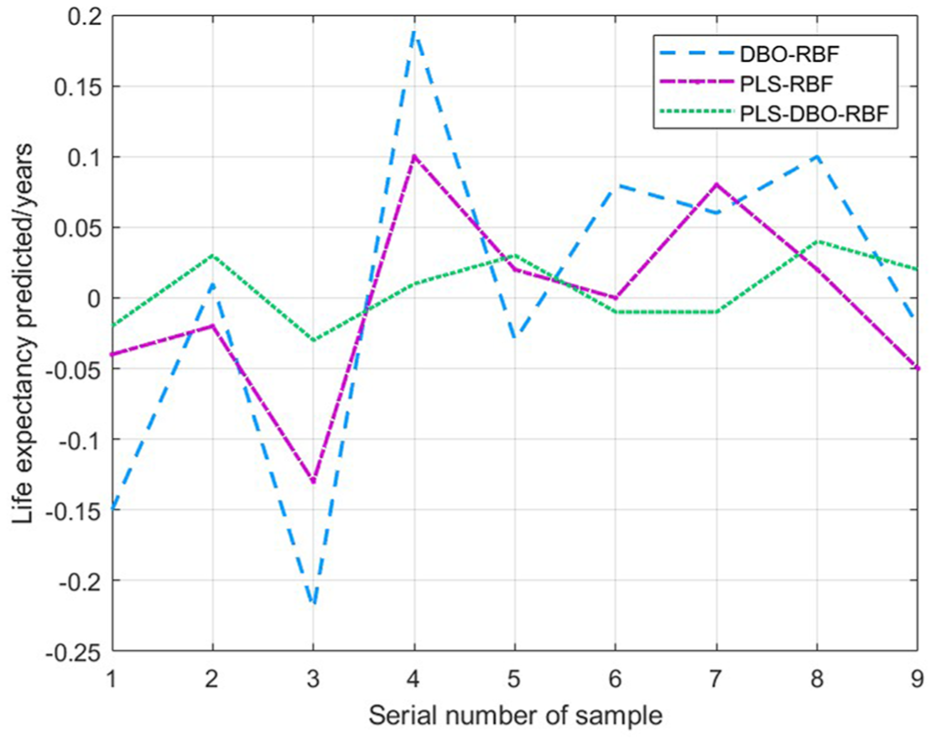
Comparison of model prediction errors.
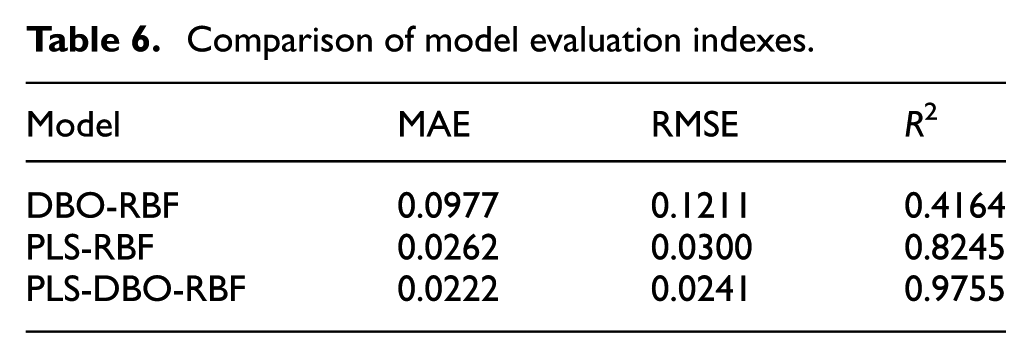
The RMSE, MAE, and R2 values were used to evaluate the predictive ability of the three models. Table 6 presents the comparison results of the evaluation indices.
Comparison of model evaluation indexes.
Analysis of prediction results
According to Figure 4, the prediction trends of the PLS-RBF and PLS-DBO-RBF models were basically the same. Table 5 shows that the DBO-RBF model performs best on sample 2, the PLS-RBF model has the smallest prediction error for samples 5,6, and 8, and the PLS-DBO-RBF model has the highest accuracy for samples 1,3,4, and 7; for sample 9, the error values of the DBO-RBF and PLS-DBO-RBF models are the same.
Figure 5 shows that although the DBO-RBF model has a small error in individual samples, the overall prediction stability is poor, and the overall accuracy of the PLS-RBF model decreases owing to severe error fluctuations. By contrast, the PLS-DBO-RBF model has the advantages of low error and stability. The indicators in Table 6 were further verified: the MAE (0.0222) and RMSE (0.0241) of PLS-DBO-RBF were better than those of the other models, and its R2 (0.9755) was significantly higher than that of DBO-RBF (0.4164) and PLS-RBF (0.8245).
Conclusion
This study proposes a hybrid PLS-DBO-RBF neural network model for the life prediction of wind turbine stator insulation systems. An accelerated aging test of a wind turbine stator insulation system was designed, and the test data were used to train and validate the model. For comparison, single-optimized DBO-RBF and PLS-RBF models were also evaluated, leading to the following conclusions:
(1) The dung beetle optimization (DBO) algorithm was employed to optimize the parameters of the radial basis neural network and determine the optimal values for the number of hidden layer neurons, radial basis function width, and learning rate. This approach overcomes the limitations of the traditional empirical parameter selection.
(2) The partial least squares (PLS) method extracts key components from experimental data and identifies highly correlated composite variables from high-dimensional datasets. This effectively addresses issues of multicollinearity and the limited sample size in the test data.
(3) For low-temperature wind turbine stator life insulation system prediction, the PLS-DBO-RBF model demonstrates a smaller overall error and lower fluctuation than the single-optimized DBO-RBF and PLS-RBF models. Specifically, it achieves a mean absolute error of 0.0222, root mean square error of 0.0241, and coefficient of determination of 0.9755, indicating a higher prediction accuracy and reliable performance in estimating the lifespan of wind turbine stator insulation systems under low-temperature conditions.
However, this model has limitations that require further improvement. Because training only considers electrical aging effects, while actual stator insulation system operation involves complex factors such as thermal aging and site defects, future work should expand the experimental data to enable more comprehensive low-temperature lifespan prediction.
Footnotes
Ethical considerations
This study does not involve any ethical issues and did not require ethical approval.
Consent to participate
This study does not involve any patient data, and therefore consent to participate is not applicable.
Consent for publication
This study does not involve any patient data, and therefore consent for publication is not applicable.
Author contributions
Haitao Hu: Conceptualization (equal); Project administration (equal); Funding Acquisition (equal). Peiye Lang: Methodology (equal); Writing Original Draft (equal); Formal Analysis (equal); Visualization (equal).Yanli Liu: Validation (equal); Investigation (equal); Software (equal). Ji Liu: Resources (equal); Data Curation (equal). Junguo Gao: Writing—Review & Editing (equal); Supervision (equal).
Funding
The authors disclosed receipt of the following financial support for the research, authorship, and/or publication of this article: The study was supported by the National Key Laboratory of Electromagnetic Energy (grant number: 6142217210206) and partially supported by “Tao Du Talent” Science and Technology Innovation and Entrepreneurship Talent Team Project in Yixing City (grant number: CX202104C). This work was carried out under research program “Low temperature resistance performance test analysis and failure prediction of wind turbine stator insulation system” of Harbin University of Science and Technology.
Declaration of conflicting interests
The authors declared no potential conflicts of interest with respect to the research, authorship, and/or publication of this article.
Data availability statement
The data that support the findings of this study are available from the corresponding author upon reasonable request.
Trial registration number/date
This study does not involve any clinical trial, and therefore trial registration is not applicable.