
Abstract
Considering the characteristics of an E-Booster, such as its short working time and sealed internal components, a multi-domain feature fusion method was proposed to diagnose the fault of E-Booster by analyzing the vibration signal. The root mean square(RMS), crest factor and kurtosis of the vibration signal were extracted as time domain features. Using short-time Fourier transform (STFT), the vibration signal was transformed into frequency-domain. The maximum energy in the spectrogram and the extremum of energy ridge were extracted as frequency-domain features. The vibration signal was resampled with equal angles, and the resampled signal was transformed by Fourier transform to obtain the order spectrum, and the order information was extracted by segmenting and taking the extreme values, serving as angular-domain features; then, kernel principal component analysis (KPCA) was used to fuse multi-domain features; finally, the support vector machine (SVM) and eXtreme Gradient Boosting(XGBoost) were used to classify the multi-domain feature fusion information of the samples. Experimental verification shows that the fault diagnosis accuracy rate under multi-domain feature fusion information is 99.04%. Results shows that multi-domain feature fusion information is better than that of single-domain feature information and multi-domain feature information on the fault diagnosis accuracy rate, and can effectively detect the E-Booster transmission faults online.
Keywords
Introduction
Amidst the shift toward intelligent and electric vehicle development, automotive braking systems are increasingly adopting Electro-Hydraulic Braking (EHB). Consequently, traditional vacuum boosters are being replaced by electric brake boosters (E-Boosters) as the core power-assist component.1,2
The electric power-assist device comprises a brushless DC motor, a single-stage gear, a ball screw transmission mechanism, a pedal travel sensor, and an electronic control unit (ECU), as illustrated in Figure 1. When the brake pedal is pressed, the sensor detects pedal displacement and transmits this signal to the ECU. The ECU subsequently sends commands to the motor, which drives the gear assembly to actuate the ball screw and generate braking force. Gear defects such as tooth fracture or wear induce disturbances at meshing frequencies, resulting in abnormal vibration and noise.
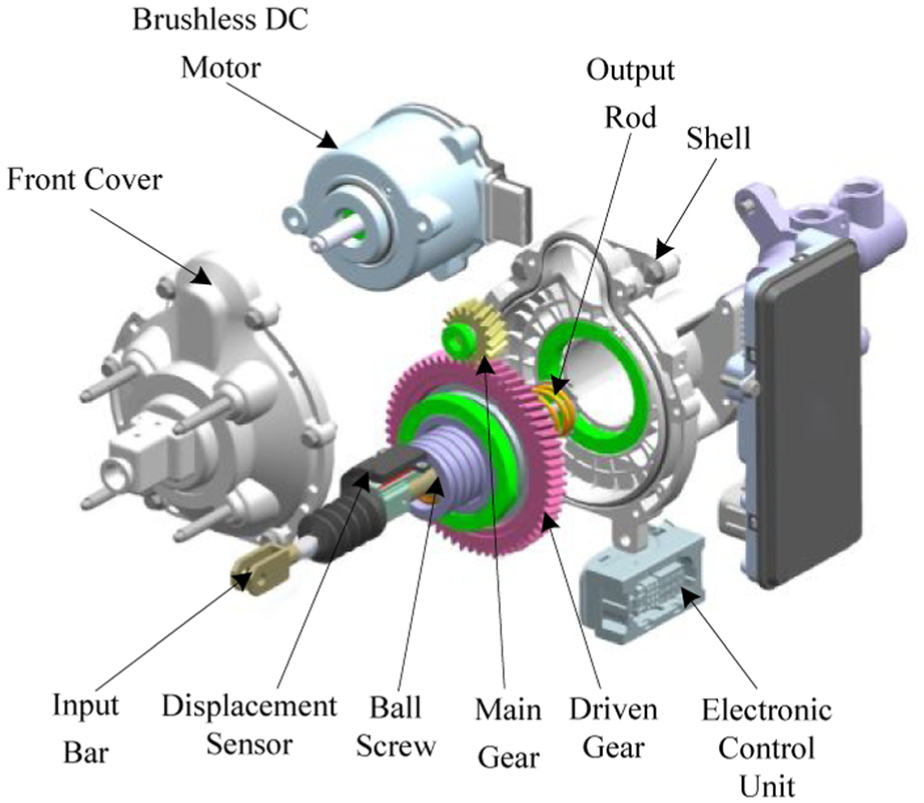
The structural diagram of the electric power-assist device.
Currently, transmission faults in domestically manufactured E-Boosters are primarily identified through manual auditory inspections by technicians or offline acoustic testing in anechoic chambers. These methods lack efficiency, objectivity, and scalability, compromising end-of-line quality assurance. As the critical power source for electro-hydraulic braking systems, E-Booster reliability directly impacts driver safety and property protection. Consequently, implementing 100% online fault diagnostics during final assembly - prior to factory release - is imperative to prevent safety hazards and property losses. However, most current studies on partial domain fault diagnosis3–6 focus exclusively on single-source to single-target domain scenarios. To address category distribution shifts in cross-domain applications, Feng et al. 7 proposed a global-local multi-source domain adaptation framework. Separately, Li and Yu 8 designed a feature selection module that identifies transferable features from both global and local representations across source domains, aiming to eliminate negative transfer caused by irrelevant information while mitigating partial domain-induced transfer interference.
Advances in vibration signal processing have driven the increasing adoption of vibration-based analysis for fault diagnosis across diverse engineering fields, including aero-engines, 9 cable-stayed bridges, 10 and engineering structures. 11 However, extending these methods to sealed electromechanical systems like E-Boosters faces two fundamental limitations: (1) Encapsulation prevents tachometer installation, eliminating conventional order tracking due to signal acquisition constraints; (2) Transient dynamics from ultra-short operational windows (<10% of standard bearing test cycles) violate the stationarity assumptions underpinning Fourier-based analysis. To overcome these constraints, we propose a multi-domain feature fusion framework that reconstructs angular signals via displacement-guided resampling while integrating time-frequency-order features to characterize transient fault signatures.
Venkata and Rao proposed an SVM-based vibration classification method for flow control valve fault diagnosis. 12 Zhang et al. developed a probabilistic neural network (PNN) approach for vehicle gearbox fault diagnosis using frequency-domain features from gear vibration signals. 13 To address weak early-fault signals with obscure features in high-noise environments, Cao et al. employed an improved wavelet threshold function for denoising, successfully extracting rolling bearing characteristic frequencies. 14 Concurrently, Gao et al. introduced a time-frequency squeezing method for rotation frequency calculation, enabling bearing fault diagnosis through time-frequency compression and order resampling, 15 while Wang and Chu established a diagnostic approach via fault characteristic order (FCO) index demodulation and stepwise resampling in the fault phase angle (FPA) domain. 16 Wang et al. 17 developed the LFIgram method, constructing Log Envelope Auto-correlation Bispectrum (LEAB) slices and the LEAB Feature Index (LFI) to achieve precise compound fault identification in rolling bearings. Complementarily, Liu et al. 18 proposed ISEANet – an Interpretable Subdomain Enhanced Adaptive Network – which improves cross-domain bearing diagnosis under noise-shift conditions through: sparse spectral noise reduction (SSNR), local multi-feature extraction modules (LMFEMod), and an information-theoretic discrepancy metric (ILMMD), demonstrating superior transfer learning performance.
Unlike conventional rotational or linear-motion components (e.g. engines, 9 bearings, 19 motors 20 ) that permit continuous vibration signal acquisition across speeds with favorable SNR—enabling single-domain fault diagnosis—the E-Booster presents unique challenges. During braking, it converts rotational to linear motion via a ball screw for force output, but its limited stroke restricts operation to transient cycles, preventing extended vibration monitoring. Concurrently, hybrid rotational-linear motion causes fault information overlap, rendering single-domain features inadequate for comprehensive condition assessment. To address this, we extract time-domain features, time-frequency features, and order-domain features to form an eight-dimensional feature vector. Kernel PCA fuses these into a four-dimensional representation, enabling effective binary classification of component health (normal vs faulty) via SVM and XGBoost classifiers.
Vibration signal acquisition
Given the E-Booster’s gear-rolling bearing transmission architecture, a box measurement approach is employed to effectively identify transmission mechanism faults. To preserve clamping integrity while enabling rapid sensor deployment, the test fixture utilizes a slide table cylinder (8) to position the vibration testing assembly, with a test cylinder (9) driving the vibration sensor (10) into contact with the E-Booster casing surface. 21 This non-invasive configuration ensures unimpeded brake function while securing measurement stability, as illustrated in Figure 2.
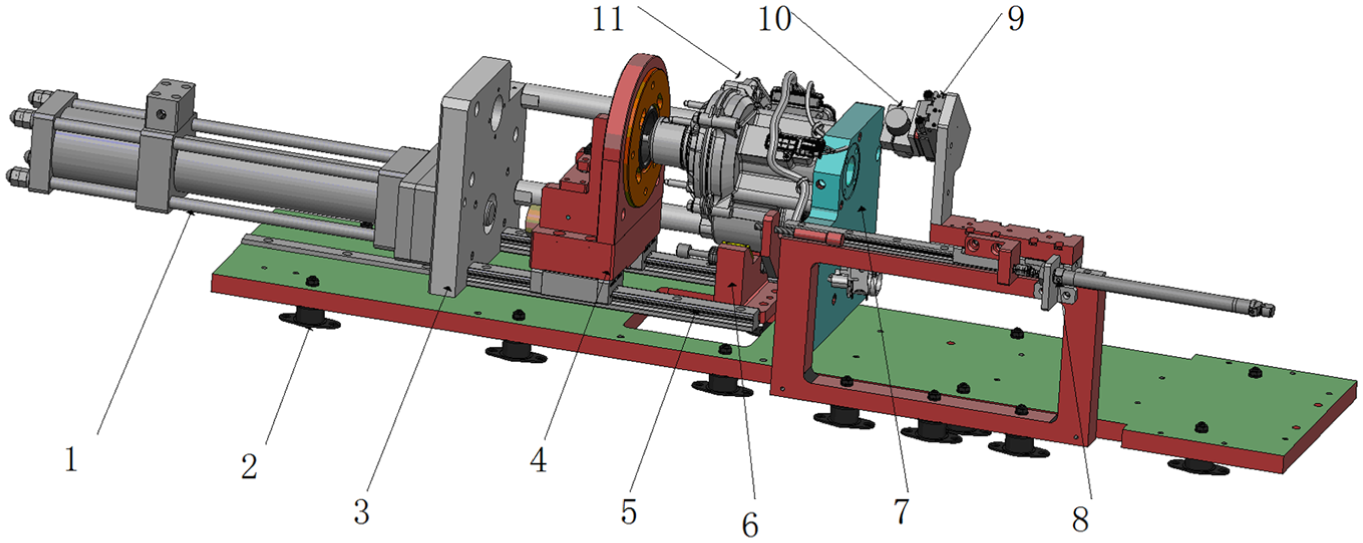
E-booster clamping tooling diagram. 1-hydraulic cylinder, 2-vibration pad, 3-hydraulic cylinder mounting plate, 4-product clamping block, 5-clamping block slider, 6-product positioning block, 7-product support plate, 8-slide table cylinder, 9-test cylinder, 10-vibration sensor, 11-E-booster test subject.
Owing to the E-Booster’s sealed integrated electronic servo design, direct rotational speed measurement is infeasible. To circumvent this limitation, a displacement sensor is installed at the output push rod to capture linear motion kinematics. For production-line compatibility, hydraulic circuit delays are mitigated through a shared master cylinder system requiring only single oil injection during product changeovers, coupled with an automated docking mechanism for rapid master cylinder engagement. Vehicle operational realism is maintained via a two-stage spring-coupling simulated loading device adaptable across eBooster variants. Complementary mechanical fixturing enables instantaneous product clamping and sensor deployment. Electrically, a brake-by-wire DMA acquisition system employing NI-4462 (data acquisition) and NI-8512 (CAN communication) cards achieves high-fidelity vibration capture, while NI high-speed hardware (10 kHz sampling) ensures real-time processing. The integrated test bench is shown in Figure 3.
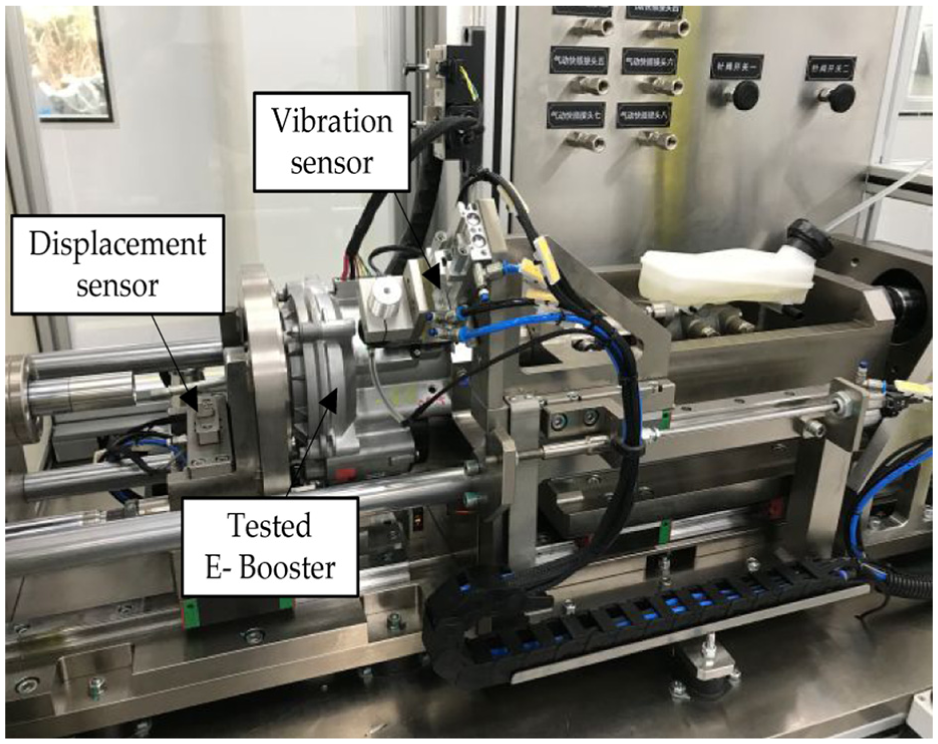
Physical diagram of E-booster transmission fault diagnosis test bench.
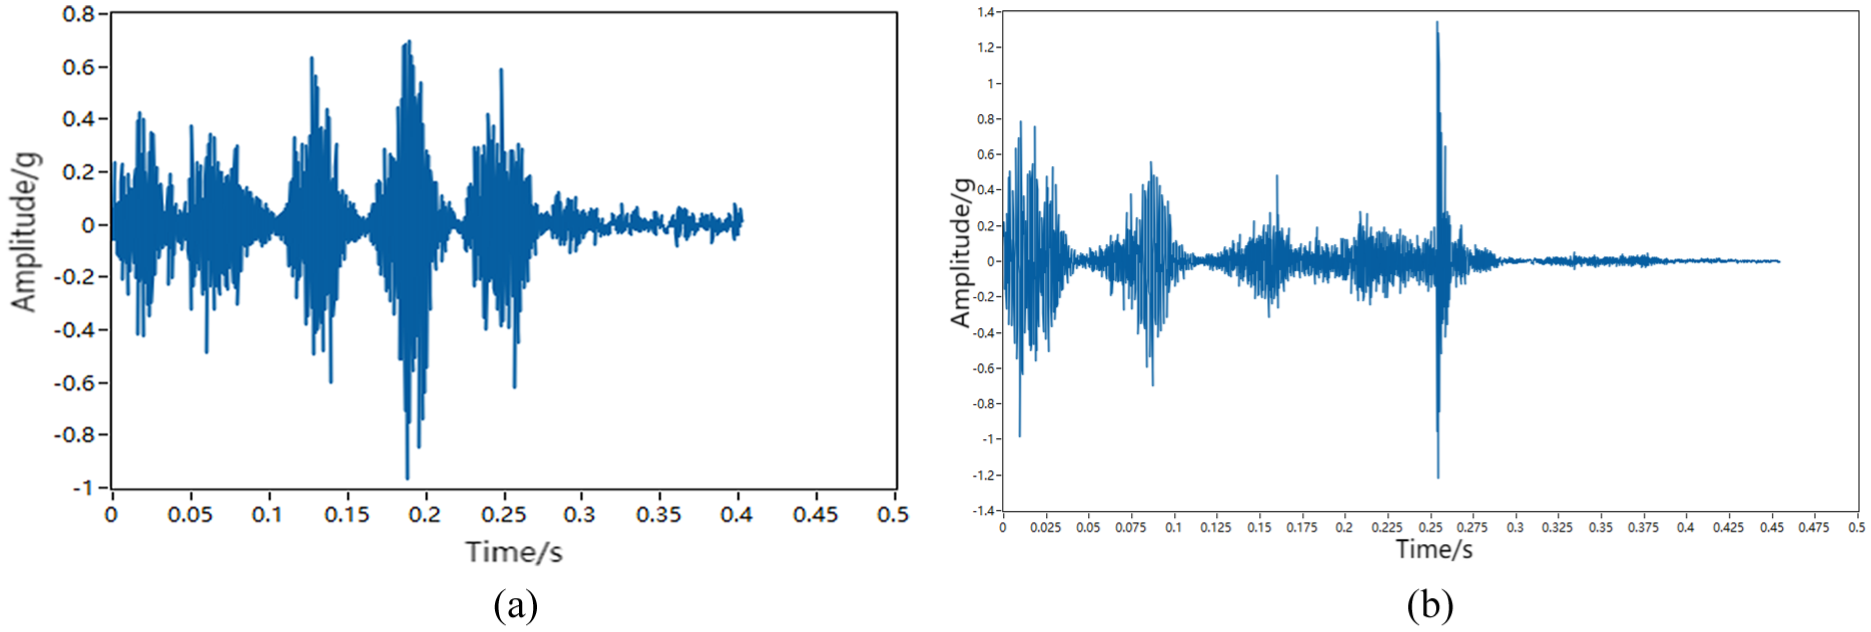
As evidenced in Figure 4(a) and (b), E-Booster vibration and displacement signals exhibit three distinct operational phases: (1) motor braking (outbound phase), (2) motor release (return phase), and (3) an intermediate stop phase. Significant disparities in vibration characteristics and intensity between these phases preclude joint analysis. Crucially, stop-phase vibrations constitute environmental noise with negligible diagnostic value. Consequently, raw signals undergo preprocessing to isolate outbound and return phase vibrations, as demonstrated in Figure 5(a) and (b), ensuring subsequent analysis focuses exclusively on operationally relevant signatures.
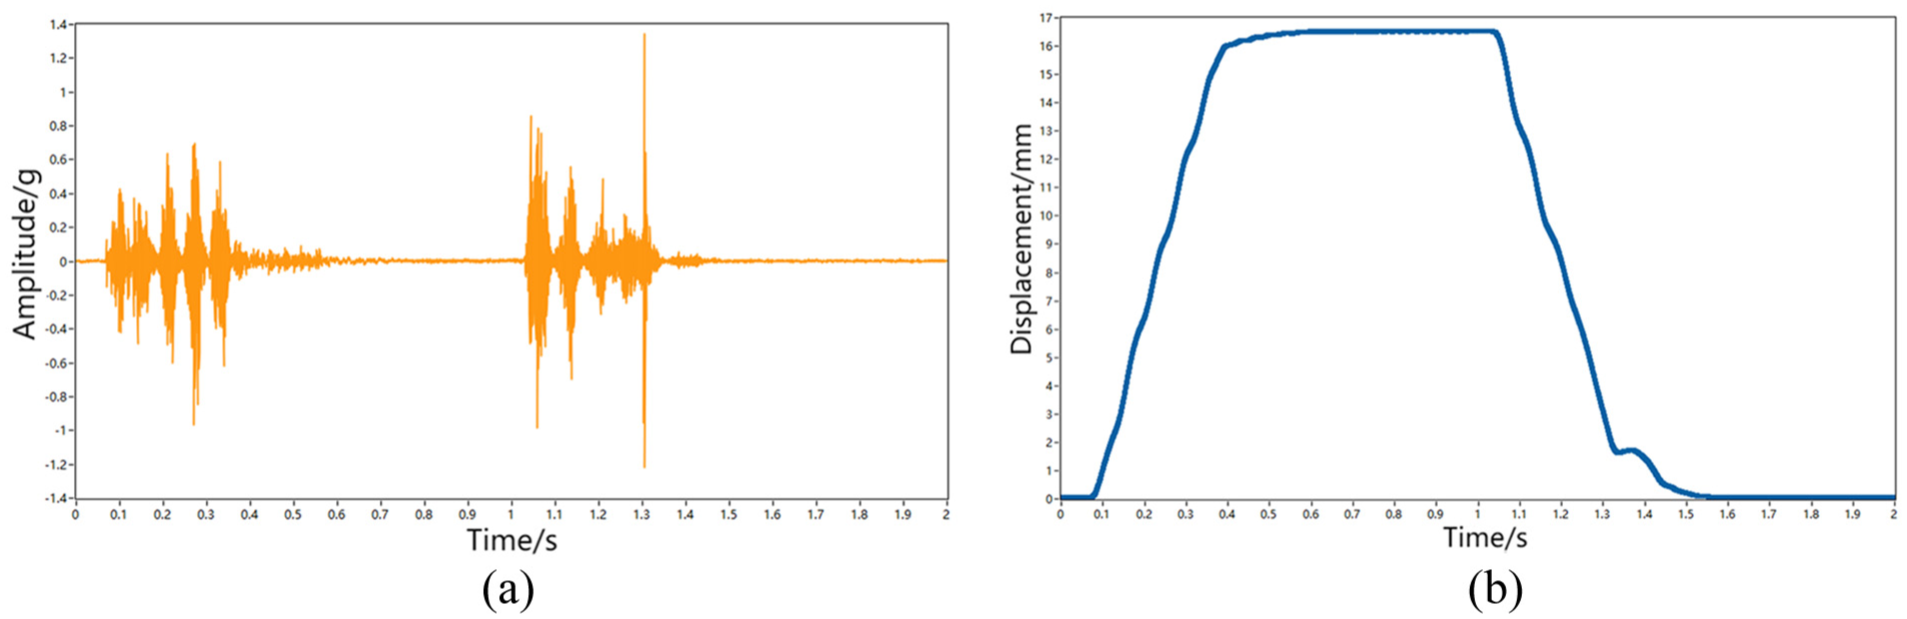
Vibration signal and displacement signal. (a) Full vibration signal image. (b) Full displacement signal image.
Preprocessed vibration signal. (a) outbound phase. (b) return phase.
Multi-domain feature extraction
The E-Booster’s transient power assistance duration during braking precludes extended vibration signal acquisition, while inherent non-stationarity and nonlinearity further complicate analysis. Single-domain feature diagnosis consequently yields insufficient accuracy. To address this, our methodology extracts time-domain features before progressively transforming signals: short-time Fourier conversion enables time-frequency feature extraction, while order tracking generates angular-domain signatures. Ultimately, multi-domain features are synthesized by integrating these complementary representations.
Time domain feature extraction
Time-domain E-Booster vibration signals contain fundamental features reflecting operational health. RMS quantifies overall vibration energy intensity, while Crest Factor detects abnormal transient impacts, and Kurtosis identifies subtle faults like gear surface damage by characterizing signal impulsivity. These diagnostically critical parameters are mathematically defined in Table 1.
Statistical feature index calculation formula.
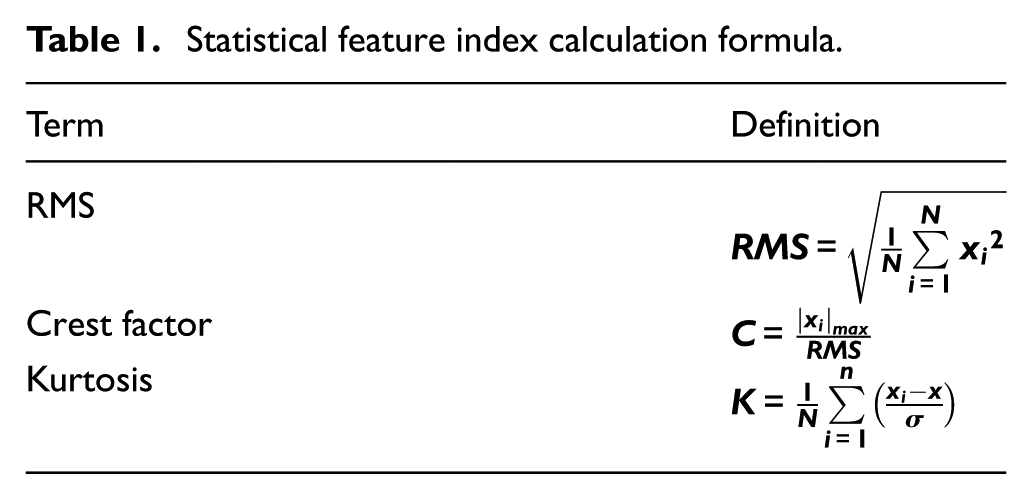
In which,
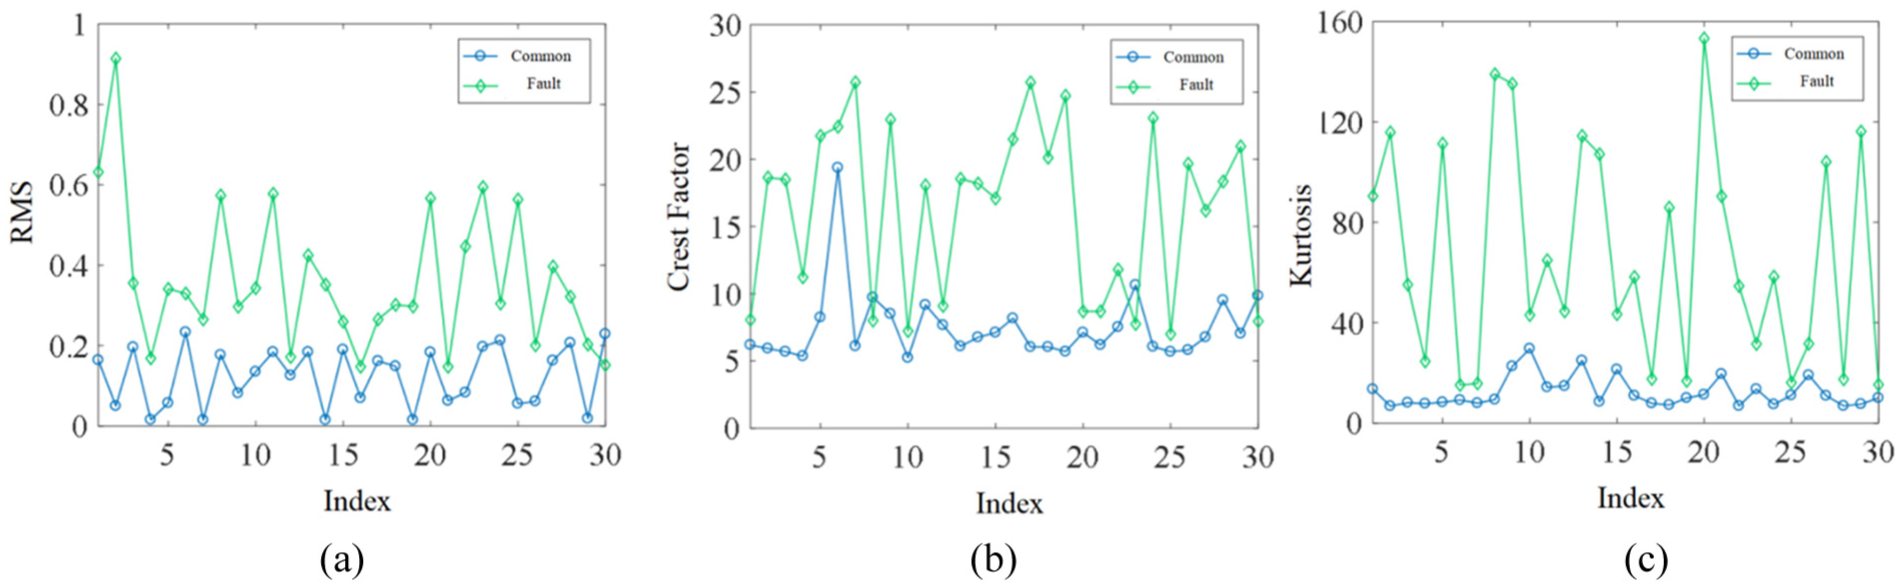
Time domain feature distribution. (a) RMS distribution. (b) Crest factor distribution. (c) Kurtosis distribution.
Time-frequency domain feature extraction
In response to the non-stationary and nonlinear characteristics of the E-Booster’s vibration signals, this paper employs the STFT for time-frequency feature analysis: First, the vibration signal
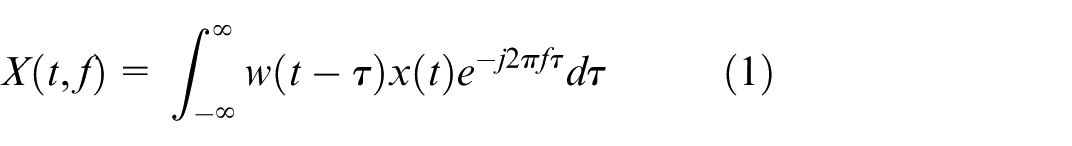
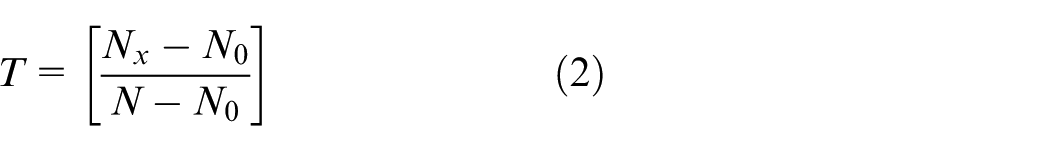
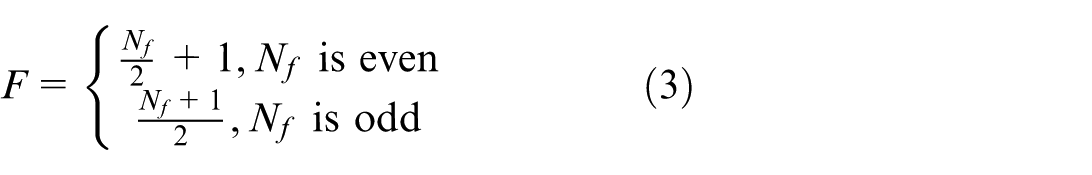
During the implementation of the STFT, critical factors affecting the resulting spectrogram include the type of window function, window size, window overlap ratio, and the volume of data subjected to Fourier transform. The window width directly influences both the time resolution and frequency resolution of the STFT. Specifically, time resolution T and frequency resolution F are inversely and directly proportional to the window width, respectively. The computational formulas for time resolution T and frequency resolution F are presented in equations (2) and (3).
In the formula,

To find the optimal window width and overlapping window width using an exhaustive search method, the optimality criteria are as follows: The 214 Hz maximum energy ridge data of normal samples should exhibit good clustering (
After multiple cross-validation experiments, the Hanning window was selected, with a window width of 550 and an overlap of 370, yielding a relatively optimal STFT spectrogram (Figure 7).
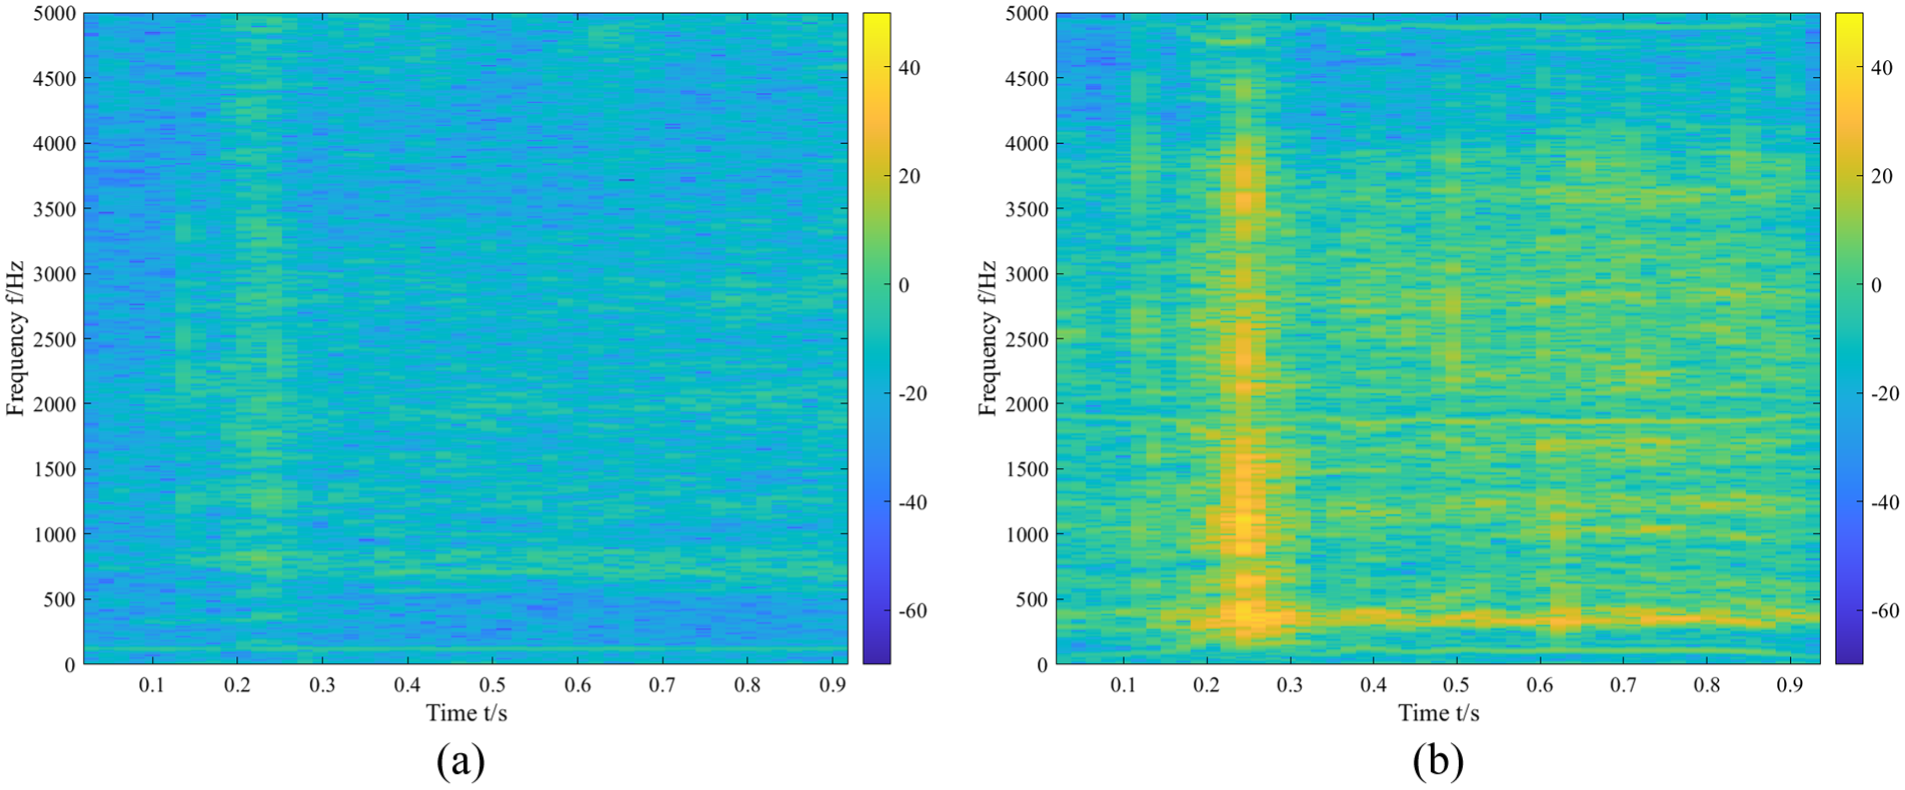
Time spectrum of STFT. (a) Time spectrum of normal products. (b) Time spectrum of faulty products.
In Figure 7, the horizontal axis denotes time, the vertical axis denotes frequency, and the color scale represents energy values. From the frequency perspective, both Figure 7(a) and (b) exhibit an energy ridge near 107 Hz, with the intensity of this energy ridge being higher for the faulty component than for the normal one. An overall analysis of the spectrograms reveals that the maximum energy of the faulty component is significantly greater than that of the normal component. To differentiate the time-frequency signals of normal and faulty components, two features are extracted from the time-frequency domain of the vibration signal: the maximum energy in the spectrogram and the maximum energy on the energy ridge (at 107 Hz).
Angular-frequency domain feature extraction
Although the STFT enables the analysis of non-stationary signals and the extraction of their instantaneous frequencies, it is constrained by the uncertainty principle, failing to achieve high resolution in both the time and frequency domains simultaneously. To mitigate this limitation, this paper adopts order analysis to extract angular frequency domain features from the vibration signals. When the rotational frequency of the drive shaft is defined as the fundamental frequency, the order is physically interpreted as the number of vibrations occurring per rotation of the drive wheel. Mathematically, this equals the ratio of vibration count to rotation count—that is, the ratio of vibration frequency to rotational frequency—as presented in equation (5).
In the formula,
Angular resampling of vibration signals
Order analysis relies on angular frequency domain analysis and necessitates equiangular sampling of vibration signals. The E-Booster is a sealed, integrated electronic servo power steering system, precluding the direct measurement of rotational speed signals. Furthermore, the motion of its internal mechanisms is non-stationary, which prevents direct equiangular sampling in the time domain.
However, the E-Booster converts rotational motion to linear motion via a ball screw, with a linear relationship existing between the rotation angle of the internal gear and the output displacement. Sampling the vibration signal at fixed displacement intervals enables equiangular sampling. The specific process is as follows: First, the time-displacement signal is fitted to yield a continuous time-displacement signal. Next, time is sampled at specific displacement intervals to generate a phase demodulation moment sequence. Subsequently, the vibration data corresponding to this phase demodulation moment sequence is extracted, and any missing data at specific moments is interpolated to acquire equiangular vibration signals. Finally, a Fourier transform is performed to derive the characteristic order spectrum of the vibration signal, as illustrated in the flowchart in Figure 8.
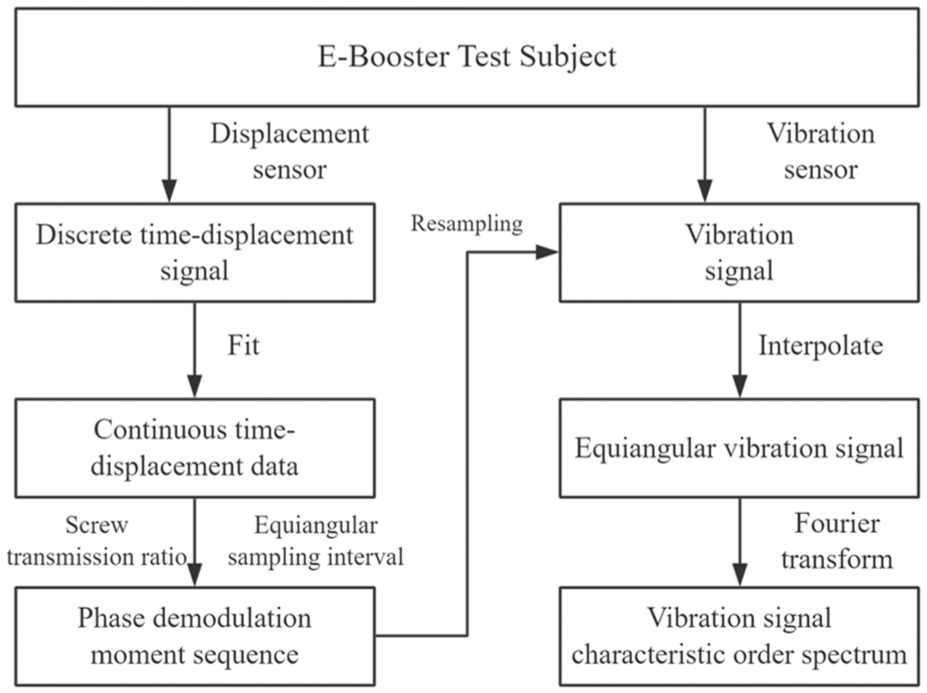
Vibration signal angle resampling flowchart.
In this paper, with a sampling interval of 0.1 ms, within this extremely short time frame, the acceleration of the output plunger can be assumed constant (uniform acceleration), and the output displacement of the E-Booster is a quadratic relationship with time. The fitting formula is shown in equation (6).

In which,
The E-Booster converts rotational motion to linear motion via a ball screw, and its output displacement is directly proportional to the cumulative rotations of the internal rotating component, where the proportionality constant corresponds to the gear ratio of the ball screw. The relationship between the output displacement and the resampled angular interval is given by:

In which,

Solving the above equation yields the phase demodulation moment for equiangular resampling.
For the E-Booster, the motor drives the pinion gear (16 teeth), which in turn actuates the large gear (71 teeth); the large gear then drives the ball screw. With the motor’s rotational speed defined as the fundamental frequency, each rotation of the motor yields 16 gear meshes, such that the meshing frequency corresponds to the 16th order. Since the vibration energy of the E-Booster primarily originates from gear meshing, the vibration energy at the 16th order is comparatively high.
The vibration signal of the E-Booster comprises discrete data points. When resampling the signal based on phase demodulation moments, missing values arise, requiring interpolation. To avoid the Runge phenomenon that may occur in polynomial interpolation at equidistant nodes, this paper employs Lagrange linear interpolation to obtain a steady-state, equiangularly resampled vibration signal.
Order spectrum analysis
After performing Fourier transform on the vibration signals resampled at equiangular intervals, an order spectrum is derived. The order spectrum of normal components is presented in Figure 9, which exhibits three local extrema. Analysis of the order spectra of 30 normal components reveals that these three local extrema are predominantly distributed around the 16th, 32nd, and 64th orders.
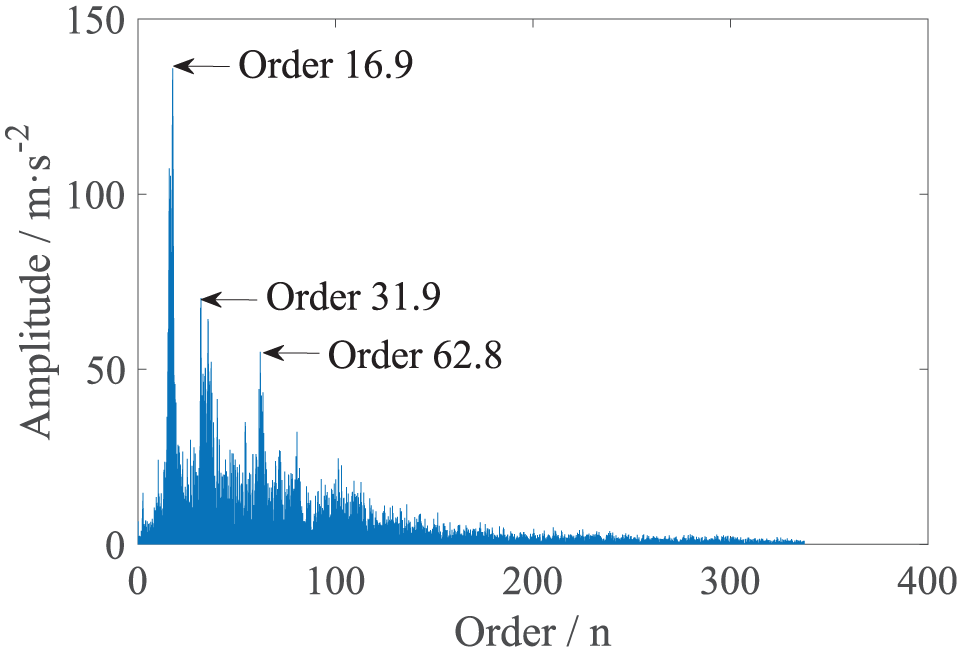
Order spectrum of normal products.
The order spectrum of faulty components is illustrated in Figure 10, which also contains local extrema with magnitudes greater than those of normal components. Since a fault introduces new order components into the signal, the orders corresponding to the local extrema exhibit a shift. In Figure 10, the order of the second local extremum has shifted from the original 32nd order to approximately the 41st order. Based on this analysis, this paper adopts a segmented approach to extract order features: extremum extraction is performed for three order ranges (15th–25th, 25th to 50th, and 50th to 70th orders), and these three local extrema are employed as angular frequency domain features for fault diagnosis.
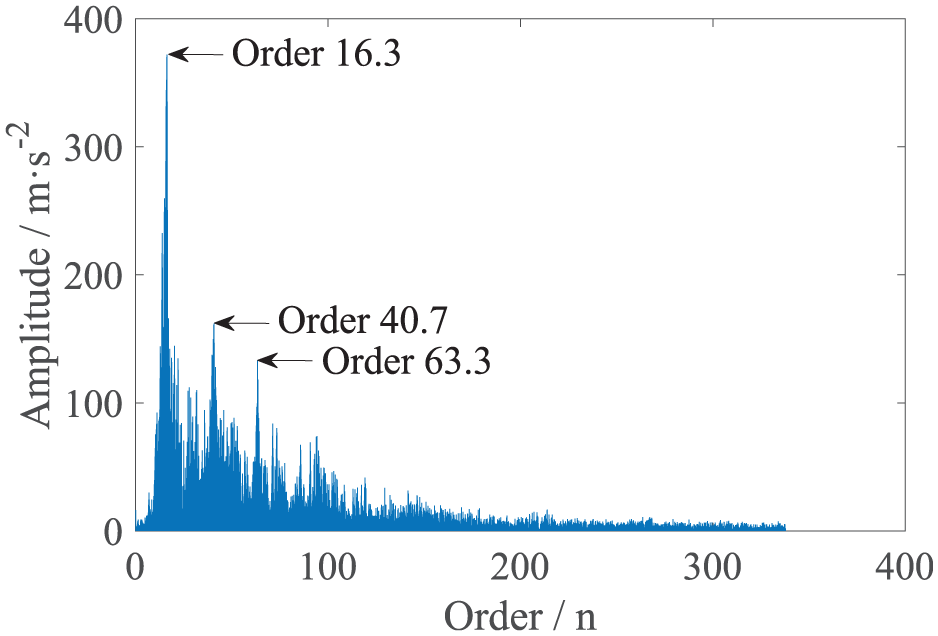
Order spectrum of the faulty product.
Multi-domain feature fusion
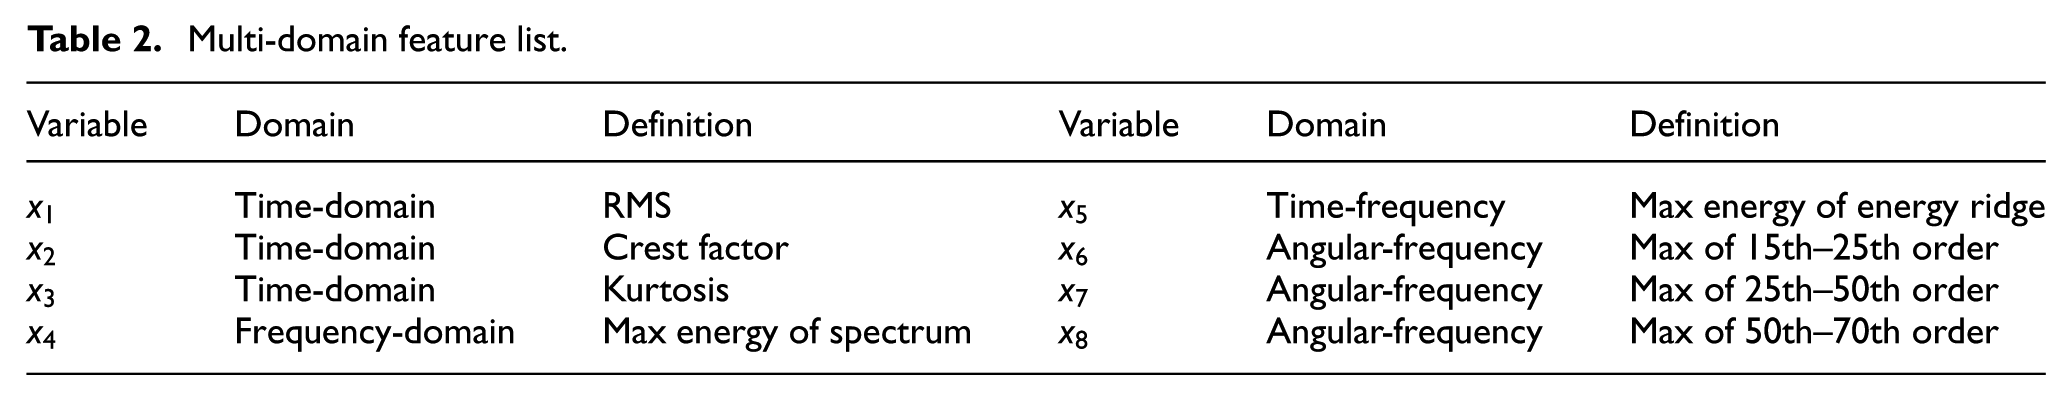
Combining the features of time domain, time-frequency domain and angular-frequency domain into a multi-domain feature information vector
Multi-domain feature list.
To address redundancy and conflicts among features, KPCA is utilized for fusing multi-domain features, thereby reducing the complexity of data processing and minimizing information redundancy.22,23 For nonlinear fault characteristics, KPCA yields higher accuracy than Principal Component Analysis (PCA). 24
The fundamental steps for multi-domain feature fusion are as follows.
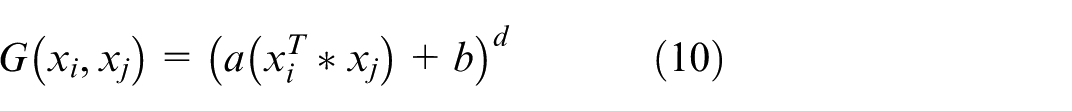
1) By applying a kernel function, the feature sample set of

In the formula,
In the equation,
2) Solve the Characteristic equation of the eigenspace matrix
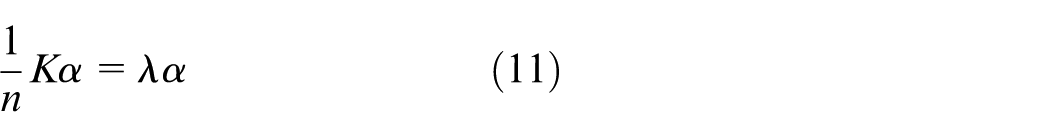
The obtained eigenvalues
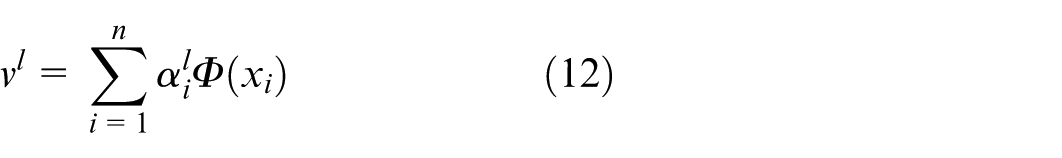
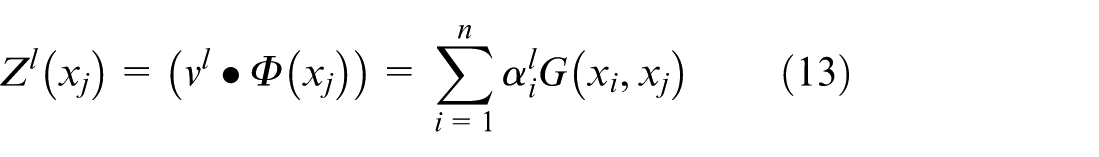
3) Compute the projection of the samples onto the nonlinear principal components. The projection of a sample
4) Calculate the contribution rate of the kernel principal components to determine the number of kernel principal components to retain. The contribution rate of the k-th kernel principal component is calculated as shown in equation (14).
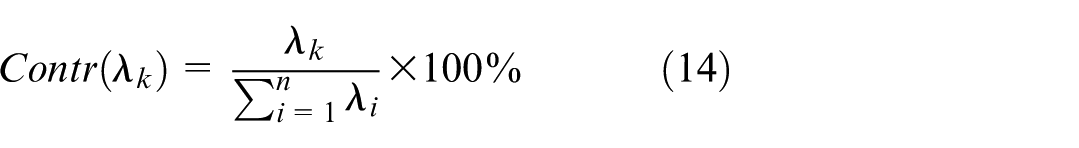
The number of retained principal components is also determined via grid search-based hyperparameter optimization. Results indicate that selecting four components yields the optimal performance and can effectively eliminate redundant features. The projection of the sample
Experimental validation
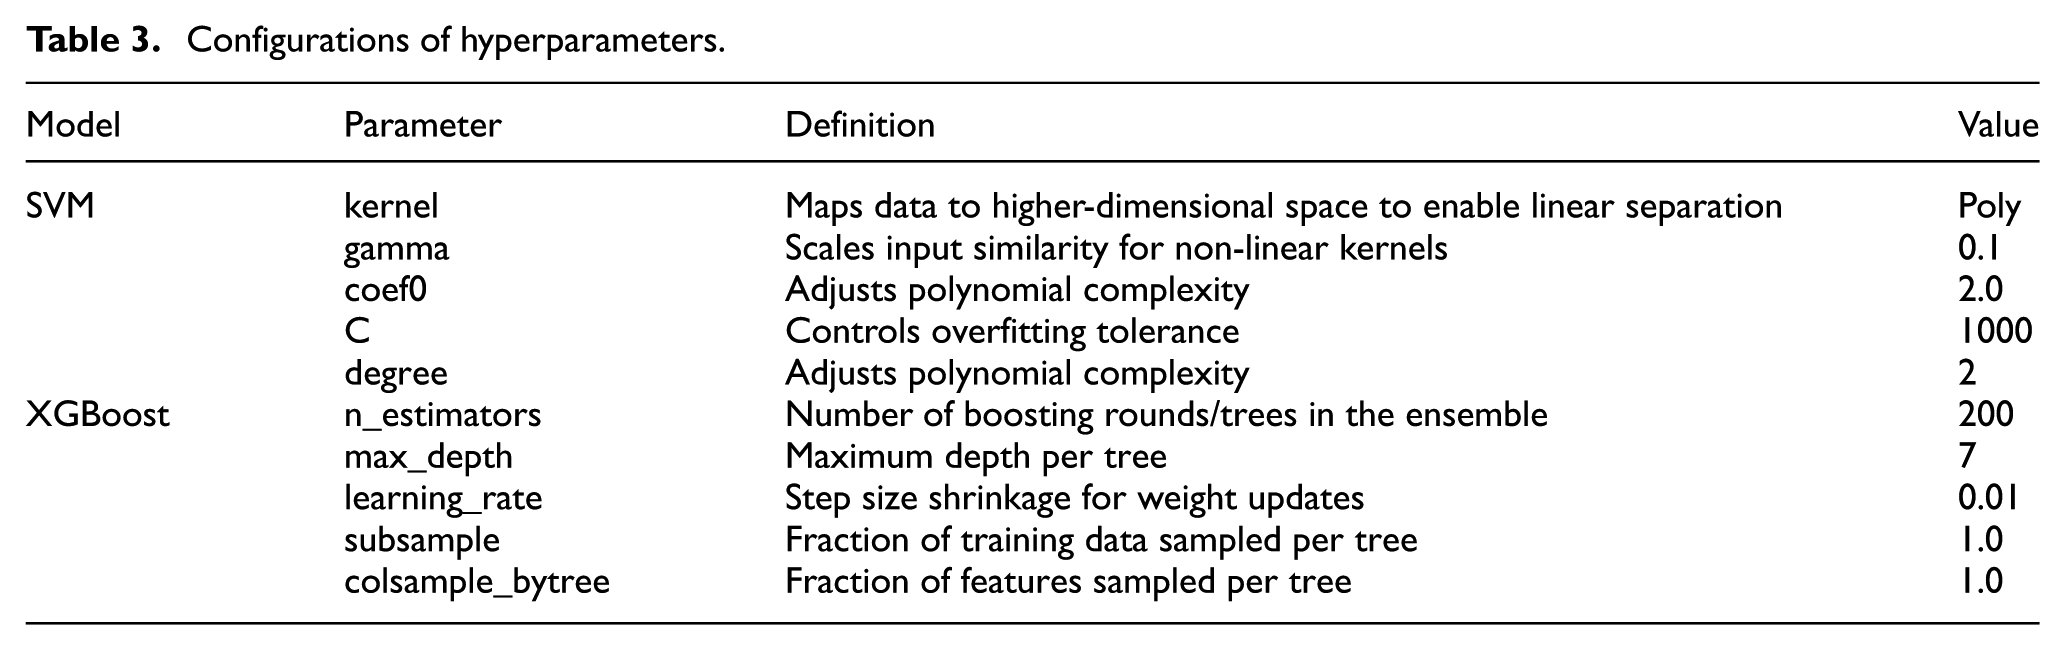
To validate the efficacy of multi-domain feature fusion for E-Booster transmission fault diagnosis, this study employs SVM and XGBoost classifiers—both established methods in fault diagnosis.26–30 While time-domain feature extraction, STFT time-frequency analysis, and angular-domain order analysis revealed distinctive fault characteristics, these techniques cannot directly evaluate component health. For production-line binary classification (normal vs faulty units), pattern recognition offers an optimal solution. SVM demonstrates particular effectiveness in mechanical fault contexts, 31 outperforming ANN and PCA classifiers especially with limited, imbalanced training data—a critical advantage given the scarcity of fault samples (significantly outnumbered by normal units). Its algorithmic efficiency enables robust pattern recognition even with small datasets and high-dimensional nonlinear inputs. Complementarily, XGBoost provides computational advantages as the fastest open-source boosting toolkit (>10× acceleration over conventional methods) with industrial-scale capability through distributed operation across Kubernetes, Hadoop, and related environments. Hyperparameters for both classifiers were optimized via grid search, with final configurations detailed in Table 3.
Configurations of hyperparameters.
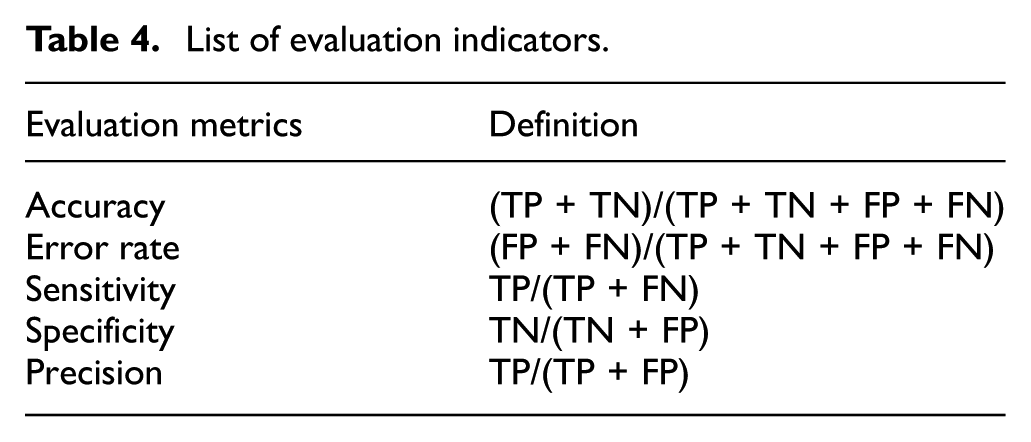
Classifier performance was rigorously evaluated using accuracy, error rate, and critically prioritized sensitivity metrics, with formal definitions provided in Table 4. Within this framework, True Positives (TP) represent correct identifications of normal components, True Negatives (TN) denote accurate detections of faulty units, while False Positives (FP) constitute dangerous misclassifications where defective components are erroneously passed as normal - representing the highest-risk error category in automotive safety systems. Conversely, False Negatives (FN) indicate conservative misclassifications where functional components are incorrectly flagged as faulty.
List of evaluation indicators.
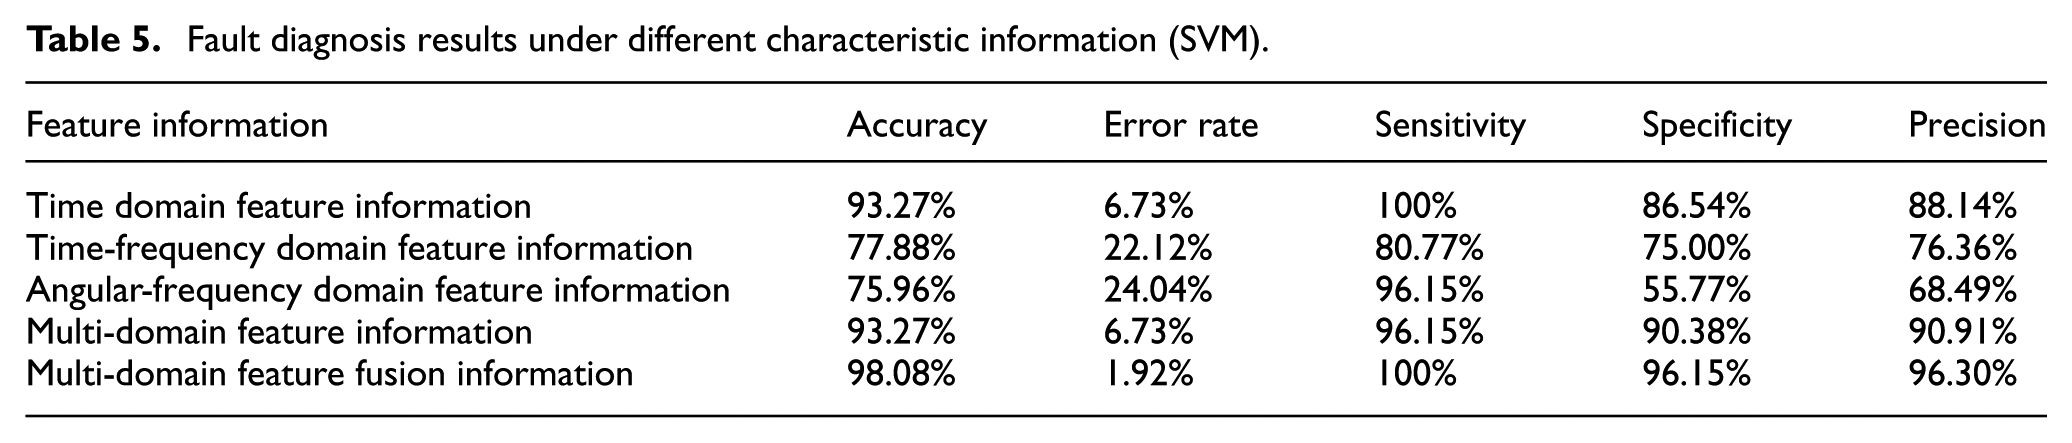
A balanced dataset comprising 416 E-Booster components was utilized, with 208 normal and 208 faulty units allocated for training, and an additional 52 normal and 52 faulty units reserved for testing. Normal components were labeled as ‘1’ while faulty components received ‘0’ classification. Both SVM and XGBoost classifiers were systematically applied to three distinct feature configurations: single-domain features, multi-domain features, and KPCA-fused multi-domain features. This comparative assessment evaluated diagnostic performance across progressively sophisticated feature representations, with comprehensive results for SVM and XGBoost presented in Tables 5 and 6 respectively. The experimental design specifically addressed real-world constraints through intentional training data imbalance while maintaining balanced test sets for unbiased metric evaluation.
Fault diagnosis results under different characteristic information (SVM).
Fault diagnosis results under different characteristic information (XGBoost).
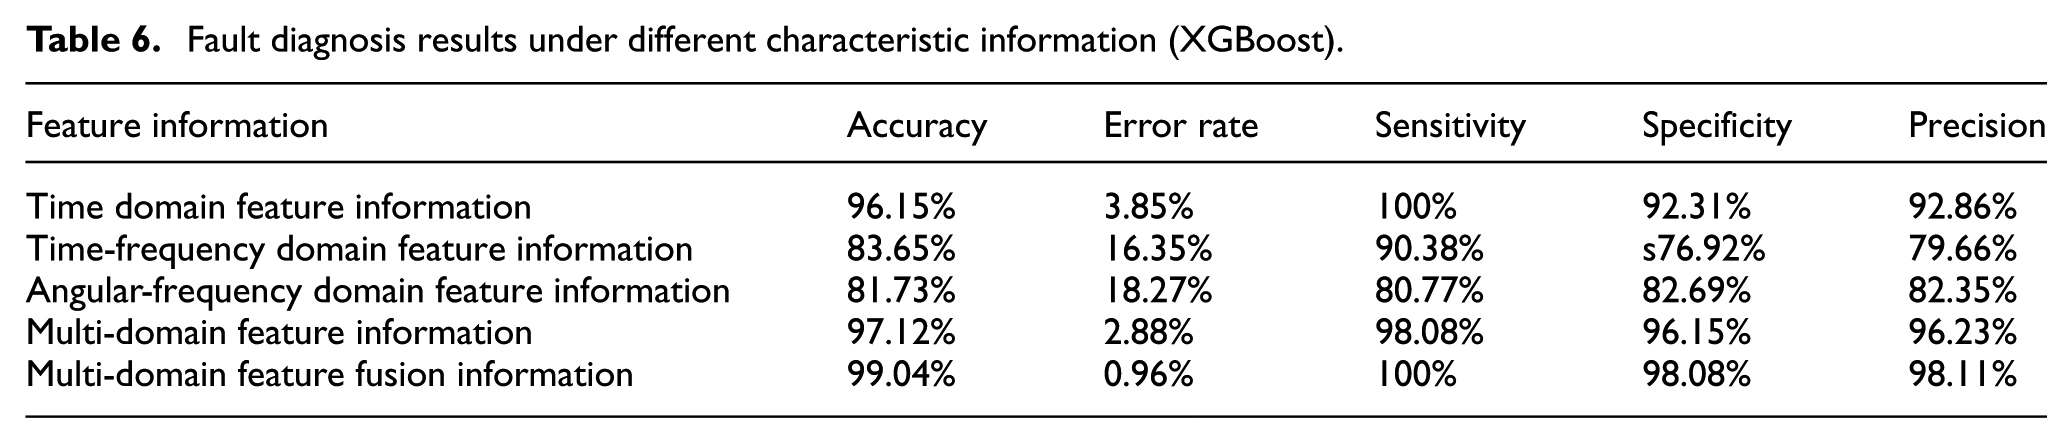
Tables 5 and 6 demonstrate that both SVM and XGBoost classifiers achieve sub-95% diagnostic accuracy when processing any single-domain feature set (time, time-frequency, or angular domain) in isolation. However, integrating these features into multi-domain representations significantly enhances all evaluation metrics, with KPCA fusion proving particularly impactful. By eliminating feature redundancies while preserving discriminative information, the KPCA-reduced 4-dimensional feature space elevates diagnostic accuracy to 99.04%—surpassing both single-domain and unfused multi-domain approaches. This 4+ percentage point improvement validates feature fusion as essential for reliable E-Booster fault detection, especially critical given the safety implications of braking system failures.
Conclusion
In response to the E-Booster’s ultra-transient operation and sealed architecture—which preclude extended vibration monitoring and direct rotational sensing—conventional single-domain feature analysis yields unacceptably low diagnostic accuracy. Our multi-domain feature fusion methodology overcomes these constraints by synergistically integrating time, time-frequency, and angular-domain characteristics, enabling 99.04% accurate online detection of transmission faults. This approach meets stringent industrial testing requirements while preventing safety-critical components with latent defects from entering automotive supply chains.
The study acknowledges limitations in sample diversity and volume, which influence model generalizability. Future work will expand datasets to encompass varied failure modes while algorithmically exploring deep architectures like temporal transformers or 3D-CNNs that may enhance diagnostic granularity given sufficient training data.
Notably, this framework demonstrates unique efficacy for electromechanical systems exhibiting coupled rotational-linear motion, with real-time capability suitable for high-throughput production environments. Its principles show significant promise for fault diagnosis in more complex industrial scenarios including robotic drivetrains, aerospace actuators, and precision mechatronic systems where multi-physics signal interactions challenge conventional monitoring approaches.
Footnotes
Acknowledgements
Thank you to every teacher for their guidance and resource provision, and thank you to all funding units
Ethical considerations
This study did not involve any human or animal participants.
Consent to participate
Informed consent was obtained from all participants in written or electronic form after the nature of the study had been fully explained.
Author contributions
Xixiang Wu conducted the experiments, analyzed the data, and wrote the manuscript. Weijun Fan supervised the research and guided the writing. Bin Guo provided the experimental equipment.
Funding
The authors disclosed receipt of the following financial support for the research, authorship, and/or publication of this article: National Natural Science Foundation of China (52075511); Zhejiang Province Science and Technology Plan Project Provincial Key R&D Plan (2021C01136); Zhejiang Province Public Welfare Technology Application Research Program (LGG21E050019).
Declaration of Conflicting Interests
The authors declared no potential conflicts of interest with respect to the research, authorship, and/or publication of this article.
Data Availability Statement
Data will be made available on reasonable request.