
Abstract
Power converters have become an indispensable component of photovoltaic (PV) systems in recent years, despite their significant role, reliability concerns have hindered their broader implementation. Power converter faults constitute approximately 12% of all electrical system failures, with transistors being the primary source of these issues, accounting for over 31% of such faults. To ensure the continued advancement of photovoltaic technology, it is imperative that these components operate reliably and effectively. The reliability and performance of photovoltaic (PV) systems can be compromised by the challenges associated with fault detection, diagnosis, and mitigation. Traditional fault detection methods may prove insufficient for complex PV systems, potentially resulting in system failures and financial losses.
This paper contributes the study of an open switch fault tolerant control of a grid-connected photovoltaic system. The novelty of this method consists in analyzing the grid currents within normal and faulty operating modes. The fault-tolerant topology (FT) was achieved by adding one redundant leg to the grid side converter (GSC) to maintain system performance even under fault condition. Some simulation results for different irradiance levels prove the validity of the proposed FTCS. The proposed diagnosis and control strategy improves the reliability of the photovoltaic system in terms of cost, reliability, low detection time, and service continuity. Compared to existing methods presented in literature, the proposed approach achieved a reduction in fault detection up to 4 ms. Finally, the experimental validation of the proposed fault diagnosis algorithm is conducted on a high-performance dSpace DS1104 controller board using Matlab/Simulink show that this method can accurately detect the fault IGBTs.
Keywords
Introduction
Over the past 10 years, the use of renewable energy production has increased, it is considered as a better solution than other resource (oil, gas coal) because this source of energy is inexhaustible, clean and pollution-free. Renewable Energy (RE) can come from several sources. The most common are solar, wind, thermal, biomass and hydropower. Among the most used RE sources is sunlight Photovoltaic (PV) source. This last, is one of the RE sources that has known a considerable importance for future world due to its easy availability, cleanness, and non-noisiness. 1 PV systems can be divided into three configurations such as islanded systems, grid-connected systems and hybrid PV systems. Today’s, the application of grid coupled PV systems is widely used over standalone PV systems. The PV systems convert solar energy to electrical energy, this electrical energy is converted to different power level using converters. Inverters convert the DC electrical power to AC power. At present, a significant attention is paid to control of grid connected voltage source converter. In addition, there are many control schemes of converter such as, Field Oriented Control (FOC), Direct Torque Controls (DTC) and Direct Power Control (DPC).
Inverters are indispensable components across a wide range of industrial applications. The failure of inverters can cause unplanned downtime and adverse economic consequences. Research indicates that voltage source inverters (VSI) are susceptible to failures, especially in energy conversion application. One of the key components of VSI is semiconductor which is widely used due to its favorable operational characteristics, it accounts for 21% of all power converters. 2 Faults in inverters can be attributed to factors including aging, environmental conditions, and thermal stress on the IGBT or bond wire. The semiconductors faults are classified into two main types such as more specifically, open circuit fault (OCF) and short-circuit fault (SCF).3,4 Secondary damage to other materials can be caused by open-circuit faults that usually last for some time. Indeed, a failure in the converter will affect the whole PV system and it might lead to its stoppage, since it is directly connected to the arrays. Furthermore, a failure in the GSC can endangers the overall system and leads to it disconnecting. For these reasons, many researchers have studied several detection and identification methods concerning power converters components, focusing mainly at the OCF of IGBT switch. The authors of 5 proposed model-based methods using an observer and an adaptive threshold. This technique is capable of quickly detect anomalies or deviations in system signals without requiring additional hardware. It has a very rapid response detection time of approximately 6 ms. The major disadvantage of the model-based fault diagnosis technique is that its effectiveness strongly depends on the accuracy of the model parameters. Signal-based methods use voltages or currents measurement technology to extract fault information features. 6 In signal-based methods, there are some approaches are based on output current characteristics, like the Park’s Vector method has been proposed to detect and localize the IGBT open-circuit fault, as shown in. 7 In This approach principle, three phase signals (Ia, Ib, Ic) are transformed into a two-coordinate system (Id, Iq). The drawback of this method is the generation false alarms under the different operating speeds and loads of the drive system. In reference 8, the current space vector trajectory diameter in complex plan (α, β) can also be used for fault diagnosis. 8 However, this method has some disadvantages notably the problems under low current values, tuning and the slower time terms. Reference 9 presents a method for diagnosing open-circuit faults in inverters using residual performance evaluation. 9 The fault location is then determined by analyzing the fault signal characteristics.
A current interval sliding mode observer is implemented for residual generation, eliminating the need for additional hardware circuits or sensors, which could otherwise degrade diagnostic accuracy. This approach also demonstrates strong noise immunity and resilience to process disturbances, significantly enhancing the fault diagnosis system's robustness. The proposed method achieves fast fault detection with a response time of 10 s, ensuring timely and reliable fault identification
In reference 10, the author introduces a detection method that is based on the errors of the average absolute value of the normalized phase current. 10 However, this method is characterized by its robustness and low cost. Besides, it’s able to detect multiple faults in the PMSG wind energy converter. Reference 11 proposes historical Absolute Normalized Currents (ANC) method which can detect open phase faults. 11 Also, this last has the advantage of the ameliorate the immunity against the false alarms when the load changes abruptly. The fault diagnosis method proposed in reference 12 utilizes current trajectory analysis to diagnose faults in inverter. Faults are evaluated and localized based on the contrast of the phase current paths on the output side under normal and fault conditions. This method does not require system control signals or sensors, but it often entails more time to detect the fault. Reference 13 presents an innovative technique for diagnosing faults in three-phase voltage-source inverters that is based on fuzzy logic. 13 The average current Park vector is employed to detect and locate faults in power switches that are either single, multiple, or intermittent. The fuzzy system was able to detect these faults in 9 ms and had a 96% accuracy. In reference 14, the authors used voltage-based method to detect faults and achieved quick results. 14 Nevertheless, this method requires voltage sensors, which increases the cost and complexity of the drive. To prevent false alarms, it's important to define a delay time correctly because there are multiple variables that could cause the system to become complex. A new fault diagnosis method based on an average model was proposed by the Reference 15 recently. The diagnostic variable in this method is the average pole-to-pole (PTP) voltage deviation. 15 After fault detection, the faulty inverter is controlled as a boost converter, allowing the diagnosis variable to display distinguishable characteristics to pinpoint the exact fault. This method’s main advantage is its ability to detect and identify faults quickly while eliminating the need for additional hardware circuits, which reduces cost and PCB size.
Therefore, to reduce the failure rate and avoid unplanned shutdowns in various systems, the fault-tolerant control (FTC) systems became one of the most attractive topics in the field of advanced control theory, which received a great deal of attention among researchers.16–18
Fault -Tolerant Control (FTC) techniques can be broadly categorized into active and passive approaches. 19 Passive Fault-Tolerant Control Systems (PFTCS) offer a streamlined approach where a robust controller is pre-programmed during the design phase. This controller is designed to be resilient to variations in system parameters and can effectively operate regardless of faults. The general scheme of passive FTC is presented in Figure 1.
The PFTC approach prioritizes robustness to a limited set of anticipated faults, eliminating the need for fault diagnosis and control law reconfiguration
The fault tolerance of this strategy is constrained by the predefined set of faults that it was designed to accommodate.
While excessive fault consideration can negatively impact controller performance, PFTC is capable of handling the predefined faults without sacrificing optimal closed-loop operation.
Active Fault-Tolerant Control Systems (AFTCS) utilizes a separate fault detection and isolation (FDI) unit to primarily identify and isolate faults. “After the FDI unit identifies and isolates the fault, the controller settings are modified.” Although AFTCS may have a slower reaction time, its robustness and ability to handle various faults make it a reliable control system option.
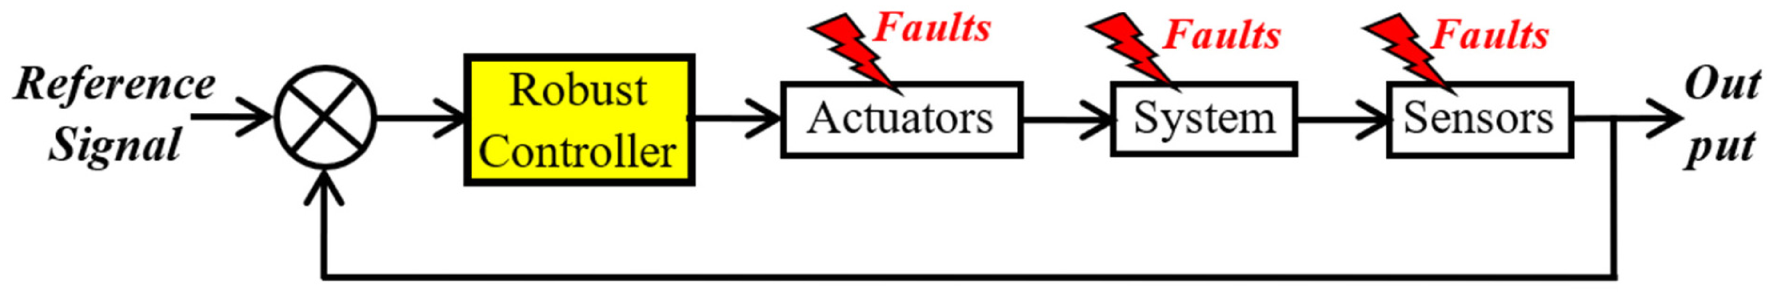
Passive fault-tolerant schematic.
Figure 2 illustrates the architecture of an active FTC system equipped with a fault detection and diagnosis (FDD) unit.
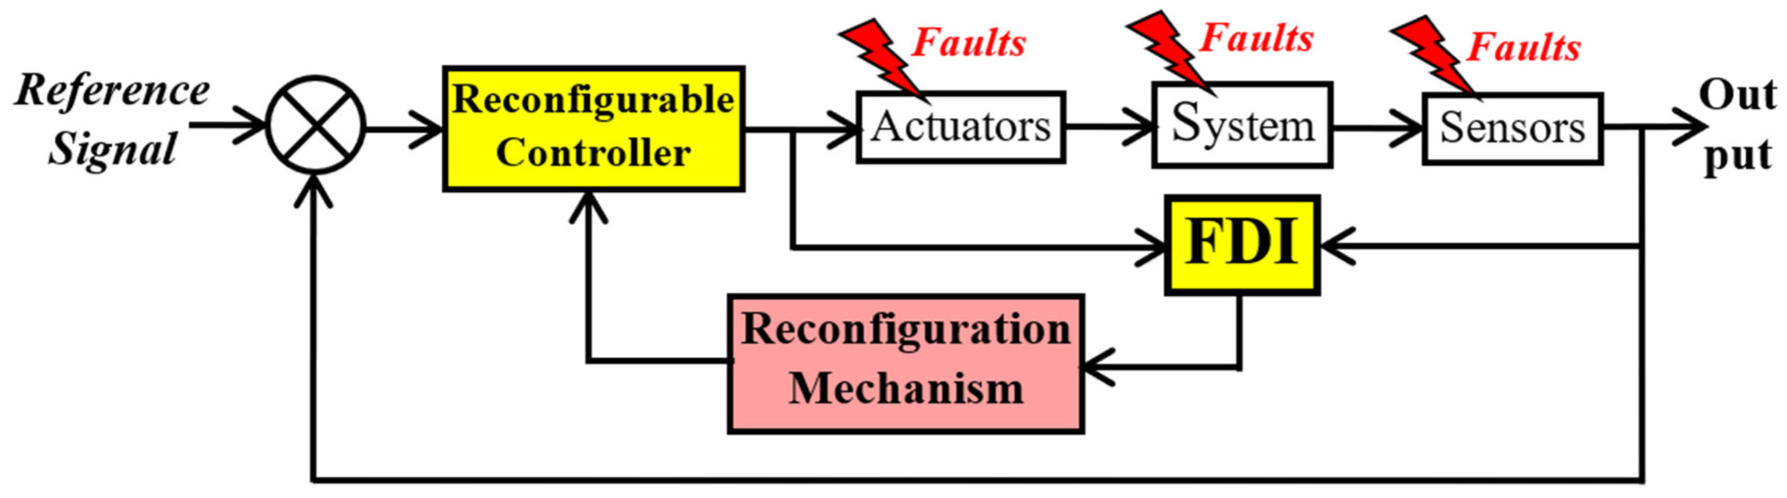
Active fault-tolerant schematic.
AFTC and PFTC are evaluated against a set of important system properties. Table 1 presents a summary of their comparative responses.
Comparison between AFTCS and PFTCS.
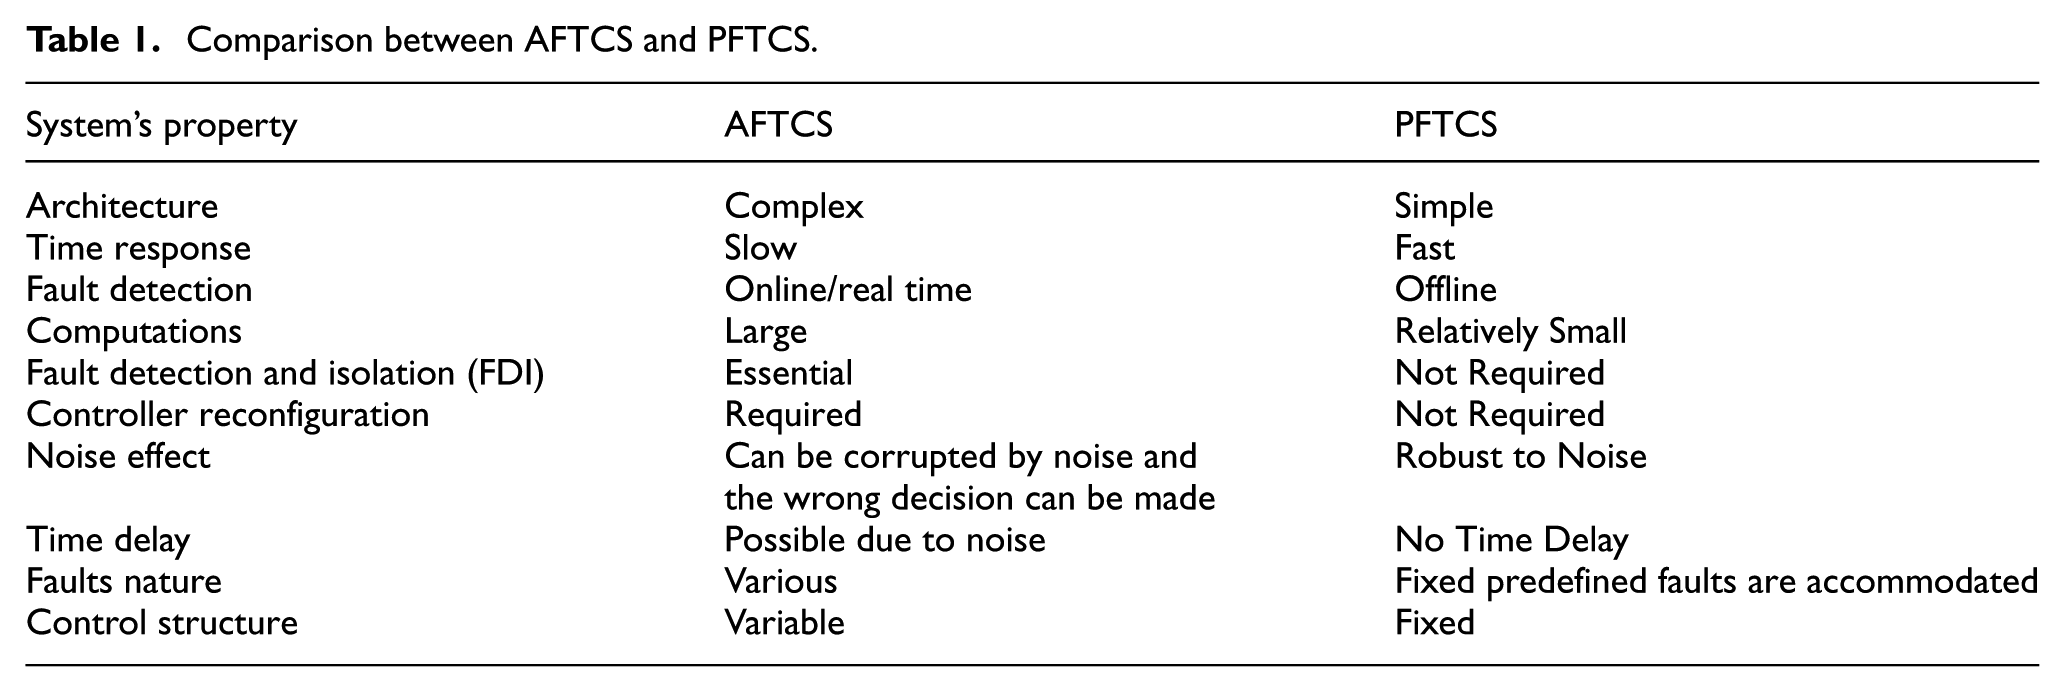
A comprehensive analysis of AFTCS and PFTCS reveals that a hybrid approach, combining the strengths of both systems, could offer significant advantages. While AFTCS excels in optimizing system performance, its potential time delays may pose challenges in safety-critical applications. By integrating PFTCS for rapid fault response, a hybrid FTCS architecture can mitigate these risks and provide both the stability required for unexpected disturbances and the optimized performance characteristic of AFTCS.
In recent years, several FT control methods in power electronic converter systems have been proposed.20,21 In references 22 and 23, the authors have introduced in their works FT Motor-Level Interfaces (MLI) that incorporate redundant operation states.22,23 These states manifest in the form of varying switching strategies, which serve the dual purpose of minimizing system downtime and enhancing the overall robustness of the inverter. Nevertheless, this technique has drawbacks related to fault scenarios which can disrupt the balance of voltages across the capacitors. The proposed topology in reference 23 presents the remarkable ability to withstand open circuit and short circuit faults in its switches. 23 The FT inverter topology shown in reference 24 is inspired by topologies redundant. 24 In this configuration, the motor is powered by two converters that are coupled to the dual stator windings or cascaded to the stator windings. In the event of a fault, the isolation circuit will block the converter that has a faulty switch, and the healthy converter will provide power to the load. It is important to balance output power and system cost in this situation. In reference 25 the research primarily studied FT systems of a permanent magnet motor with five phases. 25 The multiphase machines are not a good solution for some applications due to the extra weight and costs. The FT inverter topology, depicted in reference 26 is based on isolating defective components by opening the motor phase, and connecting the neutral point of the motor stator to the middle point of the inverter DC bus. 26 So, after detection of an abnormal condition (OPF) the system disconnects of the faulty phase leg by disabling the PWM signals to the corresponding switches of the inverter. The main contributions of this paper are as follows:
The Boost converter is controlled using the PSO technique of the MPPT controller because it is characterized by the robustness and efficiency.
The improved grid connected PV system has been proposed to injecting active power to the grid and as well as compensate the reactive.
New DPC for grid connected inverter based on SMC method.
An FTC strategy based for leg redundant topology is proposed for three-phase in grid-connected systems. The proposed fault tolerant system is composed of two parts: Fault Detection Method and reconfiguration control strategy. The proposed method for fault diagnosis is based by analyzing the currents under both healthy and faulty operation conditions.
This paper is structured as follows: Section “System description and control structure” details a simplified model of the PV system and the control strategy of converters. Section “Control” presents the Open Circuit Fault Diagnostic method for the converter. Section “Fault tolerant system” is devoted to Reconfiguration of converter in the cases of an open-circuit. Section “ Simulation results of IGBT open-circuit fault” presents the simulation results and their evaluation. Lastly, Section “Simulation results of IGBT open-circuit fault” concludes the paper.
System description and control structure
System description
In this manuscript, the structure of the considered Grid-Connected Photovoltaic (GCPV) system is represented in Figure 3. The studied PV system is made up of PV arrays: PV Array can generate a power of 1.5 kW under certain conditions: 1000 W/m2 solar radiation and a cell temperature of 25°C. Each PV array is coupled to a boost converter. The boost converter is supervised by a Maximum Power Point Tracker (MPPT) system. The MPPT use the Particle Swarm Optimization (PSO) method to vary the voltage across the terminals of the PV array in order to extract the maximum possible power.
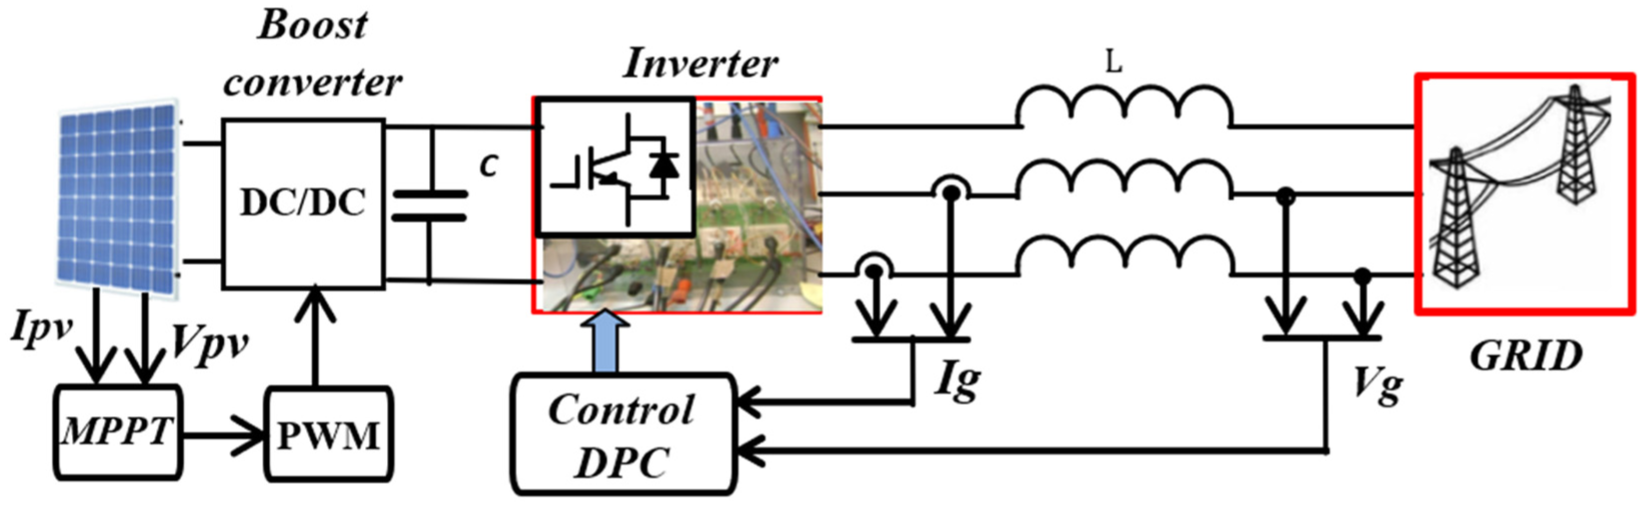
Structure of a grid-connected PV system.
The boost converter, allows the relatively low solar voltage to be increased to a suitable level (500 V) for the DC continue bus. The output of the inverter is directly coupled to the three-phase grid via an appropriate filter. The converter is supervised by a DC voltage regulator whose aim is to maintain the DC link voltage to 500 V regardless of the amount of active power supplied by the PV arrays.
Modeling of (PV) system configuration
PV cell, can be represented by an equivalent circuit model that simplifies its behavior for analysis. The equivalent circuit of a PV cell typically consists of a solar cell, a diode and two resistors. Figure 4 shows the model of the PV cell under standard conditions.
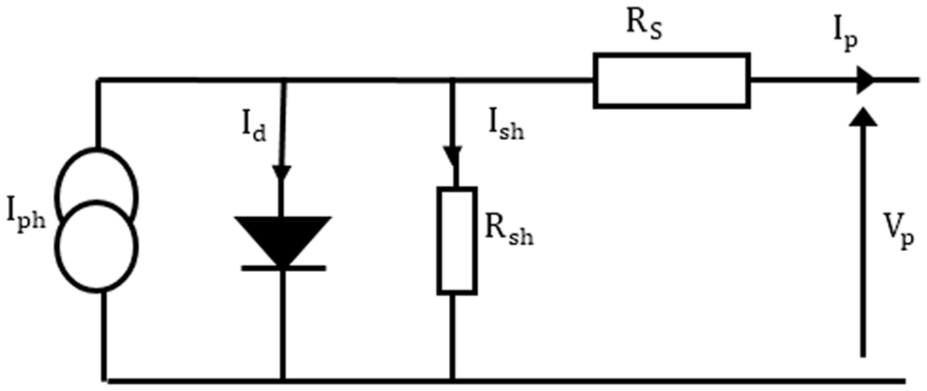
Equivalent circuit.
The output current of the solar cell is given by:
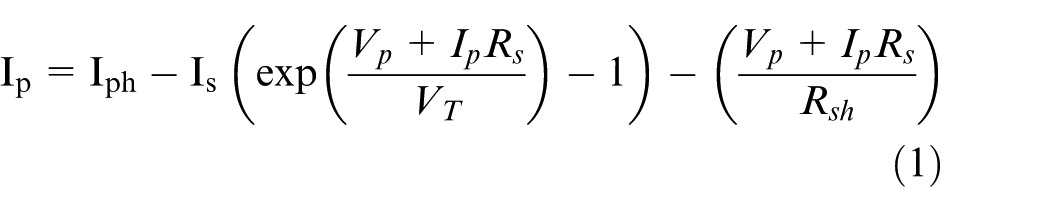
Boost converter
Figure 5 illustrates the fundamental components of a typical DC/DC converter
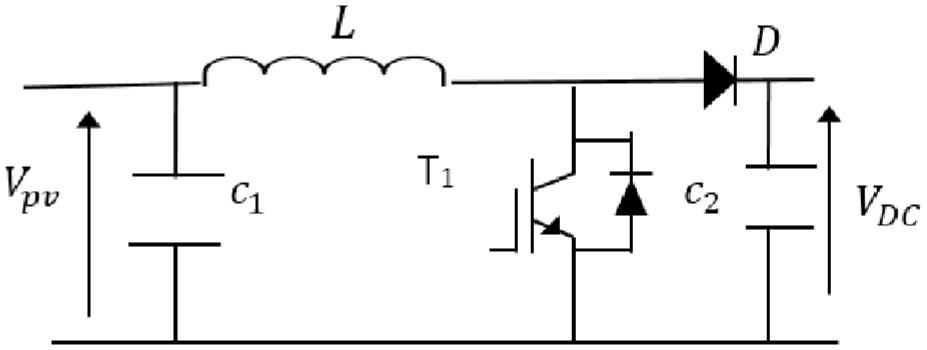
DC/DC boost converter.
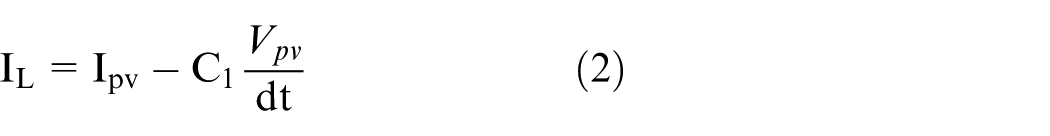
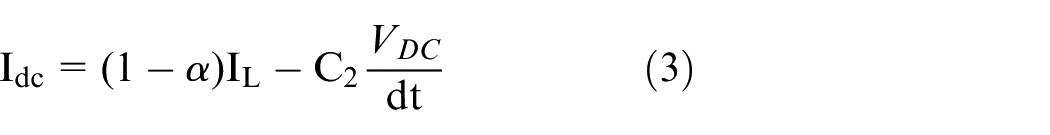
The following ordinary differentiation equations can be used to characterize these converters:


The equivalent circuit and model of the converter connected to the grid
The relationship between the supply, converter voltages and line currents in the stationary reference frame is given as:

The instantaneous active and reactive powers on the grid side can be described as follows

Control
MPPT controller
The output of a photovoltaic array is affected by several factors, such as the temperature and irradiance variations. Variations in these factors directly affect the power output of the solar panels. To get the highest output power from the PV array we can use different MPPT techniques. In this work, MPPT technique based on P&O method is used. This technique helps to reduce the impact of partial shading on the system efficiency and extracting the most energy from the solar array, enhancing the output of the solar power system. The Particle Swarm Optimization (PSO) algorithm is used to solve various optimization problems, including the multi-peak problem of P-V output curve and non-linear systems under the condition of local shadow of photovoltaic array. This will reduce the impact of partial shading on the system efficiency. Furthermore, the basic PSO MPPT algorithm is shown in figure 6.
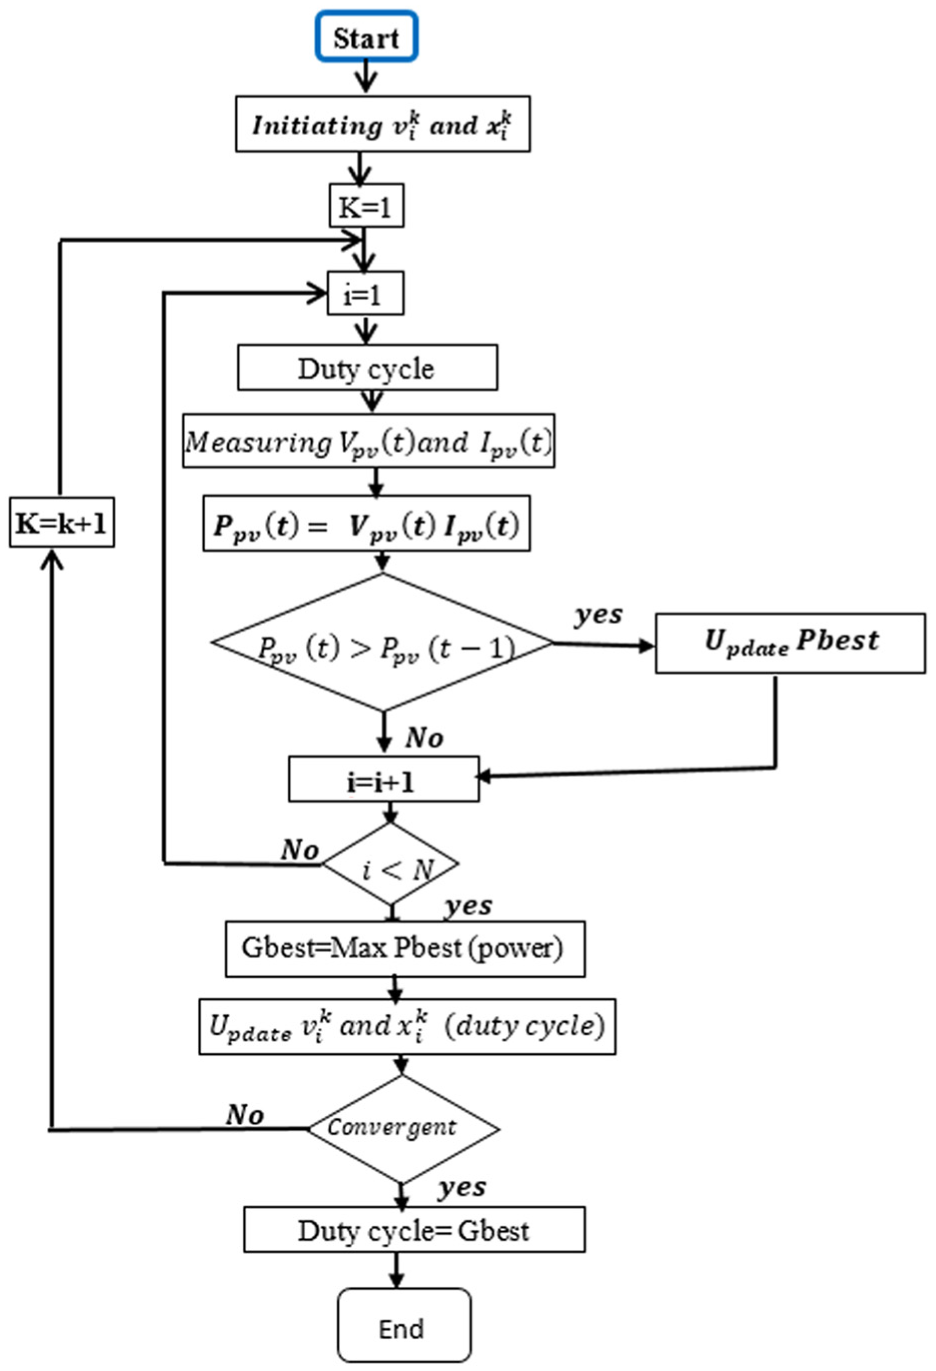
PSO MPPT.
The velocity and position of each particle are updated using equations commonly associated with PSO:
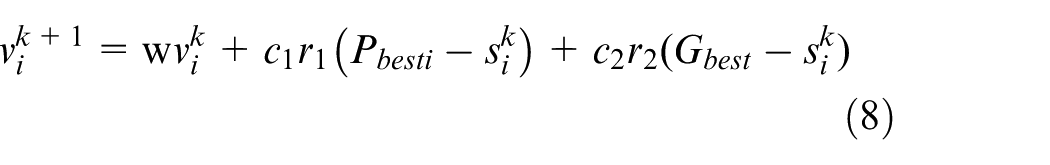
W is the inertia weight
The r1 and r2 are random variable within
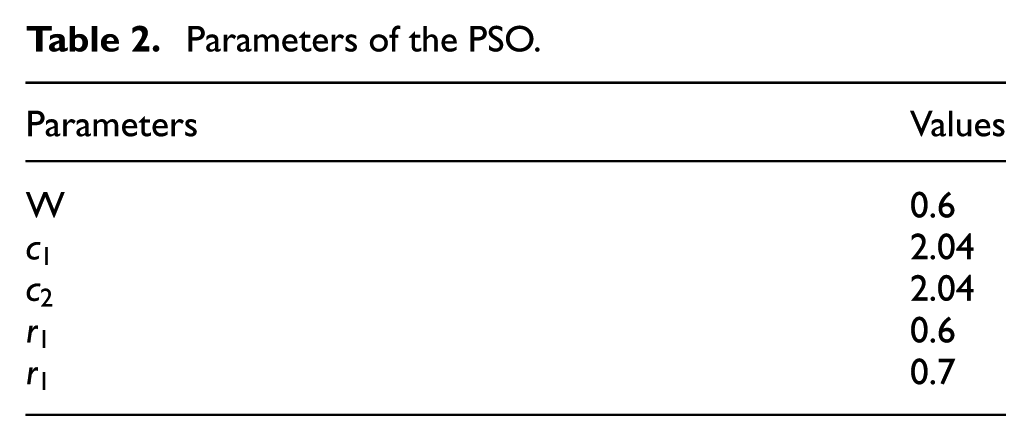
The parameters of control algorithms are reported in Table 2.
Parameters of the PSO.
Sliding mode control of Grid-Side inverter
In this section, firstly, a DPC modeling based on the sliding mode control approach is briefly introduced. The diagram in Figure 7 illustrates the proposed method, where the reference active power value is typically obtained from the DC link voltage regulator. To achieve unity power factor operation, the reactive power is controlled to be zero. A DPC approach is used to control the generated PV power as well as the reactive power in the network connection.
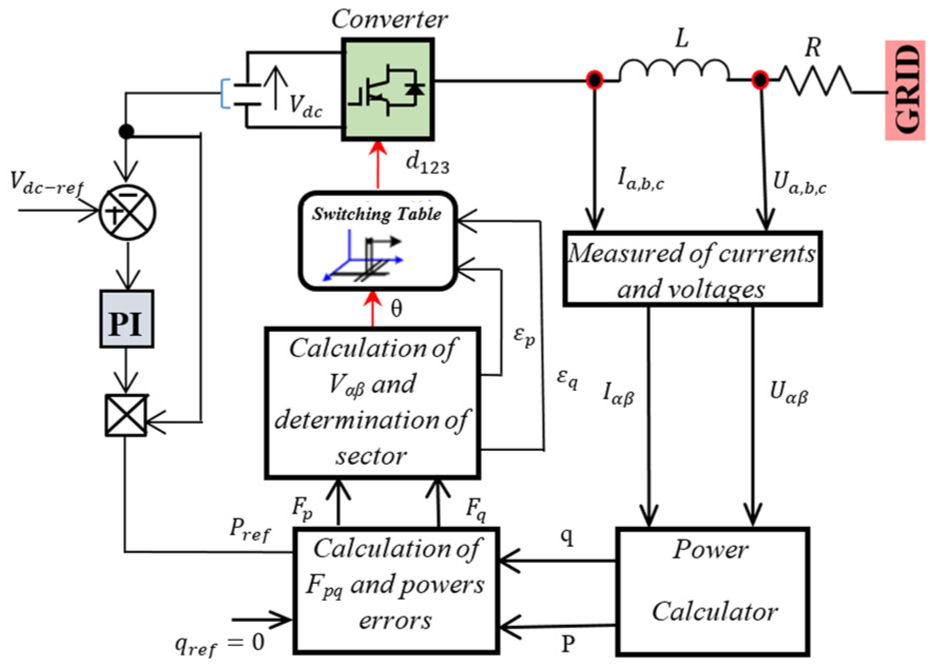
Structure of control strategy.
The sliding surfaces can be categorized as:

To obtain the control law using sliding mode control, one common approach is to set the time derivative of the sliding surface to zero as shown by the two equations (10) and (11).


The errors of injected powers of converter are defined by the active and reactive powers can be expressed:


The sliding surfaces must certainly be proportional to these errors, becoming zero after reaching the sliding regime.


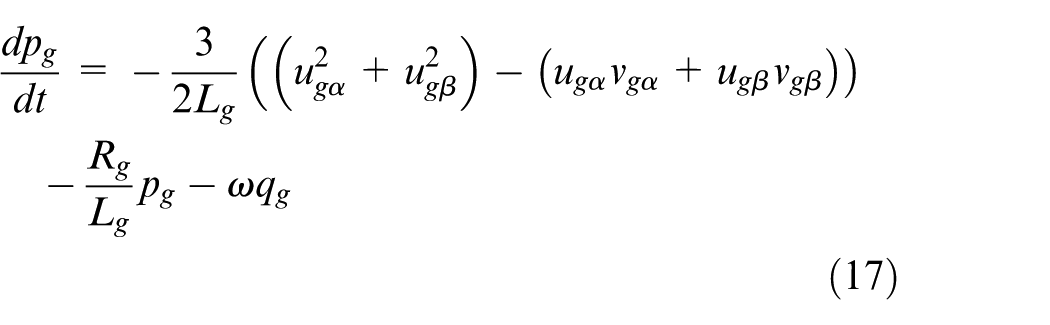

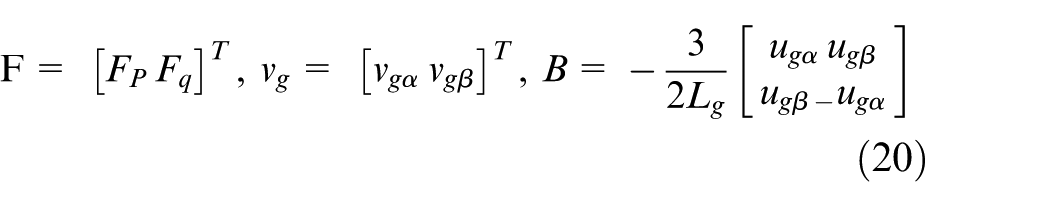
equations (14), (15), (16) and (17) can be rewritten as:

With
Consider the quadratic function of Lyapunov defined by the equation

The quadratic Lyapunov function time derivative is determined by:

The expression of the law of control by developed sliding mode is given by the equation:
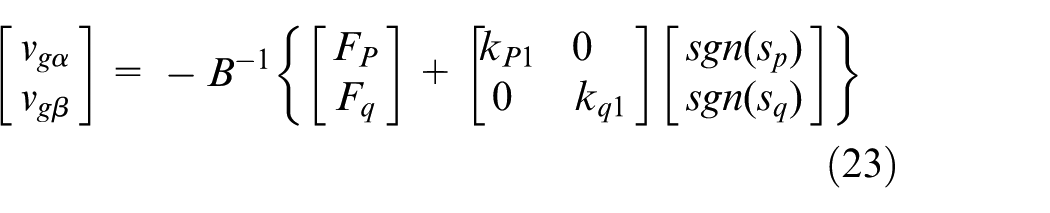
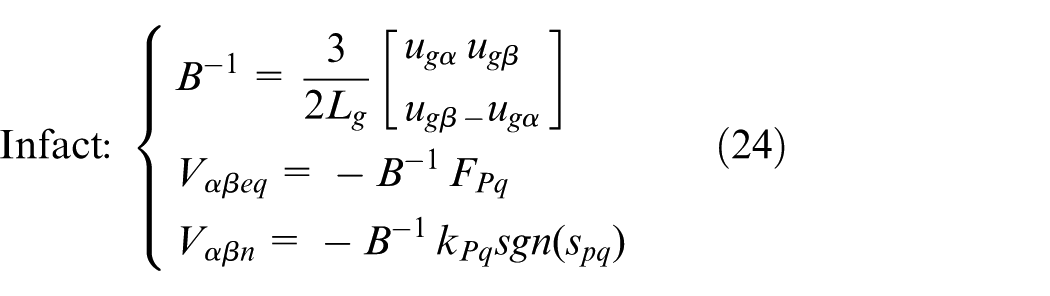
Using equation (7), we can extract the SMC control algorithm as shown in Figure 8.
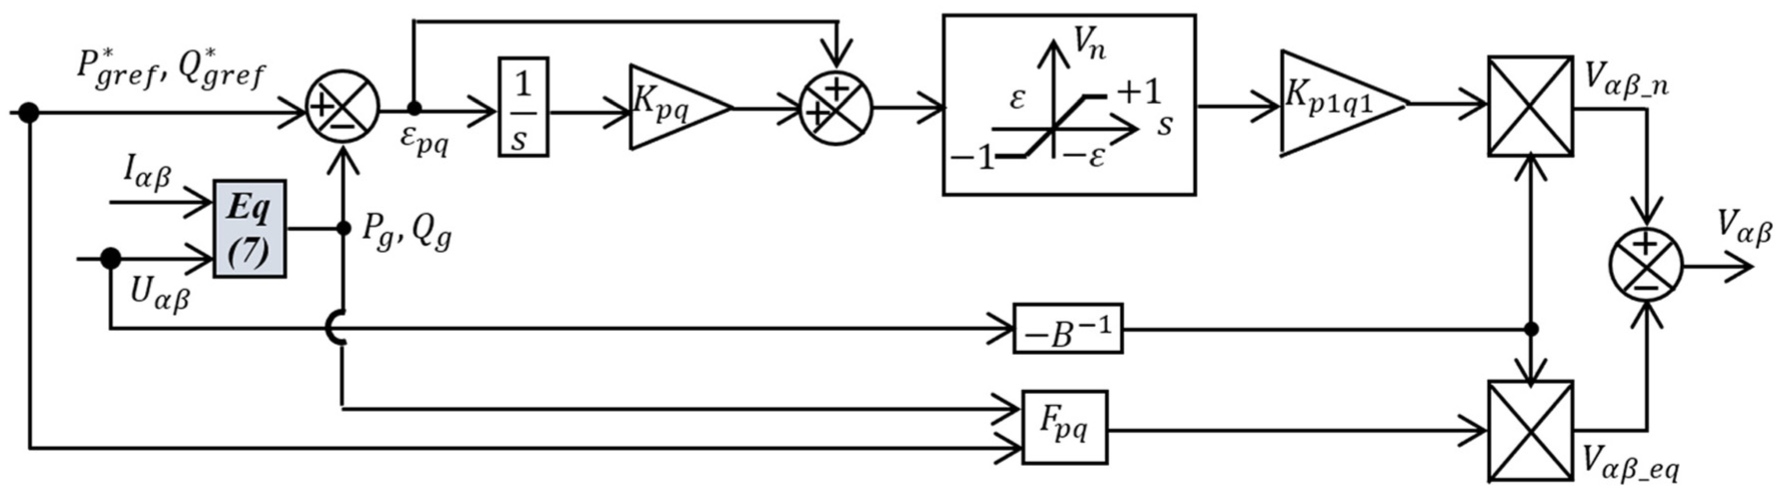
Schematic of the SMC strategy for the GSC converter.
Fault tolerant system
This proposed FTC approach is simple and ensures that the system can continue operating without interruption after a switch fault occurs. The FTC consists of various blocks, such as fault detection and isolation, and system reconfiguration.
Fault detection scheme
The switch fault detection in the converter is based on analyzing forms of the currents in (n = a, b, c) is shown in Figure 9. The grid current output is initially fed into a comparator with a hysteresis threshold “h.” The resulting comparator outputs are denoted as equation (25).
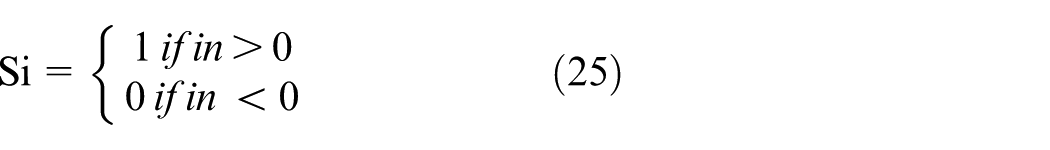
The signal output of the first hysteresis comparator is applied to a counter. Then the output of counter is applied to the second comparator with a threshold value of “Nc.” When this signal is greater than the threshold, the up-counter is enabled and starts to count.
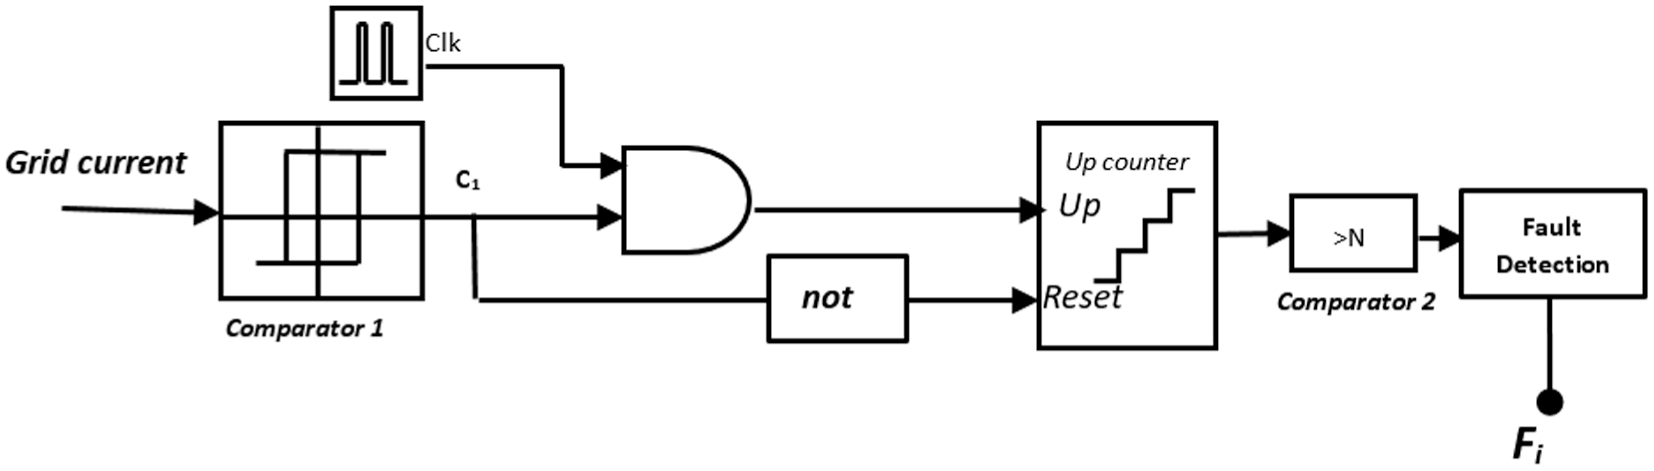
Fault detection method.
Fault tolerant control converter
Figure 10 shows the fault tolerant topology of the grid-connected photovoltaic system.
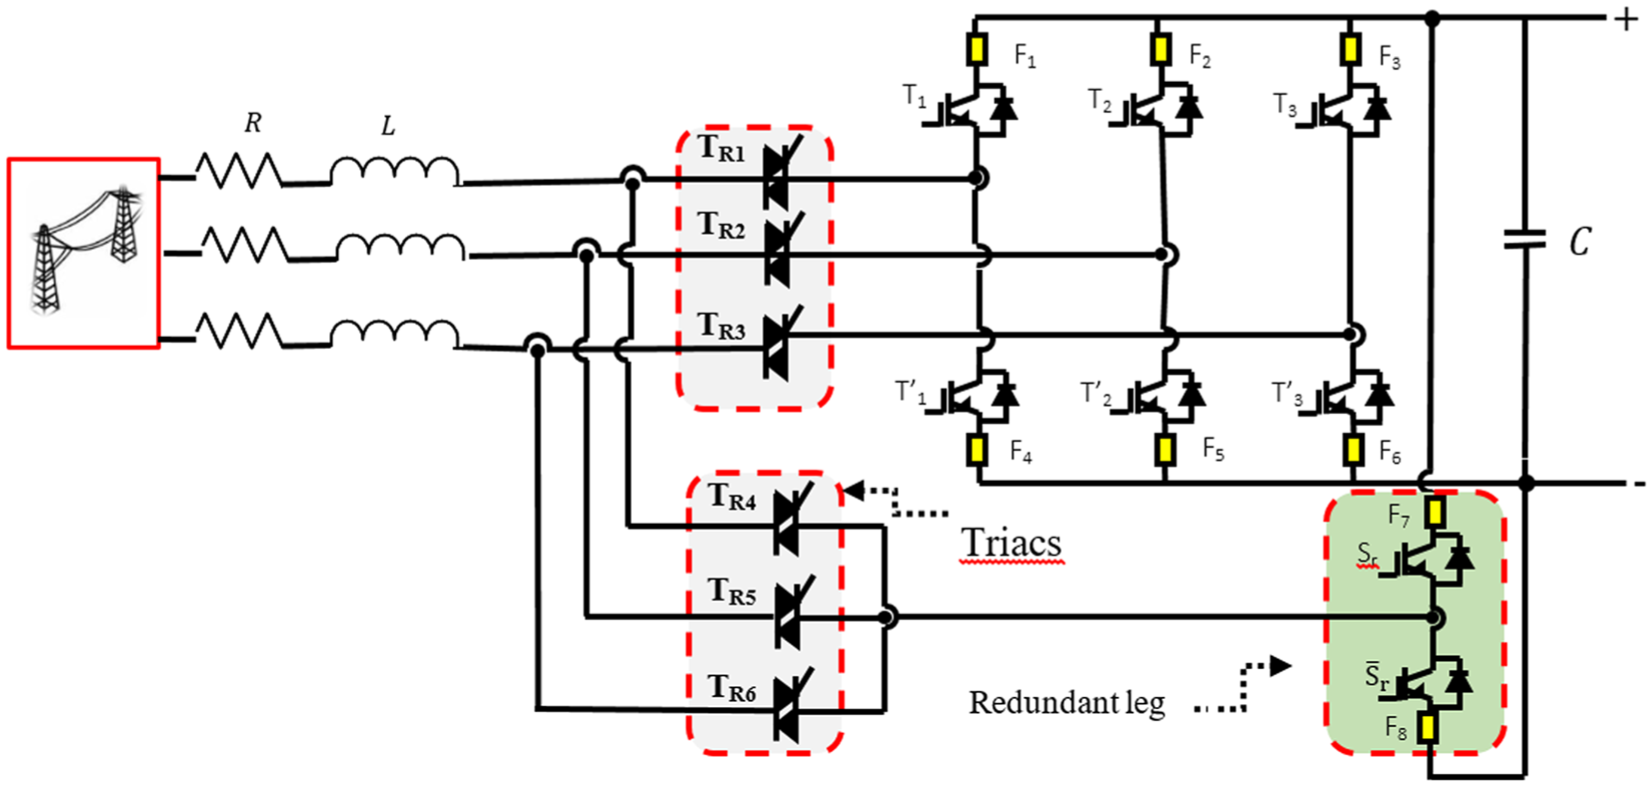
Proposed reconfigurable system.
It is based on a classical converter which consists of three main legs and uses a redundant leg connected by bidirectional switches (Triacs).
The three triacs, TR4, TR5 and TR6, connected between the three grid phases and the redundant arm are used to replace the faulty leg with the redundant leg.
Details on triac specifications
The schematic diagram for generating the control signals of triacs is given by the fig. 11.
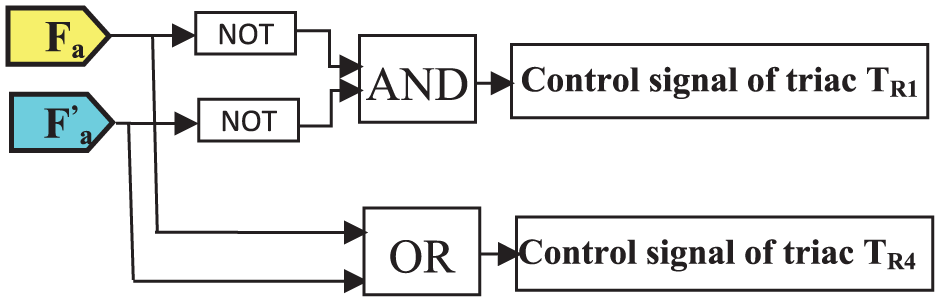
Driver circuit diagram for TRIAC gate control signals.
Figure 12 illustrates a structural scheme that reroutes IGBT gating signals from a fault-affected leg to a fourth redundant leg. Based on FDI algorithm outputs, the faulted leg’s switches are first disabled (gating signals set to zero). Subsequently, the redundant leg switches assume control using the original faulted leg’s gating signals, functionally replacing the compromised switches.
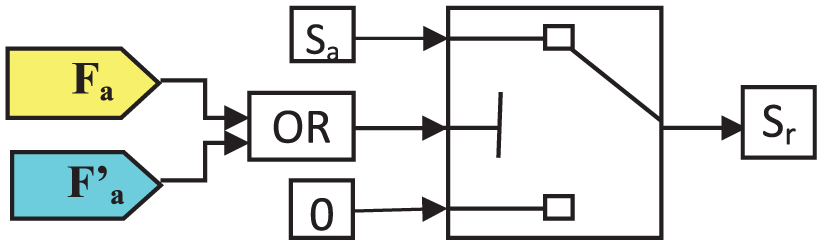
Circuit architecture for rerouting gate signals from a faulted converter leg to a fourth redundant leg.
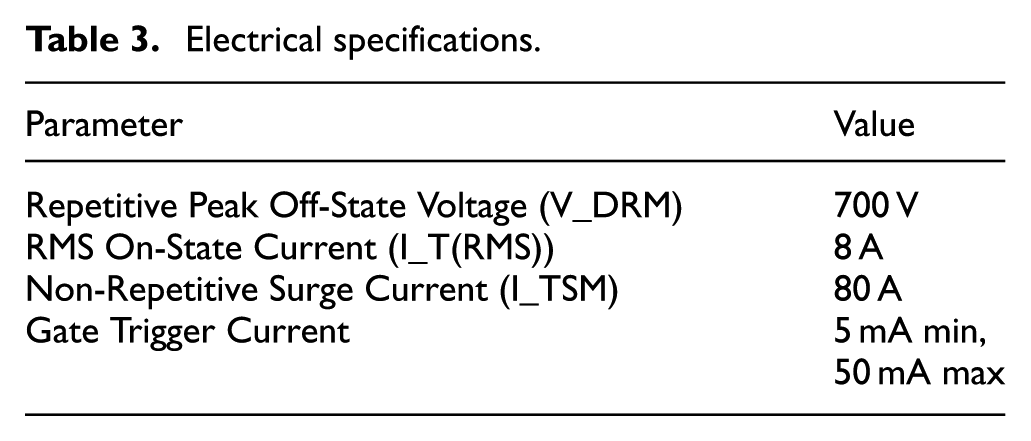
The detailed specifications for the
Electrical specifications.
Cost of a redundant leg topology
According to the reference 27 to calculate the total cost of each fault-tolerant isolation method, we sum the base converter cost (1.00 power unit) and the additional component costs as shown in Table 4.
Lists these additional costs.
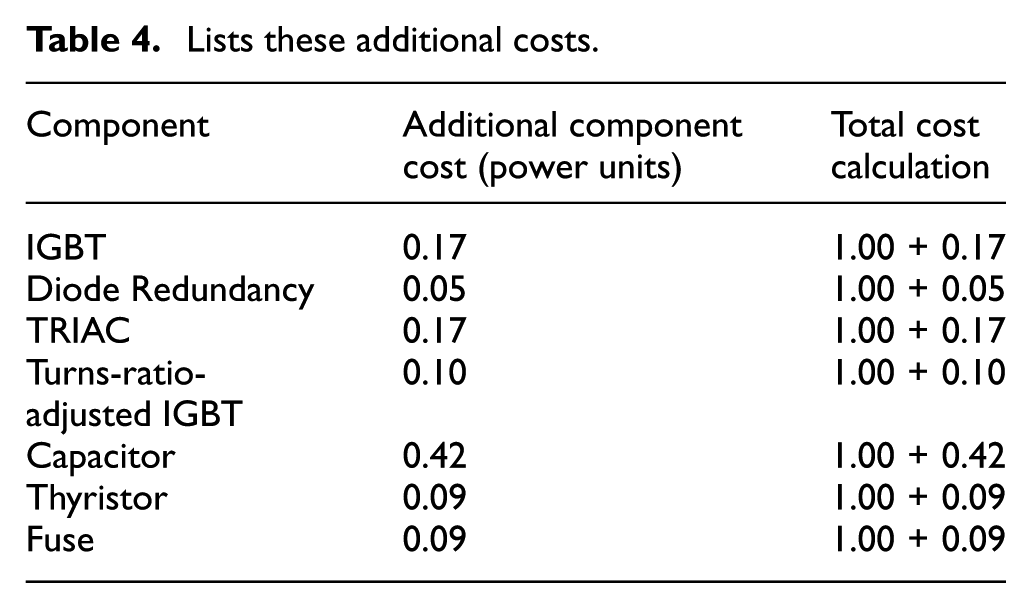
Total Cost Interpretation for IGBT + Diode Redundancy
To calculate the
IGBT + Diode Isolation (Redondant Leg)
This redundancy approach delivers premium fault tolerance at a 44% cost premium, with the most significant expenses coming from duplicate power semiconductors and their support systems. Fault tolerance improves reliability but adds to the cost.
The investment becomes justifiable when system failures carry substantial financial or safety consequences.
Simulation Results of IGBT open-circuit fault
This section evaluates the simulation results obtained by the proposed method for the diagnosis of open switch faults of the grid side converter. In this setup, the solar irradiance is varied randomly to simulate normal daily solar changes, while the temperature keeps constant at 25°C during the simulation time of 8 s. The system components and parameters of controllers are indicated in Table 5.
Simulation parameters.
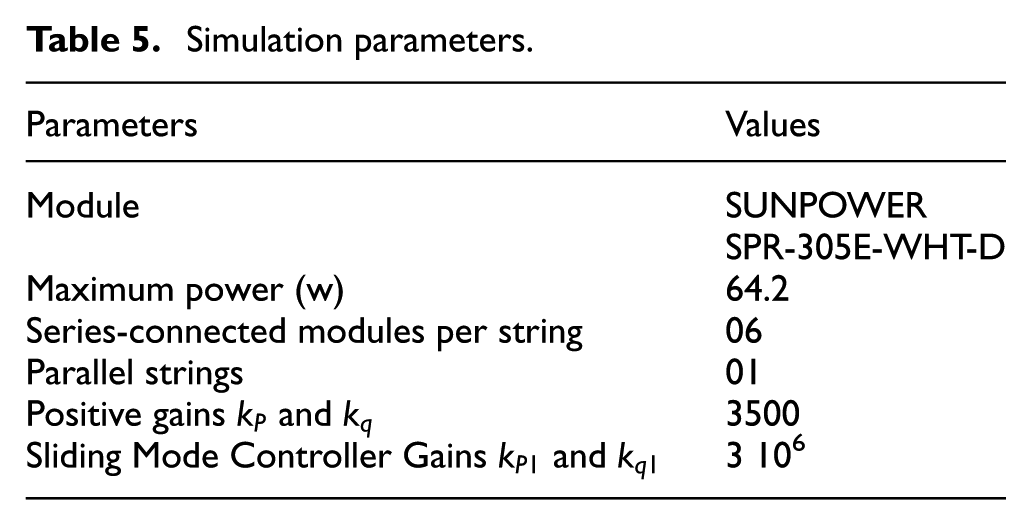
It is important to note that all simulations were conducted using a reduced timescale to optimize computation time within the MATLAB/Simulink environment. Specifically, the solar irradiation cycle, which normally spans 8 h, was compressed to approximately 8 s. Accordingly, we employed a solar irradiation profile, as illustrated in Fig. 13(a), representing an 8-hour cycle but simulated over a duration of just 8 s.
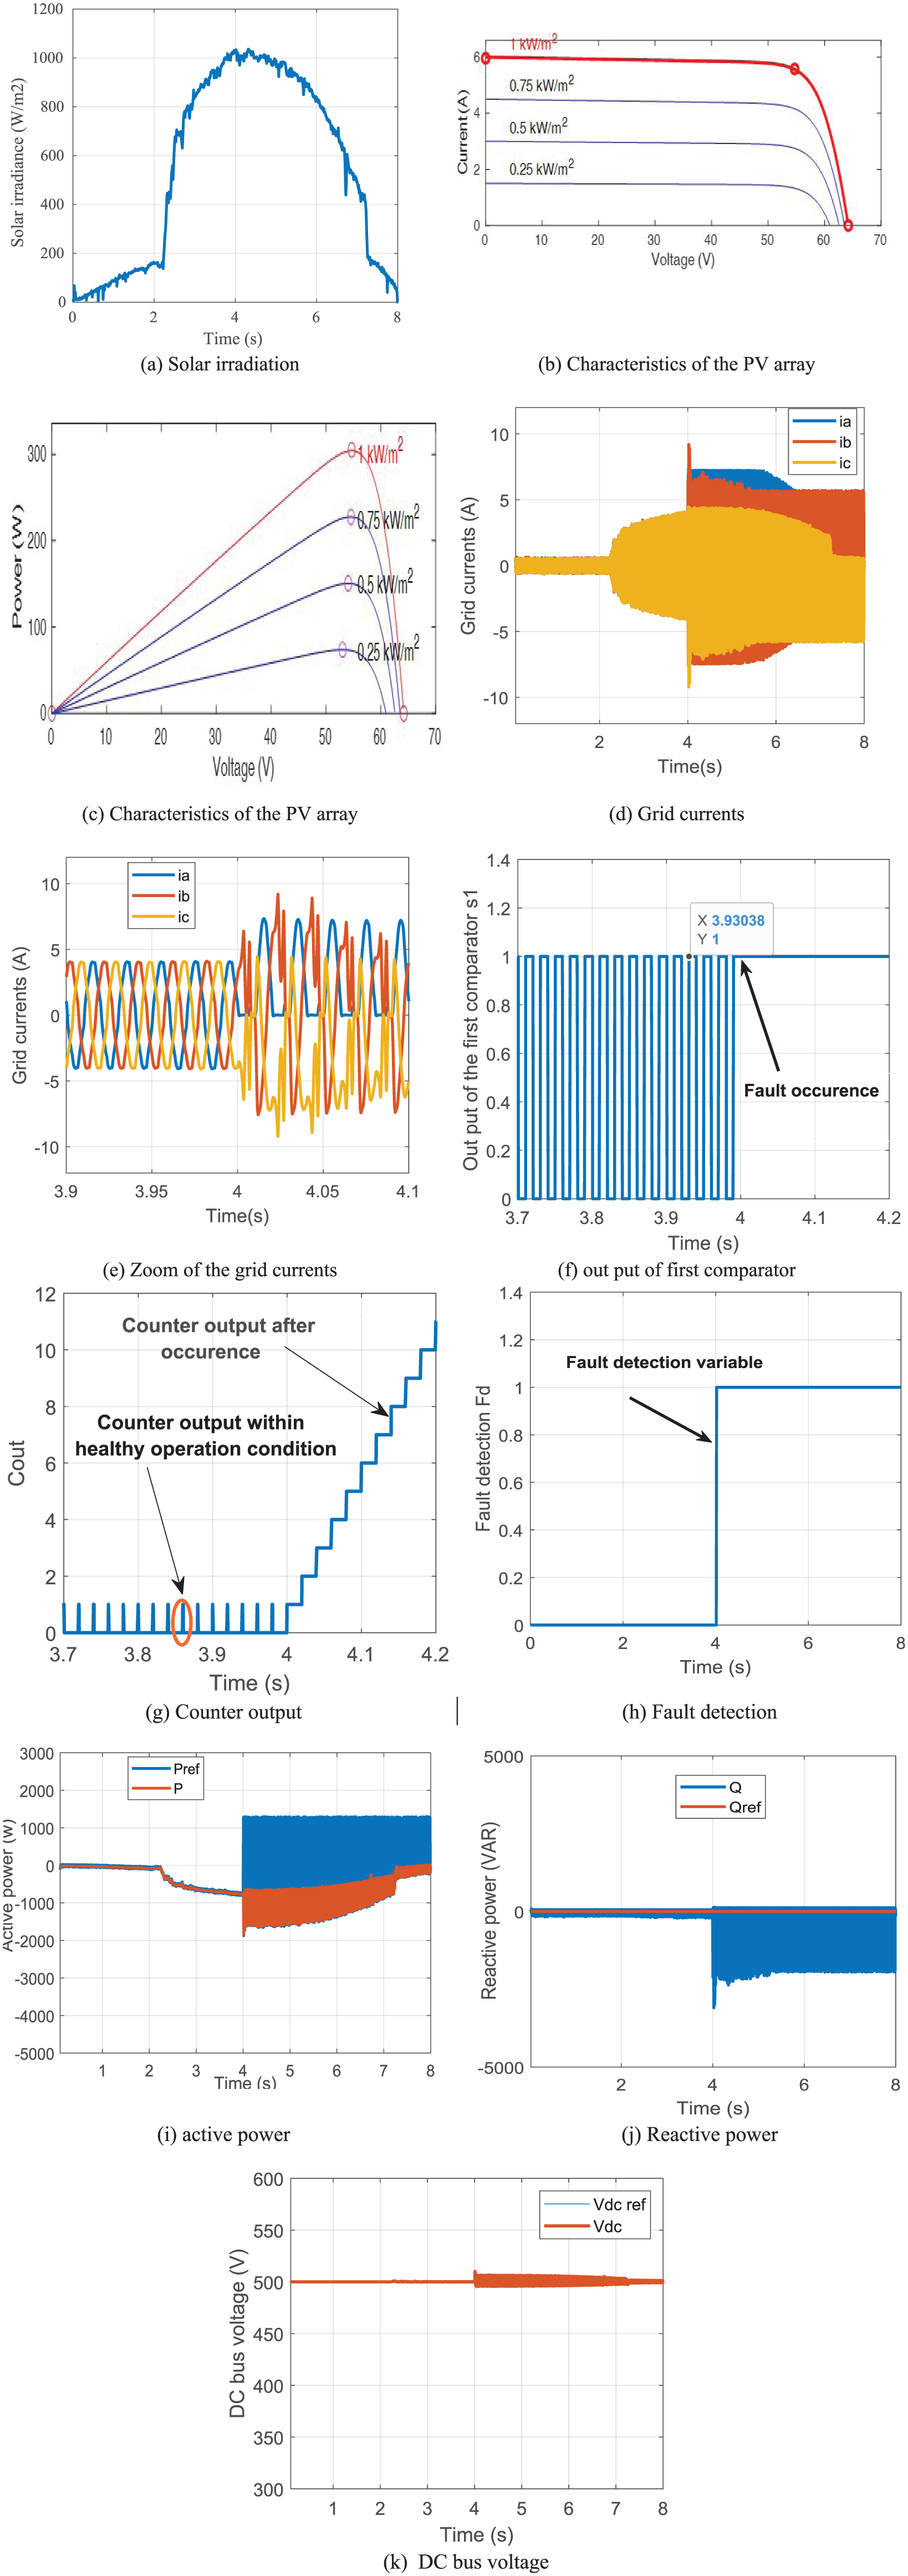
Simulation results of an open-switch fault in GSC: (a) Solar irradiation, (b) Characteristics of the PV array, (c) Characteristics of the PV array, (d) Grid currents, (e) Zoom of the grid currents. (f) out put of first comparator, (g) Counter output, (h) Fault detection, (i) active power, (j) Reactive power, (k) DC bus voltage.
To show the variable irradiance performance with the MPPT, the PV system connected to the proposed network has been implemented in Matlab/Simulink. The Ipv-Vpv and Ppv-Vpv characteristics of the PV module are proved in Figure 13(b) and (c). Figures 13(b) and (e) show the three-phase grid currents. When the open circuit fault, is applied to the upper switch of the first leg, we notice that the positive half- wave of the current ia is removed after fault injection, and this fault introduces significant distortions and oscillations in the other two currents ib and ic. The waveform in Figure 13(g) indicates that the counter output is proportional, modulo the clock period, to the duration during which the comparator output is high. Figure 13 (i) and (j) reports the results for active and reactive power control. In normal operating condition, the reactive power was maintained at 0-unit power factor, throughout the simulation. As can be seen, both the active power is well controlled during solar variations. After the fault occurrence, it is observable that the active and reactive power are caused very oscillations.
Experimental results provided by the Grid Side Converter
Experimental setup
In order to confirm the theoretical study expressed in the previous sections. The schematic of the experimental system of the test bench are shown in Figure 14.
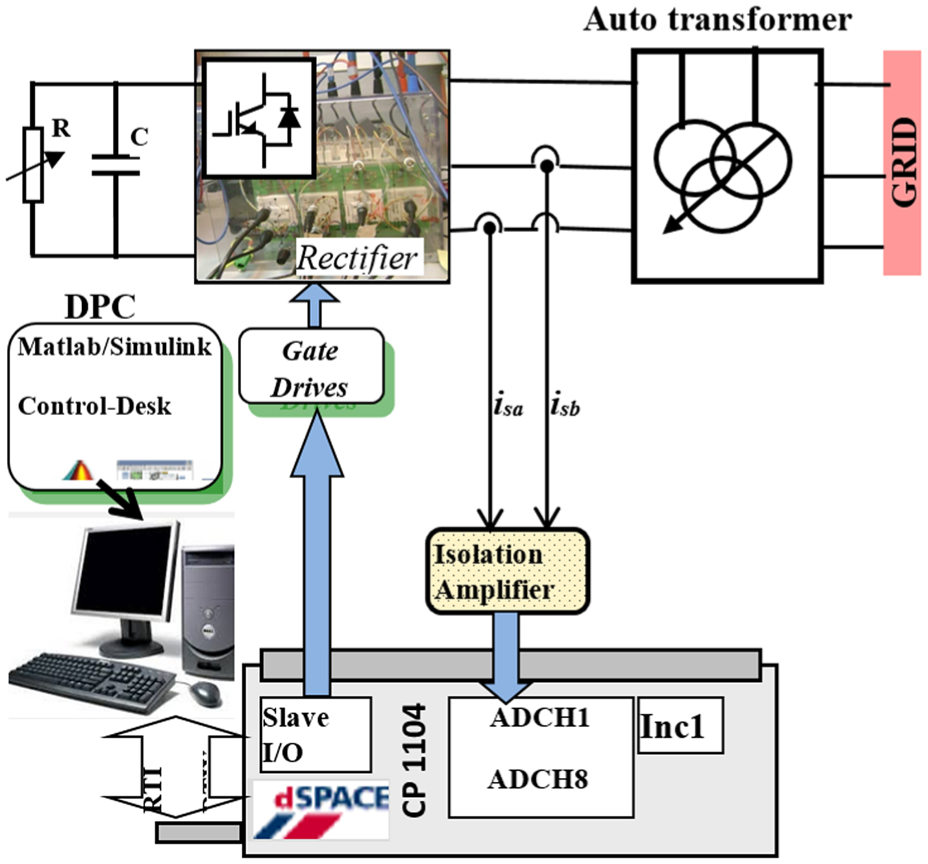
Synoptic of the experimental setup.
The test bench consists of two primary components: an electrical section and a control section. The electrical section features a three-phase power electronic converter based on SEMIKRON SKM50GB123D insulated gate bipolar transistors (IGBTs), which are rated for 1200 V and 50 A and are configured with antiparallel fast diodes. This section also includes a DC power supply, a three-phase isolation transformer, and a 2200 μF/400 V DC-link capacitor to stabilize the intermediate circuit. The control section incorporates a dSpace DS1104 controller board, which serves as a comprehensive real-time control platform. At its core, the system features a PowerPC 603e floating-point processor operating at 250 MHz for primary computation tasks. To enhance I/O capabilities, the board integrates a slave DSP subsystem utilizing a TMS320F240 DSP microcontroller running at 20 MHz, enabling advanced signal processing and peripheral interfacing. This hardware configuration provides robust real-time control performance suitable for demanding power electronics applications.
Experimental results of IGBT open-circuit fault T1
In order to verify the feasibility of the diagnosis approach, an experimental test under normal operation mode has been performed. An open-circuit fault of transistor T1 is introduced at
Figure 15. Presents the active and reactive power, the grid currents, the dc voltage, the diagnostic variables and the fault detection variable Fd.
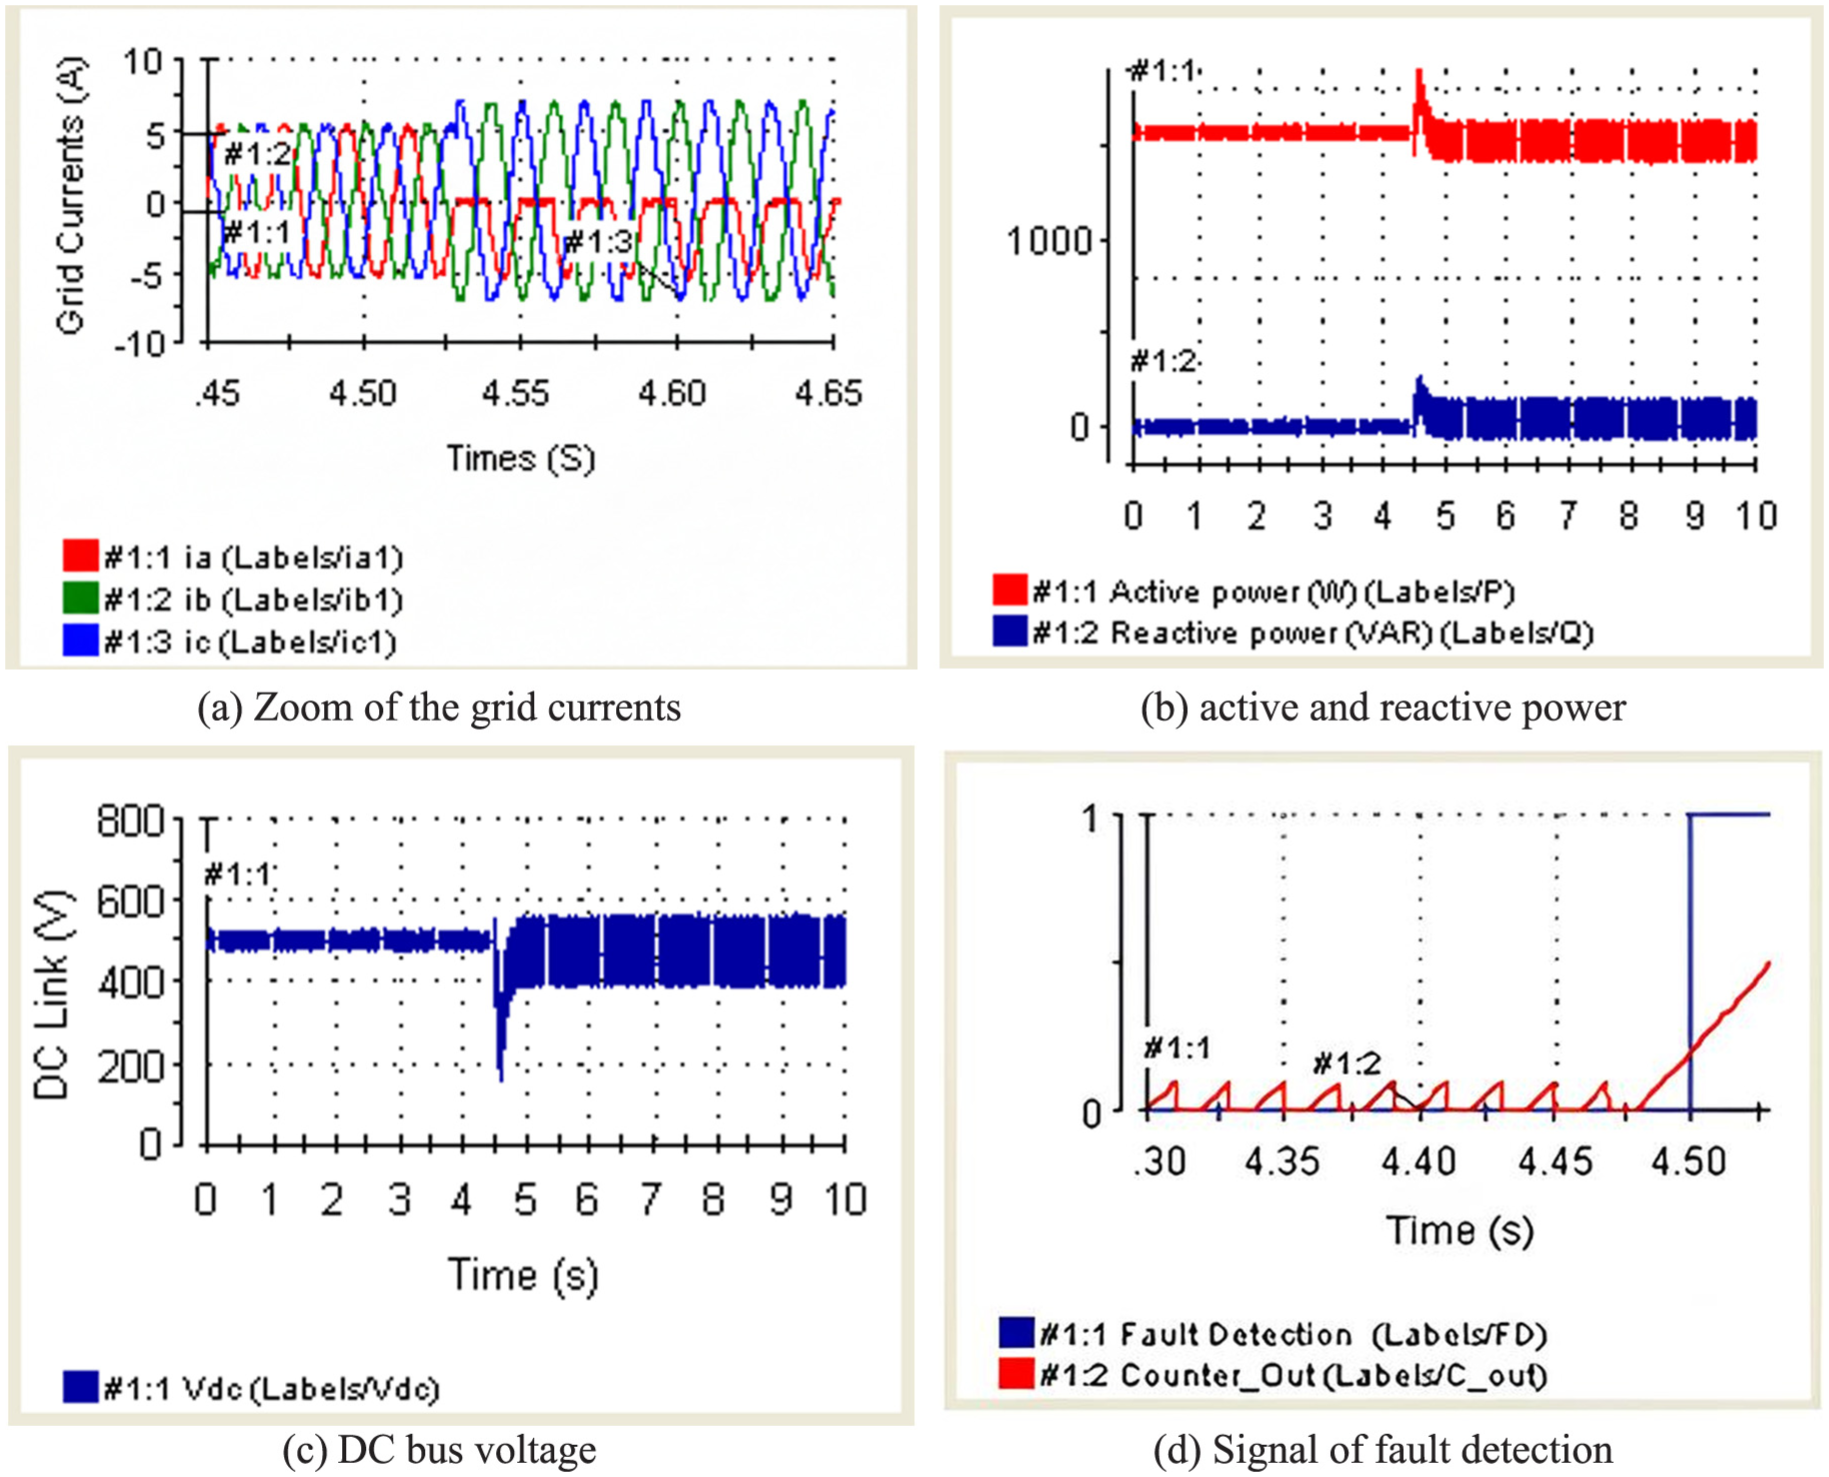
Experimental results for an open circuit fault of the upper IGBT of the first leg: (a) Zoom of the grid currents, (b) active and reactive power, (c) DC bus voltage, and (d) Signal of fault detection.
After the fault occurrence, which manifested by an open circuit fault the positive half wave of the grid current ia was eliminated, while ib and ic undergoes slight deformation with considerable increases at the amplitude levels, as shown in Figure 15(a). Figure 15(d) shows the waveform of the output of the counter and the fault detection signal. This shape depends on the modulo of the clock period and the output signal of the first comparator. Therefore, the switch open fault of T1 is detected using a “current and time criterion.” Figure 15(b) shows experimental results of the active and reactive power. Figure 15(c) shows that the occurrence of faults in the first leg of the inverter produces DC-link voltage oscillations which cause abnormalities in the power injected into the grid. During healthy mode, the active power is maintained constant equal to 1500 W and the reactive power remains constant around 0 VAr because of unity power factor operation command, after the fault occurrence, the results in Figure 15(b) show that the active and reactive power exhibit oscillations.
Simulation results of Grid-Side fault-tolerant power converter topology
In this section, simulation results of real fault-tolerant control for the grid-side converter are shown and interpreted. The simulation evaluates the effectiveness of fault detection and reconfiguration mechanisms incorporated into the converter system before and after the failure of switch T1 of the first phase at instant t = 4 s. Figure 16(a) illustrates the line currents, which are almost sinusoidal, when we apply an open circuit fault on the transistor T1 at the instant t = 4 s, we will have oscillations. After 4 ms, the fault is detected by the fault-diagnosis algorithm and the converter reconfiguration is performed. Figure 16(b) and (c) shows the active and the reactive power waveforms before and after fault apparition with control reconfiguration. After control reconfiguration, the active power has the same shape as the solar radiation profile on the other hand the grid reactive power factor is equal to 0.
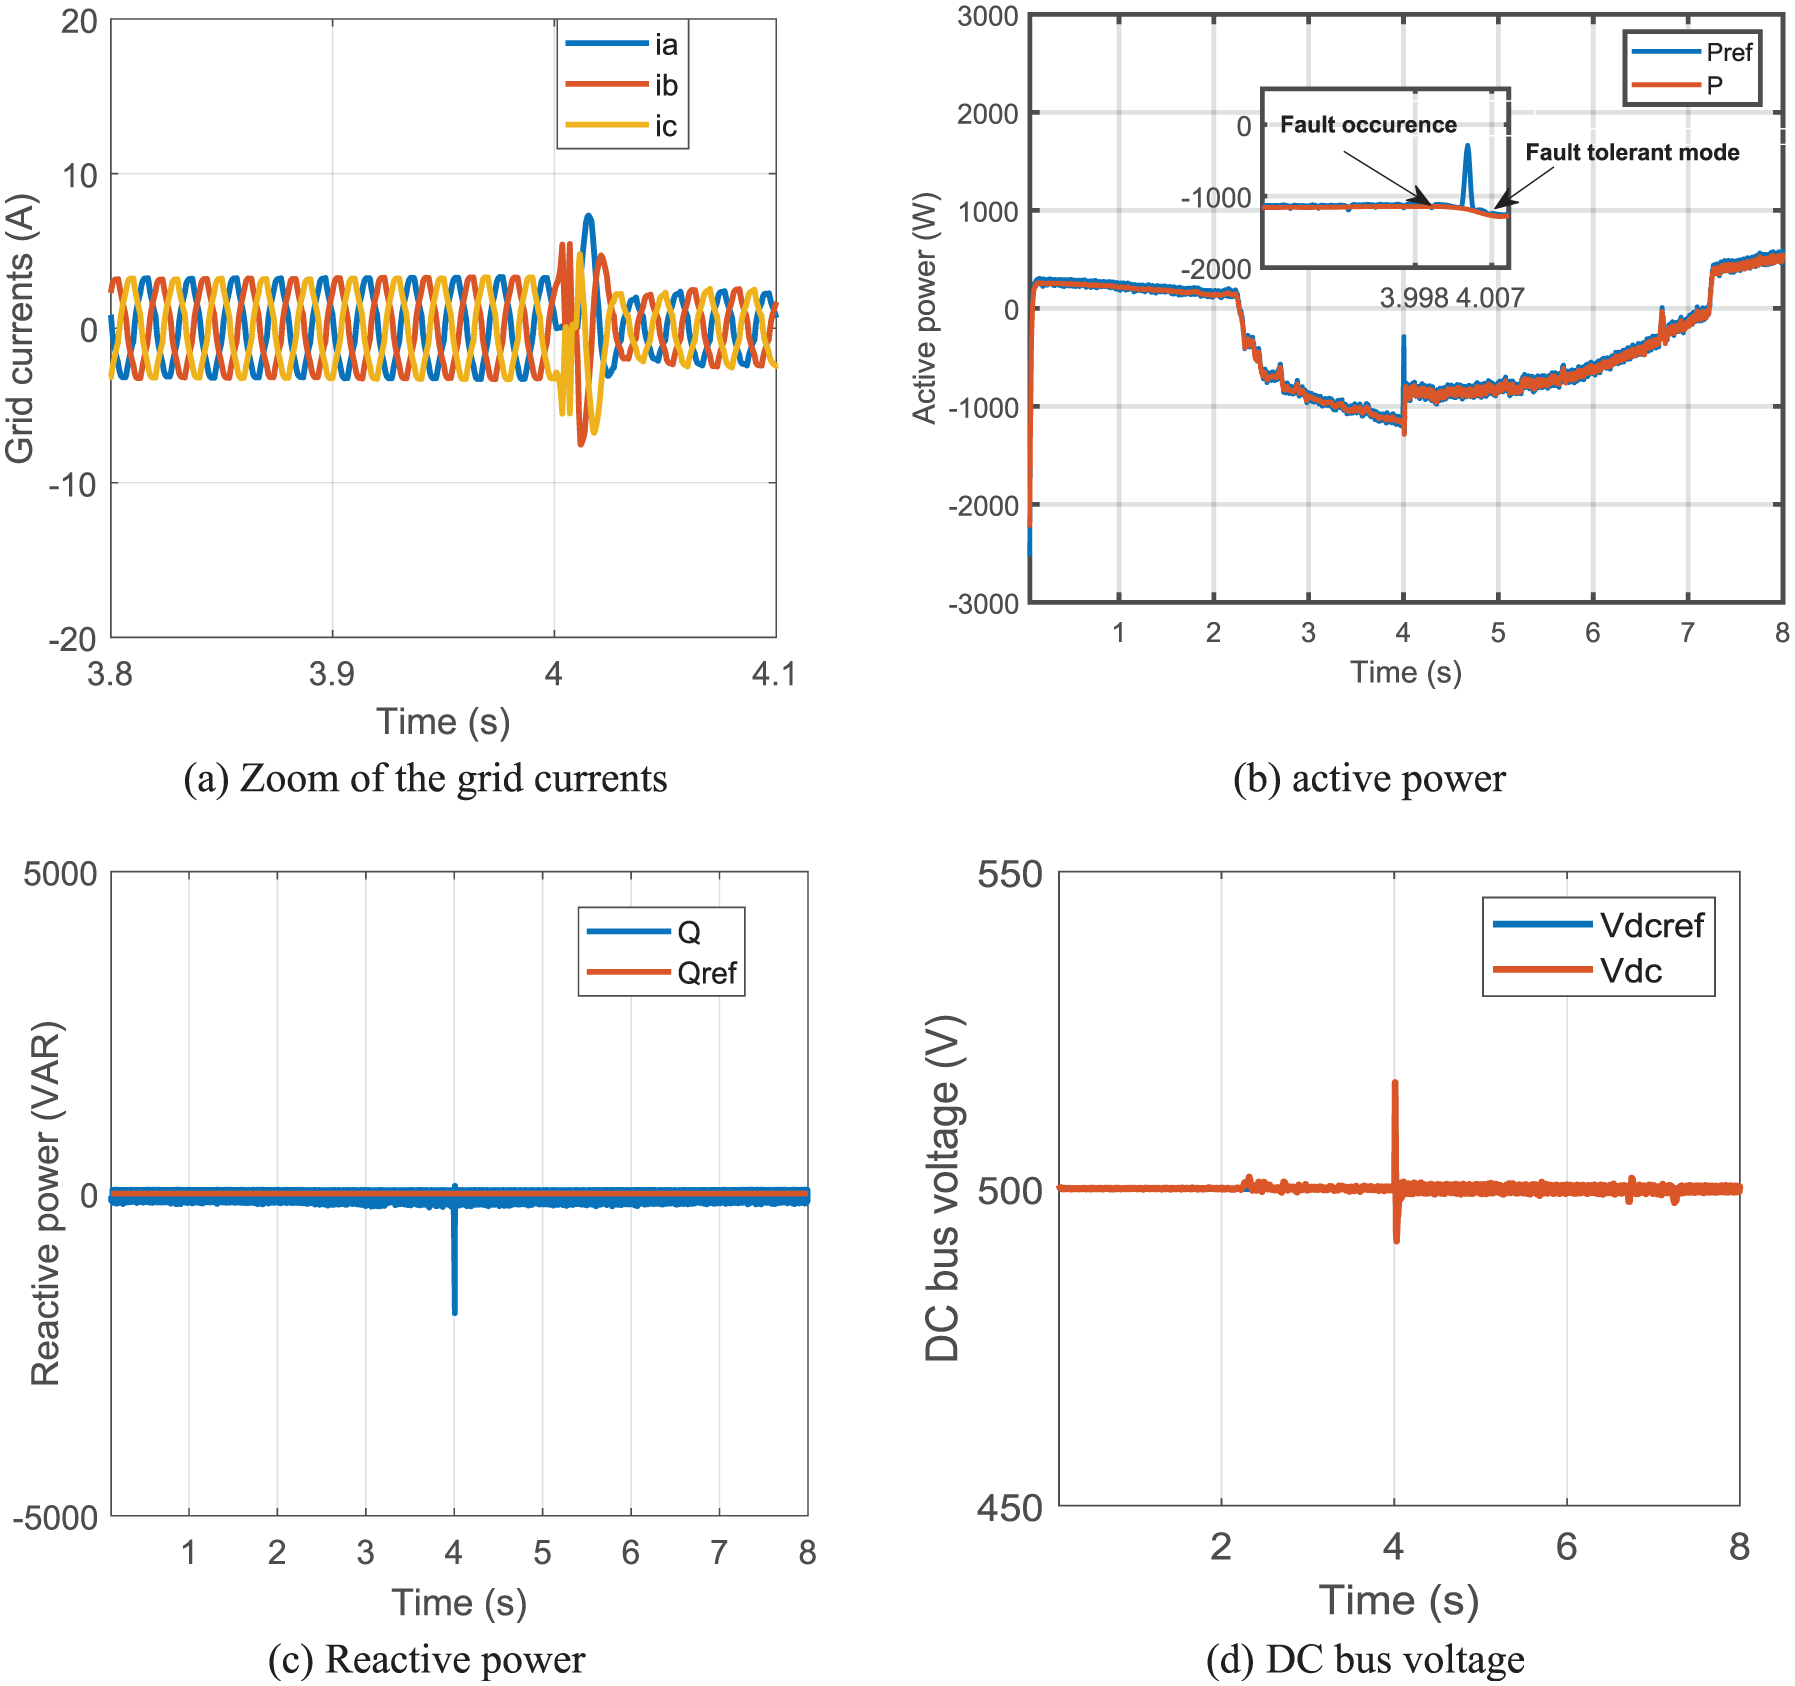
Simulink model of proposed with fault-tolerant control: (a) Zoom of the grid currents, (b) active power, (c) Reactive power, (d) DC bus voltage.
The response of the DC link voltage is depicted in the Figure 16(d), where Vdcref is the reference voltage for the DC link voltage. The DC voltage is well regulated during normal operation before the fault is introduced at t = 4 s, after open-switch fault occurrence, the DC link voltage is increased. When fault-tolerant operation is used, the DC link voltage returns to steady-state again as like as the normal operation.
Comparison with existing works and limitations of this work
This section presents a comparative analysis of the proposed algorithm against existing open-circuit fault diagnosis techniques. Table 4 summarizes key evaluation metrics, including fault detection time, diagnostic parameters, effectiveness, and implementation complexity. The results illuminate both the strengths and weaknesses of each approach
Fault Detection Time (FDT): FDT, defined as the time interval between the onset of a fault and its isolation, is dependent on the detection algorithm’s complexity and its ability to withstand noise. The threshold, which is set based on these factors, allows for a rapid fault detection time of 4 ms.
Effectiveness: Experimental results demonstrate the proposed diagnosis approach's ability to effectively detect single IGBT open-circuit faults.
Implementation Effort (IE): The fault diagnosis process leverages simple hardware, making it easily integrable into existing converter systems.
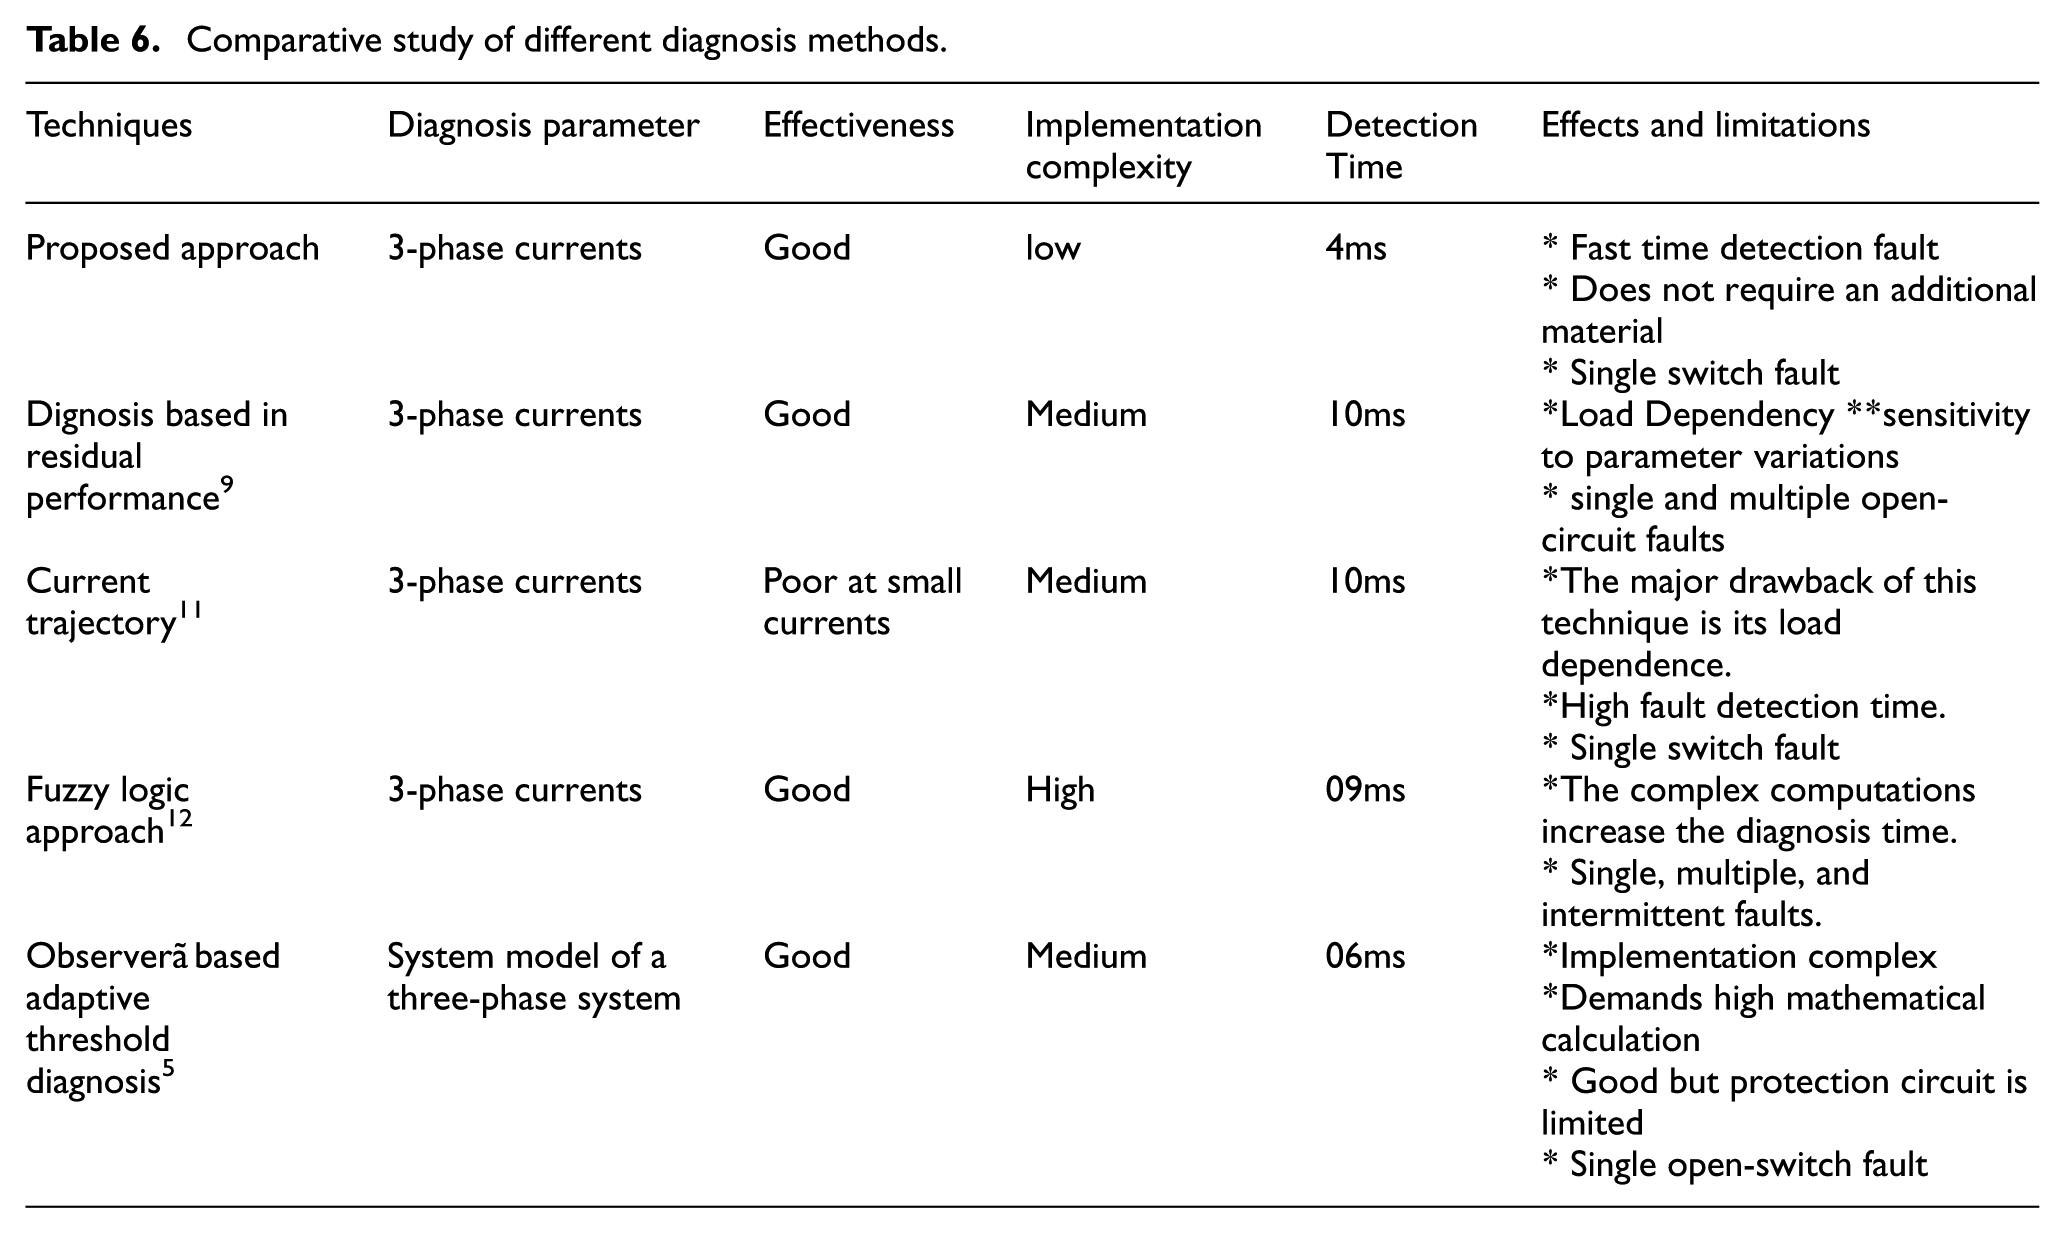
Each diagnosis technique presented in Table 6 has trade-offs between speed, complexity, and applicability, making the choice dependent on specific system requirements. The diagnosis techniques exhibit varying effects and limitations. The Proposed Approach offers fast detection (4 ms) without extra hardware but is limited to single switch faults. The Average Model-Single-Phase Inverter is robust against noise and power changes but only works for single-phase systems. The Current Trajectory method struggles with small currents, is load-dependent, and has slow detection (10 ms). The Fuzzy Logic Approach handles multiple fault types but suffers from high computational complexity and longer diagnosis time (9ms). Lastly, the Observer-Based Adaptive Threshold provides good accuracy but demands complex calculations and is restricted to single switch faults. Each method balances speed, complexity, and applicability, with trade-offs depending on system needs.
Comparative study of different diagnosis methods.
Conclusion
This paper proposes a fault-tolerant control of a grid-connected photovoltaic system for grid-side converter (GSC). In case of open IGBT faults, the closed-loop control system affects the characteristics of the active and reactive power fed into the grid. The proposed strategy is composed of the fault detection and fault tolerant control. The fault detection is based on a fast counter-based diagnosis approach for open switch failure. The proposed reconfigurable control is used a redundant leg. Furthermore, the proposed FD algorithm is capable to replacing the faulty leg by the redundant leg after the open circuit switch fault in a short time.
The performances and effectiveness of the proposed algorithm FD have is verified through simulations and experimental implementation. The proposed FDI process is much faster. The proposed FTS is capable of quickly detecting the single open-circuit faults.
Footnotes
Nomenclature
IPV, VPV The output current and voltage [A, V]
Vpv Input voltage of the boost converter
Iph The current produced by the incident light
Is The reverse saturation or leakage
Rs The equivalent series resistance
Rsh The equivalent parallel resistance
α The duty cycle
Vdc output voltage of the boost converter
P, Q Active and reactive power
Pref, Qref Reference active and reactive power
L Grid filter inductance.
KP, Kq The positive control gains.
Acknowledgements
We would like to express our sincere gratitude to Dr Hechmi Ben Azza my Supervisor for their invaluable guidance, support, and expertise throughout the course of this research project. Additionally, we extend our appreciation to the entire laboratory team for their collaboration, dedication, and contributions, which were instrumental in the successful completion of this study: Yosra Sami.
Ethical Considerations
This manuscript is the authors own work, which has not been published or currently being considered elsewhere for publication. The authors own contribution in research and analysis of the problem is presented in a truthful manner. All citation sources are disclosed properly. The contribution of all authors have been actively involved in this work.
Data availability statement
Within the scope of this study, all utilized data and relevant materials are available upon request from the authors