
Abstract
The increasing demand for electric power, coupled with rapid urbanization, necessitates a reliable and high-quality electricity supply to meet consumer expectations. However, existing passive distribution systems are inadequate to address the escalating power requirements, resulting in challenges such as increased power losses and suboptimal voltage profiles. In the base case scenario, the total active and reactive power losses were substantial, and many buses exhibited voltage magnitudes that fell outside acceptable limits. This study investigates the optimal placement and sizing of distributed generation (DG) resources to improve the performance of distribution feeders. A multi-objective optimization framework, utilizing a Genetic Algorithm (GA), was developed to minimize power losses and enhance voltage profiles. Load flow analysis was conducted using the Backward/Forward Sweep (BFS) method, allowing for precise evaluation of the distribution feeder under various DG configurations. Consequently, the study successfully enhanced the system through optimal DG allocation. Additionally, a comparative analysis was conducted to assess the performance of the proposed GA algorithm against other optimization techniques. The results indicate that, in nearly all cases, the GA method outperforms PSO by reducing system power losses and improving the voltage profile more effectively.
Keywords
Introduction
The power system comprises three key components: the generation system, transmission system, and distribution system. The distribution network usually includes feeders configured in a radial layout, as well as distributors and service mains. In contemporary scenarios, the rapid increase in load and electricity demand has led to higher power losses, voltage drops, and stability challenges within the system. These issues are further aggravated by the extensive reach and complexity of the distribution system. To tackle these pressing challenges, integrating renewable-based Distributed Generation (DG) has become a critical solution. 1 Distributed Generation (DG) consists of small-scale, decentralized power generation systems integrated into the existing grid near load centers or within distribution networks, enhancing local energy supply and improving grid performance. 2 Studies show that roughly 13% of the total generated power is lost as active power in the distribution system. 3 Distributed Generation (DG) refers to active power sources installed at points of common coupling (PCC) in the distribution network or on customer premises. 4 The integration of Distributed Generation (DG) into electrical power distribution networks is gaining popularity due to its ability to reduce power losses and enhance voltage profiles. 5 Integrating DG into the distribution network aims to minimize system losses, enhance voltage profiles, defer costly system upgrades, and improve the reliability and overall performance of the distribution system. However, achieving these benefits depends critically on the optimal placement of DG units within the network. Suboptimal placement can lead to increased power losses and voltage instability. 6 DG systems can be categorized into four types based on their real and reactive power injection capabilities. 7 :
This study focuses on renewable-based photovoltaic (PV) DG, which injects only real power and operates at unity power factor. While numerous methods have been proposed to enhance distribution systems, significant research gaps still exist. These gaps include:
✓ A limited focus on addressing reactive power losses in conjunction with active power loss minimization.
✓ A lack of studies examining the simultaneous impact of active and reactive power integration.
✓ Insufficient real-world applications, as most studies rely heavily on IEEE bus systems for validation.
✓ Challenges associated with the normalization and assignment of weight factors in multi-objective optimization problems.
Many studies have investigated different approaches to enhance distribution systems through power loss reduction and voltage profile improvement. The studies by Krishneel Prakash et al. and Salam et al.,1,8 focused on the simultaneous analysis of the optimal placement and sizing of DG and D-STATCOM to minimize power losses and improve voltage profiles. This was achieved using the Artificial Fish Swarm Optimization Algorithm (AFSOA), with the results validated on the IEEE 33-bus system. In the research work of Mosaad, 9 the placement and size of photovoltaic (PV) systems optimization in Radial Distribution Systems (RDS) using the Arithmetic Optimization Algorithm (AOA) is discussed. The study compares AOA with Particle Swarm Optimization (PSO) using the IEEE 31-bus system, showing that AOA outperforms PSO in reducing power losses and improving system performance. The work of Alende, 10 optimizes the Yirgalem-Ethiopia distribution network using the SALP Swarm Algorithm (SSA) and solar-based Distributed Generation (DG). SSA achieves better outcomes in reducing power losses, improving voltage profiles, and minimizing costs. Simulations confirm its effectiveness in maintaining IEEE voltage standards and identifying solar as the most feasible energy source for the region. In Rani and Reddy 11 work, binary particle swarm optimization (BPSO) was employed for optimal placement and sizing of multiple DG units in distribution systems, focusing on real power loss minimization and voltage profile enhancement, tested on the IEEE 69 bus system, though reactive power loss was not addressed. In Adegoke et al., 12 voltage instability in power systems due to poor maintenance and financial constraints is addressed. It highlights the importance of the optimal placement of distributed generation (DG), such as solar and wind, to improve voltage stability and reduce power losses. In Addurat and Pasupuleti, 13 the impact of multiple PV DG units on system loss reduction and voltage profile improvement was investigated using MATLAB simulations, showing significant voltage enhancement with increased DG units, yet lacking consideration of reactive power reduction. The study of Mahato et al., 14 optimizes power loss reduction and voltage profile improvement in radial distribution networks by strategically placing capacitors and solar PV-based distributed generation (DG). Using the Genetic Algorithm (GA) for optimization and FBS algorithms for load flow analysis, the approach was tested on an IEEE 33-bus system and a real 11 kV feeder in Nepal. The results showed a 72.91% reduction in real power loss, 63.45% in reactive loss, and a 6.54% increase in voltage, demonstrating significant improvements in efficiency and voltage stability. In Babu Magadum and Kulkarni, 15 it is emphasized that the placement and sizing of multiple distributed generators (DGs) optimization to improve voltage profiles and reduce power losses in distribution networks. It explores cost-effective solutions to meet the growing power demand by incorporating DGs under various loading conditions (100%, 120%, and 140%) to enhance system reliability and efficiency. In Aligbe et al., 16 the usage of Intelligent Water Drop Algorithm to optimize the placement and sizing of Distributed Generation (DG) in the 11 kV 34-bus Ayepe feeder in Nigeria majorly discussed. The results showed a significant increase in the Loss Reduction Index (LRI) from 0.1808 to 0.2636 p.u., with a 5 MW DG placed at bus 14, demonstrating PSO’s effectiveness in reducing power losses. The study of Janamala and Radha Rani 17 focused on enhancing radial distribution efficiency through DG integration to reduce real power loss, using three 11 kV feeders in Bannu as a case study, yet failing to consider voltage profile improvements. In Boukaroura et al., 18 optimal placement and sizing of multiple DG units were achieved using dragonfly optimization techniques, demonstrating reduced active power loss and improved bus voltage across IEEE 33 and 69 bus systems, while neglecting reactive power loss analysis. The research paper of Shawon et al., 19 an optimal placement method for distributed generation (DG) units to reduce energy losses and enable micro grid planning is proposed. Using non-linear programing and AC optimal power flow (OPF), the method was validated on the IEEE 33-bus and Saskatoon’s 404-bus systems. The study of HassanzadehFard and Jalilian, 20 proposed optimal DG placement and sizing in distribution networks considering load growth via PSO, aiming for power loss minimization and total harmonic distortion reduction, using a 31-bus system for validation; however, reactive power loss was not analyzed. Lastly, study of Pandey and Kirmani 21 focused on the optimal allocation and sizing of multiple photovoltaic units for power loss minimization using the crow search algorithm (CSA), without incorporating voltage profile improvement or cost analysis. The study in Hemapala et al. 22 examines the optimal placement and sizing of distributed generation (DG) in micro grids to reduce losses, improve voltage profiles, and enhance profitability. Two types of DG with varying weighting factors were analyzed on a micro grid test bus system, demonstrating effective DG integration for improved performance. In Razak et al., 23 the use of Particle Swarm Optimization (PSO) to optimize the placement and sizing of STATCOMs, reducing power losses in distribution systems, especially in rural areas is highlighted. The approach, applied to a 15-bus IEEE system, shows a 6.058% reduction in power loss compared to a system without PSO optimization. In Eiada and Badran, 24 it is studied about the use of Moth-Flame Optimization (MFO) to optimize the placement and sizing of distributed generation (DG) units, improving voltage profiles and reducing power losses in distribution systems. Tested on the IEEE 33-bus system, MFO demonstrated superior performance compared to other methods, enhancing network reliability and efficiency. The study in Shawon et al., 19 optimizes distributed generation (DG) placement and sizing in power networks using simulations and particle swarm optimization. The results show that properly placed DG units, such as solar and wind, reduce power losses, improve reliability, and enhance efficiency in renewable energy systems. The Abbas et al. 25 study introduces a novel algorithm to optimize distributed generation siting, sizing, and network reconfiguration, reducing energy costs, losses, and voltage deviations. Tested on IEEE systems, it achieves over 22% cost savings, an 80% reduction in voltage deviation, and improved system efficiency. The study investigates the optimal placement and sizing of Distributed Generation (DG) units in a distribution network to minimize power losses using Particle Swarm Optimization (PSO). When applied to a 34-bus Nigerian distribution network, PSO improved the total loss reduction index from 0.1808 p.u. (using the analytical method) to 0.2636 p.u., with the optimal DG placement occurring at bus 14, supplying an active power of 5.00 MW. This demonstrates the effectiveness of PSO in significantly reducing power losses. 26
Additionally, another study focuses on optimizing power loss minimization in an IEEE 33-bus radial distribution system through network reconfiguration and the strategic placement of DG units and capacitors using genetic algorithms. The results indicate that combining DG and capacitors enhances voltage profiles and reduces losses more effectively than either solution alone. These findings were validated through simulations conducted in MATLAB and ETAP. 27 Collectively, these related works suggest numerous opportunities to enhance the performance of distribution networks through optimal DG placement and sizing using various optimization algorithms. While many studies have primarily focused on single-objective functions, they often overlook critical aspects such as reactive power loss reduction, the simultaneous impact of active and reactive power integration, and bus voltage magnitude. Additionally, most investigations rely heavily on IEEE bus systems for case studies, neglecting real-world applications.
This paper aims to bridge these existing research gaps by:
✓ Minimizing system power losses in the distribution network.
✓ Ensuring that voltage profiles remain within permissible standard voltage ranges.
✓ Encouraging the adoption of renewable energy sources among consumers and utilities.
✓ Deferring the costs associated with replacing or upgrading distribution feeders.
The novelty of this work lies in its approach to optimizing the allocation and sizing of Distributed Generation (DG) units using the Genetic Algorithm (GA) method, specifically tailored for the Kombolcha-I substation’s outgoing feeder. Unlike previous studies, this research employs multi-objective optimization with normalized sub-objectives to simultaneously reduce active and reactive power losses while improving voltage profiles. Furthermore, it utilizes a practical, real-world distribution system rather than relying solely on standardized IEEE bus systems for validation. In summary, this study addresses key challenges in enhancing distribution network performance, offering valuable insights and actionable solutions for both researchers and industry practitioners. The contributions and methodology of this study serve as a robust foundation for future research in this domain. In recent years, several advanced optimization algorithms have gained attention in the field of DG allocation and sizing. Notable methods include Garra Rufa optimization and Gray Wolf Optimization (GWO), both of which have shown promising results in enhancing system performance. These algorithms are particularly valued for their ability to efficiently navigate complex and non-linear search spaces, offering improved solutions for power loss reduction and voltage profile enhancement. 28
This work contributes to societal well-being and practical applications by enhancing the efficiency and reliability of power distribution systems. By minimizing power losses and improving voltage profiles, it reduces energy wastage, leading to cost savings for utilities and end-users. The optimized integration of Distributed Generations (DGs) supports the adoption of renewable energy, promoting sustainability and reducing environmental impact. Practitioners can use the proposed methodology to design resilient and cost-effective distribution networks, addressing the growing demand for electricity in urban and rural areas.
Distribution network
Kombolcha town is located in the Amhara Regional State, within the South Wollo Zone, serving as the capital city of Kallu Woreda in Ethiopia. Situated on the main road connecting Addis Ababa to Dessie-Woldiaya, it lies 364 km north of Addis Ababa. The town’s electrical infrastructure is supported by the Kombolcha-I substation, which utilizes three winding transformers to step down 132 kV voltages into 132/66/15 kV levels. This substation has eight 15 kV, two 66 kV, and one 132 kV outgoing feeders, receiving power via 132 kV lines from the Kombolcha-II substation.
For this study, Feeder Three of the Kombolcha-I substation was selected due to its high peak load and extensive coverage, which contributes to significant bus voltage drops and power losses. This radial feeder spans 41.2 km and serves 138 buses, including 74 distribution transformers. Bus-1 is designated as the slack or reference bus, as illustrated in Figure 1. Detailed data, such as branch lengths, conductor types, overhead line configurations, load profiles, and total transformer capacities, were obtained from the Ethiopian Electric Utility Kombolcha Center.
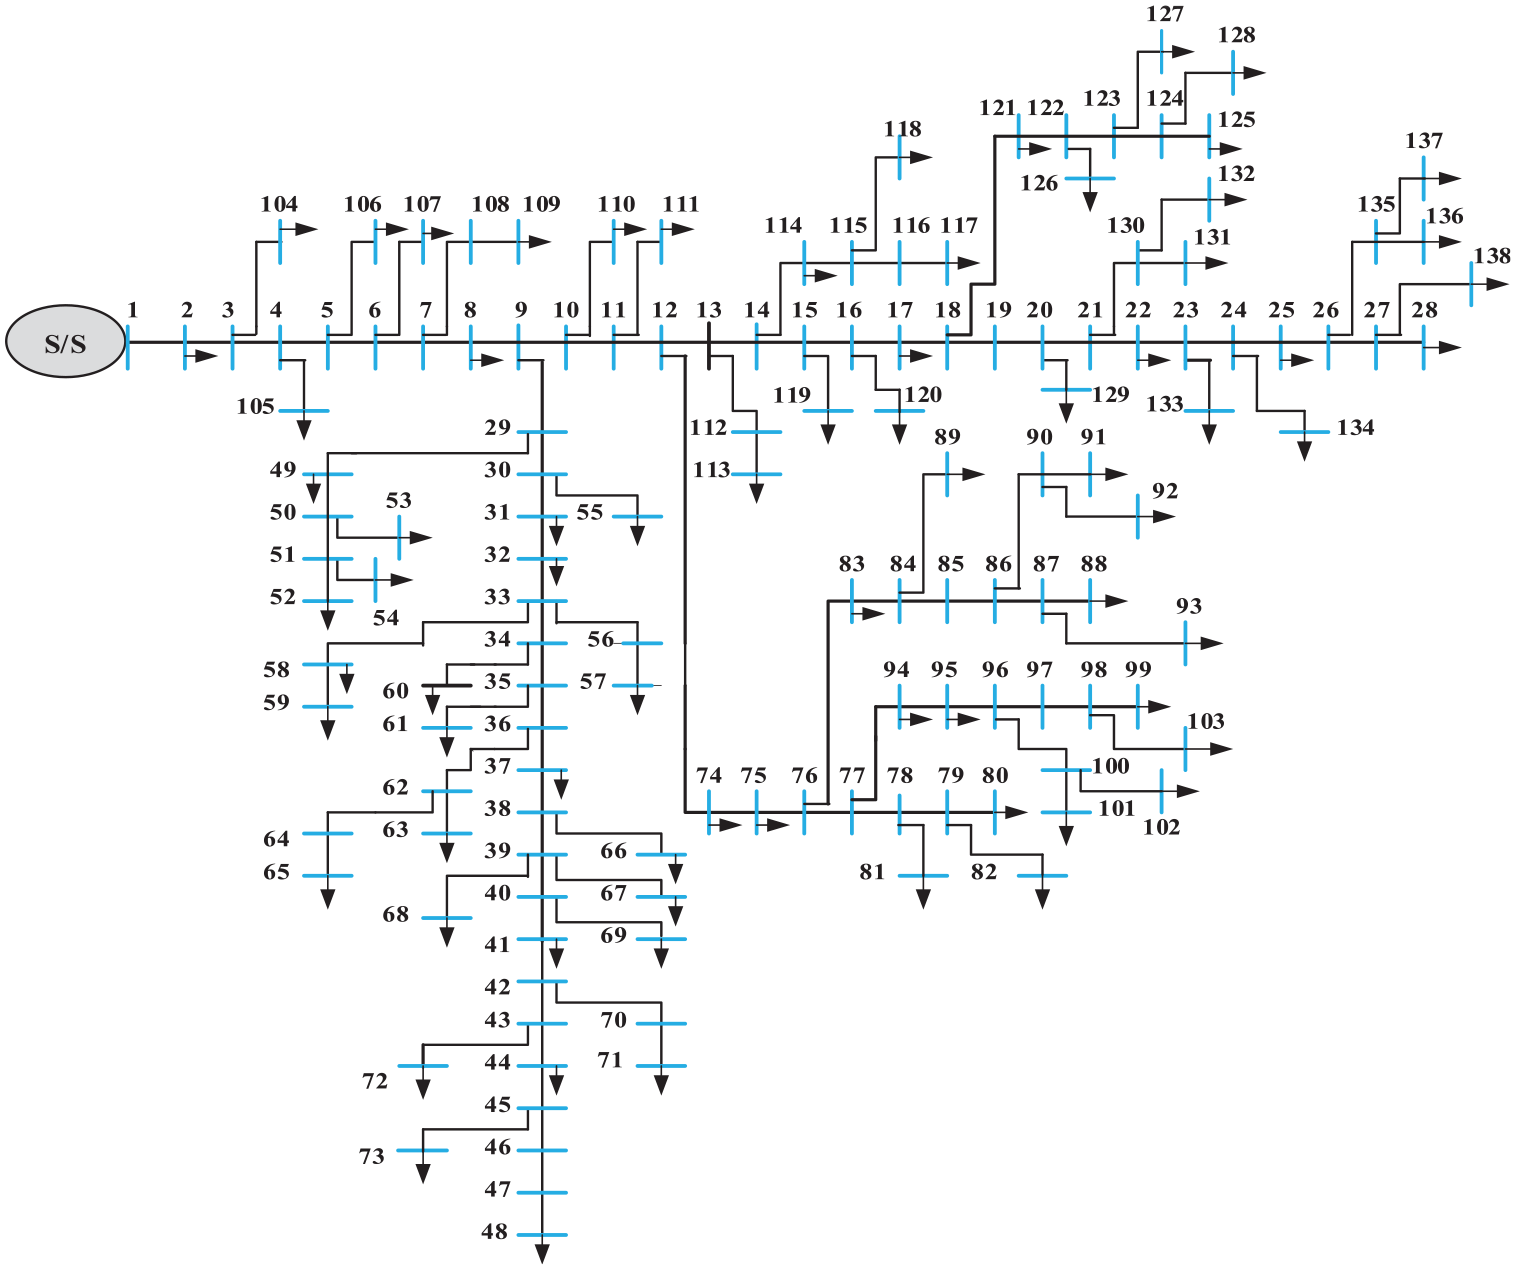
One-line diagram of Kombolcha-I substation feeder three.
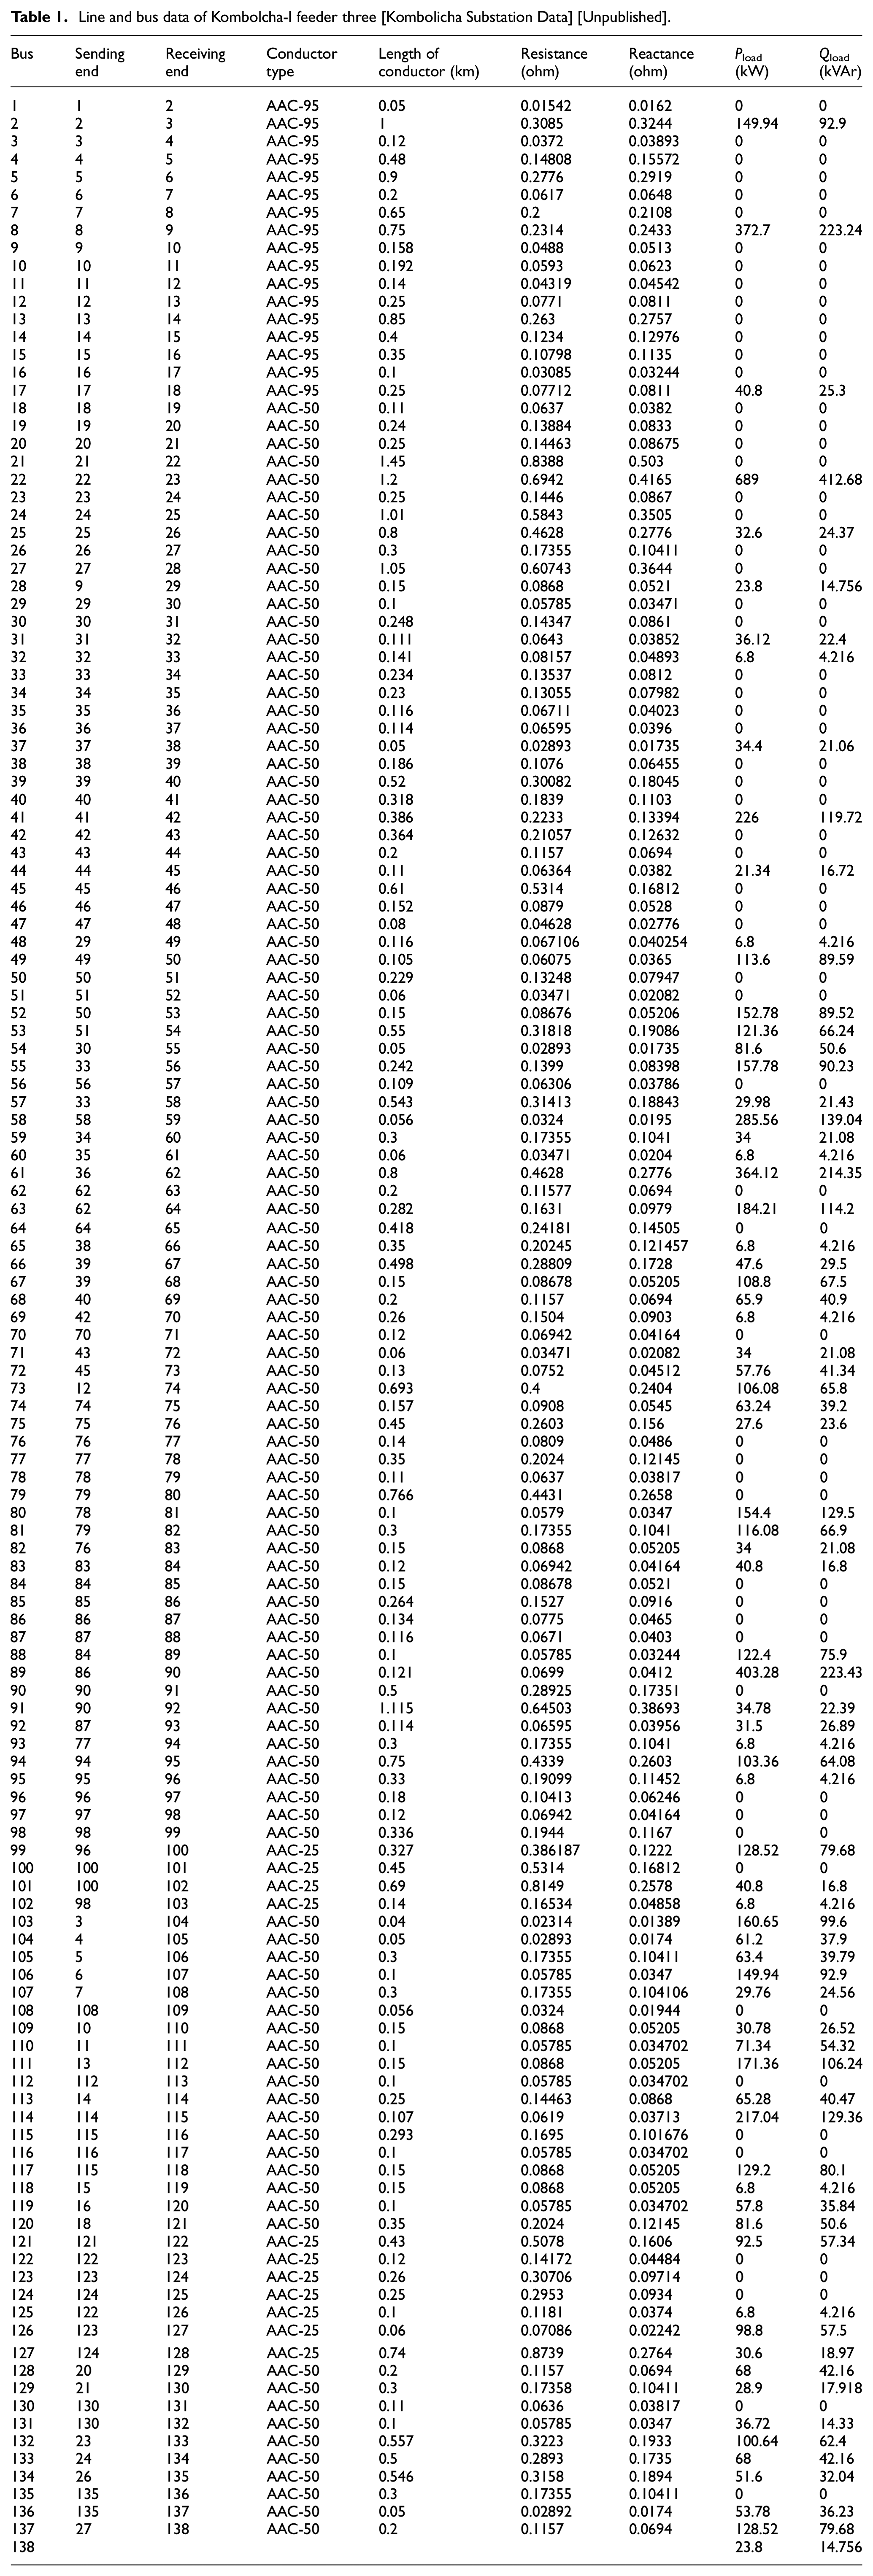
The selected overhead line employs aluminum conductors (AAC-25, AAC-50, and AAC-95) and operates at 15 kV using wooden poles. The feeder’s impedance is calculated based on the branch lengths and conductor types used, enabling precise analysis of its performance characteristics (Table 1).
Line and bus data of Kombolcha-I feeder three [Kombolicha Substation Data] [Unpublished].
PV-DG modeling
The passiveness of the distribution system is changed when the distributed generator is incorporated into the distribution network. Constant real and reactive (PQ) currents injected into the node and a constant real power and voltage (PV) model are the two known DG modeling in power flow equations. 29 After deployment of DG, the new demand of real and reactive power for the bus where a DG is integrated, suppose at bus k, is updated as follows. 30


Where:
Optimization problem formulation
In this section, the backward/forward load flow technique for load flow studies is explained, along with the formulation of objective functions that consider both equality and inequality constraints.
Load flow analysis
An efficient and powerful load flow method is essential for power system planning, control, operation, and optimization analysis. Radial distribution system (RDS) networks possess unique characteristics, such as a high R/X ratio, a wide range of reactance and resistance values, and uneven load distribution, which render traditional load flow techniques like Gauss-Seidel, Newton-Raphson, and Fast Decoupled methods unsuitable. 31 The backward/forward sweep (BFS) technique is widely regarded as the most effective approach for radial distribution systems. It works based on Kirchhoff’s law and has three primary stages; which are a calculation of nodal currents, the creation of the BIBC matrix, and finally the development of the BCBV Matrix using forward sweep.
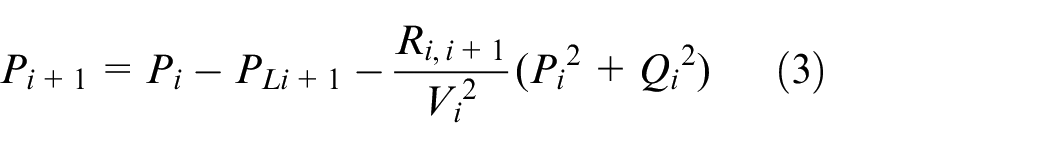
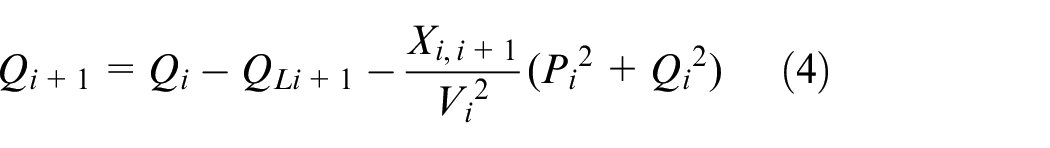
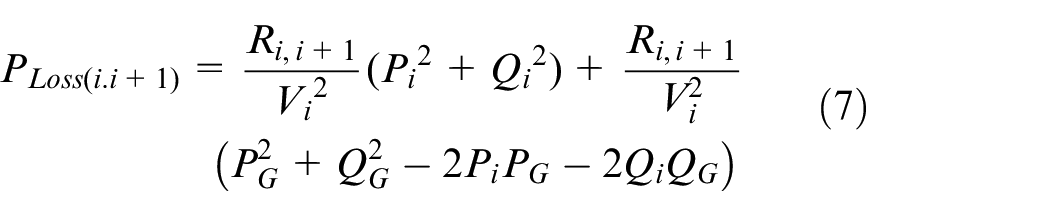
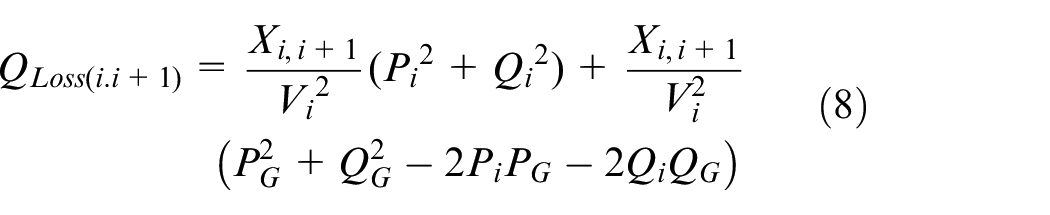
The real and reactive power loss after DG is integrated at optimal placement in the distribution system as shown in Figure 2 is given by equations (7) and (8). Whereas equations (3) and (4) show real and reactive system losses before DG deployments respectively.
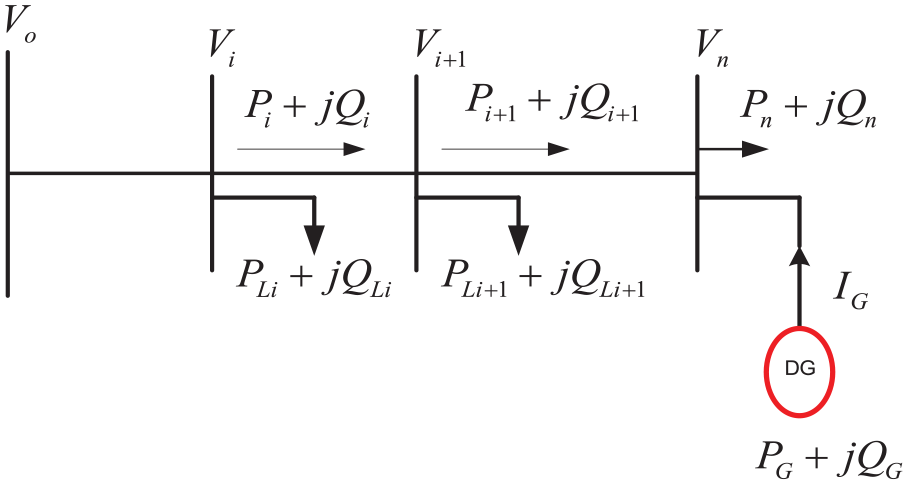
DG connection in the distribution system. 7
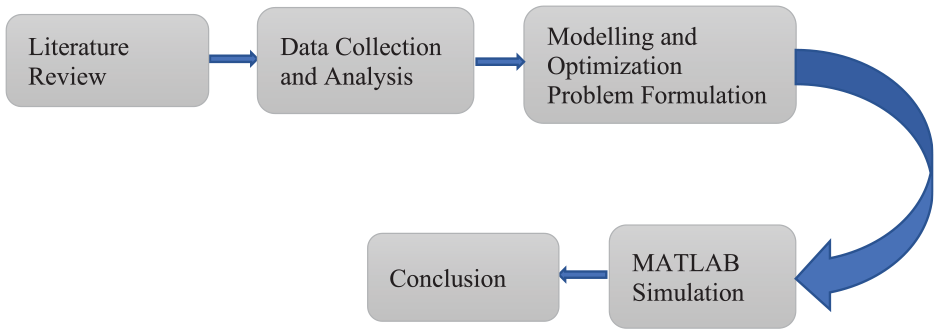
Overall block diagram.
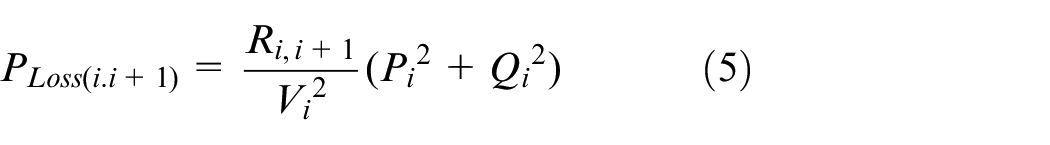
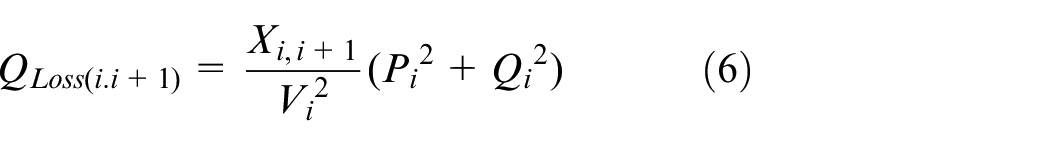
The power loss equations derived previously from equations (5) and (6) can be changed as follows when a DG is deployed into the network, as shown in Figure 2.
But in this study, zero since the DG type used in this work is renewable-based solar PV-DG and operates at unity power factor.
Objective functions and system constraints
The main aims of the paper are to enhance the distribution network by minimizing power loss and improving bus voltage magnitude through optimal DG allocation.
Loss minimization
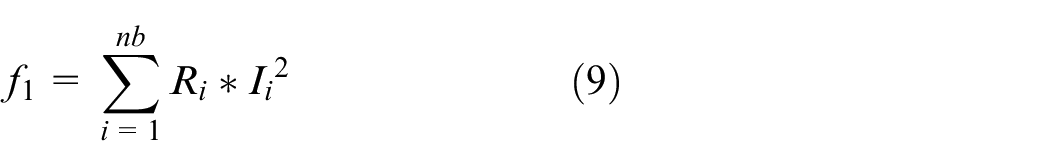
The active power loss of the network can be computed as follows:
The reactive power loss of the given network is calculated as follows:
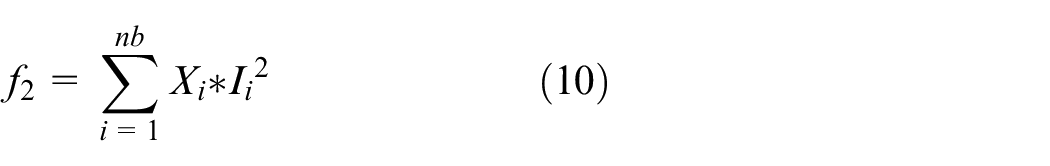
Ii: is “i” line current, Ri: is ith line resistance.
Xi: is the reactance of the ith line, nb: is network branches.
The percentage reduction of active and reactive power loss after DG integration can be found as follows:
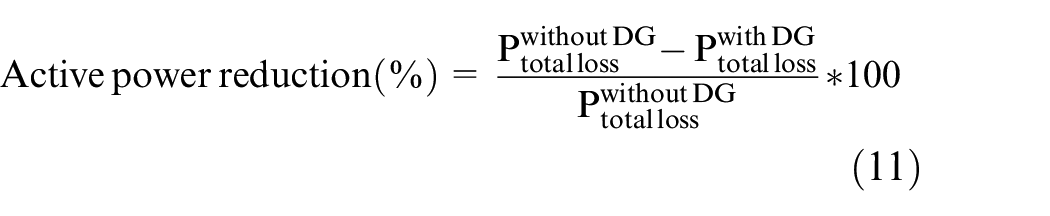
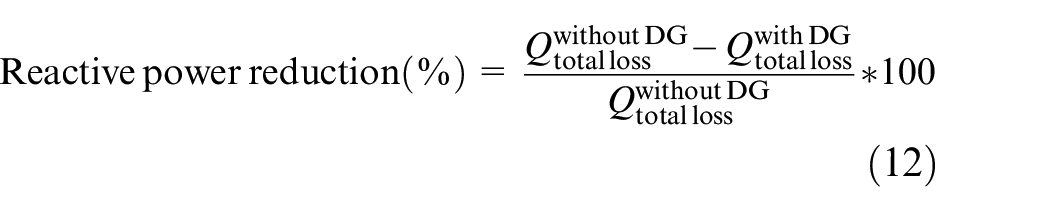
Where;
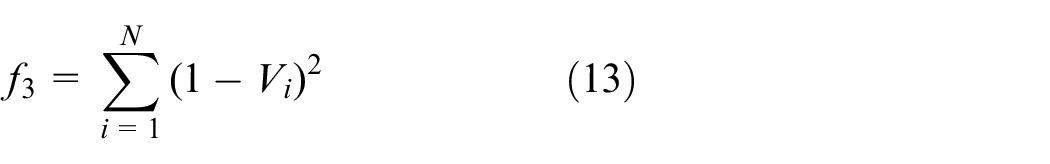
Voltage profile improvement
The bus’s voltage magnitude should be within the acceptable range since slight variation in the voltage affects the whole system. Improving the voltage profile or CVD index is considered the third objective function (
Using the weight sum method, the three single-objective functions are changed into one.
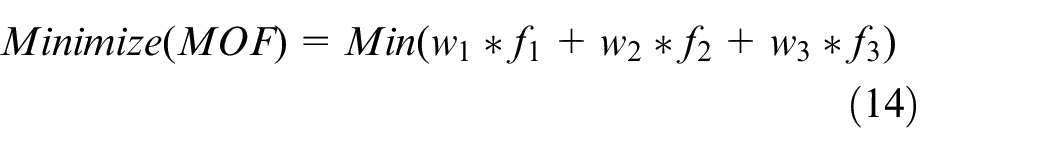
Where,
Equality constraints
One of the main points that should be taken into account is power balance constraints and it is given as follows.
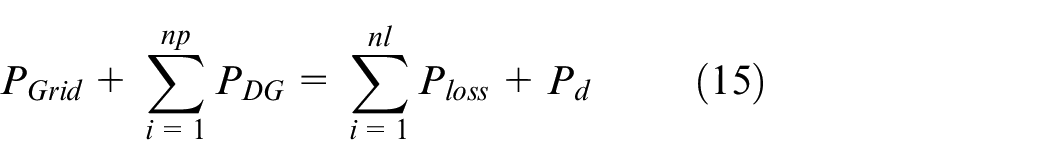
Where PDG is power supplied by DG, Pd is the load demand, Pgrid is the power supplied by the source, Ploss is the active power loss, np is the number of DG units, and nl is the number of transmission lines in the distribution network.
Inequality constraints
(a)

Where,
Its value is considered as
(b)
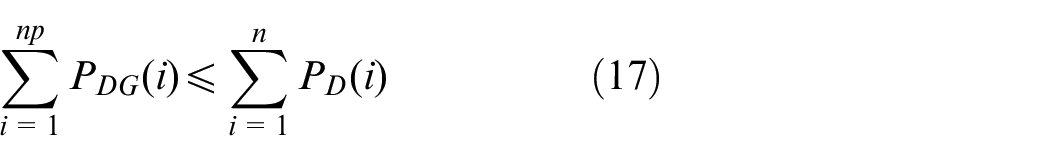
Where PDG and PD are injected real power by DG and the active load demand respectively.
(c)

Optimal placement and sizing of PV-DG using GA
This section outlines the proposed methodology, which employs a search-based optimization technique to determine the optimal siting and sizing of Distributed Generations (DGs) in distribution systems. The primary objectives are to minimize power losses and enhance voltage profiles. The methodology involves identifying the optimal locations for DG integration within the network, referred to as DG placement, and determining the appropriate capacities for the DG units to be deployed, known as DG sizing. The Genetic Algorithm (GA) was chosen due to its proven effectiveness in solving complex, multi-objective optimization problems. GA’s ability to efficiently explore and exploit the solution space makes it well-suited for minimizing both active and reactive power losses while simultaneously improving voltage profiles. Additionally, its flexibility in handling real-world constraints and nonlinearities ensures its practical applicability to the selected distribution network. The Genetic Algorithm (GA) operates through a series of iterative steps, such as initialization, fitness evaluation, selection, crossover, mutation, and elitism, which collectively ensure convergence toward optimal solutions. Within this study, the multi-objective function (MOF) integrates power loss reduction and voltage profile improvement while adhering to predefined system constraints, as described in earlier sections. This structured framework and computational flow of GA enable effective exploration of the solution space, making it particularly suitable for optimizing large-scale radial distribution systems. For clarity, Figure 4 illustrates the step-by-step GA process employed in this research.
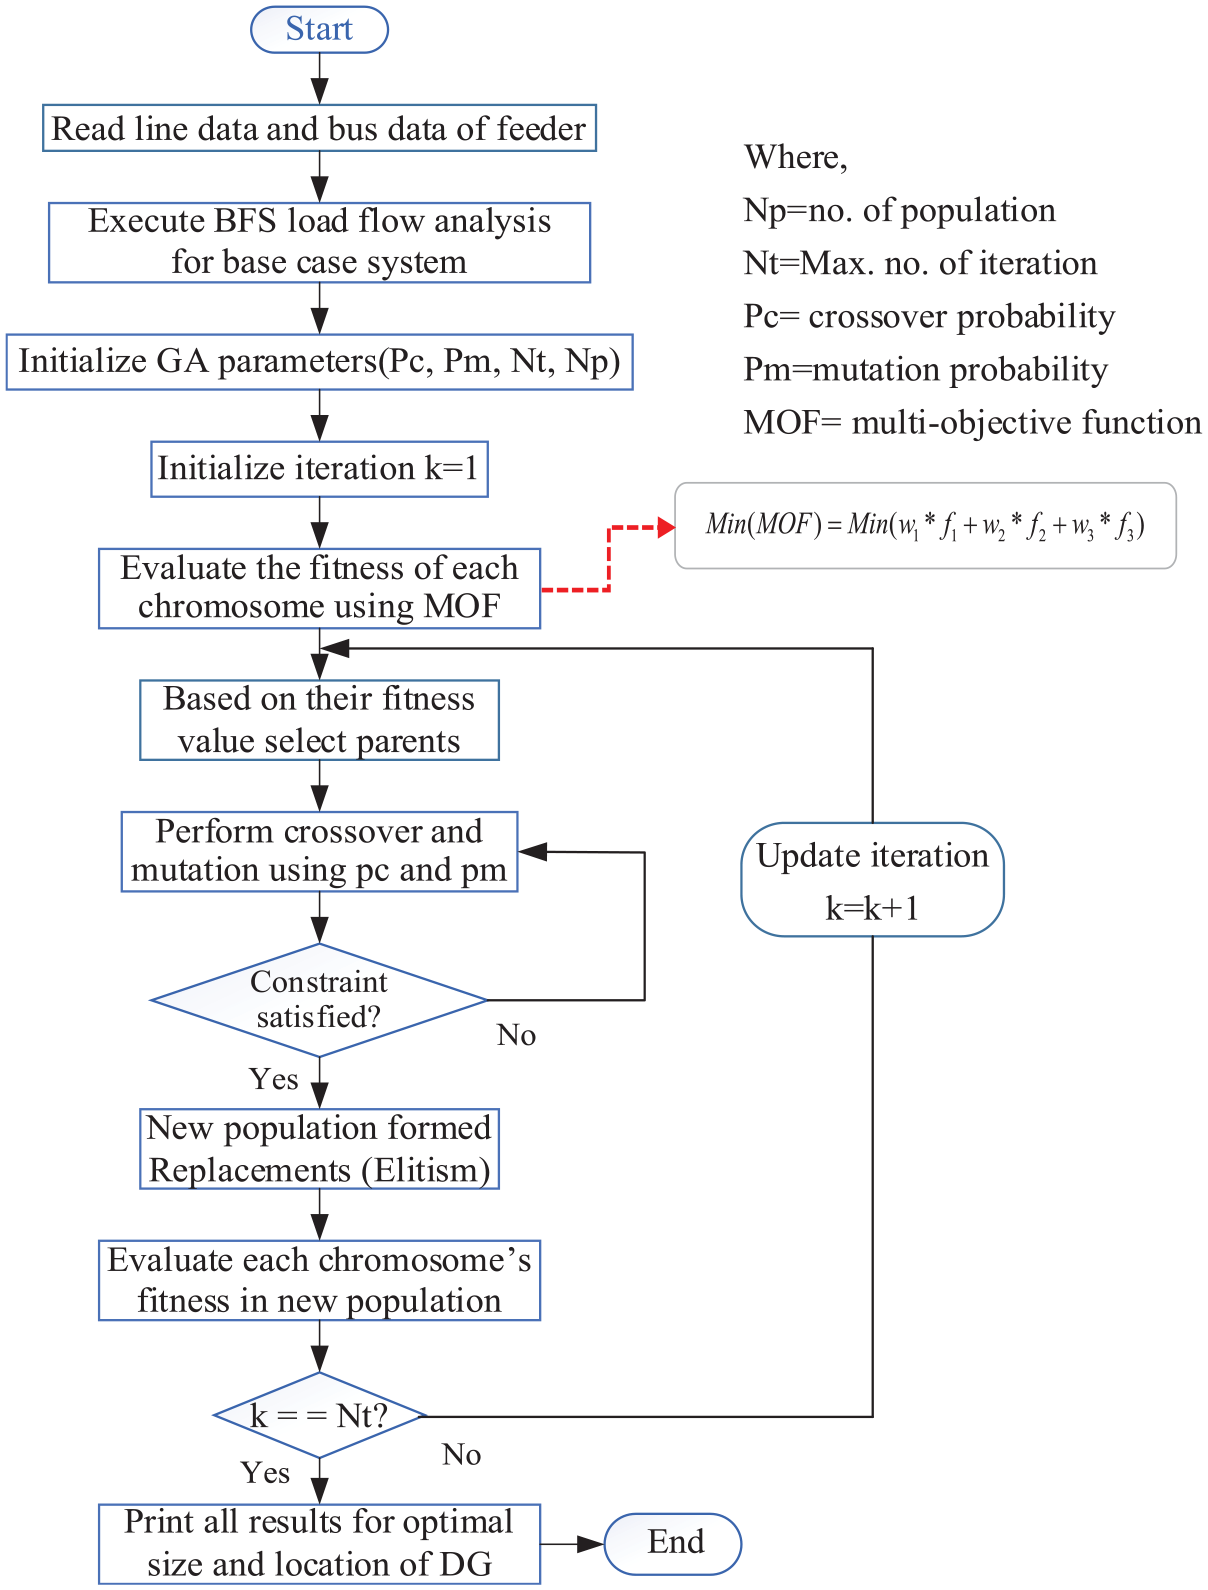
Flow chart of the proposed GA algorithm for optimal placement and sizing of DG.
Comparison of GA with PSO
The Genetic Algorithm (GA) offers significant advantages, including its ability to efficiently explore a large solution space and avoid becoming trapped in local optima. However, GA demands more computational time and exhibits a slower convergence rate. In contrast, Particle Swarm Optimization (PSO) is simpler to implement, requiring fewer parameter adjustments, and demonstrates a faster convergence rate. Nevertheless, PSO can be prone to premature convergence, resulting in reduced control over its speed and direction. By comparing these methods, GA is better suited for complex problems that require global optimization, while PSO may be preferable for simpler problem formulations where faster solutions are prioritized.
Results and discussions
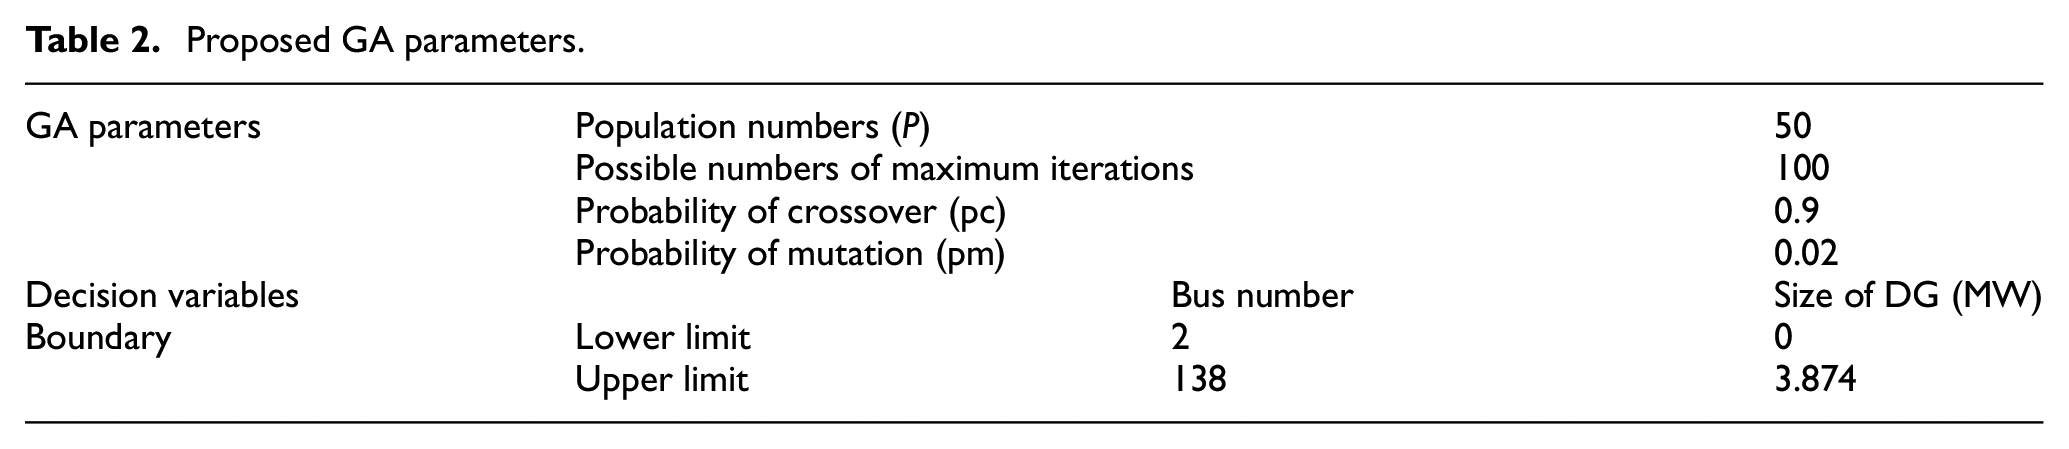
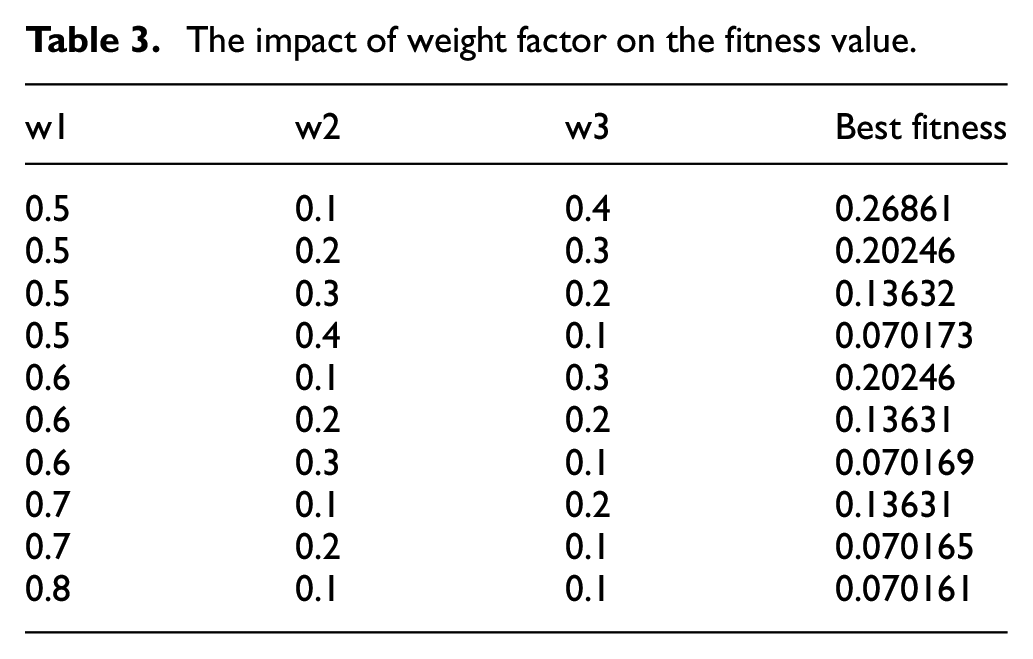
This section presents the results obtained using the Backward/Forward Sweep (BFS) load flow method and the Genetic Algorithm (GA). Load flow studies were conducted using the BFS algorithm, implemented in MATLAB 2021a, with line and bus data. To ensure consistency, all values were normalized into per-unit (p.u.) using a system base of 100 MVA and a base voltage of 15 kV. Voltage limits were set between 0.95 and 1.05 p.u. to maintain system stability. The analysis of weight factors’ impact on fitness values, GA input parameters, and optimization process boundary conditions is summarized in Table 2. Selecting appropriate weight factors is crucial for achieving optimized results. These weights are determined based on engineering priorities, with greater emphasis placed on reducing real power losses due to their significant influence on overall cost reduction. While other factors remain important, the assigned weights reflect these priorities. The optimal combination of weight factors was determined through Multi-Objective Function (MoF) simulations in MATLAB, where weights were selected to minimize the objective function value while balancing competing objectives. In this study, the combination of active power weight w1 = 0.8, reactive power weight w2 = 0.1, and voltage profile weight w3 = 0.1 produced the best outcomes, as shown in Table 3.
Proposed GA parameters.
The impact of weight factor on the fitness value.
Simulation results
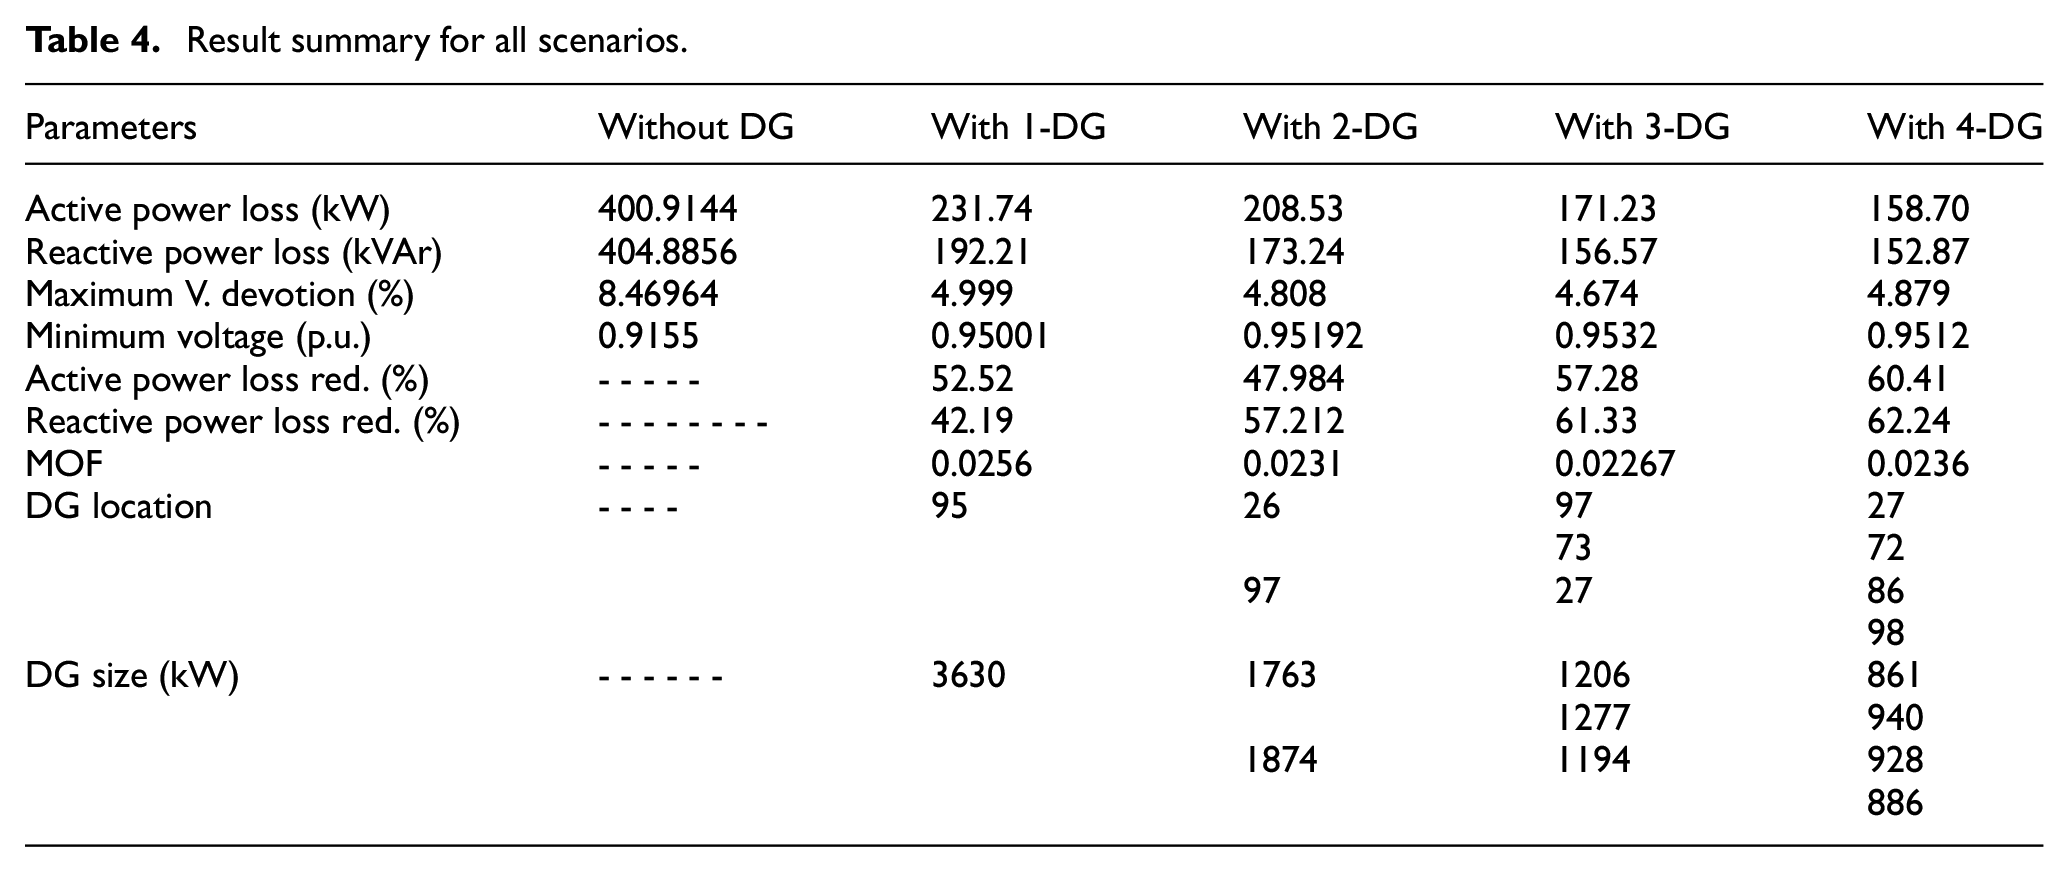
The selected feeder system has a total active power load demand of 6.456 MW and a reactive power load demand of 3.8218 MVAr. In the base case scenario, the overall active and reactive power losses were measured at 400.9144 kW and 404.8856 kVAr, respectively. Additionally, the simulation revealed that most buses operated below the minimum voltage threshold of 0.95 p.u., with the lowest recorded voltage being 0.9155 p.u. To address these challenges, the integration of Distributed Generators (DGs) was analyzed across four scenarios: the addition of 1-DG, 2-DG, 3-DG, and 4-DG units. The simulation outcomes, illustrated in Figures 5–7, demonstrate significant improvements in system performance through optimal DG placement using the proposed Genetic Algorithm (GA). The integration of DGs resulted in notable enhancements to the voltage profile, with the minimum bus voltage increasing to 0.95001, 0.95192, 0.9532, and 0.9512 p.u. for the 1-DG, 2-DG, 3-DG, and 4-DG scenarios, respectively. These results ensure all bus voltages exceed the 0.95 p.u. threshold.
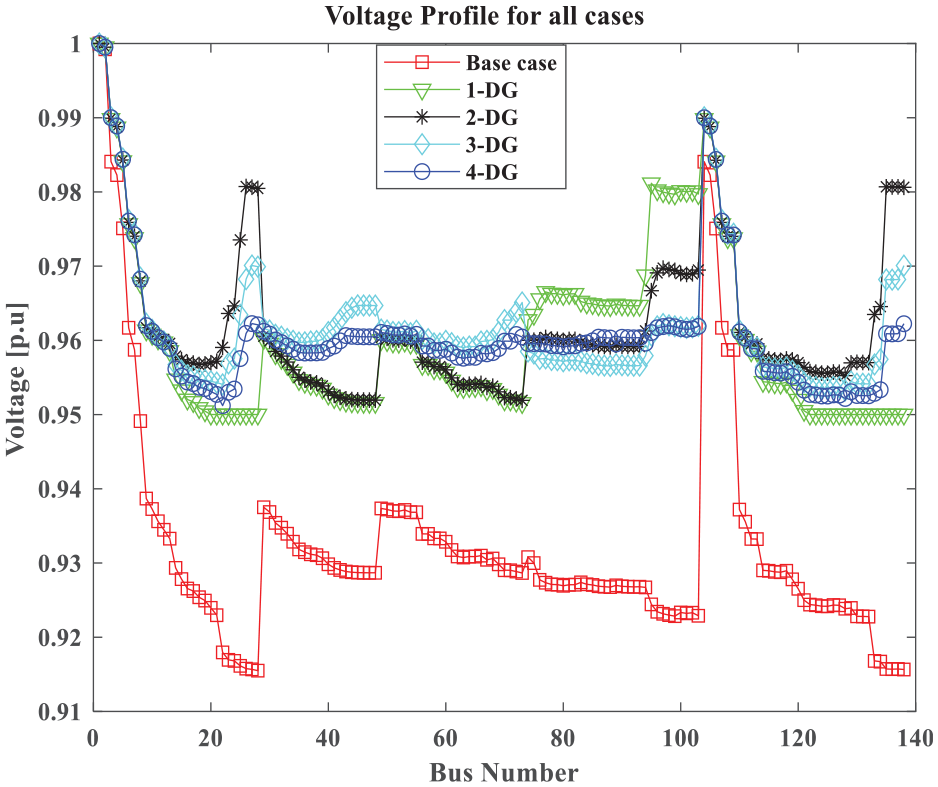
Bus voltage profile for all cases.
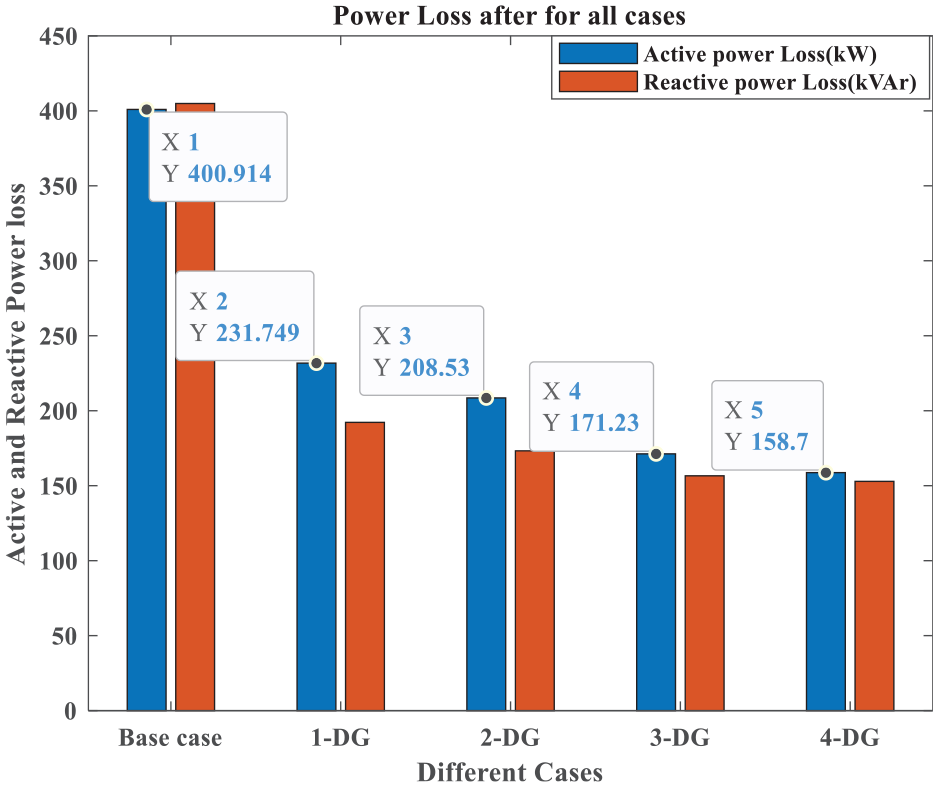
Total power loss for all cases.
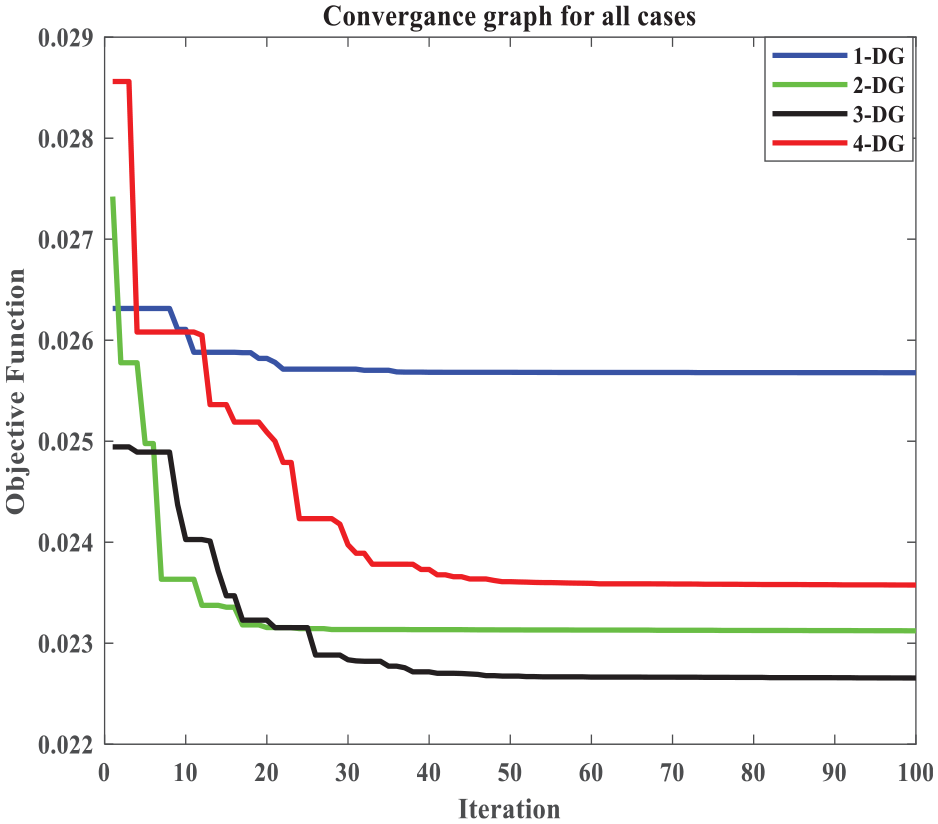
Convergence curve for all cases.
Furthermore, power losses were substantially reduced, as depicted in Figure 6, reflecting the effectiveness of the method in minimizing total power losses and improving system efficiency. The convergence curves in Figure 6 confirm that the Genetic Algorithm reliably optimizes DG placement, demonstrating its robustness in enhancing voltage profiles and achieving loss reduction. These results validate the effectiveness of the proposed GA-based approach in improving the performance and reliability of the distribution network, underscoring its suitability for real-world power systems.
Proper allocation and sizing of Distributed Generators (DGs) significantly reduce system power losses. The active power loss decreased from 400.9144, 231.74, 208.53, and 171.23 kW, and 158.70 kW for the 1-DG, 2-DG, 3-DG, and 4-DG integrations, respectively. Similarly, reactive power loss reduced from 404.8856 to 192.21, 173.24, 156.57, and 152.87 kVAr. The corresponding percentage reductions in active power loss were 52.52%, 47.98%, 57.28%, and 60.41%, while the reactive power loss reductions were 42.19%, 57.21%, 61.33%, and 62.24%. These results demonstrate the significant impact of optimal DG allocation on improving system efficiency and minimizing power losses.
The convergence curve characteristics for integrating multiple DGs using the proposed Genetic Algorithm (GA) approach are illustrated in Figure 7. The multi-objective function (MOF) values for the integration of 1-DG, 2-DG, 3-DG, and 4-DG units are 0.0256, 0.0231, 0.02267, and 0.0236, respectively. The convergence curve indicates that system performance improves significantly up to the integration of 3-DG units. Beyond this point, enhancements diminish due to increased maximum voltage deviation and MOF values. Additionally, the graph shows rapid convergence for the 1-DG and 2-DG cases, while the 3-DG and 4-DG cases converge more slowly, primarily due to the increase in decision variables (see Table 4).
Result summary for all scenarios.
Comparative analysis of proposed method
To investigate the effectiveness of the proposed GA method, the results of the proposed model are compared with those of the PSO methods.
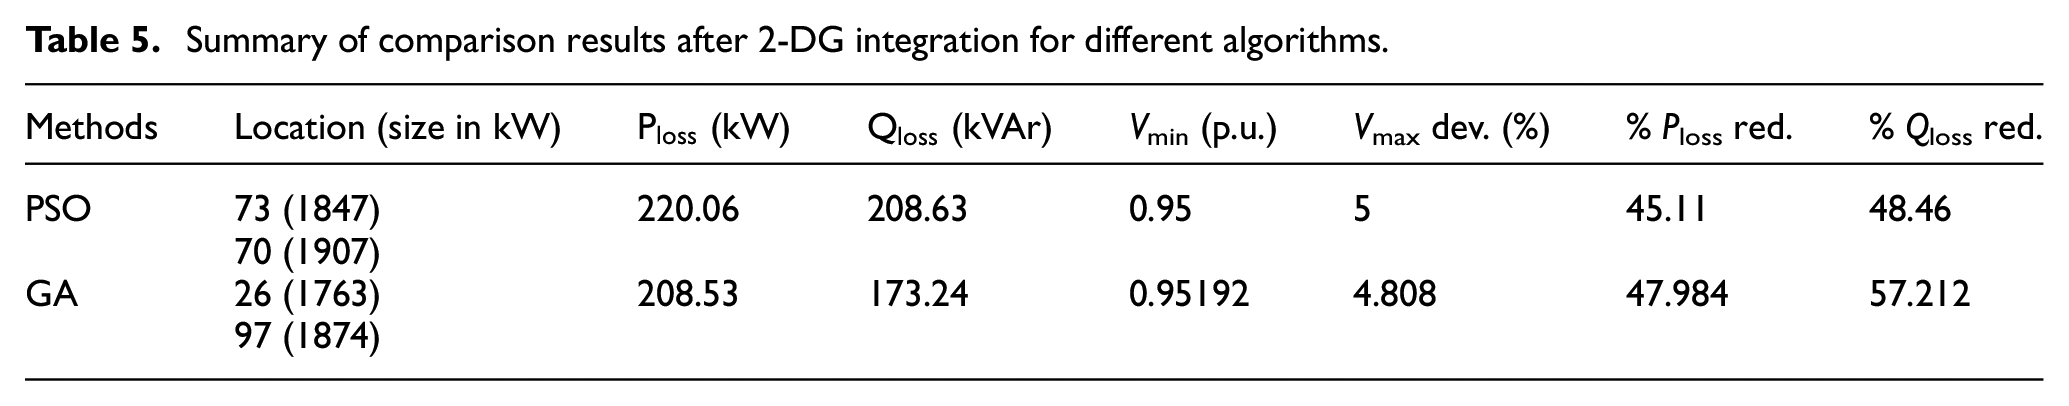
The simulation results after the integration of 2-DG show that the percentage reductions in active and reactive power loss, as well as MOF, are 47.984% and 57.212% for GA, and 45.11% and 48.46% for PSO, respectively as indicated in Table 5 and Figure 8.
Summary of comparison results after 2-DG integration for different algorithms.
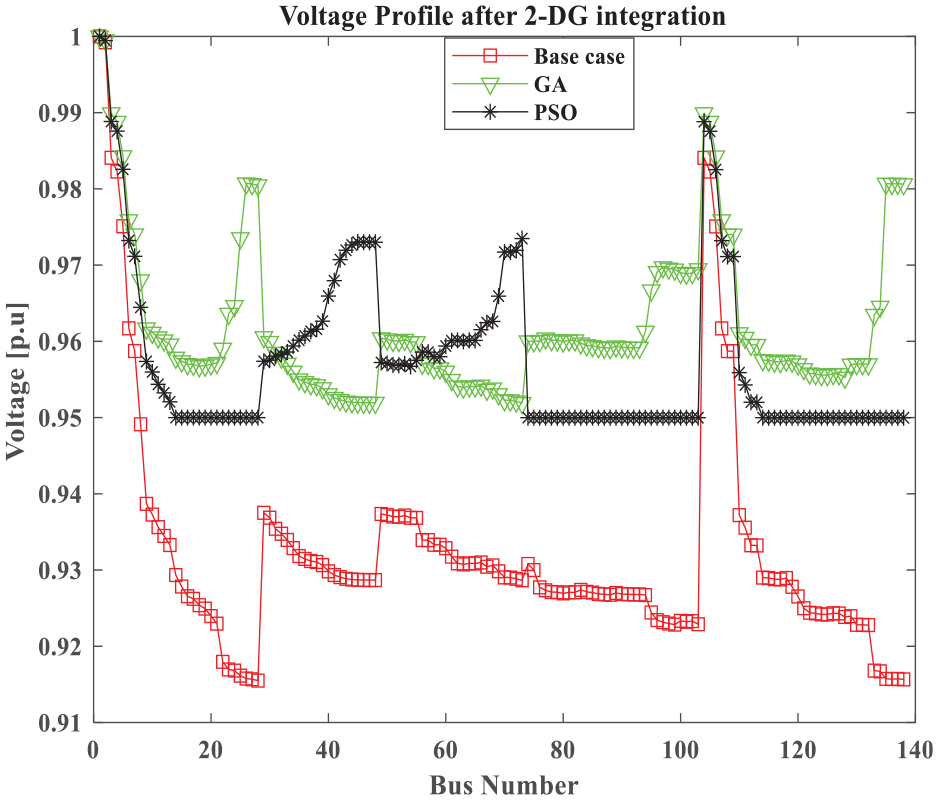
Voltage profile of the base case and after 2-DG integration using different algorithms.
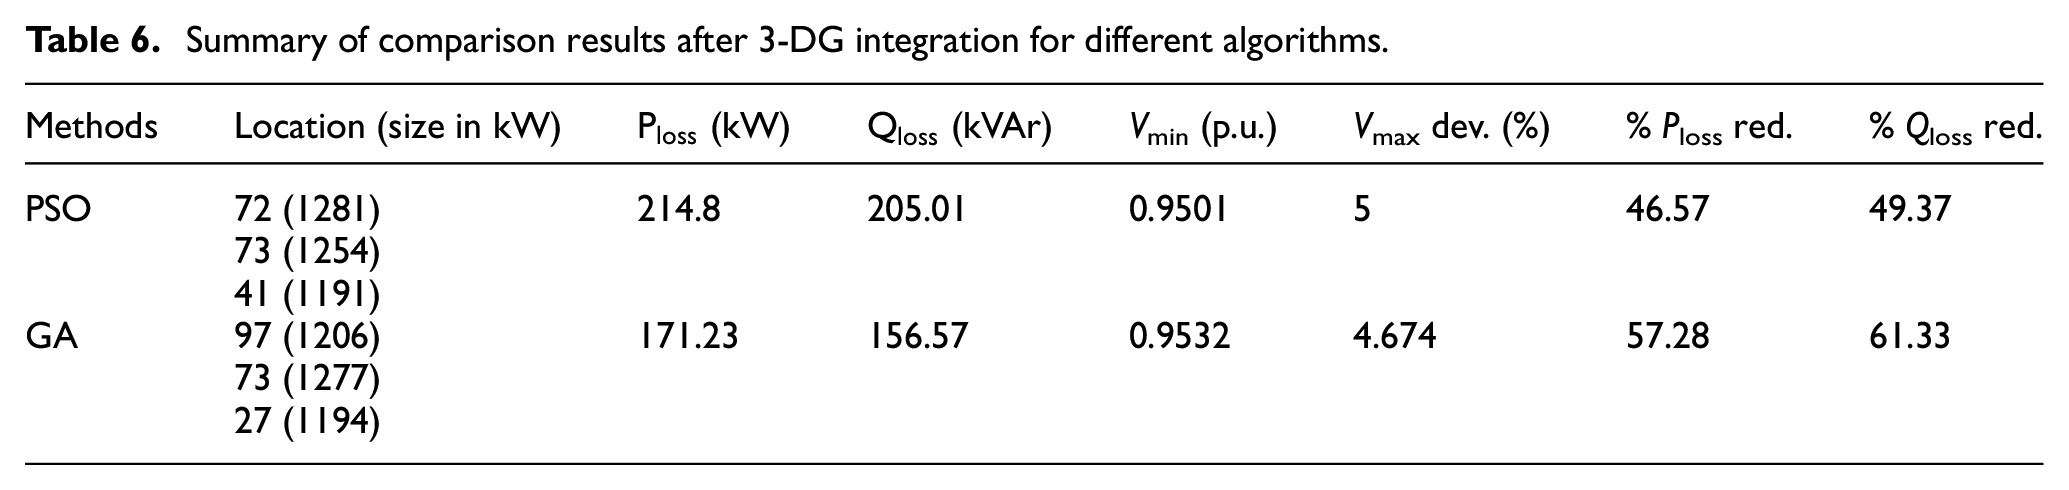
The simulation results as shown in Table 6 and Figure 9 after the integration of 3-DG show that the percentage reductions in active and reactive power loss, as well as MOF, are 57.288% and 61.329% for GA, and 46.57% and 49.37% for PSO, respectively.
Summary of comparison results after 3-DG integration for different algorithms.
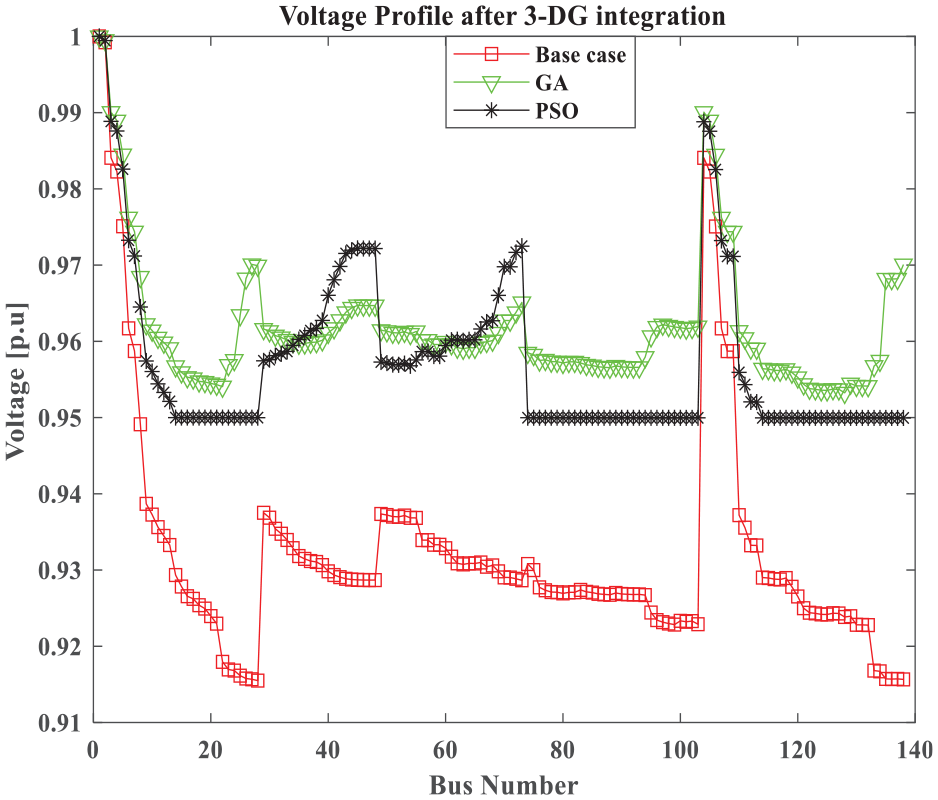
Voltage profile of the base case and after 3-DG integration using different algorithms.
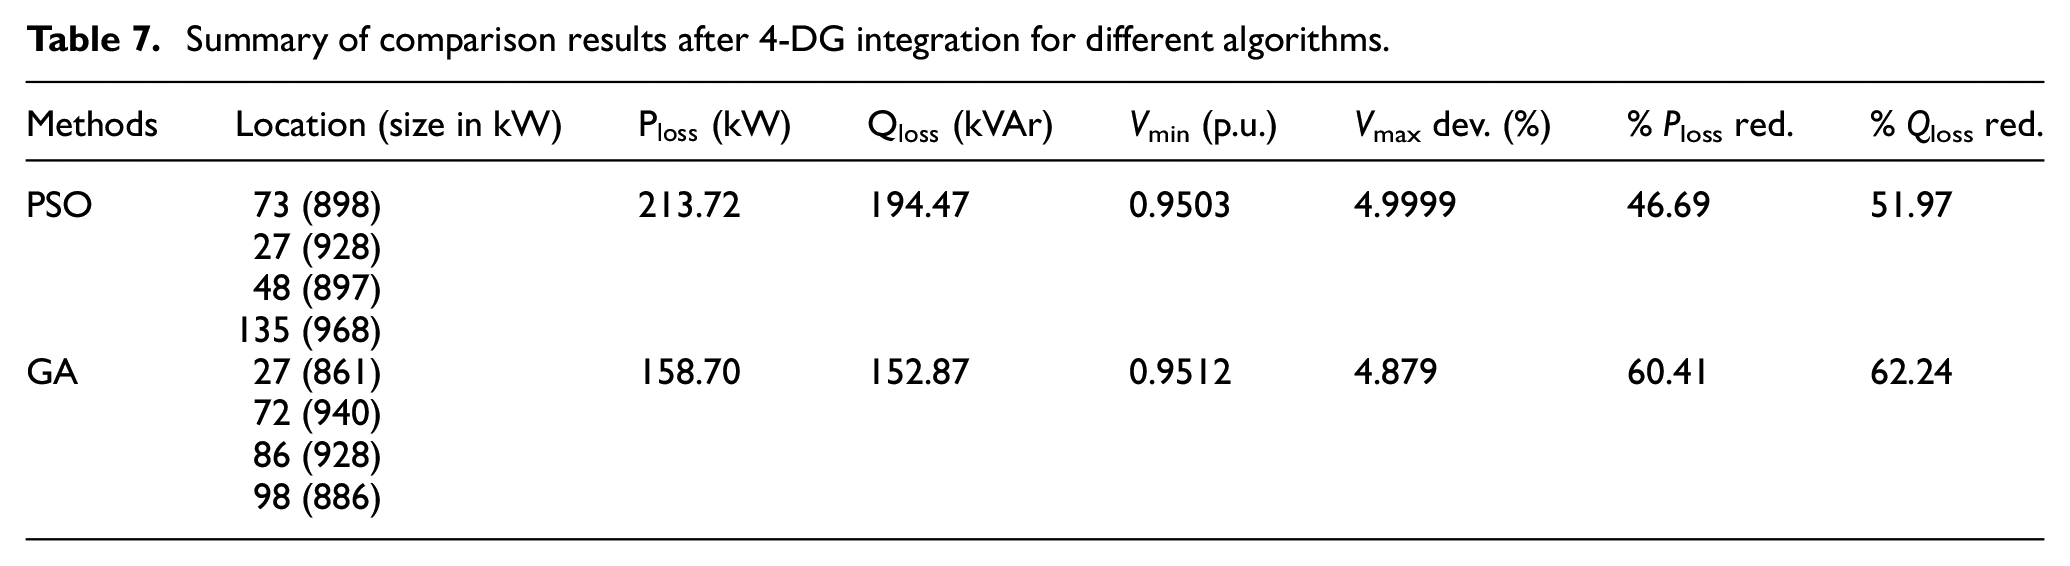
As shown in Table 7 and Figure 10, the percentages of active and reactive power loss reduction, as well as MOF, are 60.415% and 62.242% for GA, and 46.69% and 51.97% for PSO, respectively. The simulation results show that the proposed hybrid GA-PSO method outperforms both GA and PSO in terms of reducing total active and reactive power losses, improving the voltage profile of buses, and achieving a better MOF value.
Summary of comparison results after 4-DG integration for different algorithms.
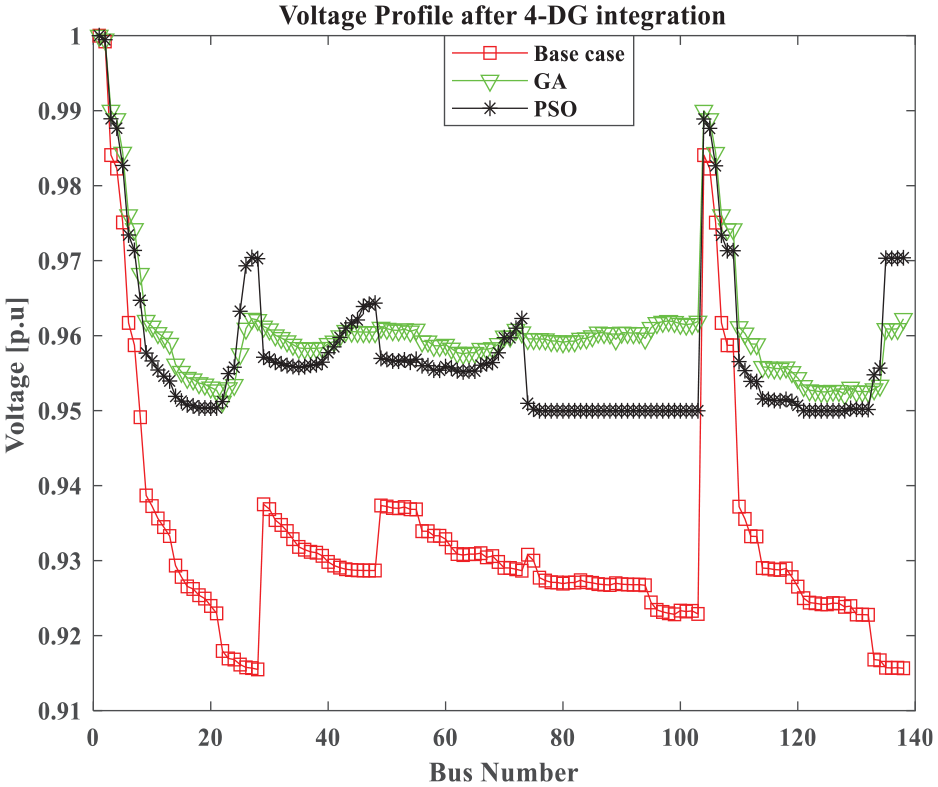
Voltage profile of the base case and after 4-DG integration using different algorithms.
As shown in the convergence graph of Figure 11, the convergence rate depends on the number of decision variables in the objective function, that is, DG location and size. For the 2-DG case, it converged rapidly, but for 4-DG cases, it converged more slowly as the number of decision variables increased.
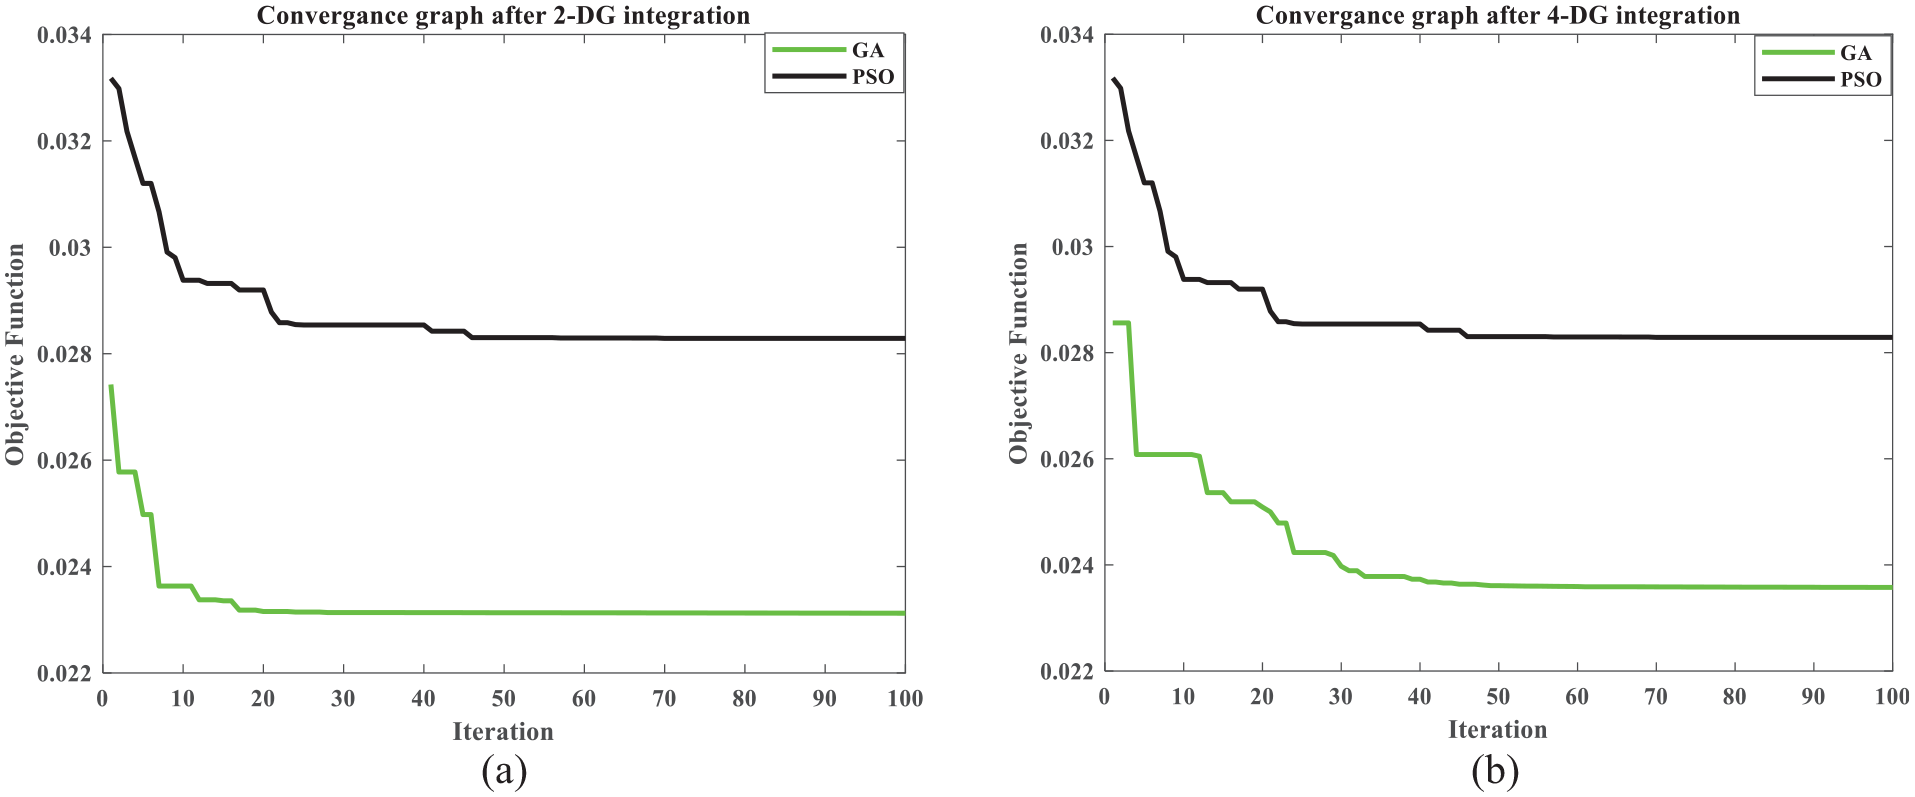
Convergence curve for all cases using different algorithms: (a) convergence curve after 2-DG and (b) convergence curve after 4-DG.
Conclusions
In conclusion, this study successfully developed and implemented a Genetic Algorithm (GA)-based method to optimize the distribution network by minimizing system losses and enhancing voltage profiles through the strategic allocation and sizing of multi-type Distributed Generators (DGs). A multi-objective optimization framework was established, focusing on reducing active and reactive power losses while minimizing cumulative voltage deviation (CVD). Simulation results demonstrated significant improvements in system performance. Real power loss reductions were achieved at 52.52%, 47.98%, 57.28%, and 60.41% for 1-DG, 2-DG, 3-DG, and 4-DG installations, respectively. Similarly, reactive power losses decreased by 42.19%, 57.21%, 61.33%, and 62.24% for the corresponding configurations. The base case minimum voltage level, initially at 0.9155 p.u., improved substantially, reaching 0.95001, 0.95192, 0.9532, and 0.9512 p.u. after integrating 1-DG, 2-DG, 3-DG, and 4-DG units, respectively. These outcomes confirm that DG integration not only enhances system efficiency but also ensures all bus voltages meet operational standards. The most effective scenario involved integrating 3-DG units at buses 27, 73, and 97, with capacities of 1194, 1277, and 1206 kW, respectively. This configuration yielded the best technical and economic outcomes, highlighting the optimal balance between loss reduction and voltage profile improvement.
Overall, this study underscores the effectiveness of genetic algorithms in optimizing power distribution systems, paving the way for advancements in smart grid technologies and sustainable energy practices. The findings emphasize the potential of DG integration to improve system reliability, reduce costs, and promote environmentally friendly solutions for modern power networks. Furthermore, a comparative analysis has been conducted to evaluate the effectiveness of the proposed GA algorithm against other optimization techniques. The results demonstrate that, in nearly all cases, the GA method outperforms PSO by achieving lower system power loss and improving the voltage profile.
Footnotes
Acknowledgements
We are very grateful to all who contributed directly or indirectly to the work of the study whose names are not mentioned here, mainly friends and family for sharing their knowledge and materials and Adama Science and Technology University for facilitation of the study.
Authorship
The authors of the paper are involved in all the duties of its work, specifically the first author made a substantial contribution to the concept or design of the work; or acquisition, analysis or interpretation of data and played a role in guiding, and preparing the manuscript, design, and model the system whereas the second author has written the documents taking into novelty of research work and revised the article critically for important intellectual content. All the works of others used as a reference are fully acknowledged.
Declaration of conflicting interests
The author(s) declared no potential conflicts of interest with respect to the research, authorship, and/or publication of this article.
Funding
The author(s) received no financial support for the research, authorship, and/or publication of this article.
Ethical consideration
Regarding an Ethical consideration, this study involved no risk and did not involve human participants.
Consent for publication
All the authors of this manuscript are consented to its publication.
Data availability
The data underlying the findings of this study are included in the article.