
Abstract
Punjabi is an old Indo-Aryan language spoken across the world, particularly in Pakistan and India. Punjabi is a tonal and low-resourced language therefore; significant research work has not been done so far, especially in the South Punjab belt. This language is divided into different dialects and finding the diversity of tonal qualities in the Majhi Punjabi dialect is the core objective of this research. Speech-processing applications are usually influenced by prosodic properties such as pitch, amplitude, and duration. A speech corpus was collected from 241 native speakers, encompassing spoken words totaling 7712, and representing various age groups and genders. The proposed prosodic model using the Mel Frequency Cepstral Coefficients (MFCC) system is used to extract the prosodic features from collected speech utterances of the Majhi Punjabi dialect. The examination of the results suggests that tonal and dialectal word information demonstrates a considerable impact on the information delivered by the speaker. Gender-specific variations in tonal word amplitudes are shown by the model. The extracted prosodic information is classified with support vector machine, logistic regression, random forest, K nearest neighbor, gradient boost (GB), and extra tree classifier (ETC). The ETC and GB models performed well with the highest accuracy of 97%. The four deep learning models are also implemented for performance comparison with machine learning, however, deep learning models do not perform well on this dataset. The highest accuracy is gained by CNN which is 86%. This research endeavor will be beneficial for Punjabi speech-processing applications. Additionally, the impact of dialectal variations elucidates the rich diversity present in spoken language, hinting at the importance of considering regional nuances in future investigations.
Introduction
Punjabi language is frequently spoken across the world predominantly in India’s East Punjab and Pakistan’s West Punjab. 1 The Punjabi language has been rated as one of the world’s most widely spoken languages. This rating has fluctuated between 10 and 18 over the years. Punjabi is considered one of the world’s 10 most influential languages, with more than 90 million native speakers and more than 140 million speakers in 150 countries around the world. Different dialects or variants exist in every spoken language. 2 In Pakistan, the province of Punjab is phonologically divided into Eastern Punjabi and Western Punjabi. Two main dialects of Eastern Punjabi are Malwai and Doabi whereas Western Punjabi is categorized into eight dialects such as Majhi, Jatki, Dhani, Multani, Hindko, Deerywali, Thalochi, and Pothwari. 2 The Majhi dialect selected for experiments is spoken in four districts of the province of Punjab that is, Dera Ghazi Khan, Rajanpur, Muzaffargarh, and Rahim Yar Khan.
Speech processing has seen a lot of effort in the past, but it now has a wide range of applications including speech recognition, speaker identification, speech synthesis, machine translation, information retrieval systems, and more. 3 Prosody generation is a prerequisite module of these mentioned speech processing applications. Prosody involves intonation, emphasis, tone, and rhythm. The acoustic parameters generated from the speech utterance are known as prosodic characteristics. 4 There are three main characteristics of prosodic, namely pitch, duration, and intensity, which are obtained from any speech, or signal. Pause, pitch, stress, amplitude, volume, and tempo are some common prosodic features. Furthermore, prosodic traits are characteristics that emerge when we combine sounds in connected speech. Prosodic elements must be taught to people since successful communication relies on intonation, emphasis, and rhythm just as much as accurate sound pronunciation. The speech signals can be used to extract three primary prosodic characteristics such as pitch, duration, and intensity. 5 The unforeseen inconsistency is observed with the homographic words which are frequently used in Punjabi. The use of short vowel signs also affects pronunciation. Figure 1 presented the list of homographic words and sound variations.
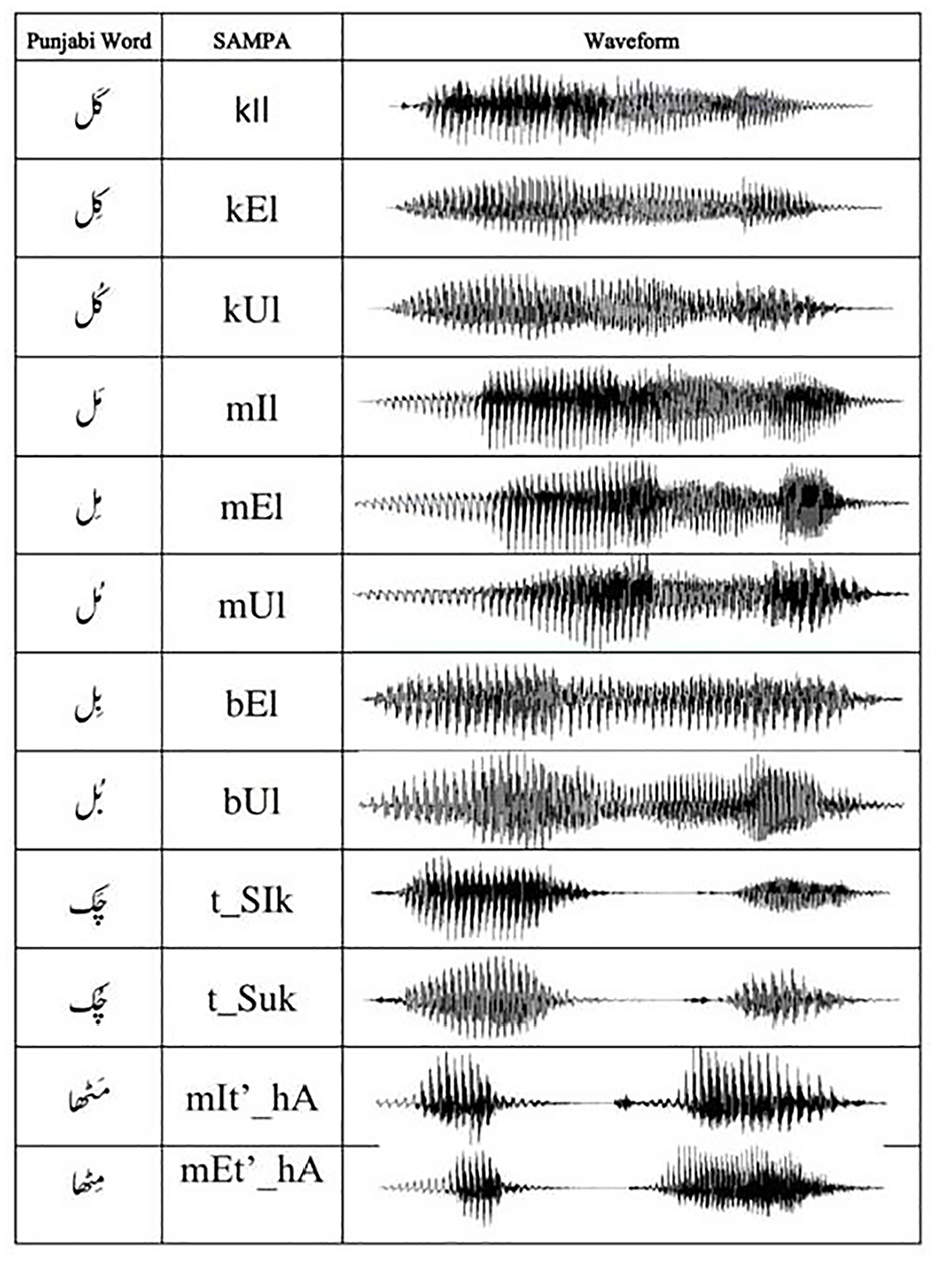
Homographic Punjabi words and sound variations.
State-of-the-art techniques are used to complete the task. The prosodic features are extracted from the sounds database using the Mel Frequency Cepstral Coefficient (MFCC) technique and further classified according to the gender group of males and females using four machine learning algorithms including K-Nearest Neighbor (K-NN), Logistic Regression (LR), Support Vector Machine (SVM), and Random Forest (RF). The performance of each classifier is evaluated using the F1 score, precision, recall, and accuracy in terms of the given parameters that is, pitch and duration.
The paper is further divided into nine sections. The section “Literature Review” discusses the literature. Section “Methodology” delineates the systematic approaches and research methodology adopted to ensure the study’s validity and reliability. It also elaborates on the process of gathering a comprehensive dataset and explores the role of Mel Frequency Cepstral Coefficients in extracting crucial features from audio signals, forming the backbone of our analysis. Section “Classification of prosodic information” presents the findings and results whereas section “Conclusion” concludes the study.
Literature review
A large number of people in Pakistan speak Punjabi as their first language. 6 There are 20 major and minor dialects in the country. Punjabi dialects include Majhi, Doabi, Malwai, Powadhi, Pothohari, and Multani. Shahpuri, Jhangochi, Jangli, Hindko, Dhani, Jandali, and Chachi, among others, are minor dialects. 7 The study 8 developed a web-based tool, as well as an algorithm to recognize the Arudmetre in Punjabi poems. This web program has not only assisted professional poets but also assisted students in analyzing poetry in terms of prosody rules. The prosody of every poem is computed via recitation rather than textual transcription. The text is initially phonetically and phonologically analyzed to transform it according to the recitation by incorporating (as in gemination), attempting to remove (as in weightless nasalization and aspiration), amending (as in tonal sounds), and grafting (to integrate the sounds of neighboring words) letters. After that, the poem goes through a syllabification and weight assignment pipeline, determining short, flexible, and long syllables, and resulting in one or more rhythmical patterns.
Goyal et al. 9 discussed the two main parameters of this empirical investigation of (h) sound words in four major Indian Punjabi dialects including F0 variation and acoustic space, which are determined using the formant frequencies F1 and F2. The findings are based on four distinct dialects, which give rise to some intriguing theories that are investigated using a dataset that the researcher self-created. The Statistical Package for the Social Sciences (SPSS) has been used to extract characteristics from the speech analysis tool PRAAT and investigate correlations. Every variable has been compared to every other dialect’s equivalent. The examination of the results indicated that different dialectal situations have diverse effects on the fundamental frequency of these vowels.
Dhanjal and Bhatia 3 compared the prosodic properties of isolated wordsin the Malwi, Majhi, and Doabi dialects of the Punjabi language. Toneme, adhak, nasal (bindi), and nasal (Tippi) words have their pitch, intensity, formant I, and formant II values extracted. Significant diversity was found in all prosodic aspects. A state-of-the-art pitch-based feature extraction module is proposed by Bhardwaj et al. 10 that records minuscule variations in pitch patterns associated with different dialects. With the help of this module, the ASR system can now more accurately represent the distinctive characteristics of dialectal speech and distinguish between phonetic units. We also employ speaker adaptive training, deep learning techniques, and vocal-tract length normalization (VTLN) to generate trustworthy representations from pitch-based data. According to the experimental results, the WER for the Majha and Malwa dialects was significantly reduced, by 4.98% and 6.63%, respectively. The developed Punjabi dialectal speech recognition system could help language learning applications by exposing learners to a variety of dialects and accents. Additionally, Arora et al. 3 focused on the different tonal qualities of the Punjabi dialect. The speech corpus was gathered from native Punjabi speakers and adapted to the Himachali belt of Punjab. The examination of the results reveals that tone words and dialectal word information have a significant influence on the information delivered by the speaker. The studied data reveals pitch differences in tonal words that differ by area. Researchers studied those tonal words that show dialectal variations when the same sentence is spoken by speakers from different areas using the PRAAT toolkit to calculate the F0 value; then, based on pitch and frequency variations, researchers studied those tonal words that show dialectal variations when the same sentence is spoken by speakers from different areas.
Using discriminative modeling approaches and the Punjabi corpus, Arora and Singh 11 created a prosodic feature-based automatic children’s voice recognition system. Using Tacotron-based text to a speech synthesizer, efforts were made to add out-domain data augmentation to overcome such difficulties. Before being presented to an ASR framework, prosodic features were retrieved from a created corpus and then combined with MFCC features. Moreover, Jayoti 12 proved that pitch-dependent features and the possibility of voicing predicted features can increase the performance of an Automated Speech Recognition (ASR) system. The pitch-dependent properties are beneficial to the ASR system for tonal languages.
Kok 13 evaluated and contrasted the accuracy of word prominence classification using various machine learning model types. Support vector machines, random forest classifiers, and multi-layer perceptrons are the machine-learning models that have been put to the test. Prosodic characteristics as defined by the GeMAPS feature set are extracted using the openSMILE Python package. Additionally, employed two data reparation techniques, feature selection, and standardization, and we examined the effects of both on the outcomes. With an F1-score of 0.698, the support vector machine that used both data pretreatment techniques fared the best. On the other hand, with F1-scores ranging from 0.542 on unprocessed data to 0.692 on standardized data, the multi-layer perceptron had the lowest performance.
Hasija et al. 14 compiled a small Punjabi speech corpus that included data from both adults and children. Then, using a mixture of adults’ and children’s speech, an ASR system was constructed and tested on children’s speech. The proposed ASR system is shown to result in a severely degraded recognition rate due to changes in auditory properties such as formant frequency, pitch, and speaking-rate variances between adults’ and children’s speech. Researchers have looked into vocal-tract length normalization, explicit pitch, and duration adjustment to reduce the acoustic mismatch. Furthermore, Latif et al. 15 created a dataset and showed that it can be used to train a TTS system that can appropriately express this fine-grained prosodic property using control tokens. Their study examined synthetic and actual utterances and found that prosodic contrastive focus patterns (variations of F0, intensity, and duration) can be accurately learned. This is an important milestone since it will allow smart speakers to be controlled programmatically in terms of output prosody.
At the syllable and tri-syllable (word) level, Ramu Reddy et al. 16 discussed language-specific prosody, which is defined by intonation, rhythm, and stress features, whereas at the multi-word (word) level, temporal variations in fundamental frequency (F0 contour), syllable durations, and temporal variations in intensities (energy contour) are used to represent the prosody. Specific details were evaluated utilizing an Indian language voice database in the proposed features. Researchers mostly employ Neural Network (NN) and SVM classification techniques to extract prosodic information. Neela Madheswari et al. 17 emphasized utilizing Python to create text-to-speech synthesis for a number of Indian languages, including Bangla, Tamil, Telugu, Malayalam, Marathi, Gujarati, Hindi, Kannada, Nepali, and Punjabi. The execution time and size of the audio file created for the provided text are the primary parameters taken into account for analysis. The suggested system primarily consists of two phases: text-to-speech conversion for different Indian languages and text-to-speech conversion with prosody generation for different Indian languages. The goal is to compare the effectiveness of each method. Lastly, an analysis is conducted using the analysis parameters to determine whether the Indian language produces prosody production more effectively.
Using backpropagation NN, Mahar et al. 18 proposed a paradigm for generating and analyzing prosodic information, notably pitch, and duration, from recorded Sindhi sounds. A total of 228 speakers were picked from Sindh’s four districts, and the sound of various descriptive sentences was captured to obtain prosodic qualities.
Kane et al. 19 investigated a novel method for adding prosody to a recorded or generated voice by utilizing machine learning, more precisely an LSTM neural network, to add paralinguistic components. In order to optimize combinations and performance in edge instances, this research used laboratory trials to analyze and generalize algorithms into a modular system, which was then implemented as a prototype modular platform for digital voice improvement. The LSTM-based encoder produced realistic speech, which was a promising result.
Singh et al. 20 suggested a corpus-based Sanskrit-to-Hindi translation engine that uses the Bhagavad Gita—the Lord’s song as input data. Deep NN is utilized for training in this study, where input data is provided to NN after data analysis and processing, and it is then fine-tuned to improve the model. The proposed model is used to create the target text, which results in a higher bilingual evaluation understudy score and a lower word error rate. Chittaragi 21 looked at the importance of spectral and prosodic characteristics in English speech signals for identifying dialects. Shorter frames are used to extract spectrum properties including cepstral coefficients, spectral flux, and entropy. Longer frames provide prosodic qualities including pitch, intensity, and length. The proposed approach was evaluated using the intonational variations in the English speech corpus, which covers nine dialectal regions of the British Isles. Over these datasets, the impact of spectral and prosodic behavior is well explained. In addition, nine dialects were identified using two different classification algorithms: SVM and an ensemble of decision trees.
Wade-Woolley et al. 22 examined how prosody functions as a source of linguistic information that influences the lexicon, the orthographic system, and the comprehension processes in both tonal and non-tonal languages. It is framed in the context of the Reading Systems Framework. Consideration is given to prosody at the word, phrase, and discourse levels. We also present the current state of knowledge about the role of prosodic competence in the development of reading by reviewing empirical evidence from training, longitudinal, and experimental studies.
Catherine 20 used lexical and prosodic variables to study the automatic paragraph segmentation of TED speeches. Experiments using SVM, AdaBoost, and NN reveal that models based on supra-sentential prosodic characteristics and induced cue words outperform models based on lexical cohesiveness metrics commonly employed in broad topic segmentation. Rather than treating these characteristic streams as isolated information sources, late fusion approaches that blend representations created by separate lexical and prosodic models while permitting interactions between them produce the best results.
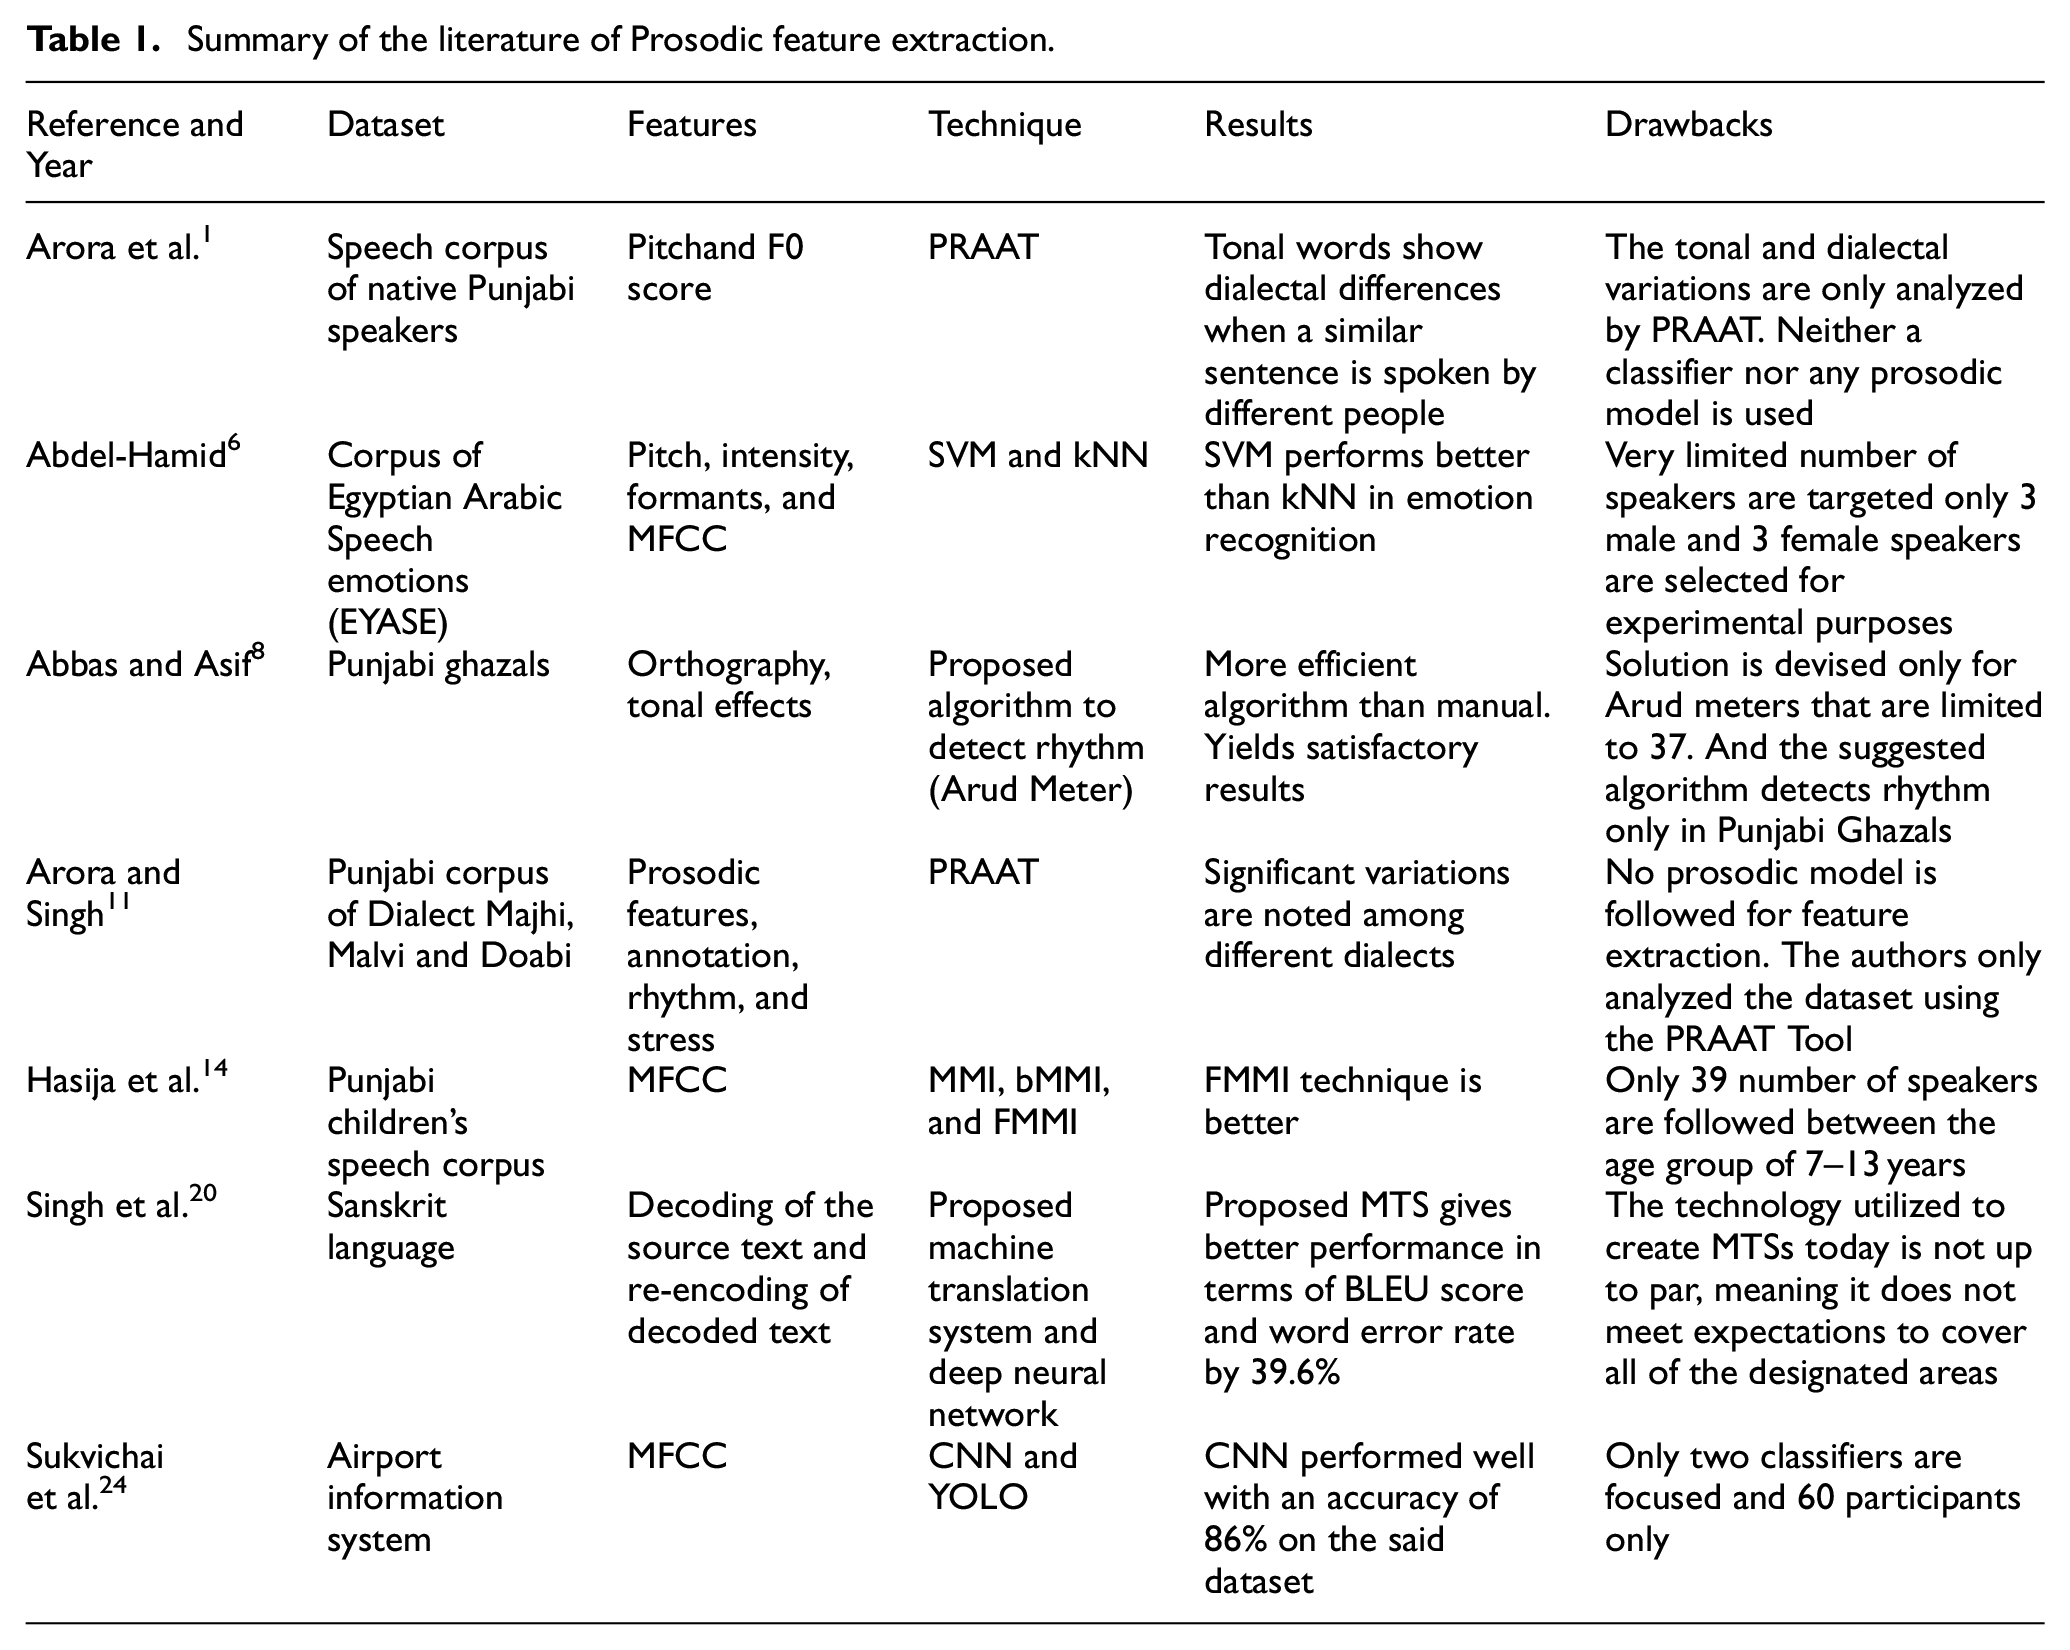
Awais et al. 23 proposed a novel model based on MFCC and LSH was suggested to be incorporated into the speech recognition model. In this approach, the wave file’s MFCC features are first extracted, and the extracted features are then submitted to an LSH classifier to transform them into hash tables. Finally, a speech recognition accuracy of 92.66% is obtained by comparing the hashtables of the train and test wave files. Similarly, Sukvichai et al. 24 discussed MFCC and convolutional neural network, and an ASR for the Thai sentences. The airport service scenario is investigated to determine how well the suggested system will function. The experiments used the airport information system. Sixty participants, 50% men, and 50% percent women contributed speeches. Based on MFCC, speech pictures are created and annotated. The summary of the reviewed articles is presented in Table 1.
Summary of the literature of Prosodic feature extraction.
Methodology
The purpose of this research study is the phonological analysis of the Majhi Punjabi dialect sound units and to extract the mandatory prosodic information from the recorded sounds of male and female students. The methodology of this research study is based on the phase’s speech corpus collection, database development of sound units, prosodic features information extraction using MFCC, implementation of machine learning algorithms on extracted features, and performance evaluation of the selected classifiers. The block diagram of the methodology is depicted in Figure 2. The initial phase of this research study is the speech corpus collection because sound units are always required for experiments and analysis. The speech corpus is used to create acoustic models in speech technologies. Multiple composed sentences were given to the selected speakers and sounds were recorded in a noise-free environment. After that, a database of sound units is developed.
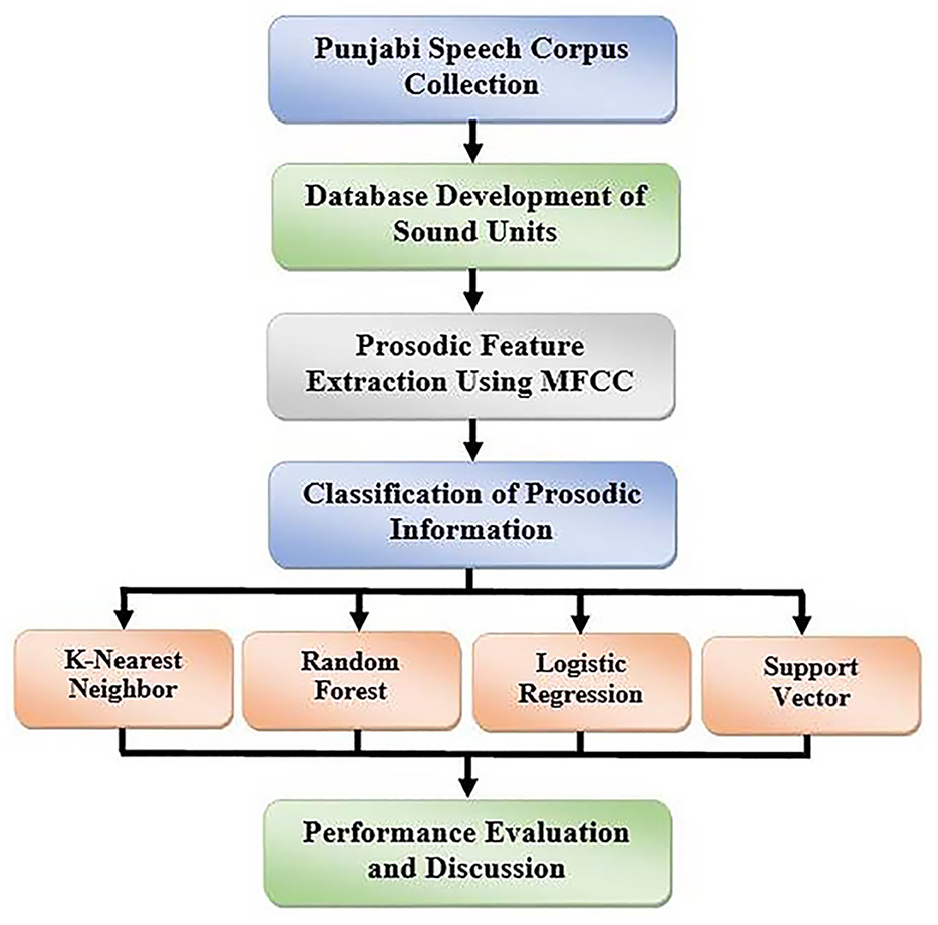
Methodology for Prosodic features extraction and classification.
We have composed a feature extraction workflow that is based on MFCC so that after the speech corpus collection and development of the database the prosodic information of the sound units is extracted by following the workflow. Different prosodic features of sound like loudness, tension, rhythm, intonation, pitch, and duration can be extracted but in this study, only the pitch and duration of recorded sounds are focused. Majhi Punjabi dialect is investigated through extracted prosodic features so that the gathered prosodic information is classified with four machine learning techniques such as KNN, SVM, RF, and LR. The reason behind the use of different classifiers is to obtain better results and compare the performance of the selected classifiers. Four Different deep learning models are also implemented in order to evaluate the performance accuracy, precision, recall, and F1 score. Hence, after the classification process, an evaluation is performed and the best classification algorithm is recommended for such kind of experimental research. The state-of-the-art techniques are used in the proposed methodology for the analysis of the Majhi Punjabi dialect.
Speech corpus collection
The speech corpus is mandatory for the extraction of prosodic features so, we have self-composed twelve sentences of the Punjabi language. Among them, three sentences are chosen to have an average length of 10–12 words. Furthermore, every word consists of two or more syllables. These sentences were further asked the people to speak including students, faculty members, and other staff members belonging to different institutes of district Rahim Yar Khan such as Khawaja Fareed University of Engineering and Information Technology (KFUEIT) Rahim Yar Khan, the sub-campus of Islamia University (IUB) Rahim Yar Khan and Punjab Group of Colleges Sadiq Abad. 430 speakers of the Majhi dialect were approached to record these sounds. Out of 430 people, 241 people showed a willingness to participate in the sound recording process. Punjabi is a tonally underdeveloped language, and in this day and age, people feel ashamed to speak their native dialect. Therefore, the maximum number of participants at this time is as follows.
Let
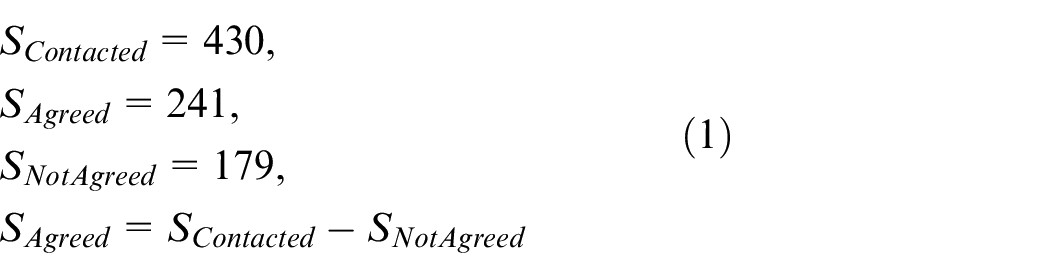
Since the agreed speakers belong to different age groups. In the age group 16–18, the participants are at the college level. Whereas in the age group 19–25, the participants are at the bachelor’s level, in this age group some students are enrolled in MS and PhD programs. But mostly MS and PhD students belong to age groups 26–50. Then
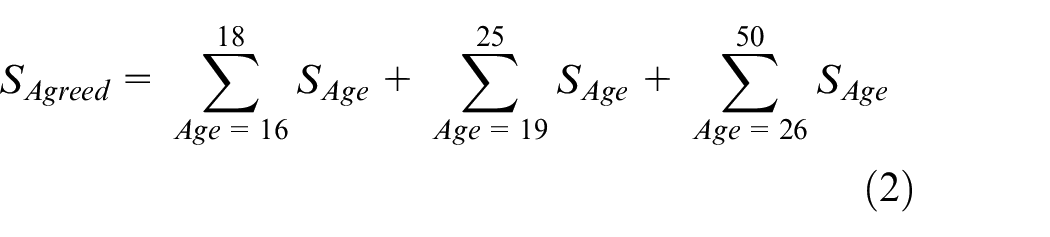
where

Equation (2) becomes
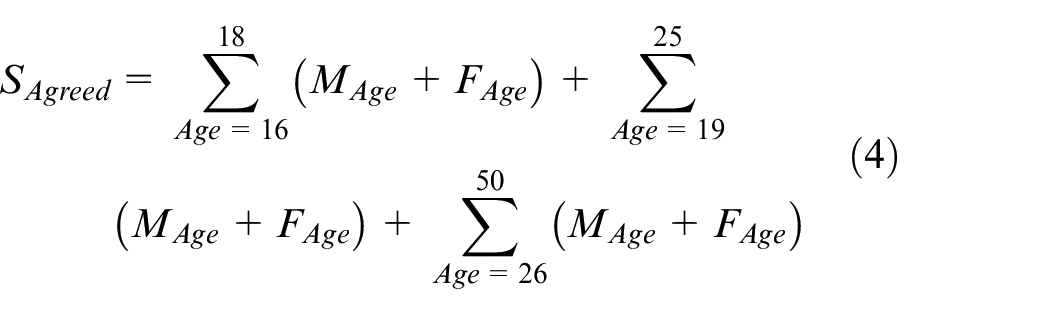
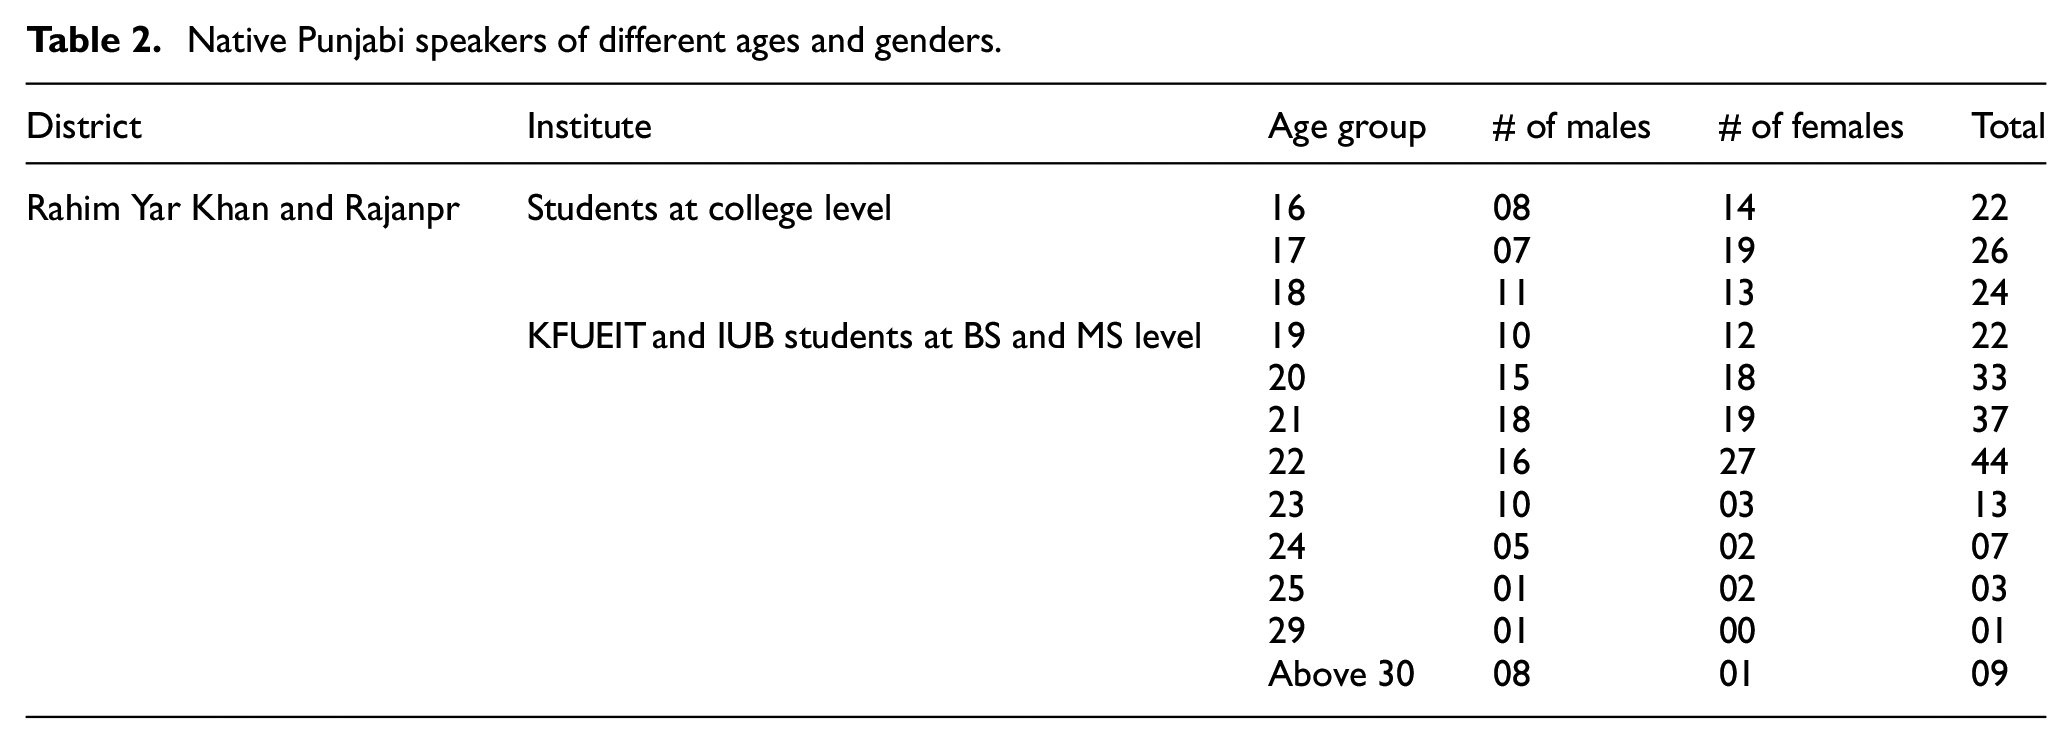
Averages of 72 students were taken from the institute consisting of 26 males and 46 females belonging to the age group 16–18 years. 156 students were taken from different universities that were enrolled in different Bachelor level and MS level programs including 75 males and 81 females belonging to the age group 19–25 years. Thirteen participants were taken that belonged to the age group 26–50 years including 10 males and 03 females. The 241 participants spoke three sentences. Therefore, 241 × 3 = 723 sounds of sentences are recorded. The total number of words in three sentences is 32. So, 32 × 241 = 7712 − word sounds of all participants. The two letter words that are spoken by participants in three sentences are 11. So, the total two letter sounds are 11 × 241 = 2651. Similarly, the three-letter words are 15. So, the total three letter sounds are 15 × 241 = 3615. The four-letter words are 7. So, the total four-letter sounds are 7 × 241 = 1687 and five-letter words are 2. So, the total five letter sounds are 5 × 241 = 482. The age group having no entry in the table is considered as 0 entries for that particular year. Its representation according to age in years and gender category is shown in Table 2.
Native Punjabi speakers of different ages and genders.
To accomplish the tasks needed for this study, a noise-free environment is selected such as “FM Radio 105 Awaz Sadiqabad” and “FM Radio 99 Jeevay Pakistan Rahim Yar Khan.” The spoken Punjabi sentences with different accents are recorded and written. Figure 3 shows a few samples from the recorded words.
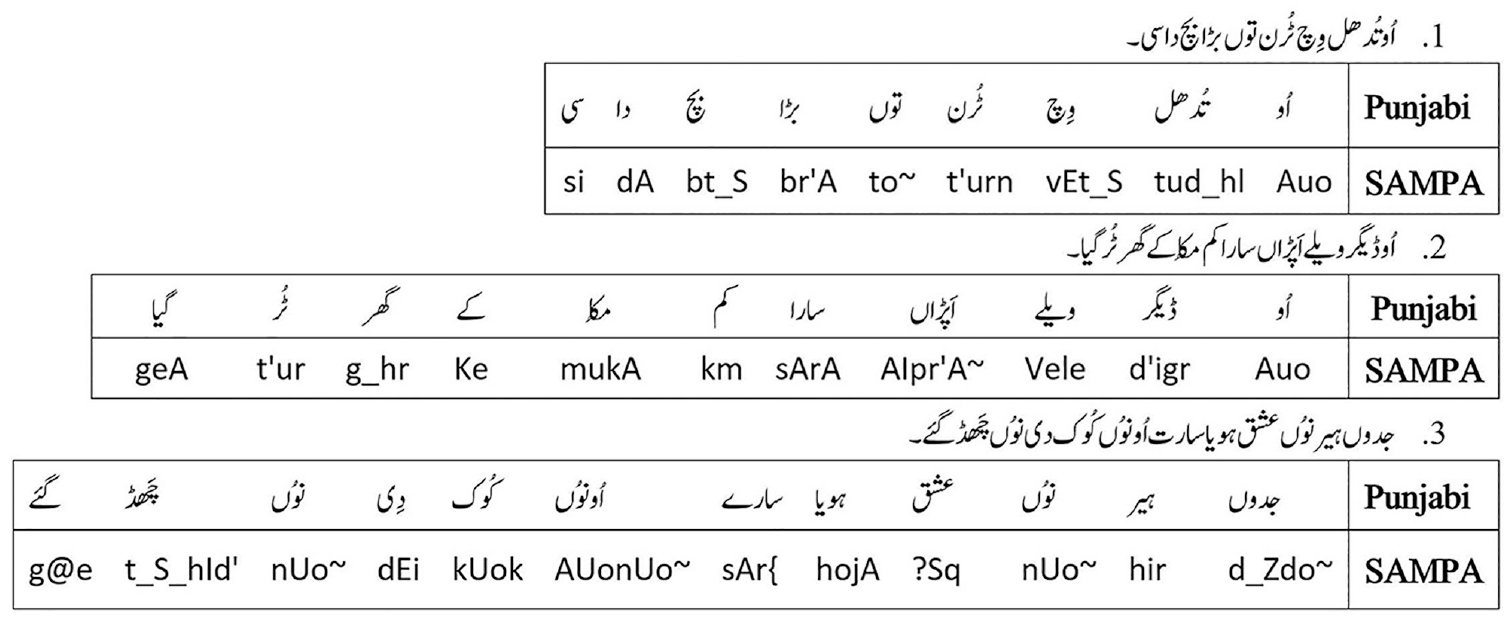
Sample spoken Punjabi words.
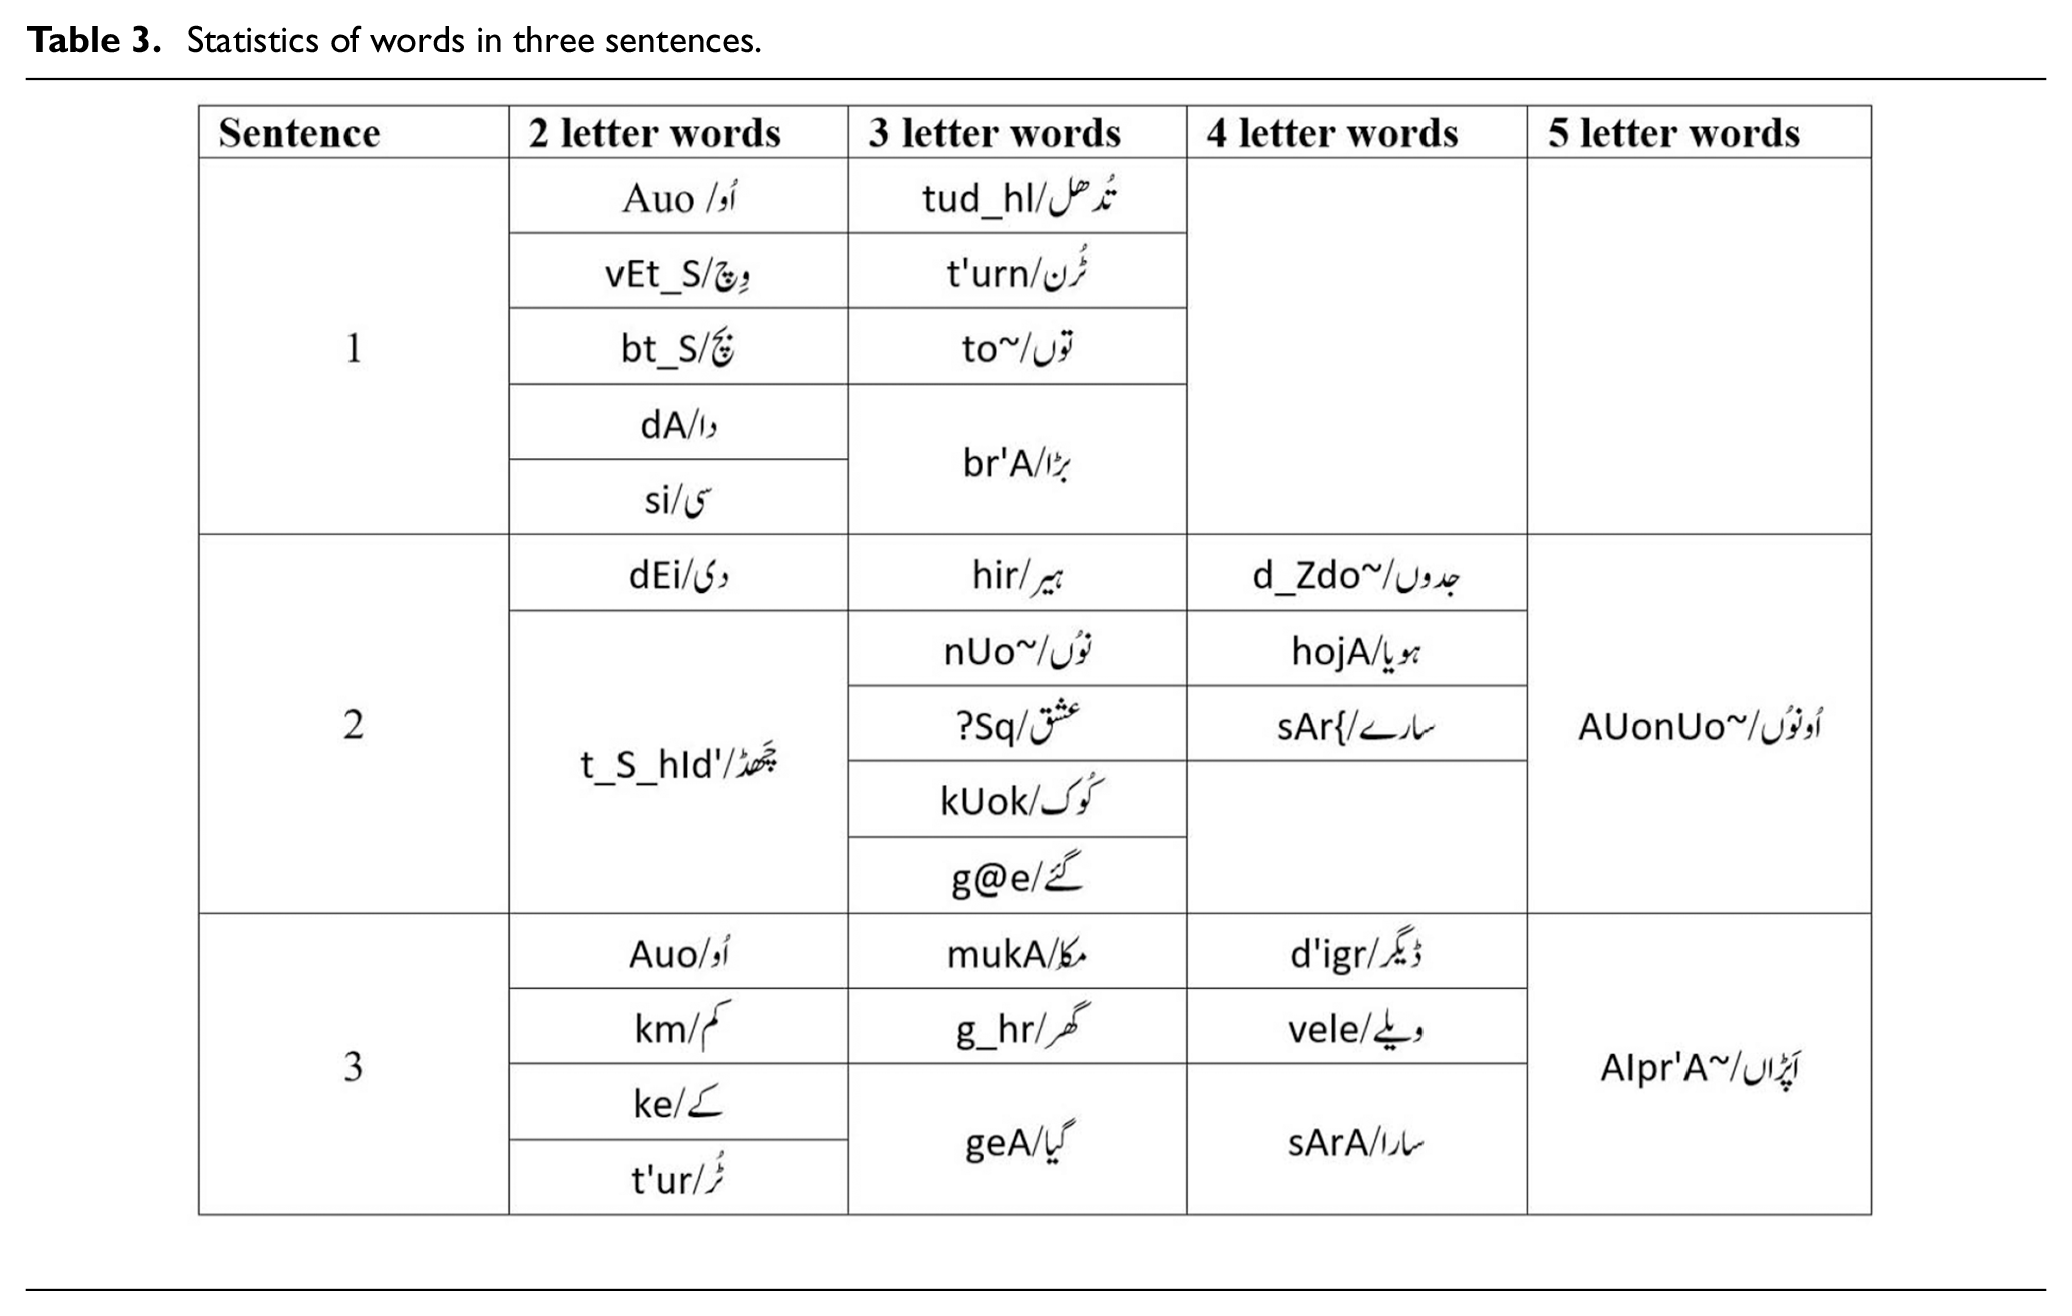
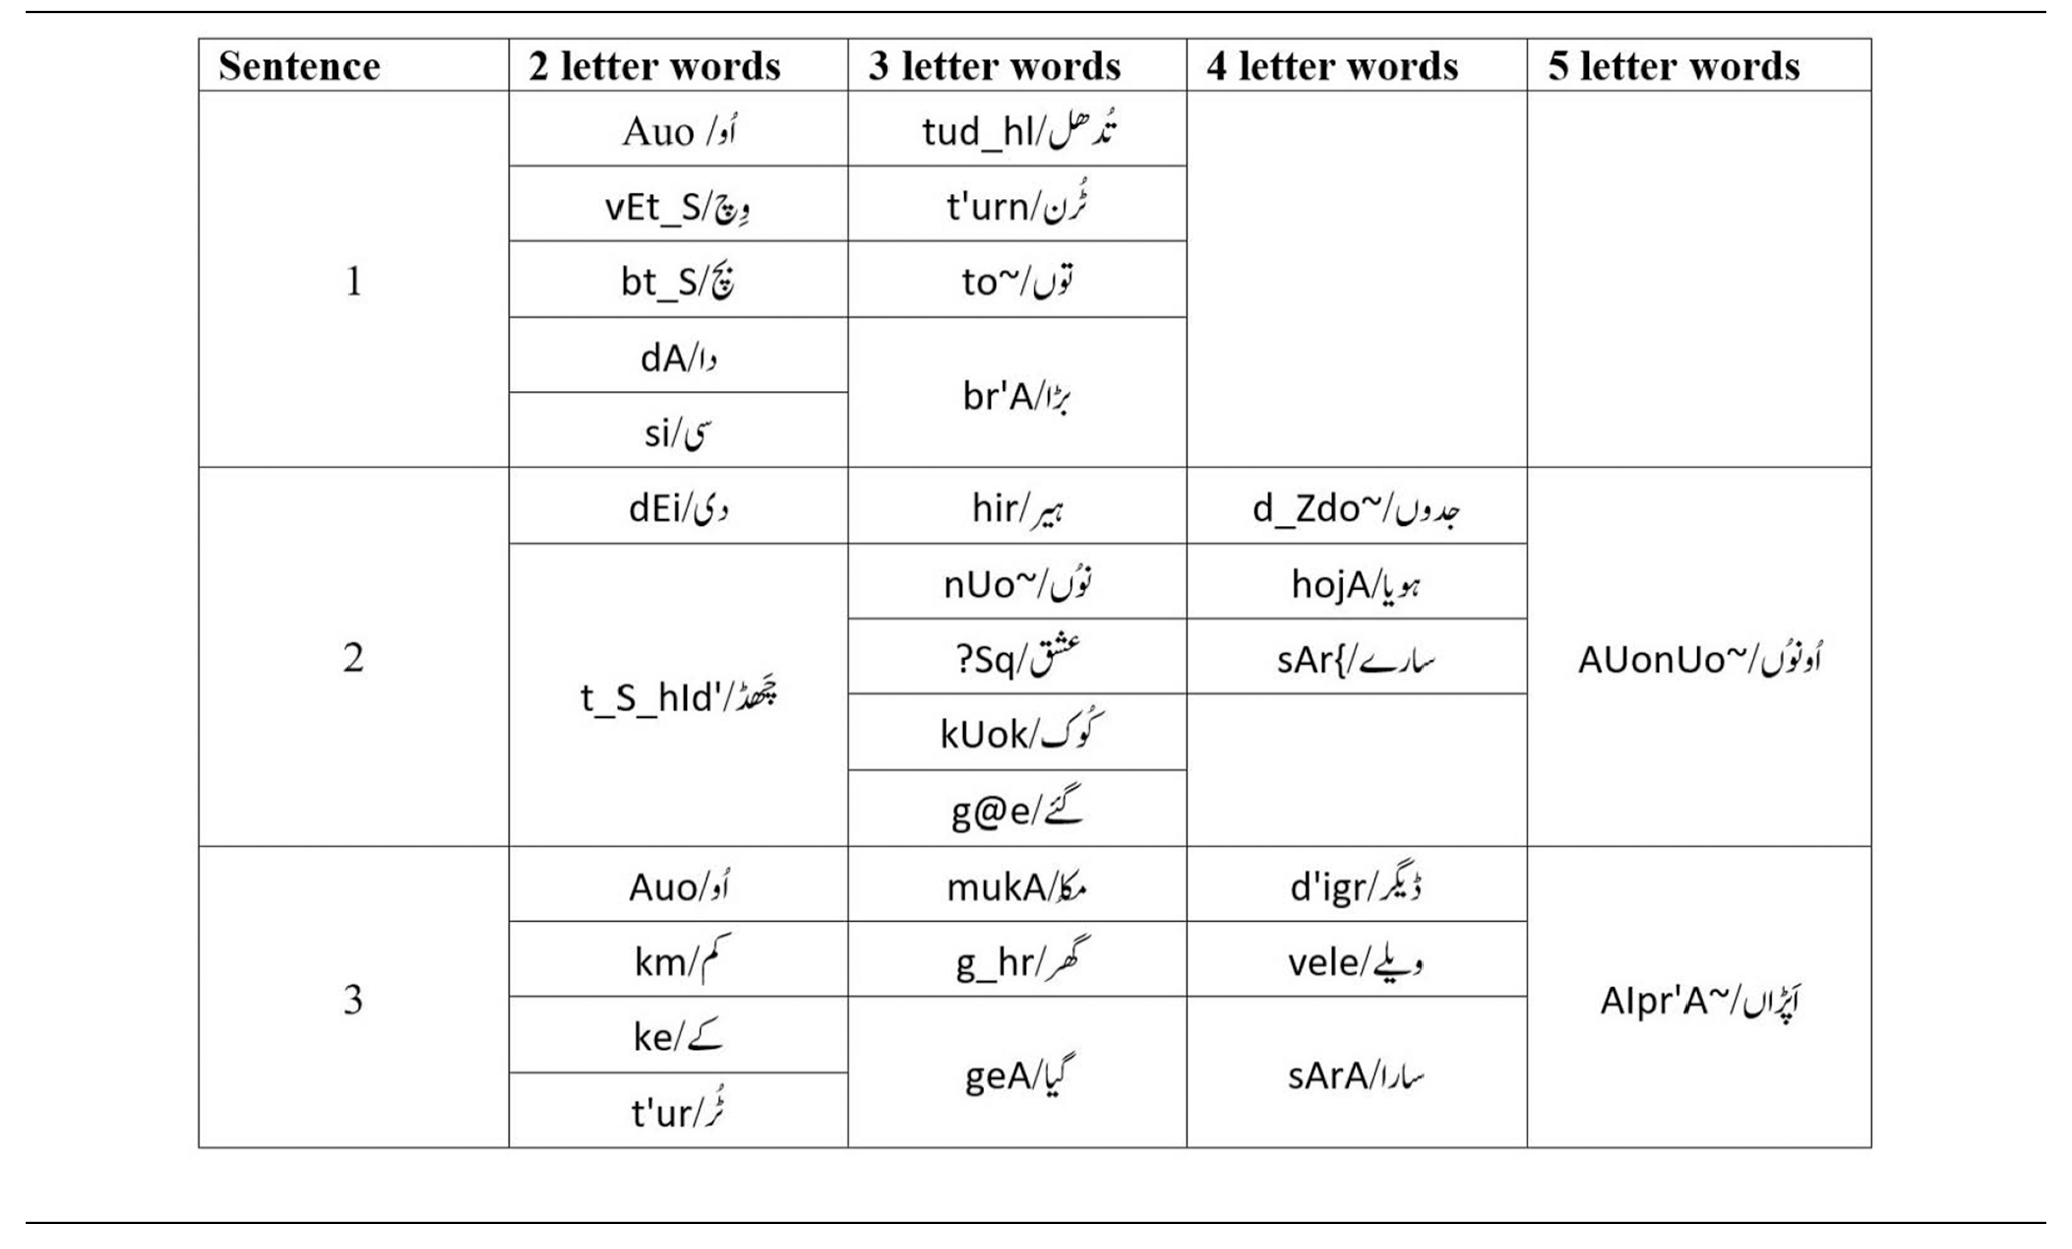
All these recorded sounds are saved in a file and sentences are evaluated. From sentences, words are extracted and from words, syllables are evaluated. The dataset is made up of sentences, words, and syllables that are extracted from recorded sounds. Furthermore, all these sentences are broken down into 2, 3, 4, and 5-syllable words as shown in Table 3.
Statistics of words in three sentences.
Prosodic features extraction using MFCC
MFCC is used for transforming whispered voices into regular speech. 25 The signal is represented in the Mel scale, which is based on how observers perceive the pitches at uniformly spaced intervals. This scale uses a filter with linear spacing at frequencies less than 1000 Hz and logarithmic spacing at frequencies over 1000 Hz. The first process, emphasizes the higher frequencies, which will make the signal at those frequencies more intense. In the second process, the segmentation of the speech database is done into boxes between 20 and 40 ms. The voice signal is divided into N-sample frames per frame. Then, a window is employed in signal processing when a signal in which we are interested has a finite length. A calculation may only be performed with a finite number of points, and a genuine signal must be finite in both time and frequency. After that, the Fourier transform must be applied to the convolution of the glottal pulse and vocal tract impulse response in the time domain to convert each frame of N samples from the time domain to the frequency domain. Afterward, the Fast Fourier transform spectrum has a relatively wide frequency range, and the voice signal deviates from a linear scale. Mel Filter Bank’s approach resolves this issue. Using the Cosine transform, we accomplish this by converting the Mel spectrum to the time domain. As a result, each input phrase is converted into a series of acoustic vectors. After completing this process MFCC is obtained.24,26 Another technique is The Matthews correlation coefficient (MCC) is often employed as a performance statistic in binary classification tasks, particularly when dealing with imbalanced datasets. 27 However, MFCC is a widely used feature extraction technique specifically designed for audio signals. It captures essential spectral characteristics of sound, making it particularly effective for tasks such as speech and speaker recognition. Its widely used technique in audio signal processing aligns with the complexity of the task.
Python libraries
The acoustic signal is gathered using a microphone to create a sound database that includes 721 recordings. The format of the collected sound is “.mp3” which is not compatible with the Python environment. So, data is converted first into “.wav” format to make sure the data is compatible with the working environment. This step is performed to load the data in machine-understandable format. Different Python libraries are available for the manipulation of sound recordings such as PYO, Dejavu, and Py Audio analysis. The Py audio analysis is an open Python library used for the representation and extraction of audio features.
MFCC features extraction process
The MFCC feature technique is utilized on acoustic signals for the automatic detection of pitch based on amplitude. 28 The detection of male and female voices based on amplitude is the outcome of this technique. Six classifiers were used in this study including KNN, RF, SVM, LR, GB, and ETC. These classifiers were selected based on how well-suited they were for the given job. we purposefully built the study to provide a basic comprehension of the classification task. We were able to systematically explore the issue space by concentrating on these classifiers. On the other hand, we are actively investigating adding new features, classifiers, and dimensional reduction processes in our future work because we recognize how important it is to advance the methodology. This ongoing process is consistent with our dedication to improving and broadening our categorization framework in order to guarantee a thorough and reliable examination of the data.
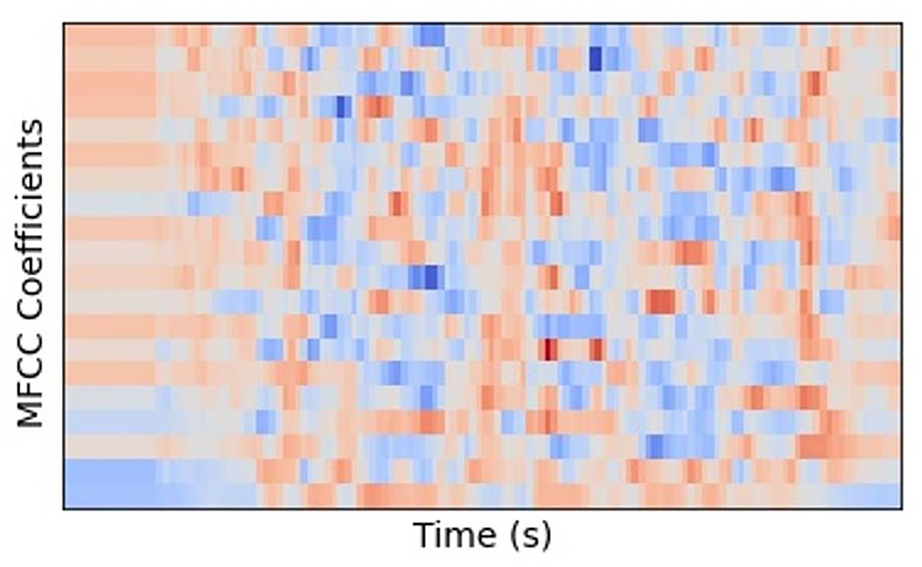
Initially, the dataset is loaded and MFCC features are evaluated. The MFCC extracted around forty features from input data, but the prime focus is on amplitude to distinguish the native Punjabi male and female speakers. After that, the data scaling is implemented and data is scaled as per features based on the mean statistical technique. The data scaling is also necessary because the data is not prepared for the input. Data are arranged in the form of an array. After that, a procedure known as data split is used to divide the given dataset into two subsets training (also known as calibration) and test (also known as prediction). The data is split according to the weightage of 80% and 20% where 80% of data is reserved for training and 20% for testing purposes. Multiple classifiers are used to attain better results. The workflow of the proposed model is given in Figure 4. The block diagram focuses on illustrating the most important outcomes and procedures while being purposefully brief. The methodology’s key components and related outcomes are concisely depicted in the visual form. Along with offering a high-level overview, the block diagram is accompanied by a corresponding written description that offers more information and context. The representations of MFCC features for male and female speakers are shown in Figures 5 and 6, respectively depicting the male and female speakers.
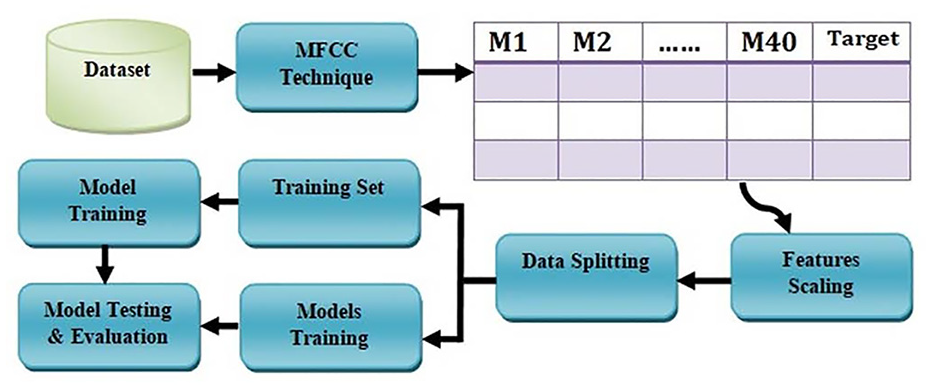
Workflow of the system for features extraction using MFCC.
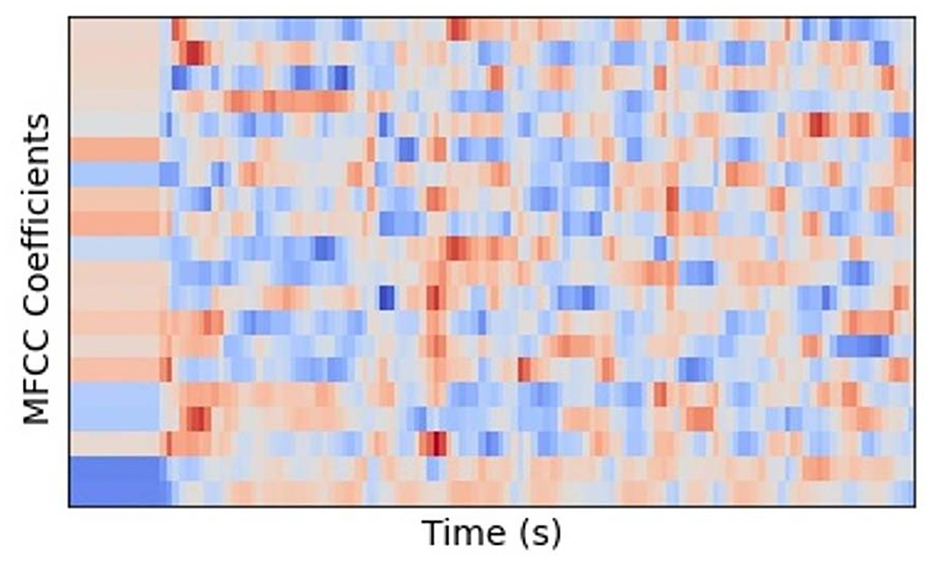
MFCC coefficients for male.
MFCC coefficients for female.
Extracted prosodic information
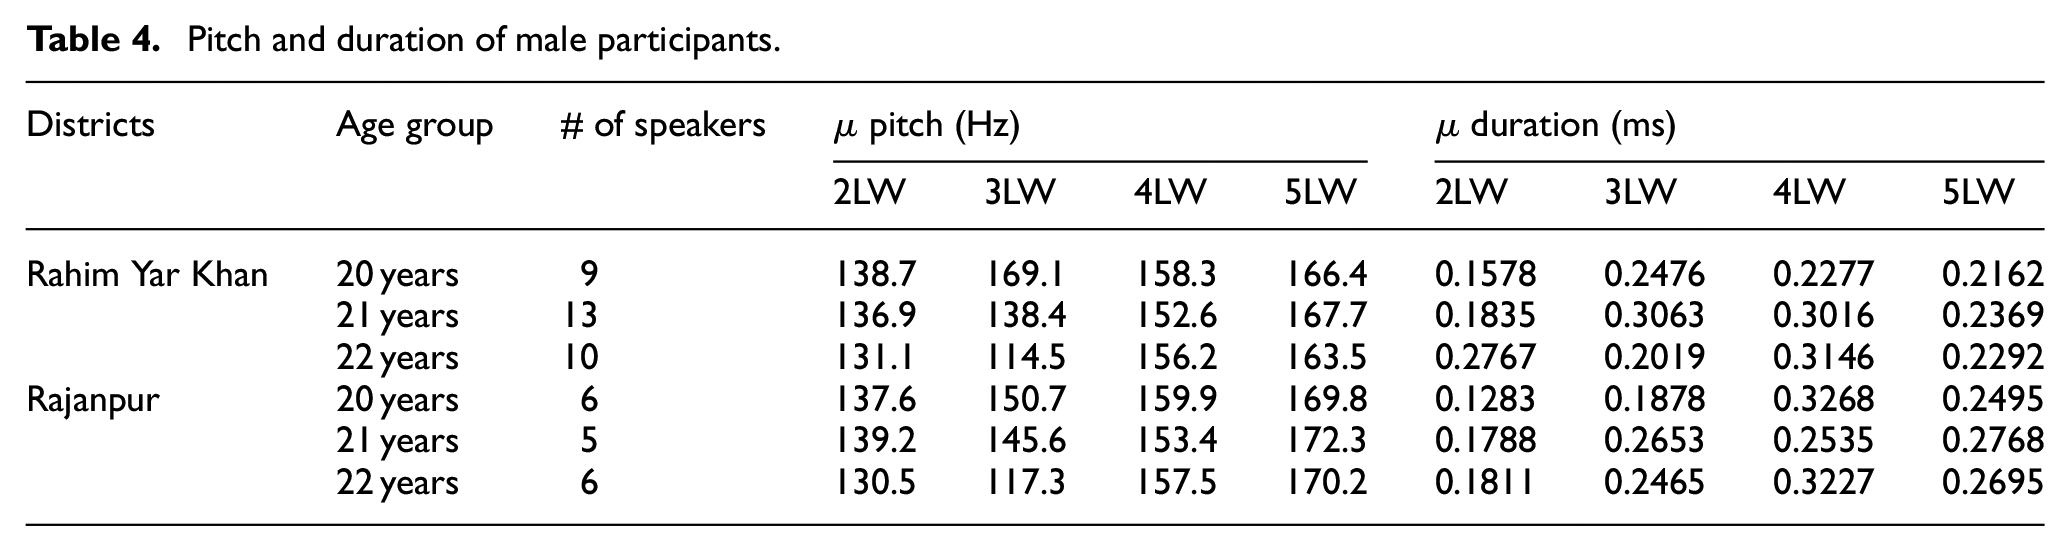
The pitch and duration of male and female participants on the selected dataset are analyzed here. The 49 male participants out of 241 participants were randomly selected for ages 20, 21, and 22 years. Pitch is linked to the voice’s perceived frequency, which varies between speakers who are male and female. On the other hand, duration might be able to capture different speech patterns. The age groups of 20, 21, and 22 are used and analyzed for this purpose because the majority of the students in university belong to this age group. The pitch and duration of segmented 2-letter words (2LW), 3-letter words (3LW), 4-letter words (4LW), and 5-letter words (5LW) are separately computed. It is noted that no 1 letter word is presented in the composed three sentences. The maximum pitch of words from district Rahim Yar Khan and Rajanpur for these ages is 232.9 Hz and the minimum pitch is observed as 84.9 Hz. The average pitch is recorded as 158.9. Whereas the highest duration in ms is observed as 0.4500 and the lowest duration is noted as 0.1042. The average duration is recorded as 0.2771. The
Pitch and duration of male participants.
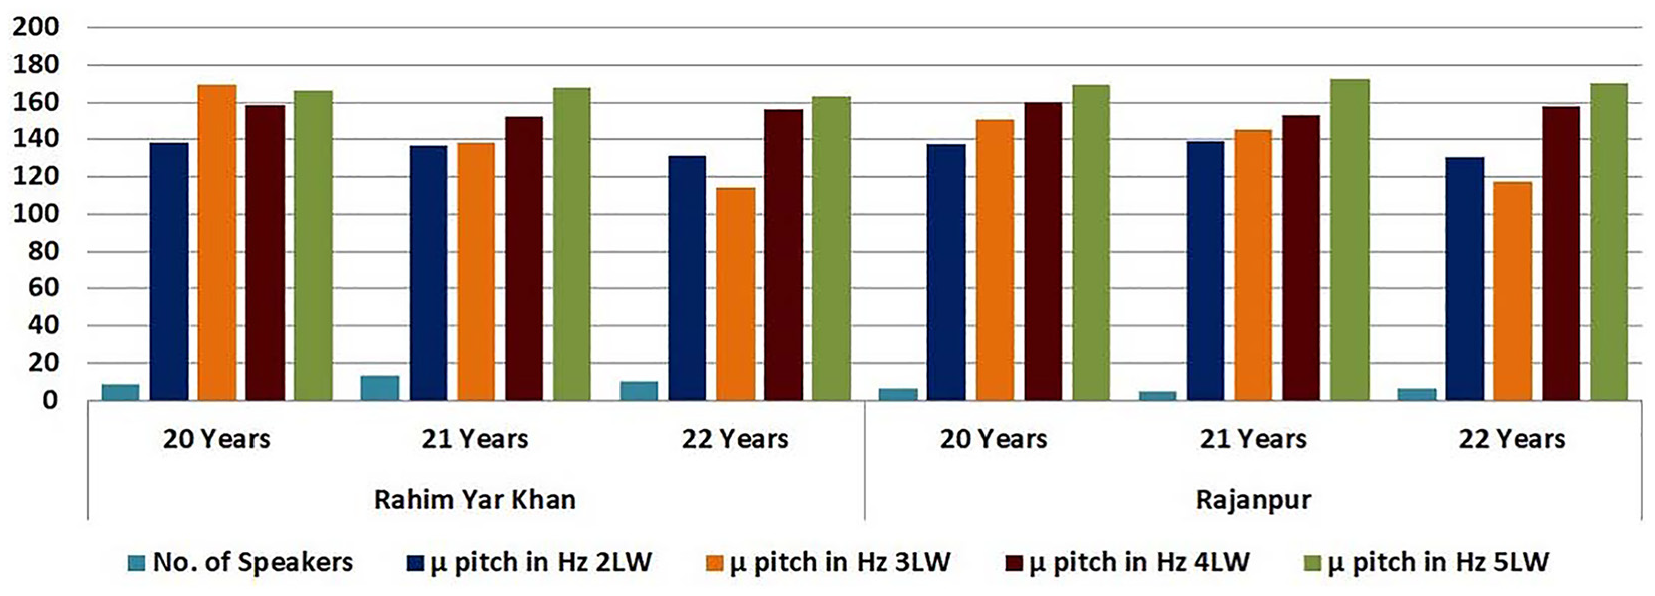
Pitch of male participants.
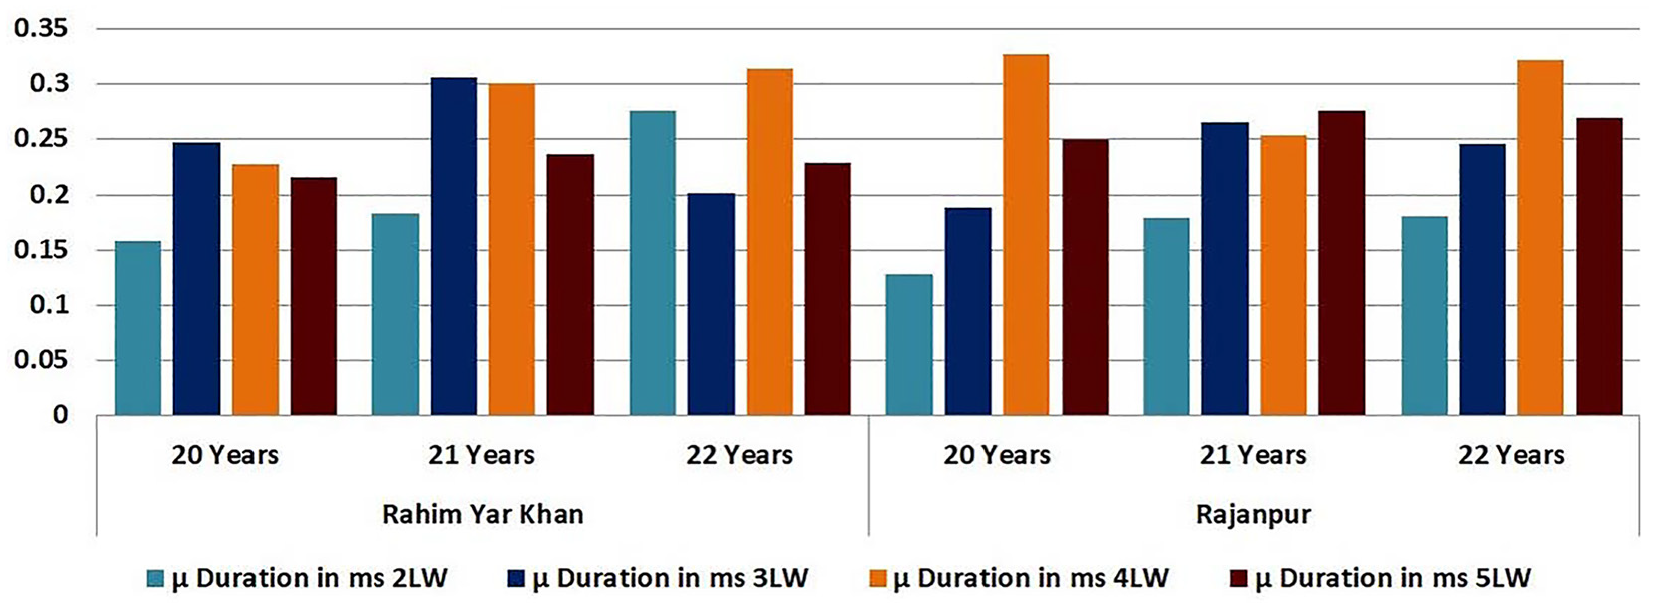
Duration of male participants.
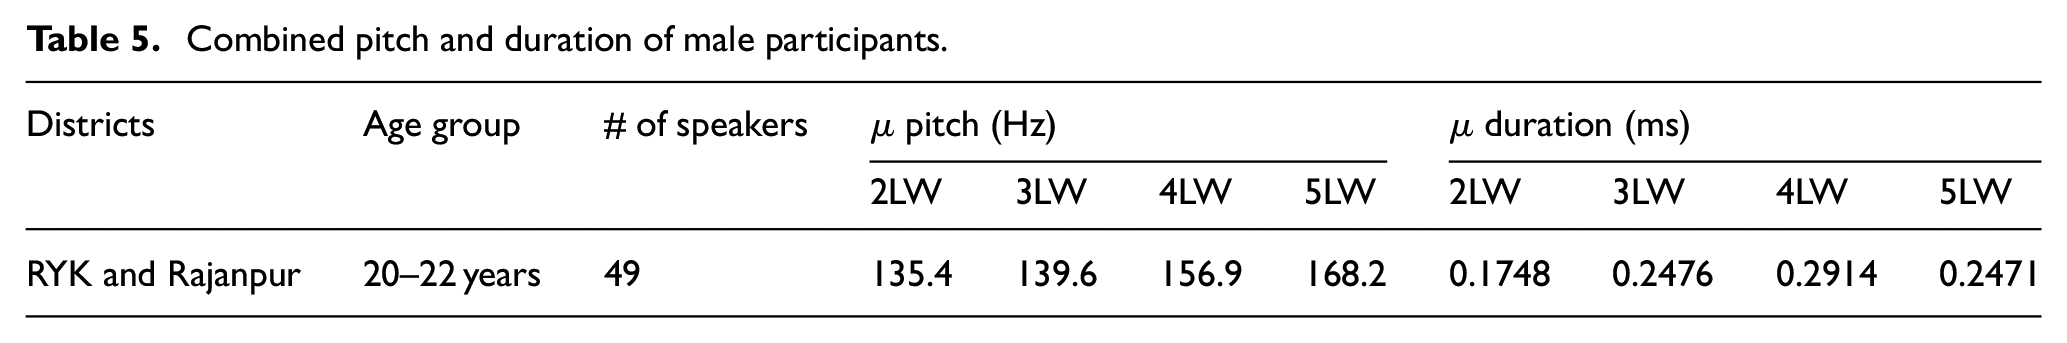
Table 5 shows the combined age group of 49 male participants that belongs to 20–22 years of both districts. It has been noted that no significant difference is found when the pitch and duration are evaluated by combining the age group as the pitch and duration reside in the minimum and maximum pitch and duration of participants that belong to both districts.
Combined pitch and duration of male participants.
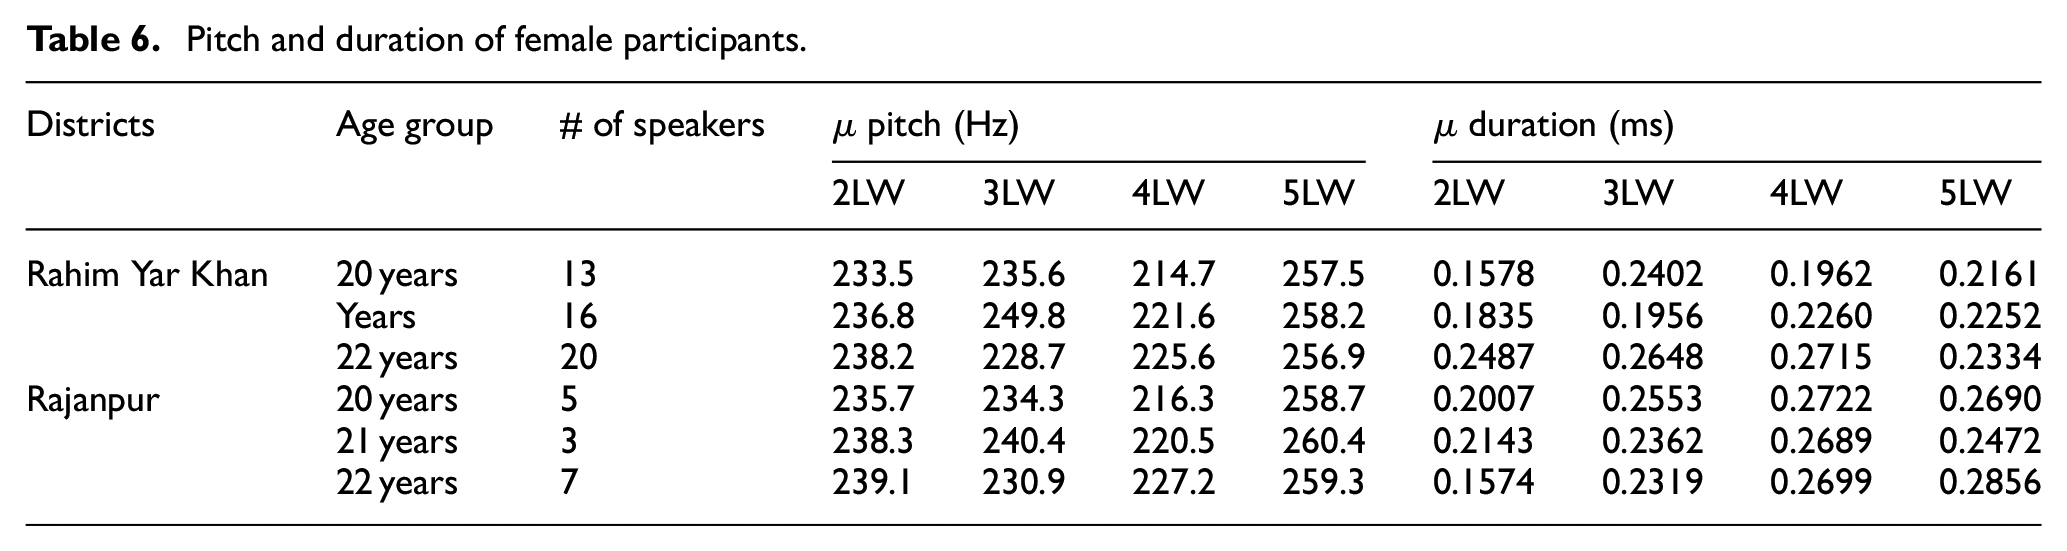
Similarly, the experiments were performed on the female participants, and 64 females out of 241 participants were randomly selected having the ages of 20, 21, and 22 years and recorded their sounds. The maximum pitch of words from district Rahim Yar Khan and Rajanpur for these ages is 369.8 Hz and the minimum pitch is observed as 107.5 Hz. The average pitch is recorded as 238.6. Whereas the highest duration in ms is observed as 0.3569 and the lowest duration is noted as 0.1039. The average duration is recorded as 0.2304. Table 6 presented the
Pitch and duration of female participants.
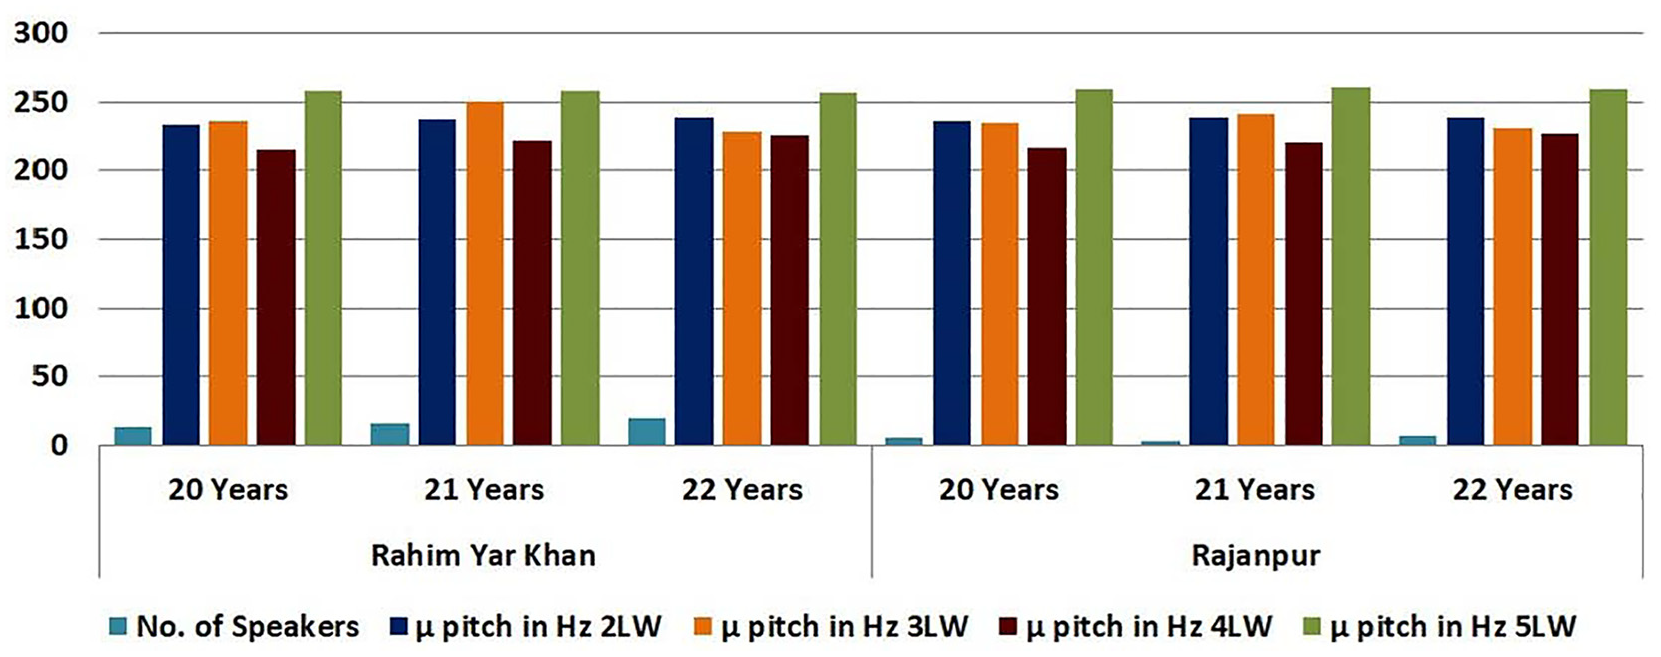
Pitch of female speakers.
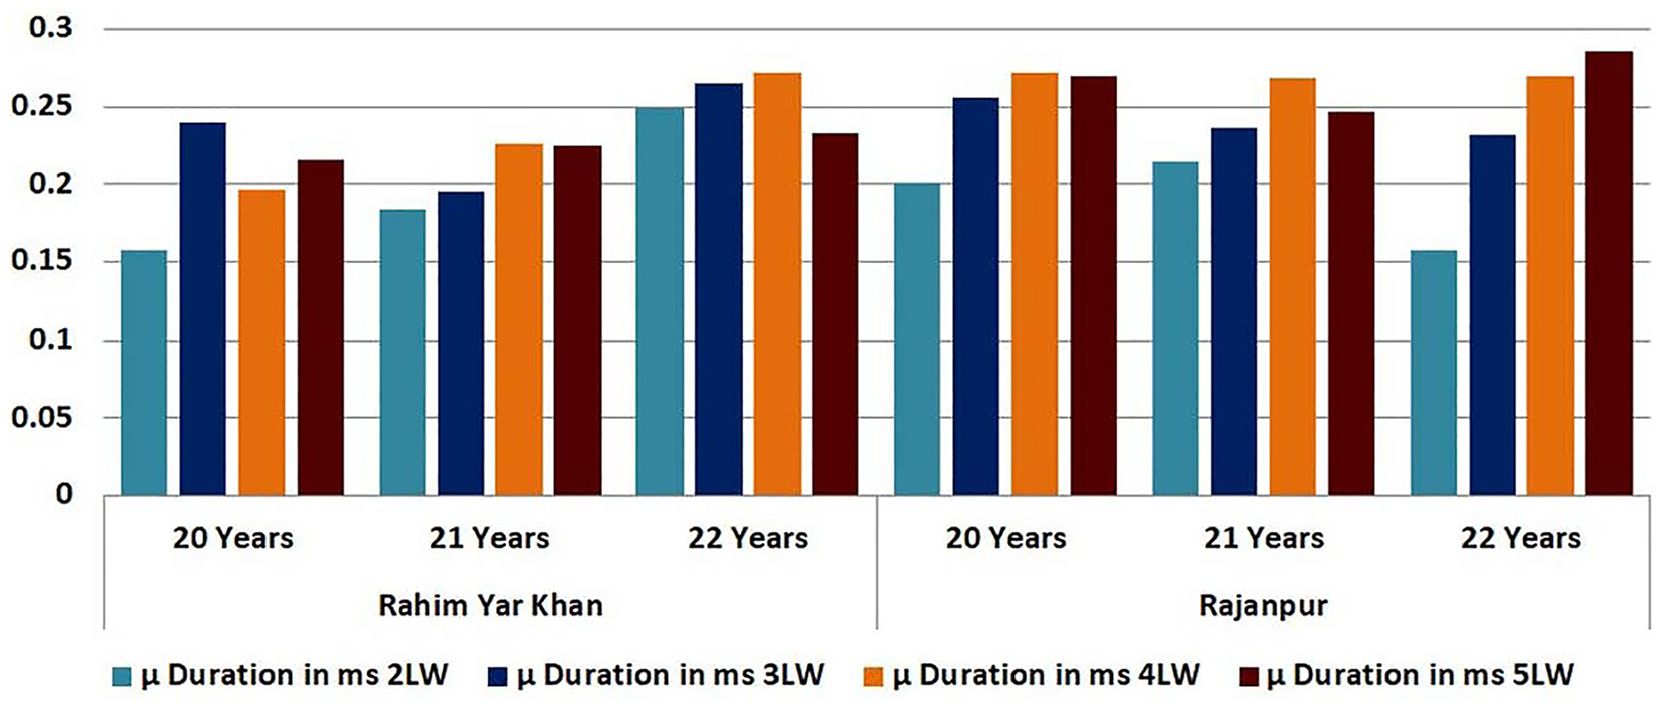
Duration of female speakers.
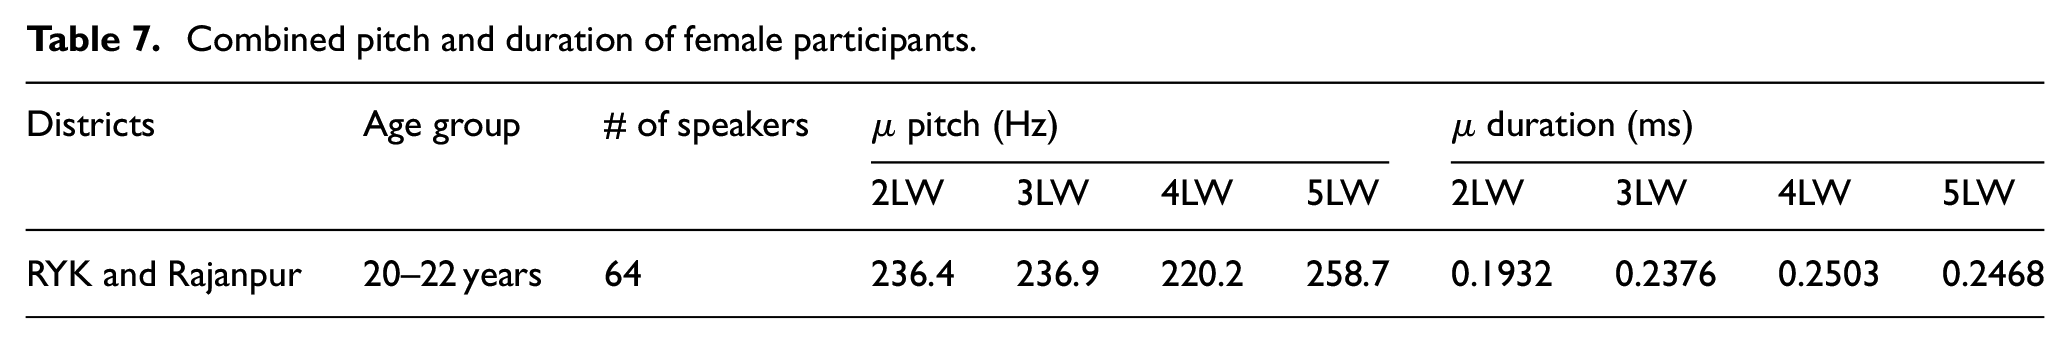
Table 7 shows the combined age group of 64 female participants that belongs to 20–22 years of both districts. It has been noted that no significant difference is found when the pitch and duration are evaluated by combining the age group as the pitch and duration reside in the minimum and maximum pitch and duration of participants that belong to both districts.
Combined pitch and duration of female participants.
Classification of prosodic information
This section presents the classification of male and female voices using four different classifiers such as KNN, SVC, LR, and RF. The selected classifiers are trained and tested on the feature datasets received using the MFCC technique. For classification, the Scikit-learn (SKlearn) library is used for the machine learning model. This is typically used in the machine learning environment. The kit provides efficient tools for the classification of data. This library is based on SciPy, NumPy, SciPy, and Matplotlib and was written primarily in Python. After that, the dataset is loaded as input data, and all these classifiers are imported by using the SKlearn kit.
Furthermore, the confusion matrix is a robust technique used to evaluate the performance accuracy of the classification techniques (29). Hence; the performance of each classifier is evaluated using the formula of three metrics that is, precision, recall, and F1 score.
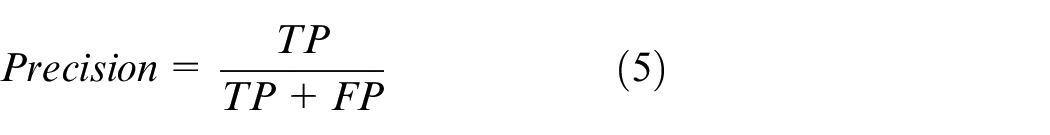
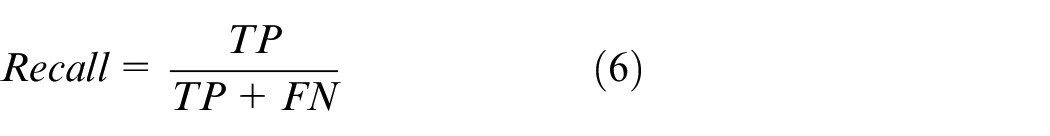
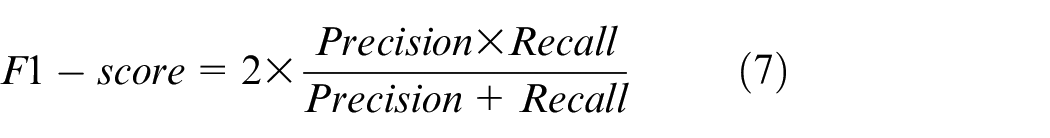
where PP is a predictive positive, the number of actual positives is AP, FP is the number of false positives, the number of true positives is TP, and FN is the number of false negatives.
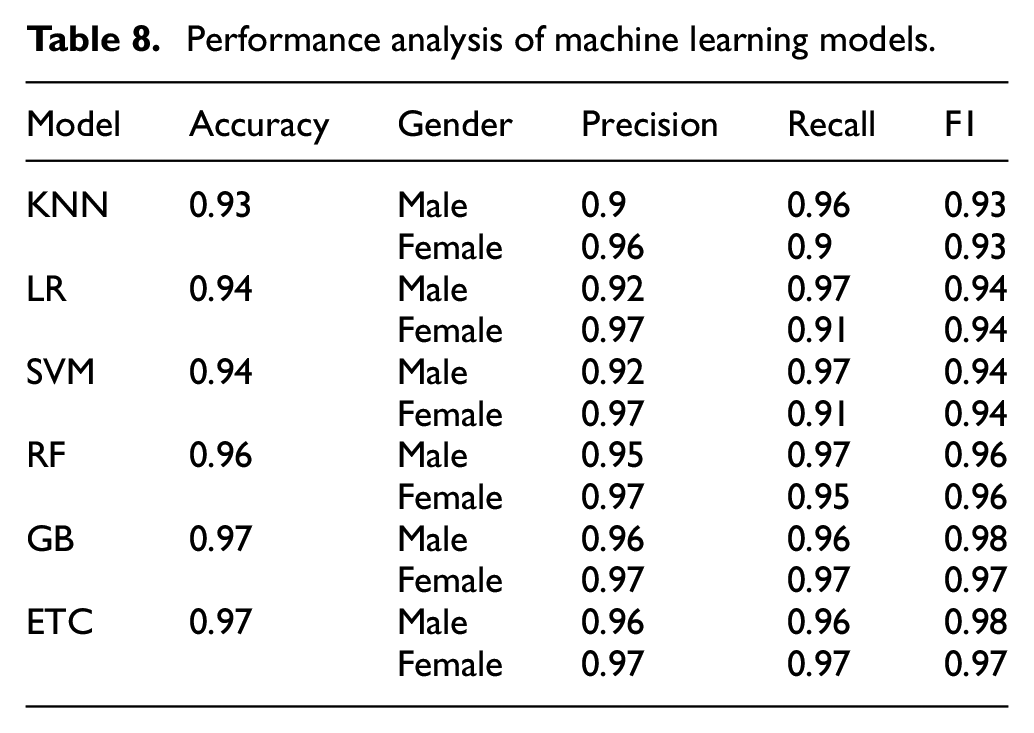
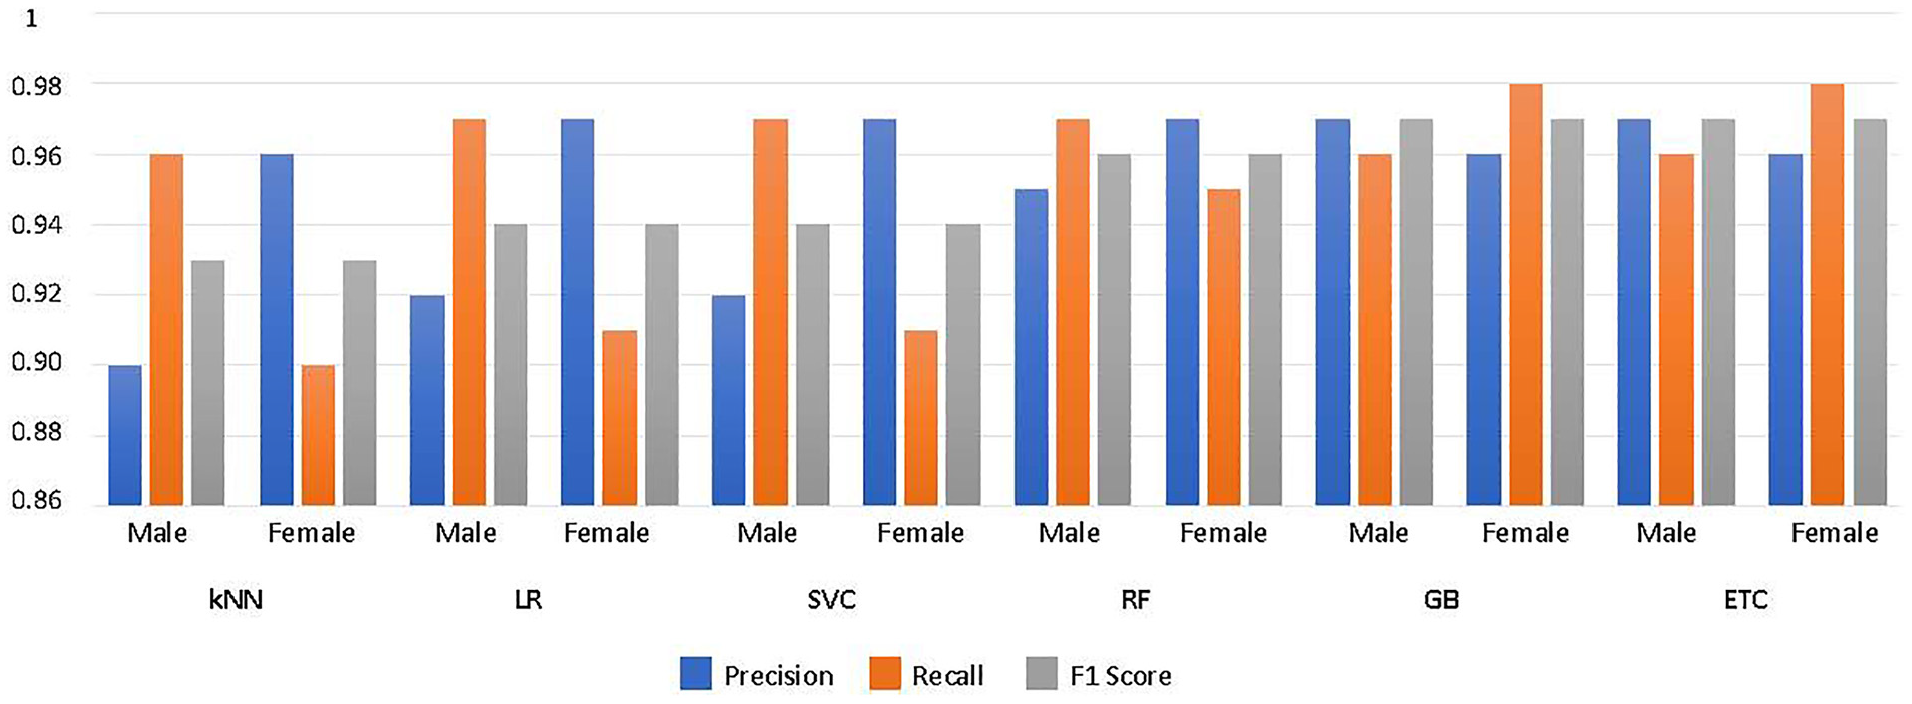
Experimental results are presented in Table 8. It is noted that the performance of all models is equally well, with RF obtaining the highest performance. The results of KNN for male speakers are noted as having a precision of 0.90, a recall of 0.96, and an F1 score of 0.93. Whereas for the female speakers, the precision is 0.96, the recall is 0.90, and the F1 score is 0.93. The overall accuracy of the KNN classifier is observed as 93%. In the case of LR, the experiment result for male speakers is observed as the precision is 0.92, the recall is 0.97 and the F1 score is 0.94. Whereas for the female speakers, the precision is 0.97, the recall is 0.91, and the F1 score is 0.94. The overall accuracy for the LR classifier is observed as 94%. Furthermore, the precision, recall, and F1 score for male speakers in SVM are noted as 0.92, 0.97, and 0.94, respectively. For female speakers, the precision, recall, and F1 score are noted as 0.97, 0.91, and 0.94, respectively. The overall accuracy for the SVM classifier is observed as 94%. The two latest classifiers including ETC and GB also implemented here. The accuracy of GB and ETC are noted as 97% and it is the highest accuracy among all the models implemented in this study. The precision is 0.96, the recall is 0.96 and the F1 score for GB is 0.98 for male speakers. Whereas for female speakers the precision, recall, and F1 score is noted as 0.97. The precision for ETC is 0.96, the recall is 0.96 and the F1 score for GB is 0.98 for male speakers. Whereas for female speakers the precision, recall, and F1 score is noted as 0.97. Which is the same for both ETC and GB models. The graphical representation of the performance of all classifiers regarding each gender is presented in Figure 11.
Performance analysis of machine learning models.
Evaluation metrics for different classifiers.
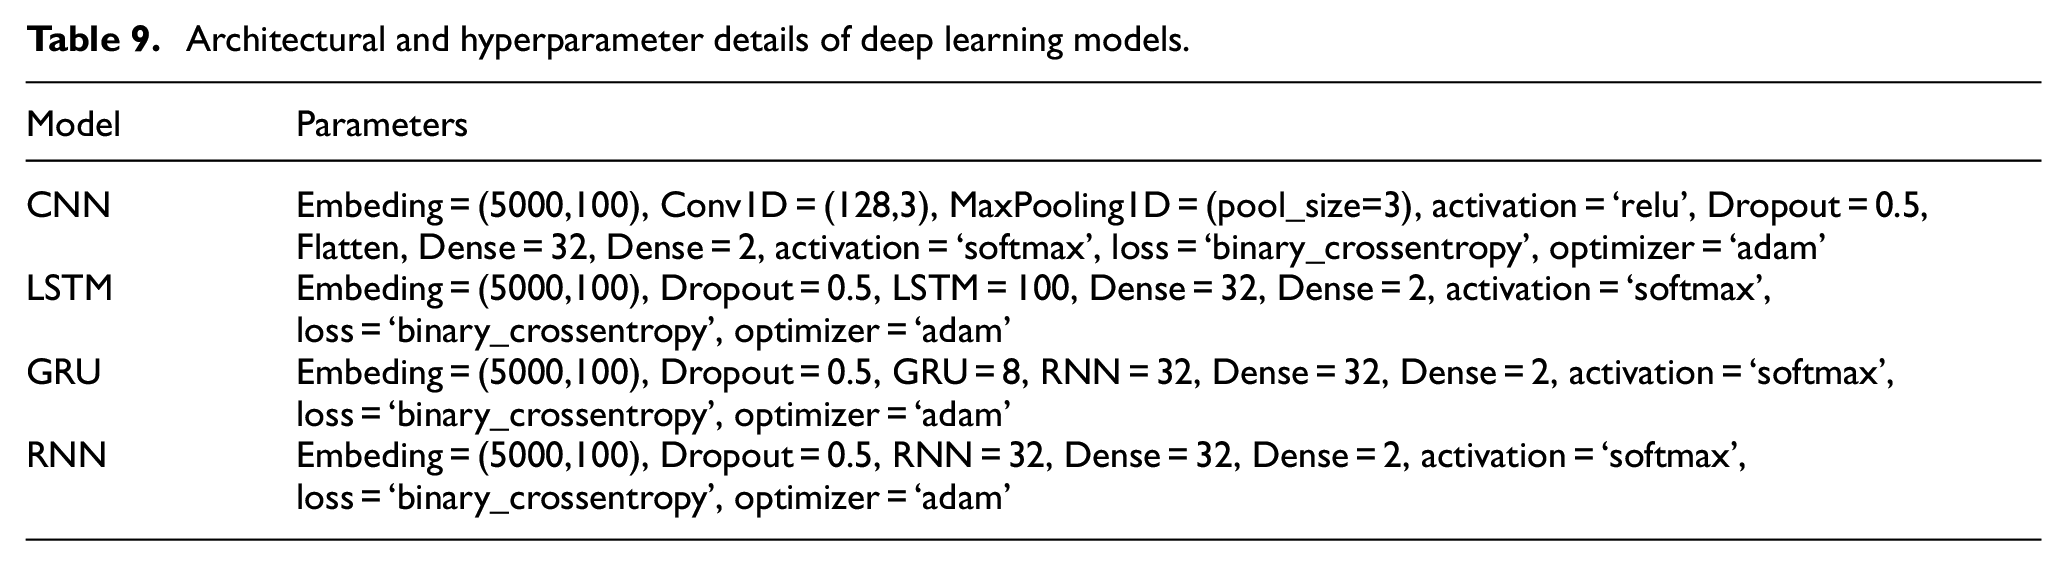
To test and apply deep learning models, such as CNN, LSTM, GRU, and RNN, on the dataset, accuracy, precision, recall, and F1 scores are assessed. These models are optimized concerning the optimal architecture and various parameters. Started by loading the audio recordings of the male and female speakers into the dataset and extracting relevant characteristics, such as MFCCs. The dataset is then divided into training, validating, and testing sets by specifying 80%, 10%, and 10% respectively. while ensuring that each set has a fair distribution of speakers. The next step utilizes tools such as TensorFlow, PyTorch, or Keras to implement and train different deep-learning models. TensorFlow’s Sequential API is used to define an LSTM model, which can then be trained on the training set and its performance verified on the validation set. GRU and the Long Short-Term Memory (LSTM), were utilized to overcome some of the drawbacks of conventional RNNs in handling lengthy sequences and capturing long-term dependencies. A detailed description of hyperparameters is also provided in Table 9. A batch size of 32 is used for all deep learning models while the evaluation metric is accuracy.
Architectural and hyperparameter details of deep learning models.
Experimental results are presented in Table 10. CNN’s accuracy is reported to be 86%, whereas LSTM’s accuracy is 78%. In contrast, GRU’s accuracy is at 78%. Ultimately, an accuracy of 80% is reported for RNN.
Performance analysis of deep learning models.
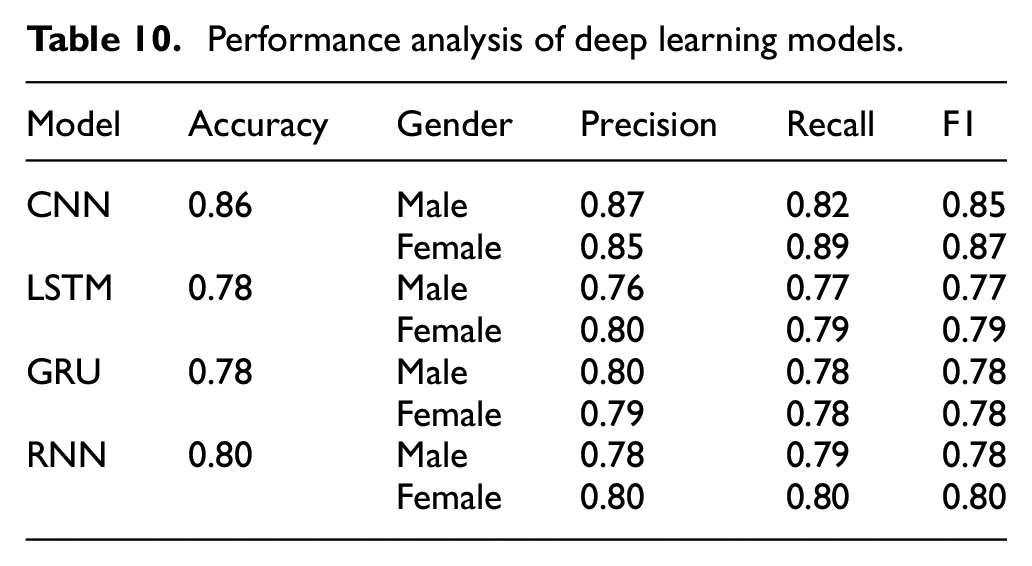
In the case of CNN, the precision is noted as 0.87, the recall is 0.82, and the F1 score is 0.85 for male speakers. Whereas in female speakers the precision is 0.85, the recall is 0.89, and the F1 score is 0.87. In the case of the LSTM for male speakers, the precision is 0.76, the recall is 0.77 while the F1 score is noted as 0.77. For female speakers the precision is 0.80, the recall is 0.79 and the F1 score is also 0.79 for female speakers. In the case of the RNN deep learning model, the precision is 0.84, the recall is 0.66, and the F1 score is 0.74 for male speakers. For female speakers, the precision is 0.75, the recall is 0.89 and the F1 score of 0.82 is observed. The performance accuracy is shown in Figure 12.
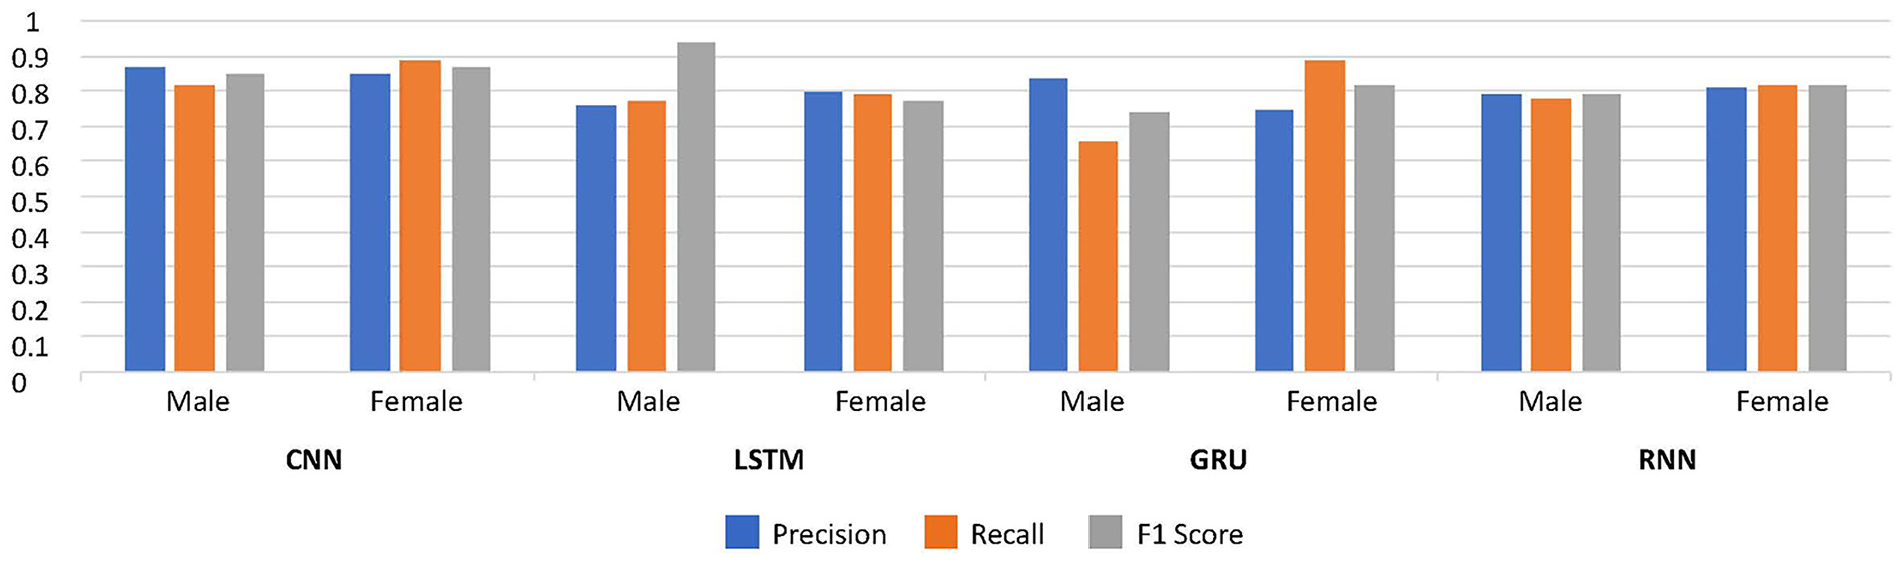
Evaluation metrics for different deep learning models.
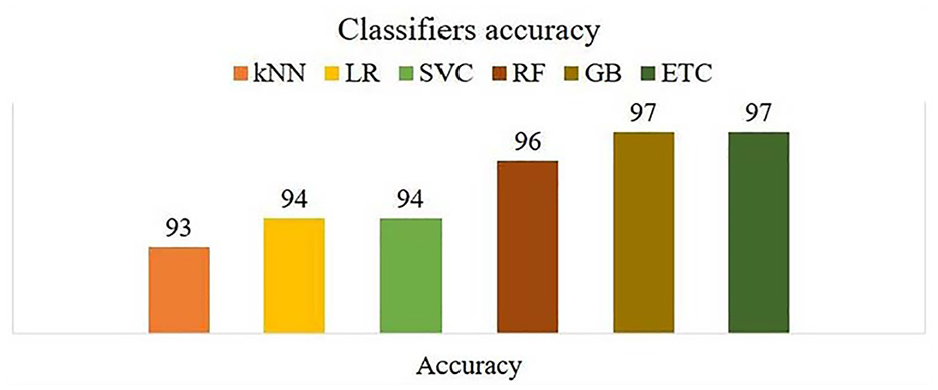
It has been noted that deep learning outperforms machine learning classifiers on this dataset. The performance of the models is evaluated on 725 records including 289 male recordings and 436 female recordings belonging to districts Rahim Yar Khan and Rajanpur. Twenty percent of data was kept for testing including 58 male sounds and 87 female sounds. GB and ETC models performed well as compared to other classifiers and their accuracy is noted as 97%. Random forest has a 96% accuracy Whereas SVC and LR have 94% accuracy each and KNN performs marginally low with a 93% accuracy. The performance accuracy of each classifier is shown in Figure 13.
Performance accuracy of implemented classifiers.
Performance evaluation is a significant task used to evaluate the performance of classifiers. For this purpose, we need to visualize the performance in such a way that is graphically represented. Here the most famous and important evaluation metric named Area Under the Curve (AUC) ROC (Receiving Operating characteristics) is used. It reveals how well the model can differ across classes. The ROC is plotted as on the X-axis the false positive rate is mentioned while on the Y-axis the True positive rate is mentioned. The curve that tends to the y-axis shows better performance whereas the curve that tends less toward the y-axis shows poor performance. Such as the lines of ETC and GB models tend more toward the y-axis showing better performance of these models whereas the red line indicating performance of the KNN tends less toward the y-axis and shows poor performance as compared to other classifiers. The ROC analysis of the selected classifiers is shown in Figure 14.
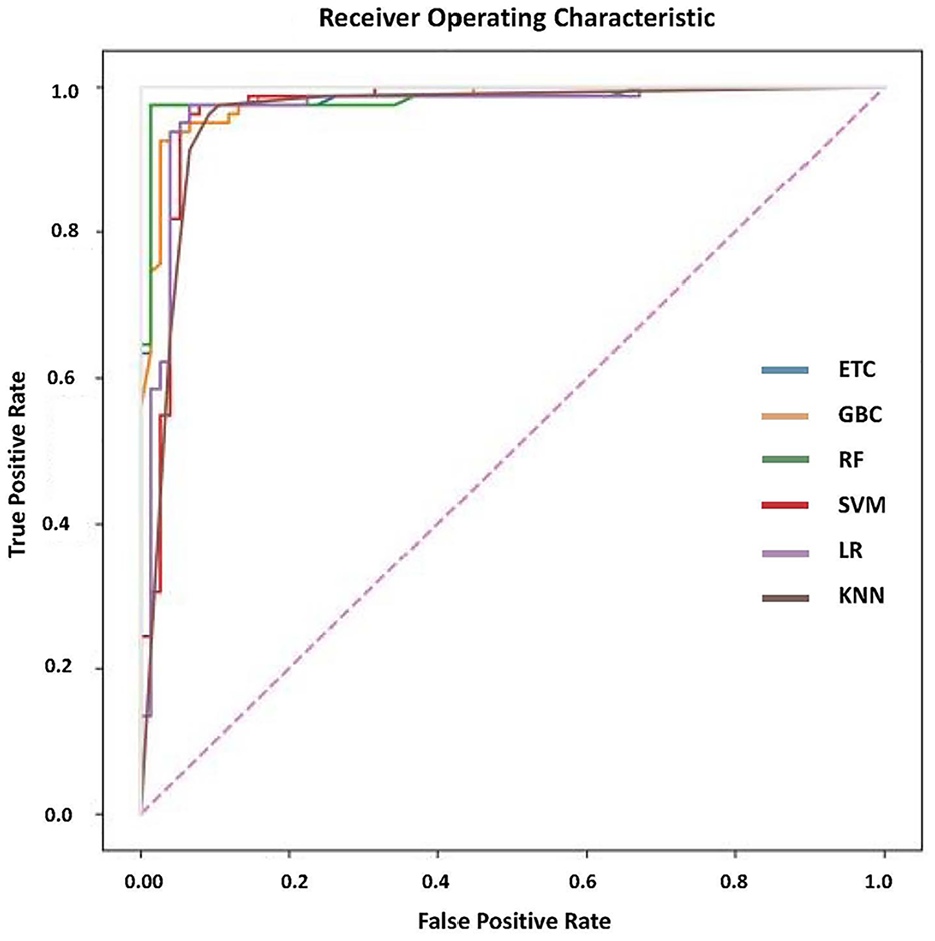
ROC analysis of classifier.
Discussions
This research work primarily focused on the dialect “Deeraywali” which is spoken by the people of four districts including Rahim Yar Khan, Rajanpur, Dera Ghazi Khan, and Muzaffargarh. Initially, the participants of two districts are targeted including Rahim Yar Khan and Rajanpur. The population that is targeted belongs to these two districts the graduate students enrolled in the two universities of Khawaja Fareed University of Engineering and Information Technology and the sub-campus, The Islamia University of Bahawalpur. The other two districts are not included in this research work because no student is found in any of said universities during the sound recording phase. There are a lot of prosodic features that can be extracted from a speech signal such as rhythm, tone, intensity, pitch, duration, stress, amplitude, and volume. In this research work, we focused on duration and pitch that is based on amplitude. The dataset of recorded Punjabi sentences is used as input data. The recorded input sounds are collected from two districts Rahim Yar Khan and Rajanpur. The conducted research work is carried out by using PRAAT and MFCC technique that extracts prosodic features such as pitch and duration. The other mentioned features will be carried out and analyzed in our future work by focusing on the remaining two districts Muzaffargarh and Dera Ghazi Khan. In this research work, the data was gathered in the form of a sound file from two districts of south Punjab including the districts Rahim Yar Khan and Rajanpur. The data was evaluated using PRAAT software and four classifiers such as KNN, SVC, LR, RF, GB, and ETC. After evaluating the sound records, it is concluded that the pitch and amplitude of males are comparatively lower than those of female speakers. Whereas the performance of the classifier shows superb performance by the GB and ETC classifiers which shows better performance compared to other classifiers with an accuracy of 97%. Furthermore, the data is also tested by using deep learning models including CNN, LSTM, GRU, and RNN. It is noted that CNN performed the best among other deep models with the highest accuracy of 86%.
The main contribution of this research work is to extract the prosodic features from the recorded sounds of the most prominent dialectMajhi of the Punjabi language, as no such work has been carried out by researchers about the extraction of prosodic features of Majhi. Different classification algorithms are trained and tested on the features dataset received using the MFCC technique and found that the gradient boost and extra tree classifiers perform the best with the highest accuracy 97% for distinguishing male and female participants based on their pitch and duration. The conducted research is applicable all over the world for the Majhi dialect of Punjabi because it is spoken in major countries.
Conclusion
The goal of this study is to better understand the variety of tonal properties in Punjabi dialects. The study also explores the distinctive features of the corpus. This corpus is essential to the voice recognition system’s operation based on pitch and amplitude. The MFCC technique is used to compute several values, including pitch and duration for acoustic analysis of the Punjabi recorded sounds of male and female participants. The analysis of the data demonstrates that word information, particularly tonal and dialectal information has a considerable influence on the information that the speaker conveys. The MFCC technique is used to extract the features for the recognition of male and female voices. The data under investigation demonstrates gender-specific amplitude variations in tonal words. The input data is examined using a variety of machine learning algorithms such as KNN, LR, SVM, RF, GB, and ETC using the Librosa package in Python. The obtained results proved that the GB and ETC classifiers delivered the best results and achieved a 97% accuracy. Following trials in Python, it was shown that females’ amplitude and pitch are significantly higher than those of males. Future Punjabi language researchers will find this research study valuable. Whereas by applying deep learning models it is noticed that CNN performs the best with an accuracy of 86%. This research holds significance for Punjabi speech-processing researchers, offering insights into the tonal intricacies of the Majhi Punjabi dialect, thereby contributing to the advancement of speech analysis in the Punjabi language.
Footnotes
Declaration of conflicting interests
The author(s) declared no potential conflicts of interest with respect to the research, authorship, and/or publication of this article.
Funding
The author(s) disclosed receipt of the following financial support for the research, authorship, and/or publication of this article: This work was supported in part by the Basic Science Research Program through the National Research Foundation of Korea (NRF) funded by the Ministry of Education (NRF-2021R1A6A1A03039493).
Data availability statement
Data sharing not applicable to this article as no datasets were generated or analyzed during the current study.