
Abstract
Drone based precision weather prediction and forecasting is a prevailing area of research in recent times. Modern flying ad-hoc network (FANET) leverages advanced low latency communication protocol between small flying drones and base stations. In this work, a FANET framework for efficient and precision weather prediction and forecasting that leverages ultra low latency opportunistic message transfer protocol (MTP) is proposed. An, edge empowered intelligent computing quasi-stationary sink nodes are employed to develop the FANET ecosystem further. Flying sensor nodes and edge computing quasi-stationary sink nodes are deployed in the target area in order to achieve optimal sensor coverage minimizing the cost of data transmission power thus ensuring long endurance operation of drones. An ensemble model is deployed in edge level for localized weather prediction. Opportunistic routing strategies are utilized for converge casting. The experimental results show the maximum of 0.98 message delivery ratio and a minimum of 820 ms latency is achieved through opportunistic MTP. An accuracy of 96.5% is achieved in predicting the temperature and humidity data metric.
Keywords
Introduction
Severe weather conditions including thunderstorms, strong winds, fog, hail, and drought have an impact on the economy and public safety anywhere in the world. It has a major role in agriculture and farming, a study presented in Motha et al. 1 Extreme conditions can have a negative impact on crop yield and, consequently, agricultural output. The majority of crops are directly dependent on high temperatures, less precipitation, flooding, and premature freezing during crucial growth stages. Indirect effects on crops can also arise from influences on pest organisms, nutrient dynamics, and soil processes. Using weather and climatic data effectively, one can reach optimized production levels by reducing the loss of soil, nutrients, and water resources. Weather assistance is also essential in air traffic management at every level of control, navigation, and path planning.2,3 In Gonzalo et al. 4 wind modeling techniques is proposed for automation of air traffic management system.
The atmospheric boundary layer is the lowest part of the troposphere closest to Earth’s surface. This part of the atmosphere interacts with the surfaces of the Earth’s land, ocean, and ice. These interactions influence the entire climate system and global weather patterns. This can affect where and how far pollutants travel, how much rain falls during a storm and course of hurricanes and tornadoes. Wouters et al. 5 studied land–atmosphere interactions model which is required to accurately predict and forecast climate. In Darack 6 an unmanned aircraft penetrate cyclonic storm for more than 7 h and flew within Hurricane Noel to measure atmospheric condition. However, the atmospheric boundary layer has not yet provided enough observations for weather models to reliably forecast local weather occurrences. In this study, multi-drone system is used to close the data gap.
The drones are able to obtain accurate vertical profiles of wind, temperature, humidity, and atmospheric pressure at altitudes between
New technologies, including the Internet of drones (IoD) with UAV networks, can offer tremendous potential in Smart Farming and Precision Agriculture applications by making it possible to collect environmental data in real-time and intelligent edge enabled weather forecasting. Agricultural forecasting is the process of predicting many weather variables, such as the amount of sunshine hours, the likelihood of dew, relative humidity, rainfall, temperature, and winds, which are crucial for farming operations. For instance, as farming and agriculture as a whole mostly depend on seasons and weather, weather forecasting enables effectively plan farm operations, such as planting, irrigation, fertilizer application, pruning/weeding, harvesting, or cattle mating. One benefit of weather forecasting is its preventative nature, which gives farmers awareness of climatic changes in an area before they happen!. Smart farming system is proposed with weather forecast modeling and crop prediction in Shandilya and Khanduja. 7
To gather localized data predictions and leverage an overall forecasting framework it is essential to gather ambient weather data through UAVs in real-time manner. In the proposed work an IODT framework amalgamating intelligent routing and computing paradigm is proposed. The proposed framework divides the area of interest into optimized number of regions and places Quasi-stationary base stations as sink base station for localized data processing. Weighted ensemble approaches are proposed and have been tested to work on light weighted base stations. Each of the localized areas are catered through the placement of coverage and relay UAV nodes for data collection. The routing of data is catered through a proposed opportunistic routing strategy toward a main base station. The main base station is part of the application level control where forecasting models are deployed for further analytics. The proposed routing approach has been compared with other state of the art methodologies. A summary of the contribution is as follows.
An edge enabled flying ad-hoc network (FANET) architecture is proposed for precision weather prediction and forecasting using an opportunistic message transfer scenario.
Deployment of flying sensor nodes and stationary data sink node with optimum environment coverage and collision avoidance.
The use of flying stationary nodes as a mobile edge computing platform to execute artificial intelligence models using a low-resource edge device.
Designing ML model for precision weather forecasting at ground station using high end resources.
The work is presented in the following manner. Section “Related research” discusses the past works carried out in the domain of weather monitoring and drone based sensing. Section “Proposed FANET architecture” and “Quasi-stationary base station deployment and routing strategy” explains the proposed FANET architecture that discuss the sensor node placement and the proposed routing strategy employed. Section “Predictive modelling” gives the overview of the edge level prediction and forecasting procedure employed. The work showcases the extensive experimentation carried out through different comparative analysis in Section “Conclusions” Experimental Results and Concludes in Section “Future scope.”
Related research
Precise weather forecasts are critical to humans life since they affect everything from agriculture to air travel and alerts about extreme weather conditions like storms and heavy downpours to individual’s daily activities. Numerical weather prediction depends on atmospheric observations of pressure, temperature, humidity, wind direction, and wind speed. A portion of these measurements may be obtained through weather stations, aircraft,
8
radiosondes,
9
dropsondes (meteorological sensor packets dropped from high-altitude platforms; Hock and Franklin,
10
satellite-based remote sensing techniques,
11
and ground-based remote sensing techniques.
12
It is observed that weather stations and weather balloons have long been used by scientists to gather meteorological data for modeling. A weather station’s fixed location and close proximity to the earth’s surface are its two main drawbacks. It cannot obtain data from the upper reaches of the boundary layer. Weather balloons have the problem of being uncontrollable despite their much higher maximum altitude. They follow the direction of the wind. In addition, weather balloons are usually unretrievable. Drone measurements may be used to close these holes. Until now, these devices have not been considered a practical substitute for conducting measurements in the upper troposphere. The development of a drone system that can sound the atmosphere up to tropopause above the ground on its own is presented in Bärfuss et al.
13
for Antarctic and mid-European region. However, flight test of such scenario is subjected to take permission. In this article, drones are restricted up to an altitude of
The Internet of Things ecosystem is absolutely necessary to transmit and receive the weather data and control command in an automated drone environment. Recently, to facilitate autonomous devices in sixth-generation (6G) networks and ensure seamless wireless connectivity in inaccessible and hard-to-reach areas, the integration of software-defined networking (SDN) with unmanned aerial vehicles (UAVs) has demonstrated significant potential (see Siddiki Abir et al. 14 , Rahman et al. 15 , and Sharma and Mehra 16 ). In the case of a remote environment to send and receive the crucial information and control commands, a sophisticated network model with data routing and with low latency communication is highly recommended. Also, the flying sensor nodes and edge enabled data sink nodes are to be placed ensuring optimum sensor coverage and collision avoidance. Optimization of UAV assisted network coverage system has immense application such as in rescue mission, 17 in building UAV charging station. 18 A mathematical concept called Voronoi tessellation, commonly referred to as Voronoi diagrams or Voronoi cells, is employed in many disciplines, including computer science and telecommunications. 19 It is a technique for dividing up polytopic space into polytopic areas depending on their closeness to a collection of points. A Centroidal Voronoi Tessellations (CVT) is a unique kind of voronoi division where the center of a voronoi cell ensures optimum coverage to all points inside the cell. Various applications of centroidal voronoi tessellations are discussed in Faber et al. 20 In Gonzalez and Hamalainen, 21 a CVT based cellular 6G network topology is suggested for optimal performance in time and space. In this work, a CVT based FANET topology is proposed where mobility of each sensor node is restricted to its Voronoi tessellation. The deployment objectives of UAV nodes are to achieve optimum environment coverage and collision avoidance. A detailed discussion of FANET architecture is given in next section.
In Mishra and Joshi,
22
a method to forecast temperature variation is presented using the concepts of linear regression and artificial neural networks. The study in Raimundo et al.
23
used machine learning regression approaches such as Linear Regression, Decision Trees, Random Forests, and Neural Networks to forecast agricultural fields’ weather conditions for smart irrigation systems. Depending on the field location and day, the suggested methods can forecast the temperature, precipitation, wind speed, and evapotranspiration. A prediction model for weather forecasting based on deep learning has been built in Sathya et al.
24
A comparison has been made between the created LSTM (Long Short-Term Memory) based deep learning model and classic machine learning algorithms like SVR (Support Vector Regression) and RF (Random Forest), as well as GRU (Gated Recurrent Unit), one of the recurrent neural network models. The experimental findings produced according to
Proposed FANET architecture
The ad-hoc network ecosystem is divided into three logical planes. Data collected from environmental sensing is gathered by the Action Plane and sent to the Processing Plane via the Networking Plane, which connects all the system’s entities and handles data storage and processing. Figure 1 displays the UAV-based flying ad-hoc network (FANET) system considered for this paper. This system is made up of several heterogeneous components, such as unmanned aerial vehicles, quasi-stationary Base Stations, and data transmission lines. Target area is divided in an optimized manner with allocated Base Station, Coverage, and Relay UAV nodes.
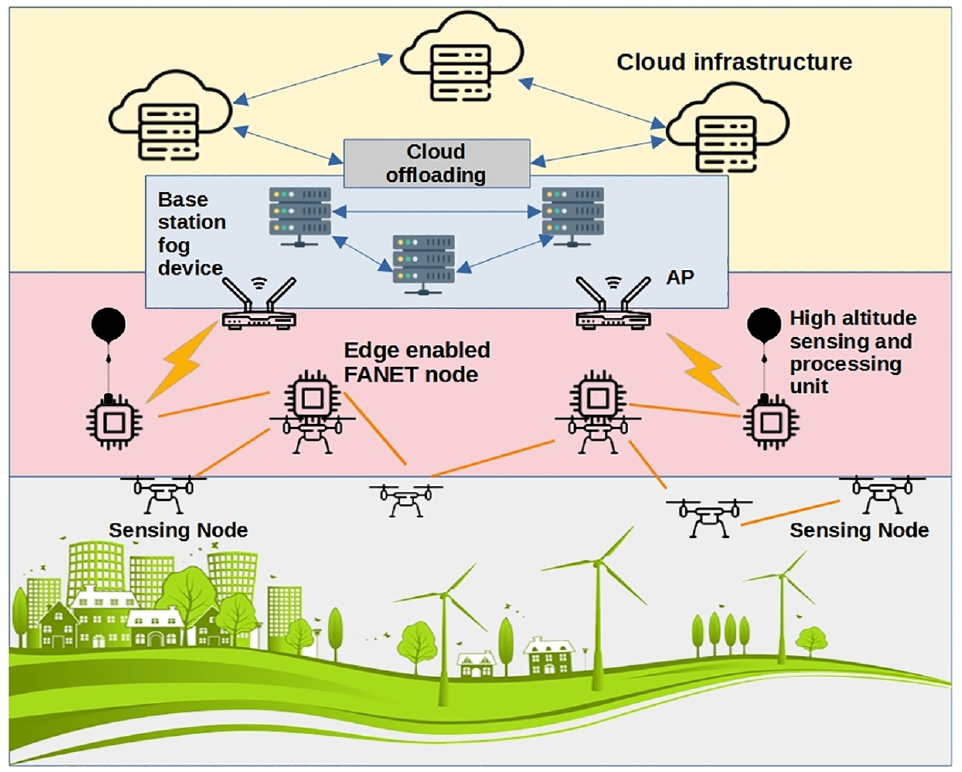
Proposed FANET architecture.
The sensors equipped on UAV devices collect ambient weather information and transmit the data to the quasi-stationary base station at a high altitude platform. Based on the data transmission and reception range of a node, the target region is divided into a number of uniform cells. A uniform cell area leads to uniform load distribution among the sensor nodes to cover the whole target region for collecting data. The quasi-stationary base station acts as a sink node. It is deployed onto each cell to a location to achieve optimal coverage to any point inside the cell. It also carries sensors in order to realize temperature change with altitude.
Each quasi-stationary base station acts as an edge-level processing control responsible for predicting the localized weather conditions and acts as a buffer to store localized weather parameters. A group of relay UAV nodes is utilized to route the localized weather label and parameters to the main base station for further application-level control are called data mules. Data is transmitted through an opportunistic message transfer protocol. The proposed scenario involves the consideration of three different types of message transfer protocols (MTP), namely opportunistic flooding methods, probabilistic flooding, and opportunistic forward methodology. Owing to the advantage of opportunistic message transfer protocol, the transmission range of sensor nodes can be chosen ten times smaller than the reception range of sink node in each cell. This will minimize the cost of transmission power and ensure long-duration operation of sensor nodes. Experimentation has been carried out utilizing the three MTPs. Shortest path map-based mobility is considered as the model for UAV nodes over the whole considered Voronoi region for routing. The main base stations are equipped with further forecasting and application-level control.
Quasi-stationary base station deployment and routing strategy
Consider that
The problem of optimal deployment of sensors
By utilizing the Voronoi cell
The problem of partitioning a convex polytopic search region
Coverage control
Decentralized control for MAS
Imagine a system with multiple agents, each of whom moves in a three-dimensional metric space. Let the manifold with boundary

where the position of
The decentralized control

which depend on the position
Concept of Voronoi partition
The works in Aurenhammer 31 and Atsuyuki Okabe and Sugihara 32 provide an overview of Voronoi diagrams; Okabe et al. 19 discusses ideas and applications; and Klein 33 discusses abstract Voronoi diagrams. The topic of centroidal Voronoi tessellations is covered in Faber and Gunzburger. 20
In a metric space
Also note that the interior must be non-empty. If two distinct cells

then
The partitioning of

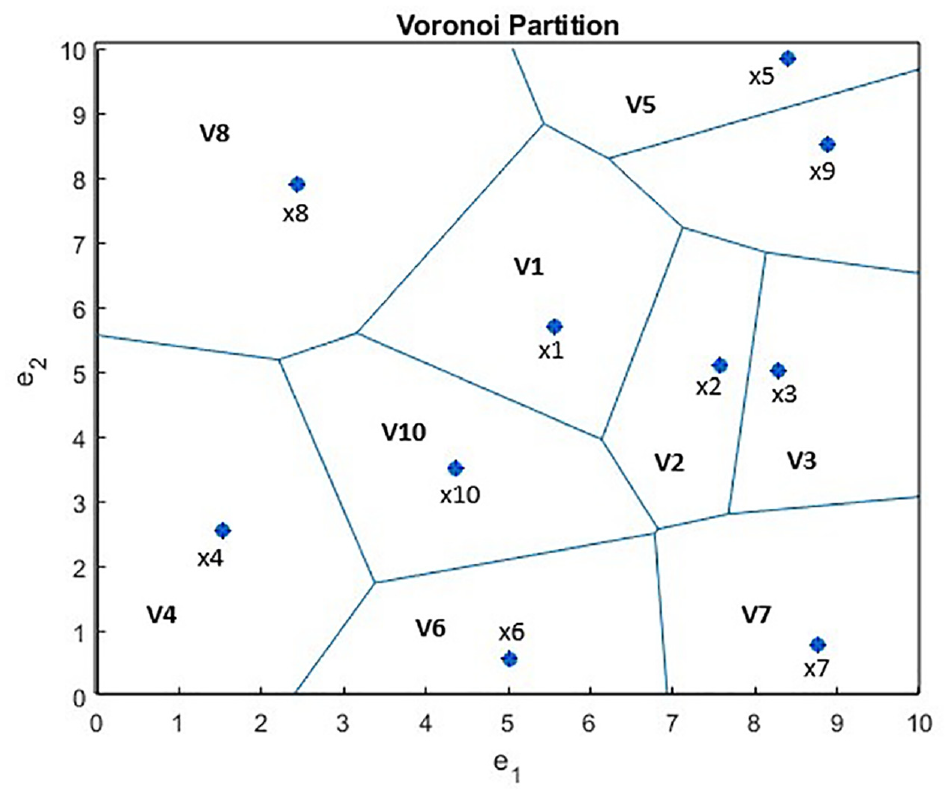
Agent neighborhoods. Agent positions and Voronoi cells are denoted by
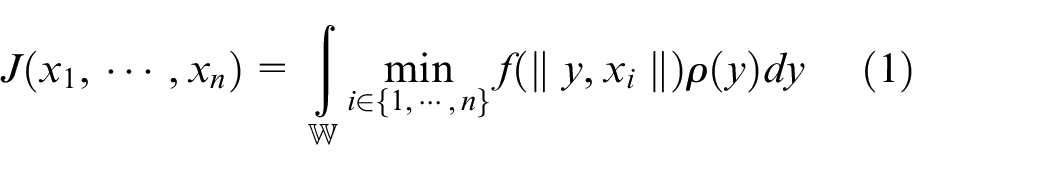
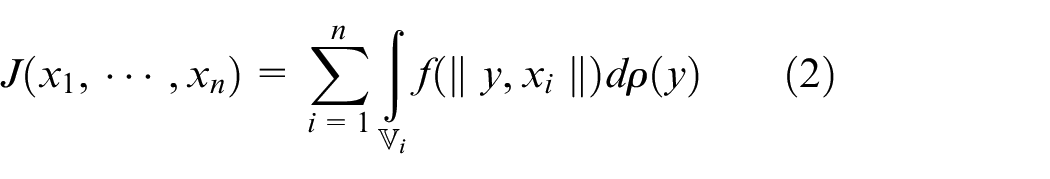
Control solution of optimal coverage problem
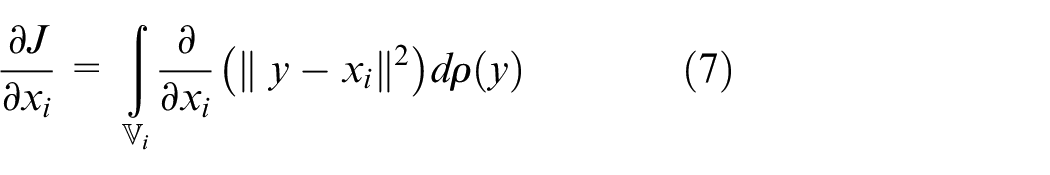
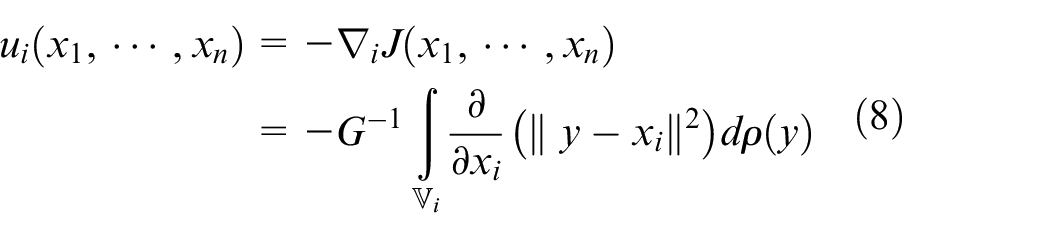
According to Cortes et al., 27 the partial derivative of optimization function defined in (4) is:
Thus the control law in (4) becomes
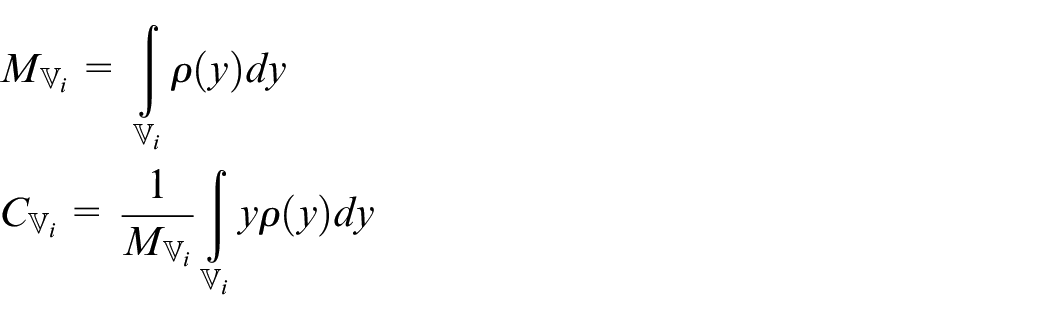
An important aspect of the decision to use
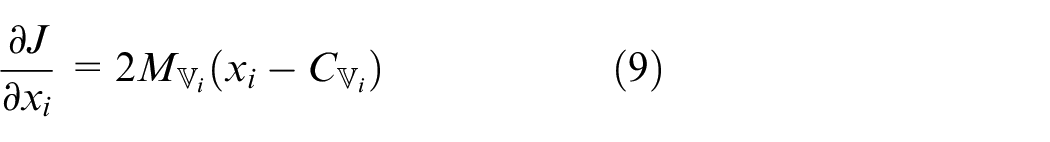
where
Using (9) in (3) and (4), following is the agent closed loop dynamics optimizing the performance function defined in (1)
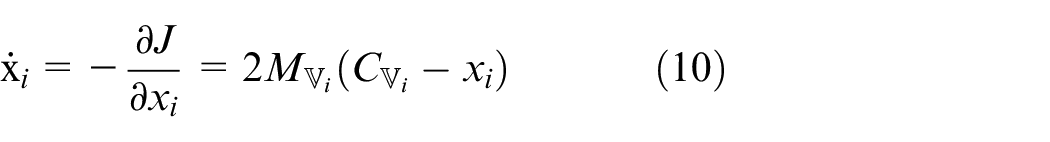
Each agent is guided by these dynamics toward the center of its Voronoi cell. Stated differently, the equilibrium state is attained when every agent is situated in the centroid of its corresponding Voronoi polygon. Such a partition is referred to as a centroidal Voronoi partition. The focus is on the case where
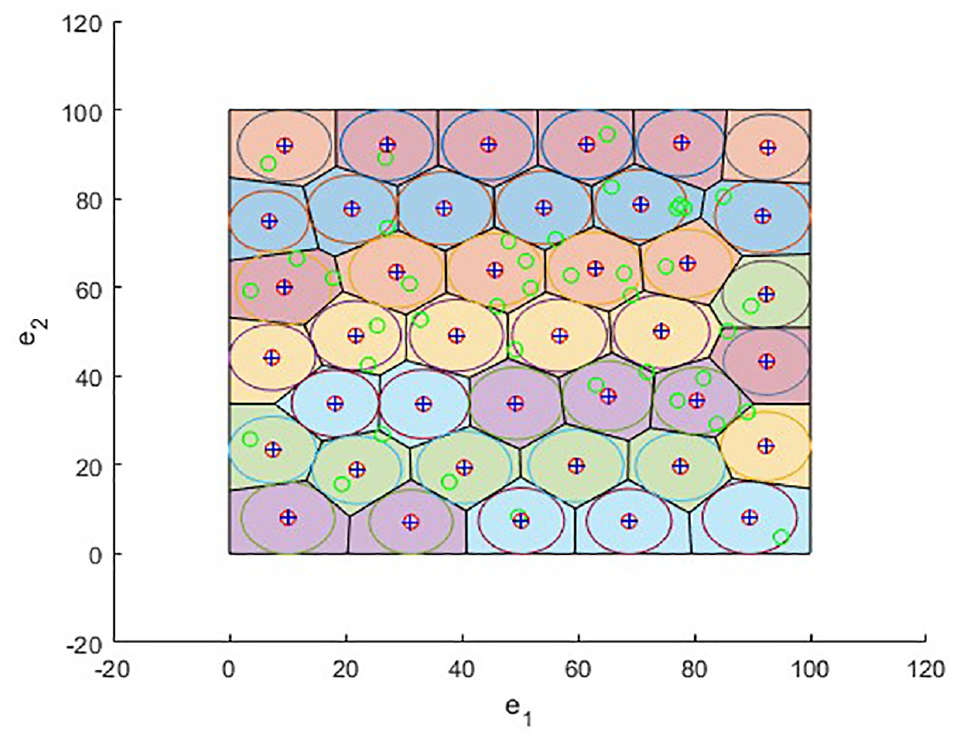
Voronoi partitions in
Lloyd’s Algorithm
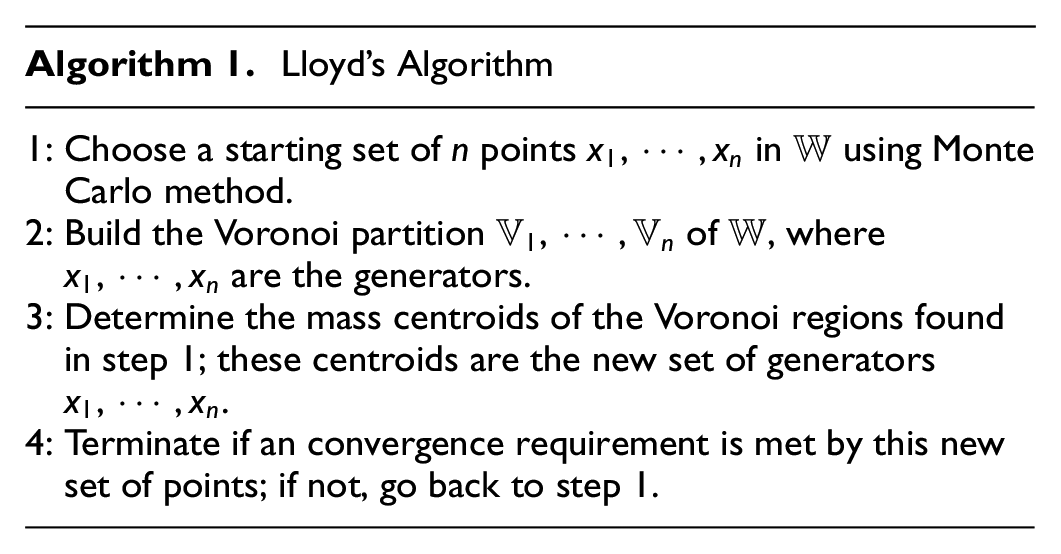
Moreover, the control rule is decentralized since the coverage function
Opportunistic routing strategy
The collected localized weather predictions and parameters needs to be efficiently routed to the Ground Base Station for further processing and application level services. The present subsection discusses the proposed message transfer strategy that is obtained by leveraging opportunistic routing philosophy.
Three major categories of routing have been considered in the present deployment scenario, namely opportunistic flooding, probabilistic flooding, and opportunistic forwarding strategies. The opportunistic flooding is a classical flooding scheme in opportunistic networks. Majorly the epidemic routing fallen under this category. The operation represents the following operations:
Initialize message
If the contact between two nodes happens then perform the exchange of
Check the
Finally the undelivered messages has to be transferred for the delivery.
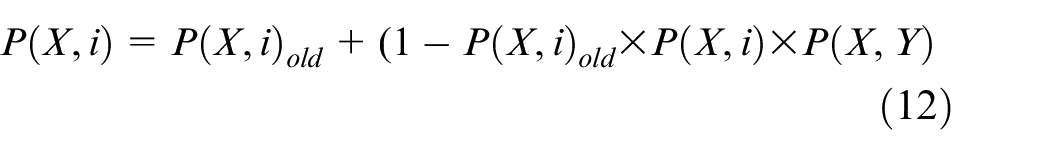
The probabilistic flooding on the other hand perform transitivity and the history based phenomena in order to transfer the message to the nodes. It is fundamentally a restricted flooding methodology. In this case the message get transfer based on the probability of the encounter of the node with one another which can be expressed as follows:

Here,
Forwarding technique is on the other hand restricts the number of message copy in the network. The opportunistic forwarding strategies often uses neighborhood discovery, data transfer and storage management policy. The delivery likelihood is a crucial parameter in this case. Let
where

The cost is computed as
and the destination cost is therefore

The operation of localized weather prediction using quasi-stationary edge devices, with information routed to the base station via groups of relay UAVs in each Voronoi region, is limited by the energy constraints of the UAVs. This challenge can be addressed by utilizing a mobile charging station supported by an Unmanned Ground Vehicle (UGV), as suggested in Messaoudi et al. 35
Predictive modeling
Each of the Vornoi cell has a edge enabled quasi-stationary UAV node for localized prediction and forecasting. While the edge-level predictive model provides real-time insights leveraging the constrained resources of flying nodes, a more comprehensive forecasting approach is achieved by integrating these edge predictions with models deployed in the cloud or main ground station.
Prediction task
Each of the localized areas has a quasi-stationary sink nodes with model processing capability. The machine learning prediction task involves predicting weather conditions based on multiple features such as temperature, rain, pressure, humidity, etc. Mathematically, this prediction task can be framed as a regression problem as well as a classification problem. The regression task is designed to estimate a continuous variable representing the weather condition.
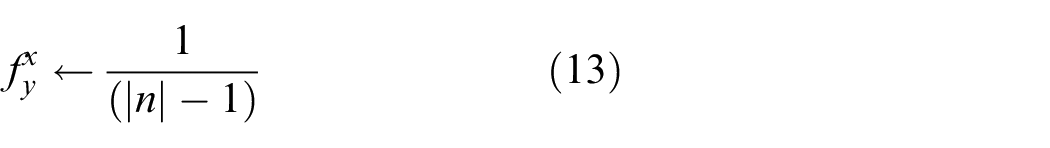
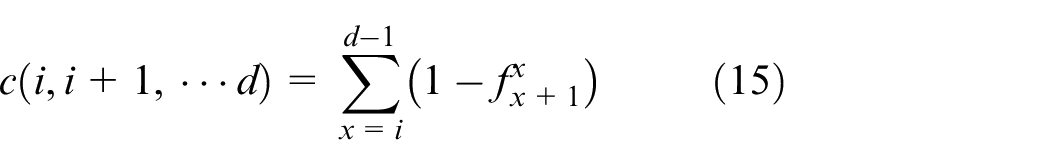
Let

where:
–f(X) is the weather forecasting function based on the input features.
–n represents the number of features.
Hybrid forecasting model
The Hybrid Forecasting Model aims to combine edge-level forecasting with cloud-level forecasting using a weighted averaging technique. This model integration strategy involves executing predictive models on edge devices within a FANET and in a cloud or ground station environment. The weighted averaging approach combines the predictions from these models to generate a more accurate and comprehensive weather forecast.
Edge-level forecasting
For the edge-level forecasting, models such as Decision Trees or Linear Regression are employed due to their lightweight nature and suitability for resource-constrained devices. Let

where
Cloud-level forecasting
At the cloud or ground station level, a more sophisticated model such as Long Short-Term Memory (LSTM) is utilized for its ability to capture temporal dependencies in time series data. Let

where
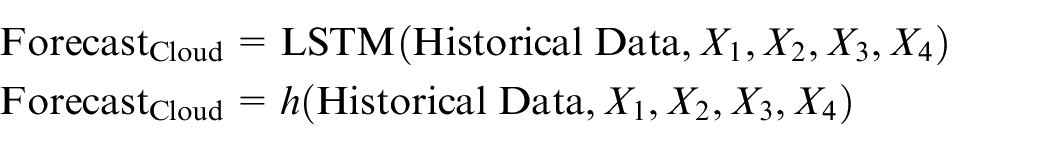
where—
LSTM components
The LSTM model processes sequential data and is programmed to learn temporal patterns to provide forecasts thus leveraging the temporal context provided by historical weather data and the input features. The LSTM based prediction process involves the following equations:
Input Gate:


Forget Gate:


Output Gate:


Where:
–
–
–
–
–
–
–
–
–
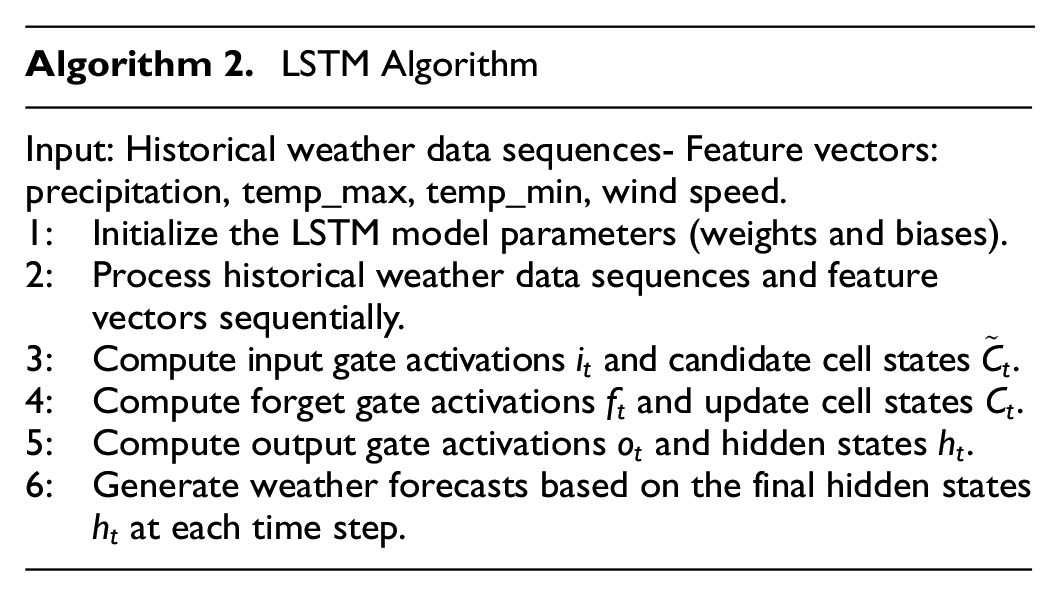
LSTM algorithm
The LSTM process for weather forecasting can be summarized as follows:
The LSTM algorithm loops through the data, hence modifying the cell state and hidden state at each time step. This enables to capture temporal patterns and dependencies for accurate weather forecasting.
LSTM Algorithm
Weighted averaging fusion
The Hybrid Forecasting approach (equation (18)) combines the edge and cloud-level forecasts using a weighted averaging mechanism:
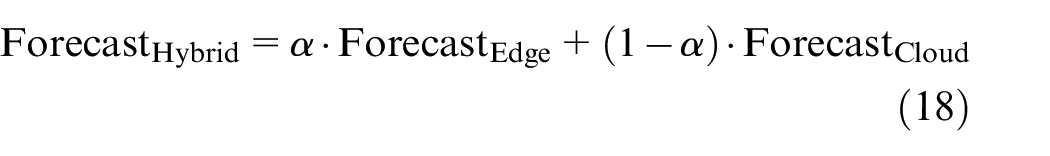
where
Experimental results
Experimental data
The Delhi Weather Dataset (https://www.kaggle.com/datasets/mahirkukreja/delhi-weather-data/data) has been utilized for forecasting analysis. The data has been collected from wunderground utilizing their easy to use api. The dataset has
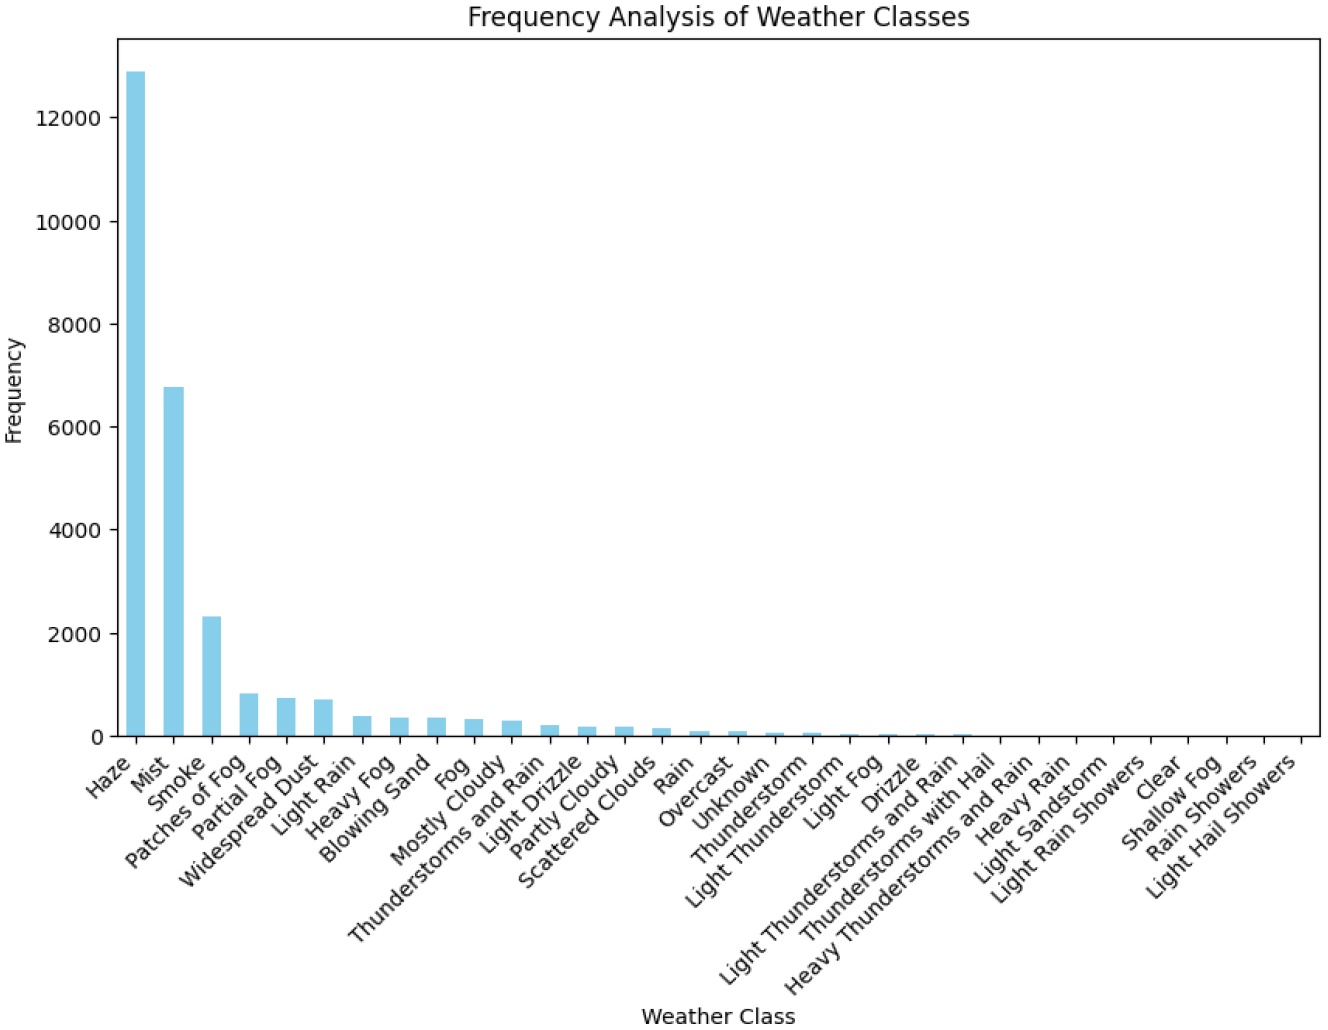
Histogram of dataset distribution.
It is important to understand the effect of feature over the other. A correlation matrix is visualized in Figure 5. The analysis reveals several noteworthy correlations, with some features exhibiting strong positive or negative associations. It has been observed for the state of Delhi, India that temperature and humidity has strong negative correlation. This is so as the Warmer air can hold more moisture than colder air, so as the temperature in Delhi increases, the relative humidity hence may decrease. This is because the same amount of water vapor may occupy larger volumes in warmer air. A cluster analysis is given in Figure 6. Through the elbow method it has been found that the number of clusters is
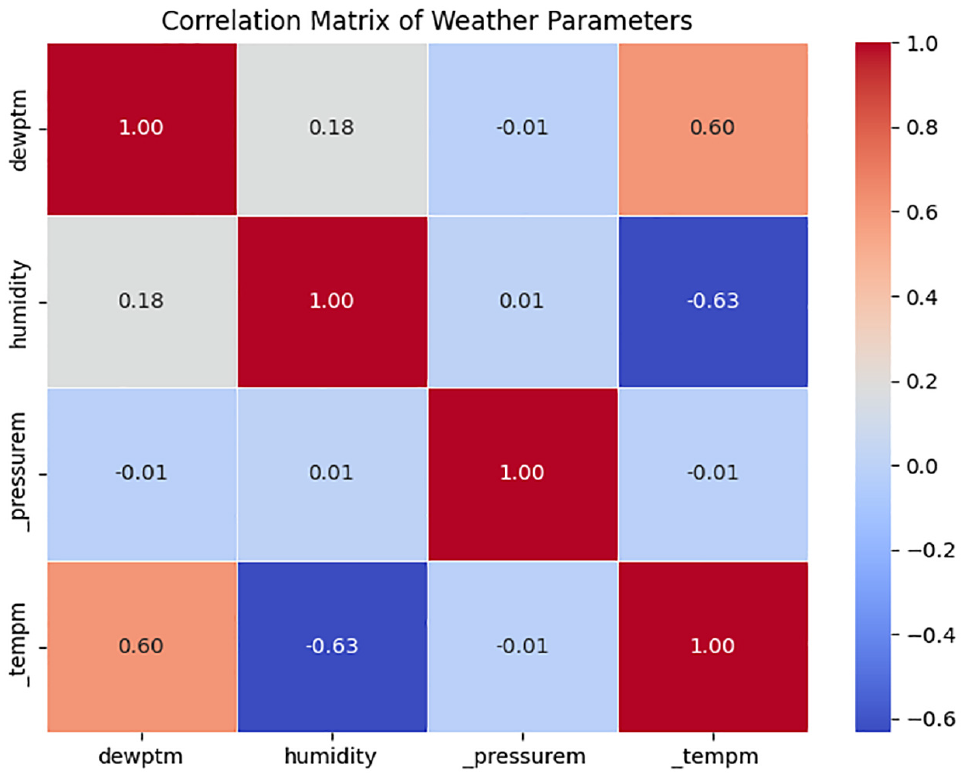
Correlation between the features.
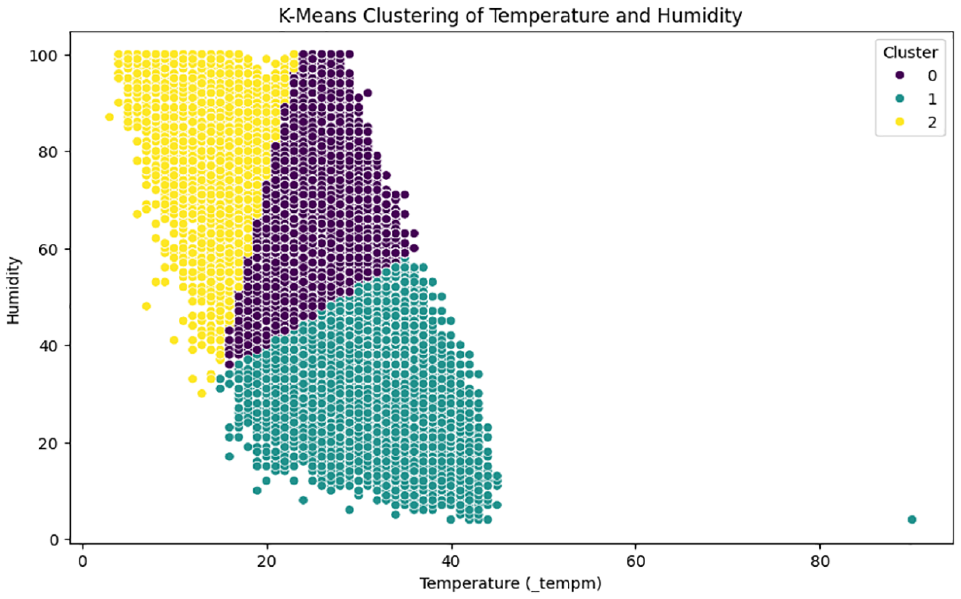
KMeans clustering visualization of temperature versus humidity.
Cluster 0, reinforces the negative correlation. Cooler temperatures naturally hold less moisture, explaining the low humidity in this cluster. Cluster 1 deviates a little bit. Although it is pertinent that high temperatures can hold more moisture, specific factors like proximity to water bodies or strong winds contributes to the high humidity in this region hence the cluster. In Cluster 2, the temperature and humidity is the moderate range hence acting as the bridge showcasing a balanced relationship between temperature and humidity. It highlights the dynamic nature of this connection, where variations in considered features influences the balance.
Network performance analysis
To monitor the weather of a particular area the deployed UAV node will collect the data in a two-fold approach. In the first case, the data is collected from the high-altitude quasi-stationary node, and in the second case, the UAV nodes act as data collectors. In between them some of the UAV nodes are deployed as data mules for opportunistic message transfer. Two major parameters are considered in that case in order to achieve an effective message transfer between the sensing node and the destination nodes. The message delivery ratio
The critical performance metric of delivery probability and the average latency has been measured. Figure 7 depicts the message delivery performance with varying node densities. In the proposed scenario, three major message transfer mechanisms namely Opportunistic flooding, Probabilistic flooding, and Opportunistic forwarding are considered. Figure 7 shows the message delivery performance of the opportunistic forwarding achieved the highest benchmark of message delivery in a maximum node density of
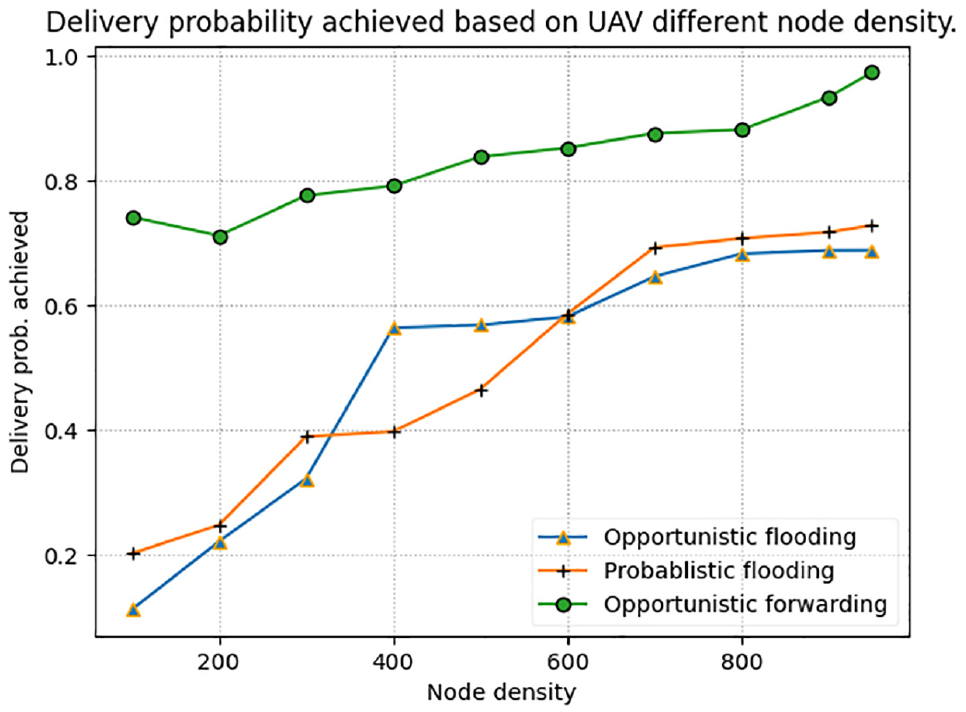
Node density versus delivery probability achieved by the message transfer methods.
The effect of the latency is also significant in case of the increasing time. Figure 8 shows a decreasing trend of average latency with an increasing simulation time.
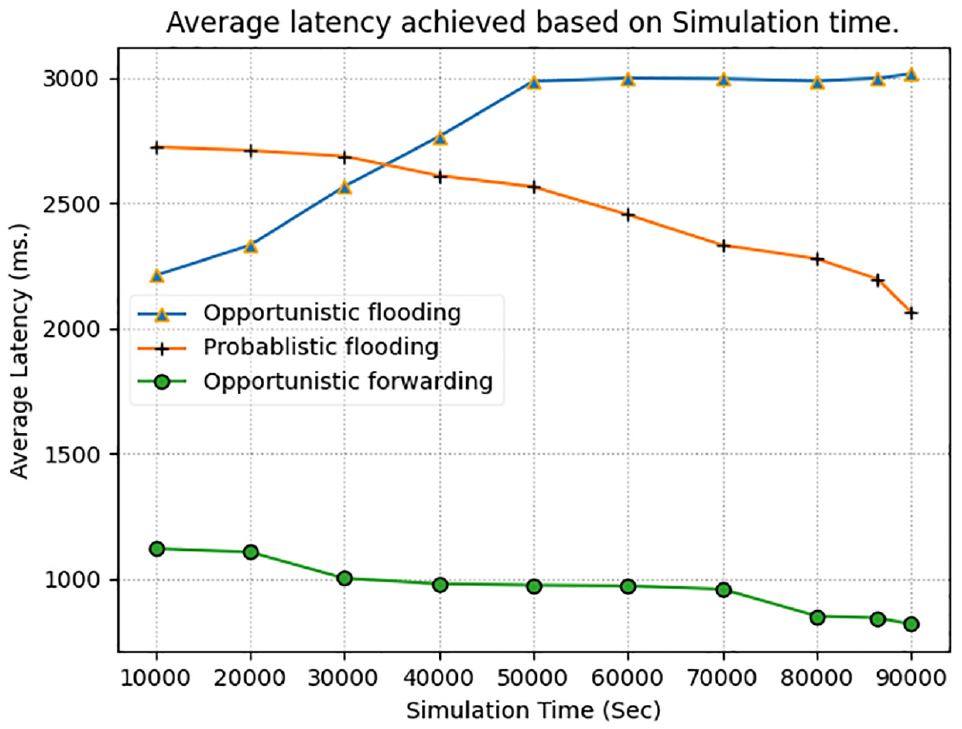
Average latency performance of the message transfer methodology concerning the simulation time.
In Figure 8 the average latency of the opportunistic flooding is reported to be the lowest benchmark in the case of simulation time
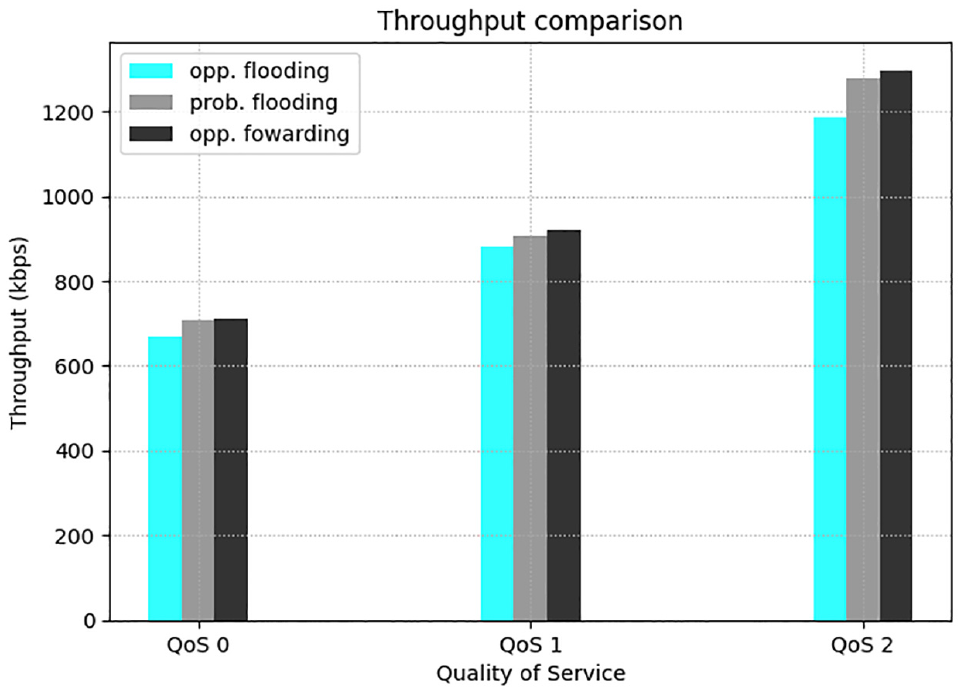
Throughput performance of the different message transfer strategies under varying QoS levels.
The consumption of the power by the network node is also very crucial because most of the communication devices are battery operated. The node which consumes less power can consider as better forwarder within the whole network. Figure 10 illustrates power consumption by the node within the proposed simulation time. As the number of nodes increases with increased simulation time the cumulative power consumption goes to maximum benchmark of
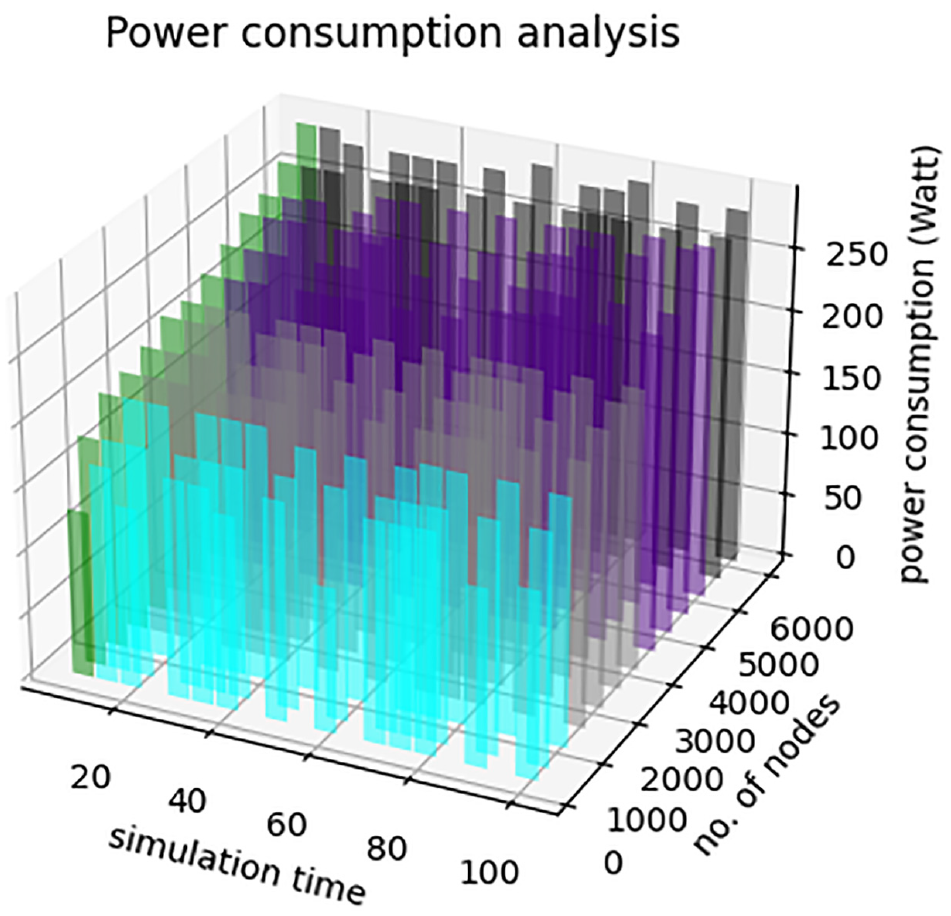
Cumulative power consumption for varying number of nodes.
Figure 11 depicts average packet loss for the increasing number of nodes. The figure shows the highest number of packet loss of opportunistic flooding due to the huge amount of packet generation. On the other hand opportunistic forwarding restrict the message generation based on the selection of forwarder in an optimum way results a minimum benchmark of packet loss.
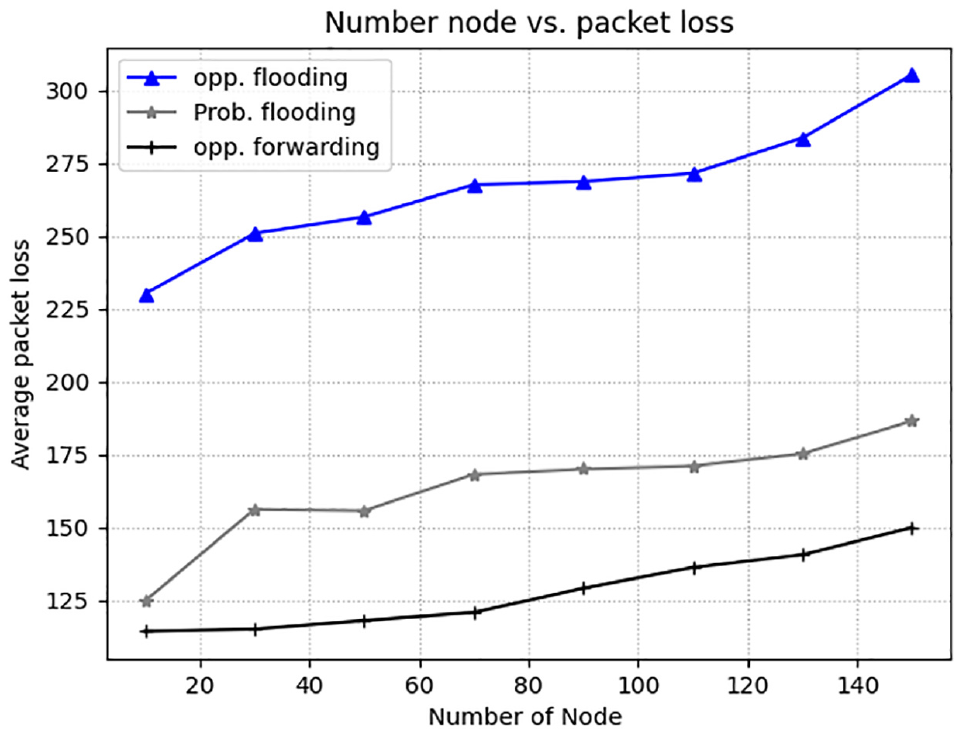
Average packet loss based on number of node for flooding and forwarding techniques.
Prediction analysis
Weather condition prediction
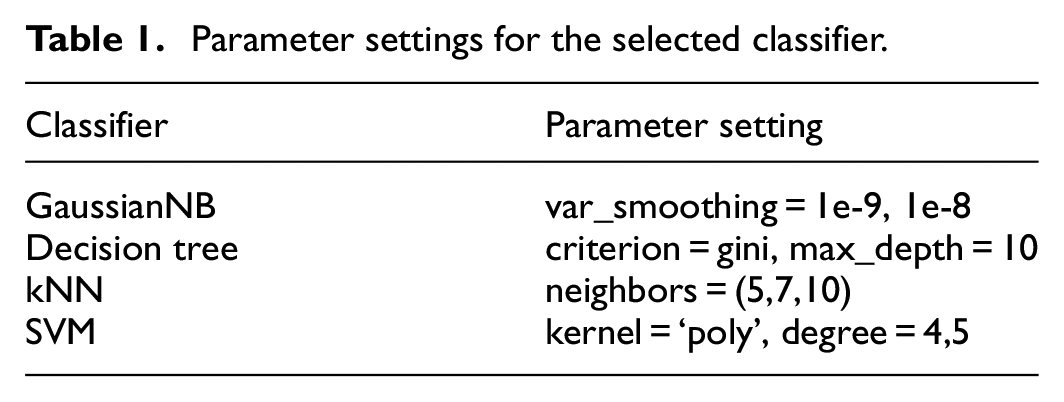
At the edge level the trained model for weather condition prediction is deployed. Experimentation has been carried out on traditional machine learning models- Gaussian Naive Bayes, Decision Tree, K-nearest neighbor and Support Vector Machines. A weighted majority voting ensemble is deployed using the said classification models. A demonstration of accuracy metric is given in Figure 12. It is evident that the majority voting ensemble is giving the best performance as compared with all of the base learners. The details on parameter setting is given in Table 1.
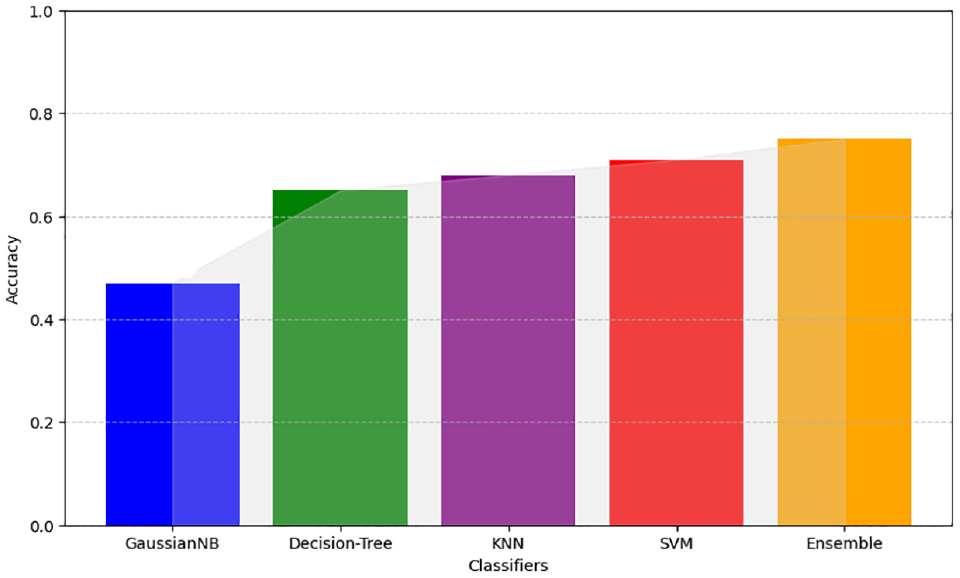
Weather condition prediction analysis.
Parameter settings for the selected classifier.
Forecasting analysis
The forecasting analysis in Figures 13 and 14 showcases the effect of the proposed forecasting prediction analysis on temperature and humidity. It can be observed that the true values and the forecasted values are overlapping. This alignment underscores the effectiveness of our LSTM model in capturing the complex temporal dependencies inherent in the dataset. The congruence between actual and forecasted shows the robustness and reliability of the LSTM architecture in capturing nuanced patterns within time-series data.
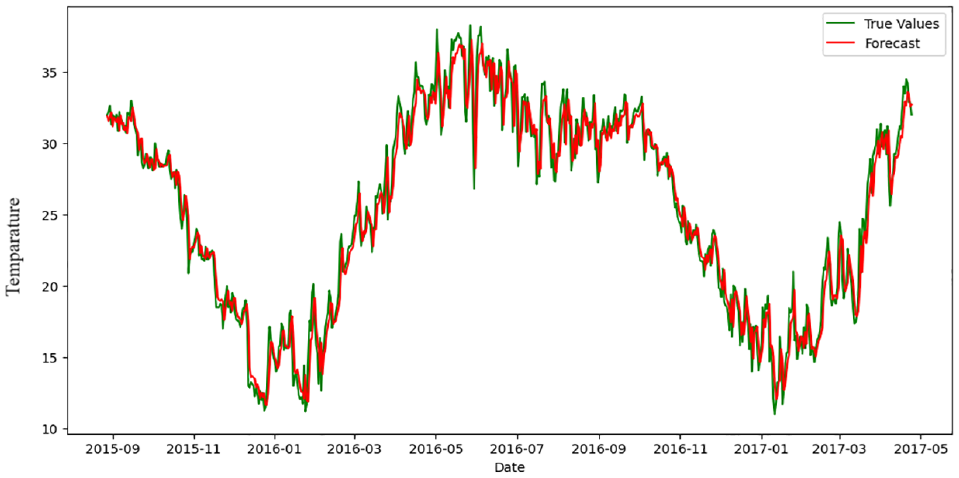
Proposed hybrid forecasting analysis of temperature.
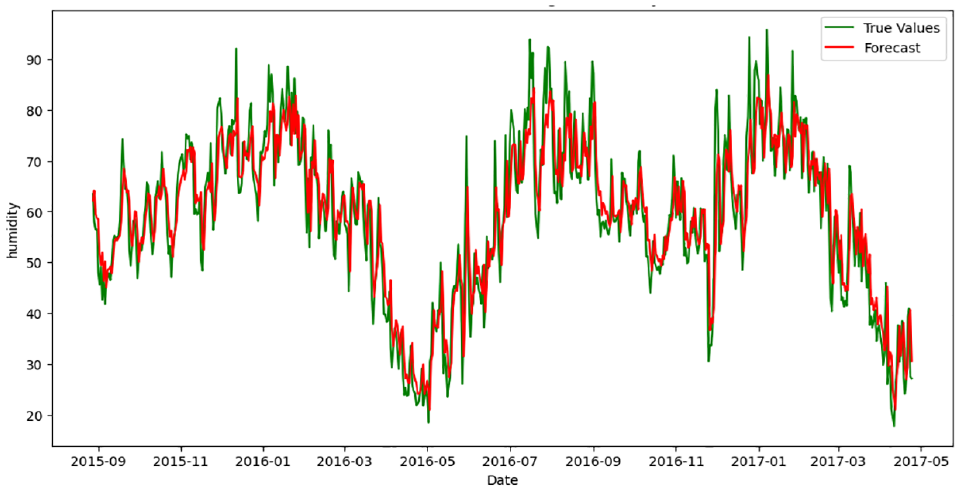
Proposed hybrid forecasting analysis on humidity.
In Figure 15, the test dataset has been separated from the training samples. The test sample comprised of dataset during the timeline 2015–2017. A comparative forecasting analysis is presented during the test timeline tenure using ARIMA model and the proposed LSTM model. It can be observed that the forecasted data points (marked in red) are well aligned with the actual data points (marked in green). Hence the forecasting analysis is performing better than ARIMA based model for the selected dataset.
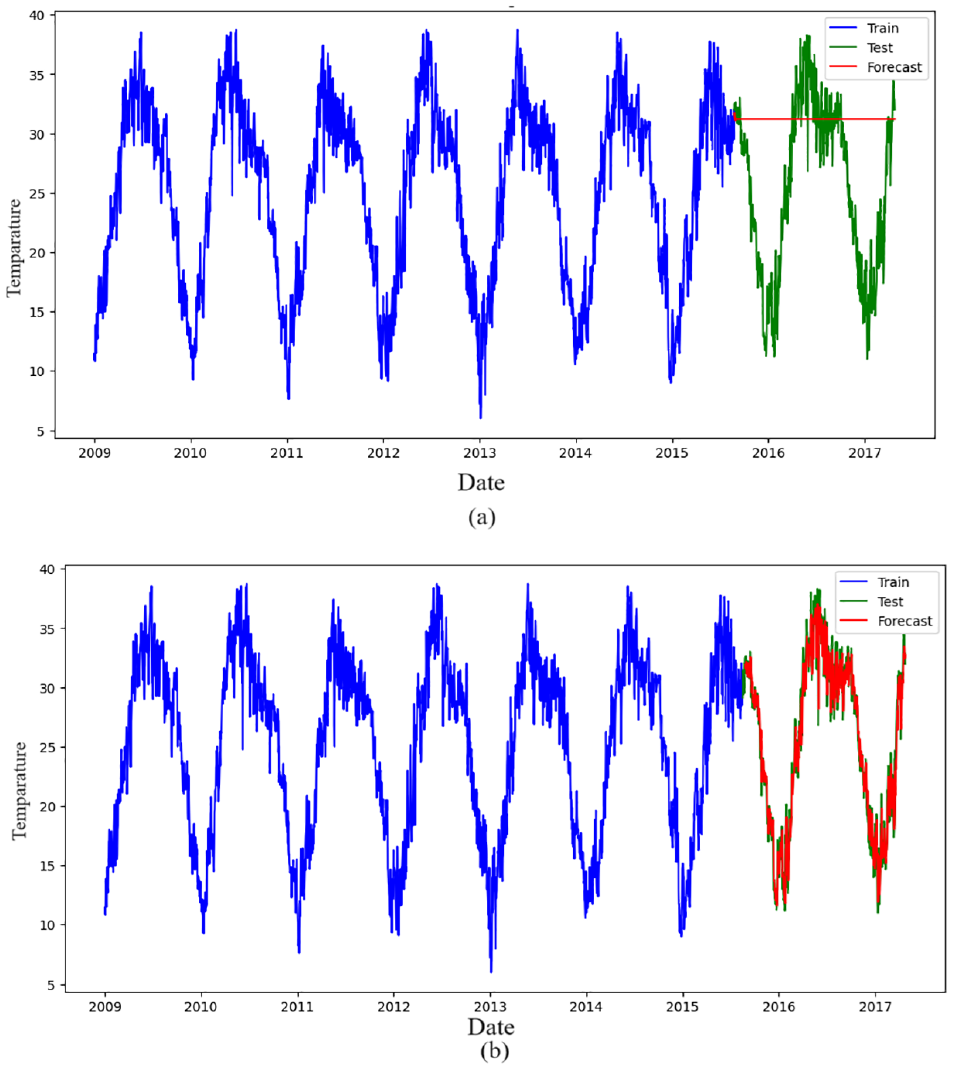
Comparison in forecasting (a) with ARIMA model (b) with LSTM model.
Conclusions
Gathering localized weather condition is an important criteria for strategic urban and rural planning. The proposed FANET framework is designed to handle areas where network coverage is very poor. The optimal segregation of area and deployment of FANET nodes creates the base coverage blueprint of the data collection framework. Localized weather parameters are recorded and predictions are made through the edge enabled base stations. The area wise localized weather parameters and predictions are routed to the main base station or cloud station. It can be observed through experimentation that the opportunistic flooding strategy utilized gives the maximum delivery probability and achieves minimum latency of
Future scope
In the proposed framework the message delivery, latency, power consumption and throughput has been considered as crucial network parameters. However some more network parameters can be considered for future analysis like energy efficiency, network lifetime, the communication overhead, weather condition, obstacle, network interference which can be considered as future work. Also, the heterogeneous UAV infrastructure using limited network bandwidth and processing capability is another major parameter to be considered. An enhance heterogeneous FANET structure also improve the scalability with varying number of UAV-UGV nodes. The network performance for the same and the deployment cost can also be considered as crucial parameter which are considered as future work. The major component of the proposed ecosystem can be developed using opensource software and the hardware platform that significantly reduce the deployment cost of the ecosystem itself.
Additionally integrating the proposed framework with 5G-enabled systems could also significantly enhance data transmission speed and reliability, allowing for more efficient, real-time weather data routing via drones, especially in remote areas. Employing advanced AI techniques, such as transformer models or attention mechanisms, could further refine forecast accuracy by capturing complex temporal patterns.
Footnotes
Authors contribution
The idea and design of the study were contributed to by all authors. Madhumita Pal, Ayan Kumar Panja, Amartya Mukherjee, Sanjoy Mondal and Arnab Basu handled the material preparation, data gathering, and analysis.
Declaration of conflicting interests
The author(s) declared no potential conflicts of interest with respect to the research, authorship, and/or publication of this article.
Funding
The author(s) received no financial support for the research, authorship, and/or publication of this article.
Ethical considerations
Not applicable
Consent to participate
Not applicable
Consent for publication
Not applicable
Data availability statement
The data that support the findings of this study are available from the corresponding author upon reasonable request.