
Abstract
Statistical process control is always intrigued by the design of effective control charts for monitoring production processes and determining assignable causes of variations. It can be challenging to keep track of a positive asymmetric response variable while considering the impact of the input variables. The current work incorporates the Reparametrized Birnbaum Saunders (RBS) model to develop more effective cumulative sum (CUSUM) control charts for analyzing the mean of such a process. We perform a simulation study to evaluate the effectiveness of existing and derived approaches in terms of run length characteristics. The findings showed that when the underlying process distribution is positively asymmetric, the proposed charts provide stronger protection against process alterations as compared to existing methods. Moreover, the suggested control charts are implemented using actual data from a combined cycle power plant.
Keywords
Introduction
A range of practical tools are included in statistical process control (SPC), which is used to keep track of variables associated with the process and enhance product quality. Every perpetual process will inevitably experience certain variations, which can be divided into special or assignable cause variations and common cause variations. The manufacturing procedure is thought to naturally have common cause variations, and when they exist, the process is regarded as stable or statistically in-control. 1 However, the assignable source of differences harms the products’ quality and must be found as soon as feasible so that corrective action can be taken to stop the manufacture of nonconforming goods. Since the invention of the Shewhart control chart,2–4 control charts have progressively been a common method for tracking process variables and locating any obvious causes of fluctuations. Large shifts in the process can be easily detected using Shewhart type charts. 5 However, the exponentially weighted moving average (EWMA) chart published by Roberts 6 and the cumulative sum chart (CUSUM) proposed by Page 7 offer superior protection against the process’s minute changes. Numerous control charts are available in the SPC literature, and choosing the right one depends on a number of variables, including the type of data, sampling strategy, the destructiveness of the testing, and the distribution of the process under observation (normality is typically assumed), among many others.
Some manufacturing processes result in data that is positively asymmetric. Many positive asymmetry or skewness probability models, including the lognormal, gamma, beta, inverse Gaussian, exponential, extreme values, log-logistic, Weibull, and Pearson distributions, are frequently fit to characterize such types of data; see studies.8–19 The Birnbaum-Saunders (BS) distribution has recently received increased attention due to its strong relation to the normal distribution.20–22 The BS distribution is positively skewed and derived by means of shape and scale parameters. The original parameterization of the BS distribution can be used to model data in a variety of contexts; see studies.23–27 Santos-Neto et al. 28 provided a number of parameterizations for the BS distribution. One of these, which we refer to as the reparametrized BS (RBS) distribution, indexes the BS distribution by its mean and precision. RBS distribution is parametrized by its mean, so it can be utilized as a rival to normal distribution and famous asymmetrical distributions such as Gamma and Lognormal. 29
Many researchers have worked on control charts based on the BS distribution. For example, Leiva et al. 30 utilized the BSsum distribution to develop a novel approach for control charts based on the BS distribution. Marchant et al. 31 proposed multivariate control charts that are based on generalized Birnbaum-Saunders distributions and an adjusted Hotelling statistic. For analyzing the Birnbaum-Saunders (BS) median parameter, Bourguignon et al. 32 suggested control charts. Aslam et al. 33 suggested an attribute control chart under repetitive sampling when a product’s lifetime approaches BS distribution. Leiva et al. 24 proposed a criterion to assess environmental risk using Birnbaum-Saunders attribute control charts to assess environmental risk. Khan et al. 34 studied a control chart for the Birnbaum-Saunders distribution with accelerated hybrid censoring. A novel control chart for the Birnbaum-Saunders distribution based on multiple dependent state repetitive sampling was proposed by Aslam et al. 35 Lio and Park 29 introduced a bootstrap control chart for Birnbaum-Saunders percentiles. More literature on control charts for BS distribution can be found in studies.36–38
The BS-distributed response variable is intended to be monitored in all the research mentioned above. However, the BS-distributed response variable frequently records linearly related input variables in real-world scenarios. For instance, while measuring the net hourly electrical energy output, the temperature is also measured, and they primarily have a linear connection.39,40 Many studies have been carried out in the SPC literature to provide control charts based on residuals; however, these residuals originate from different models. For example, zero-inflated Poisson model residuals 41 and inverse-gaussian model residuals. 42 It is significant to note that different models have different residual distributions. Therefore, in cases where the response variable has a predetermined distribution, the purpose of all these research is to investigate particular residual-based charts.
To date, no research has been done on designing CUSUM control charts based on the residuals of the BS regression model. Therefore, it is more practical to develop such techniques since they can provide a platform for monitoring the BS distributed response variable while maintaining the linear relationship of the input variables.
There is a number of literature available on BS regression modeling; see studies.43–50 All the presented regression models are based on the condition that the original dependent variable be transformed to a logarithmic scale, which may reduce the power of the study and make interpretations more challenging. 51 Regression models frequently focus on the mean response and its original scale since interpretations are made easier there. The RBS distribution can be used to model the mean without any transformation, just like generalized linear models (GLM), but the RBS distributions do not belong to the exponential family. The mean response is connected to the linear predicted, which includes the regressors and unknown parameters by a possible link function. 26
In light of the above-mentioned rationale, this study suggests CUSUM control charts based on standardized and deviance residuals of the Reparametrized Birnbaum-Saunders (RBS) regression model to track the positive asymmetric data. Moreover, simulation analysis is also planned to evaluate how well the suggested charts perform in terms of run length characteristics. In order to emphasize the significance of the suggested methodologies, the proposed charts are finally applied to combined cycle power plant (CCPP) data.
In Section 2, the background of the RBS regression model is discussed. In Section 3, the novel RBS-CUSUM control charts are introduced. In Section 4, a simulation study is used to evaluate the effectiveness of the proposed and existing strategies. Section 5 applies the suggested methodologies to combined cycle power plant (CCPP) data. The conclusion and recommendations are discussed in Section 6.
Background
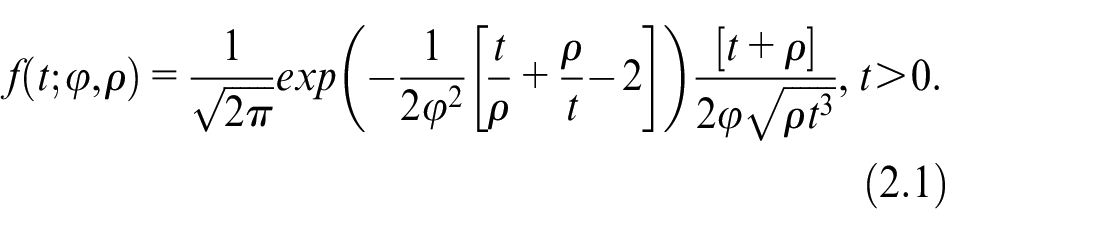
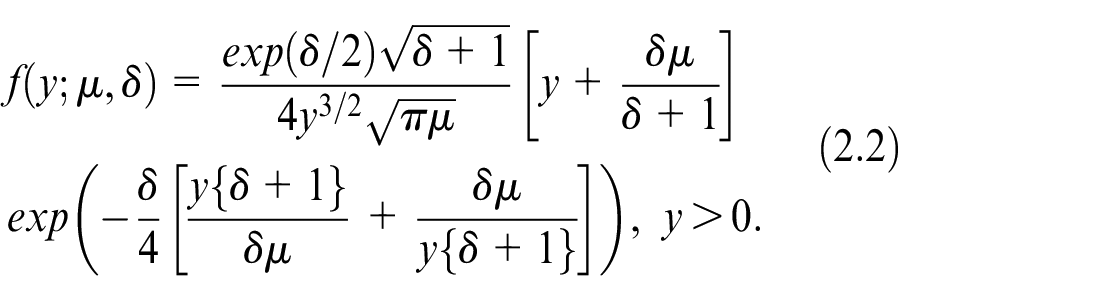
Reparametrized Birnbaum-Saunders distribution
Let
The mean and variance of
Here, the variance of
Reparametrized Birnbaum-Saunders regression model
Let

where,
where,
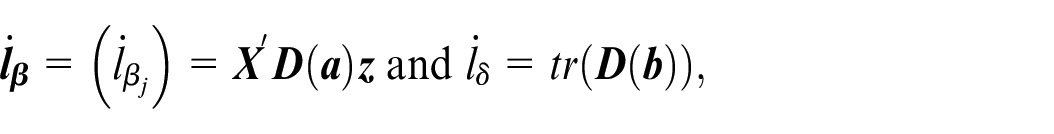
Further, the score functions for
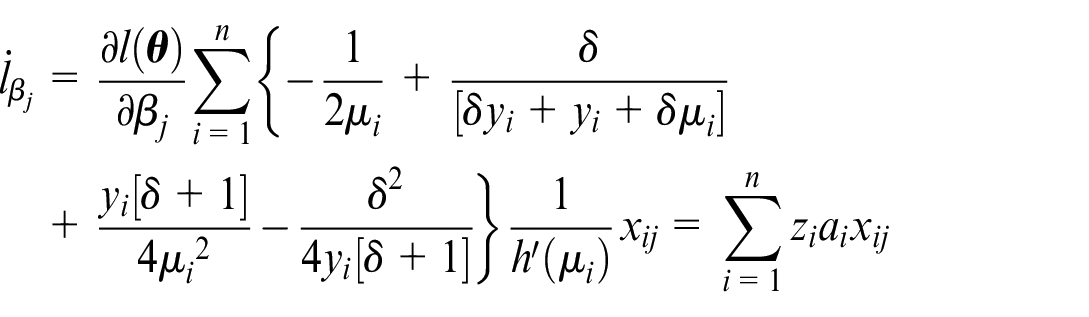
and
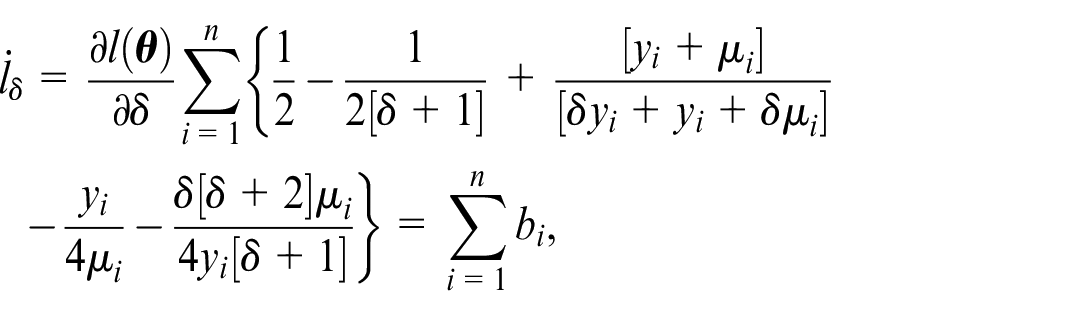
where,
where,
Residual analysis
The residuals are the best tool to track any changes in the profiles. As a result, this part will go over the standardized Pearson and deviance residuals.
The standardized Pearson residual for the model with link function expressed in equation (2.3) is given as:
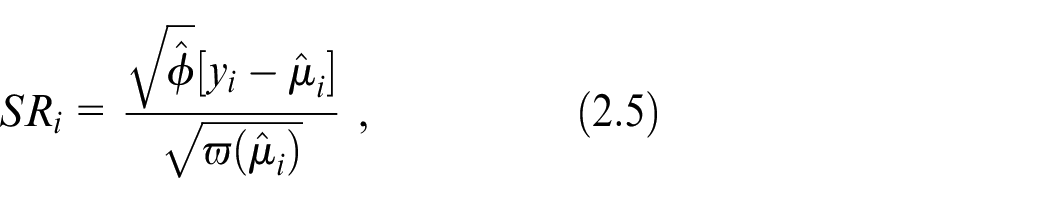
where,
The deviance type residual for the model in equation (2.3) is formulated as:
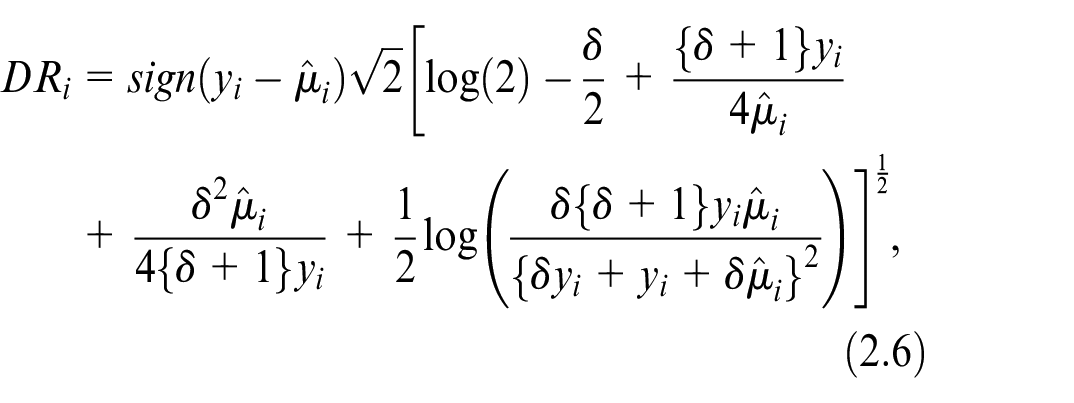
where,
Control charts based on the RBS regression model
This section outlines the layout of existing and proposed control charts based on deviance and standardized residuals from the RBS regression model.
Existing RBS regression model based Shewhart control charts (SR/DR-RBS)
Mahmood
52
proposed RBS regression based Shewhart control charts. The author employed standardized and deviance residuals to define plotting statistics and specified the plotting value in the RBS model based Shewhart control charts as


where,
Proposed RBS regression model based CUSUM control charts (SR/DR-RBS-CUSUM)
The CUSUM chart’s structure is split into two distinct one-sided CUSUM statistics,


where,
Simulations
Structure of the simulation
We perform a simulation analysis in a finite sample to assess and compare the suggested control charts. The statistical software, which is available for free download from http://www.r-project.org/, is used to do all the calculations. The data for this simulation study are based on random numbers drawn from RBS distribution, that is,
a. Indirect shift in
b. Indirect shift in
c. Direct shift in
Some previous studies53–57 suggested that
Algorithm: Computation of control limit coefficients
Listed below are the steps used to compute control limit coefficients for fixed
Create a sample of size
Fit the data generated in Step 1 to the RBS regression model, and then separately estimate the standardized residuals (SR) and deviance residuals (DR) from equations (2.5) and (2.6). Further, compute the mean and standard error of the SR and DR.
Set the arbitrary values
For SR-RBS and DR-RBS control charts, plot the residuals against the appropriate control limits specified in equation (2.7).
Use the appropriate SR and DR for the CUSUM control charts to obtain the appropriate CUSUM statistics using equations (2.8) and (2.9), then compare the statistics to the appropriate decision intervals.
Repeat Steps 1 through 3 a substantial number of times until you attain the desired
If the required
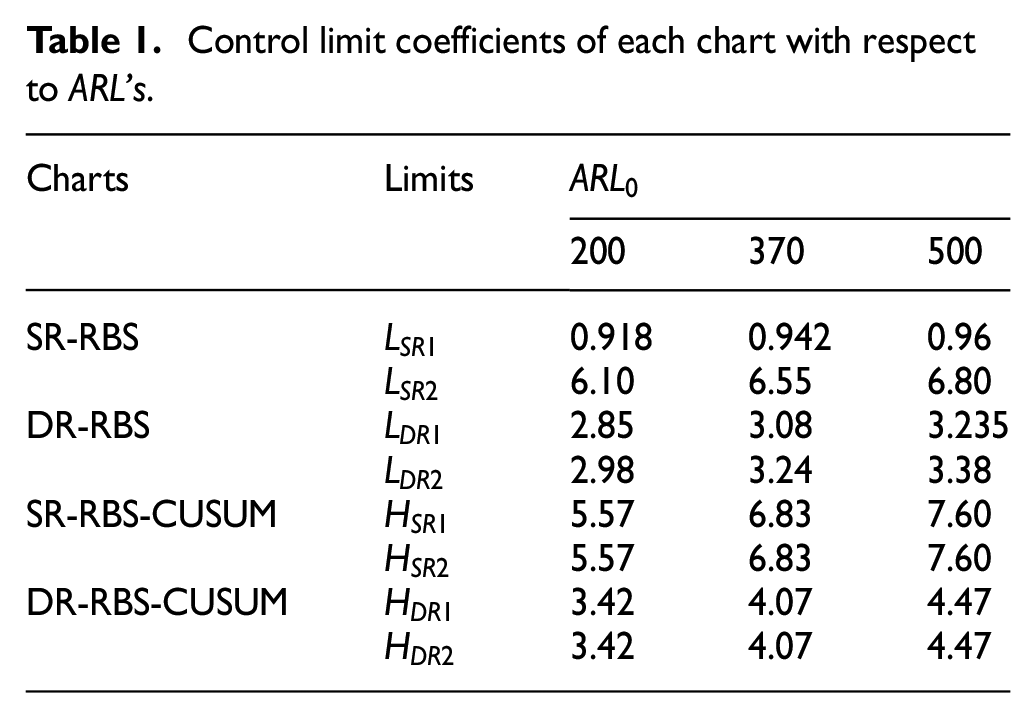
The control limit coefficients are shown in Table 1 with different
Control limit coefficients of each chart with respect to
Results of simulation
We have included a performance comparison of the existing and suggested charting schemes in this section. The average run length
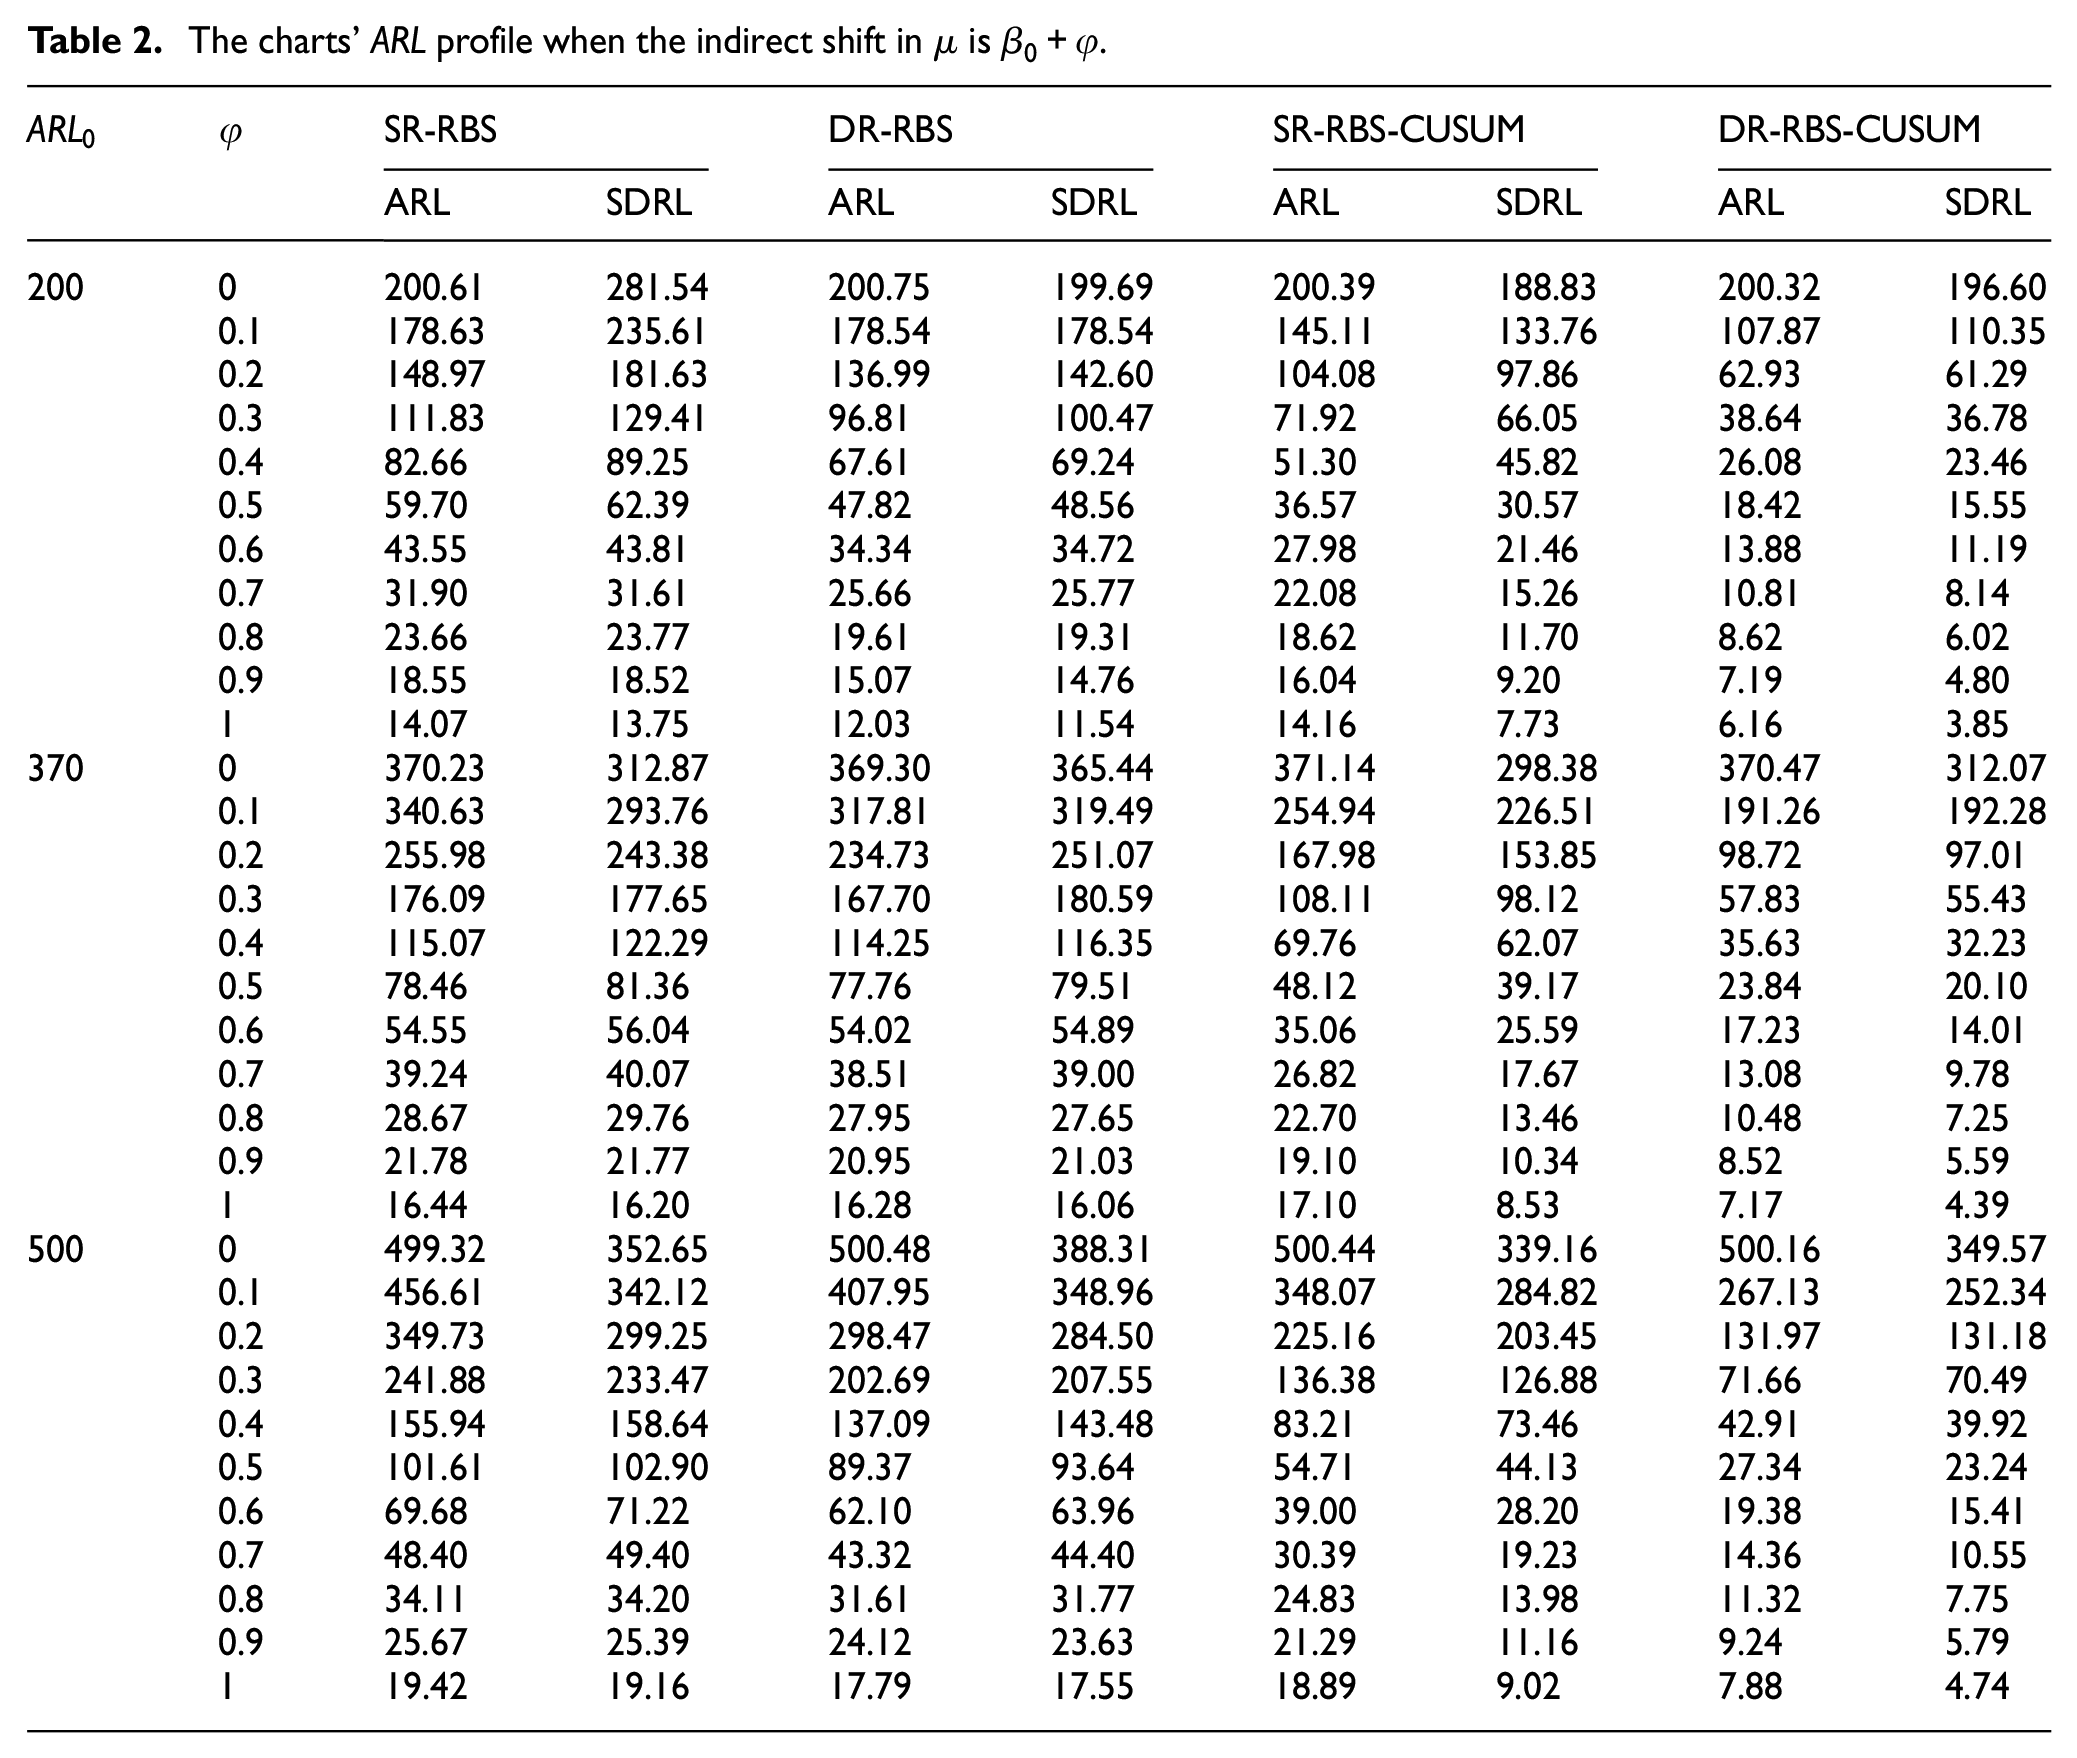
The charts’
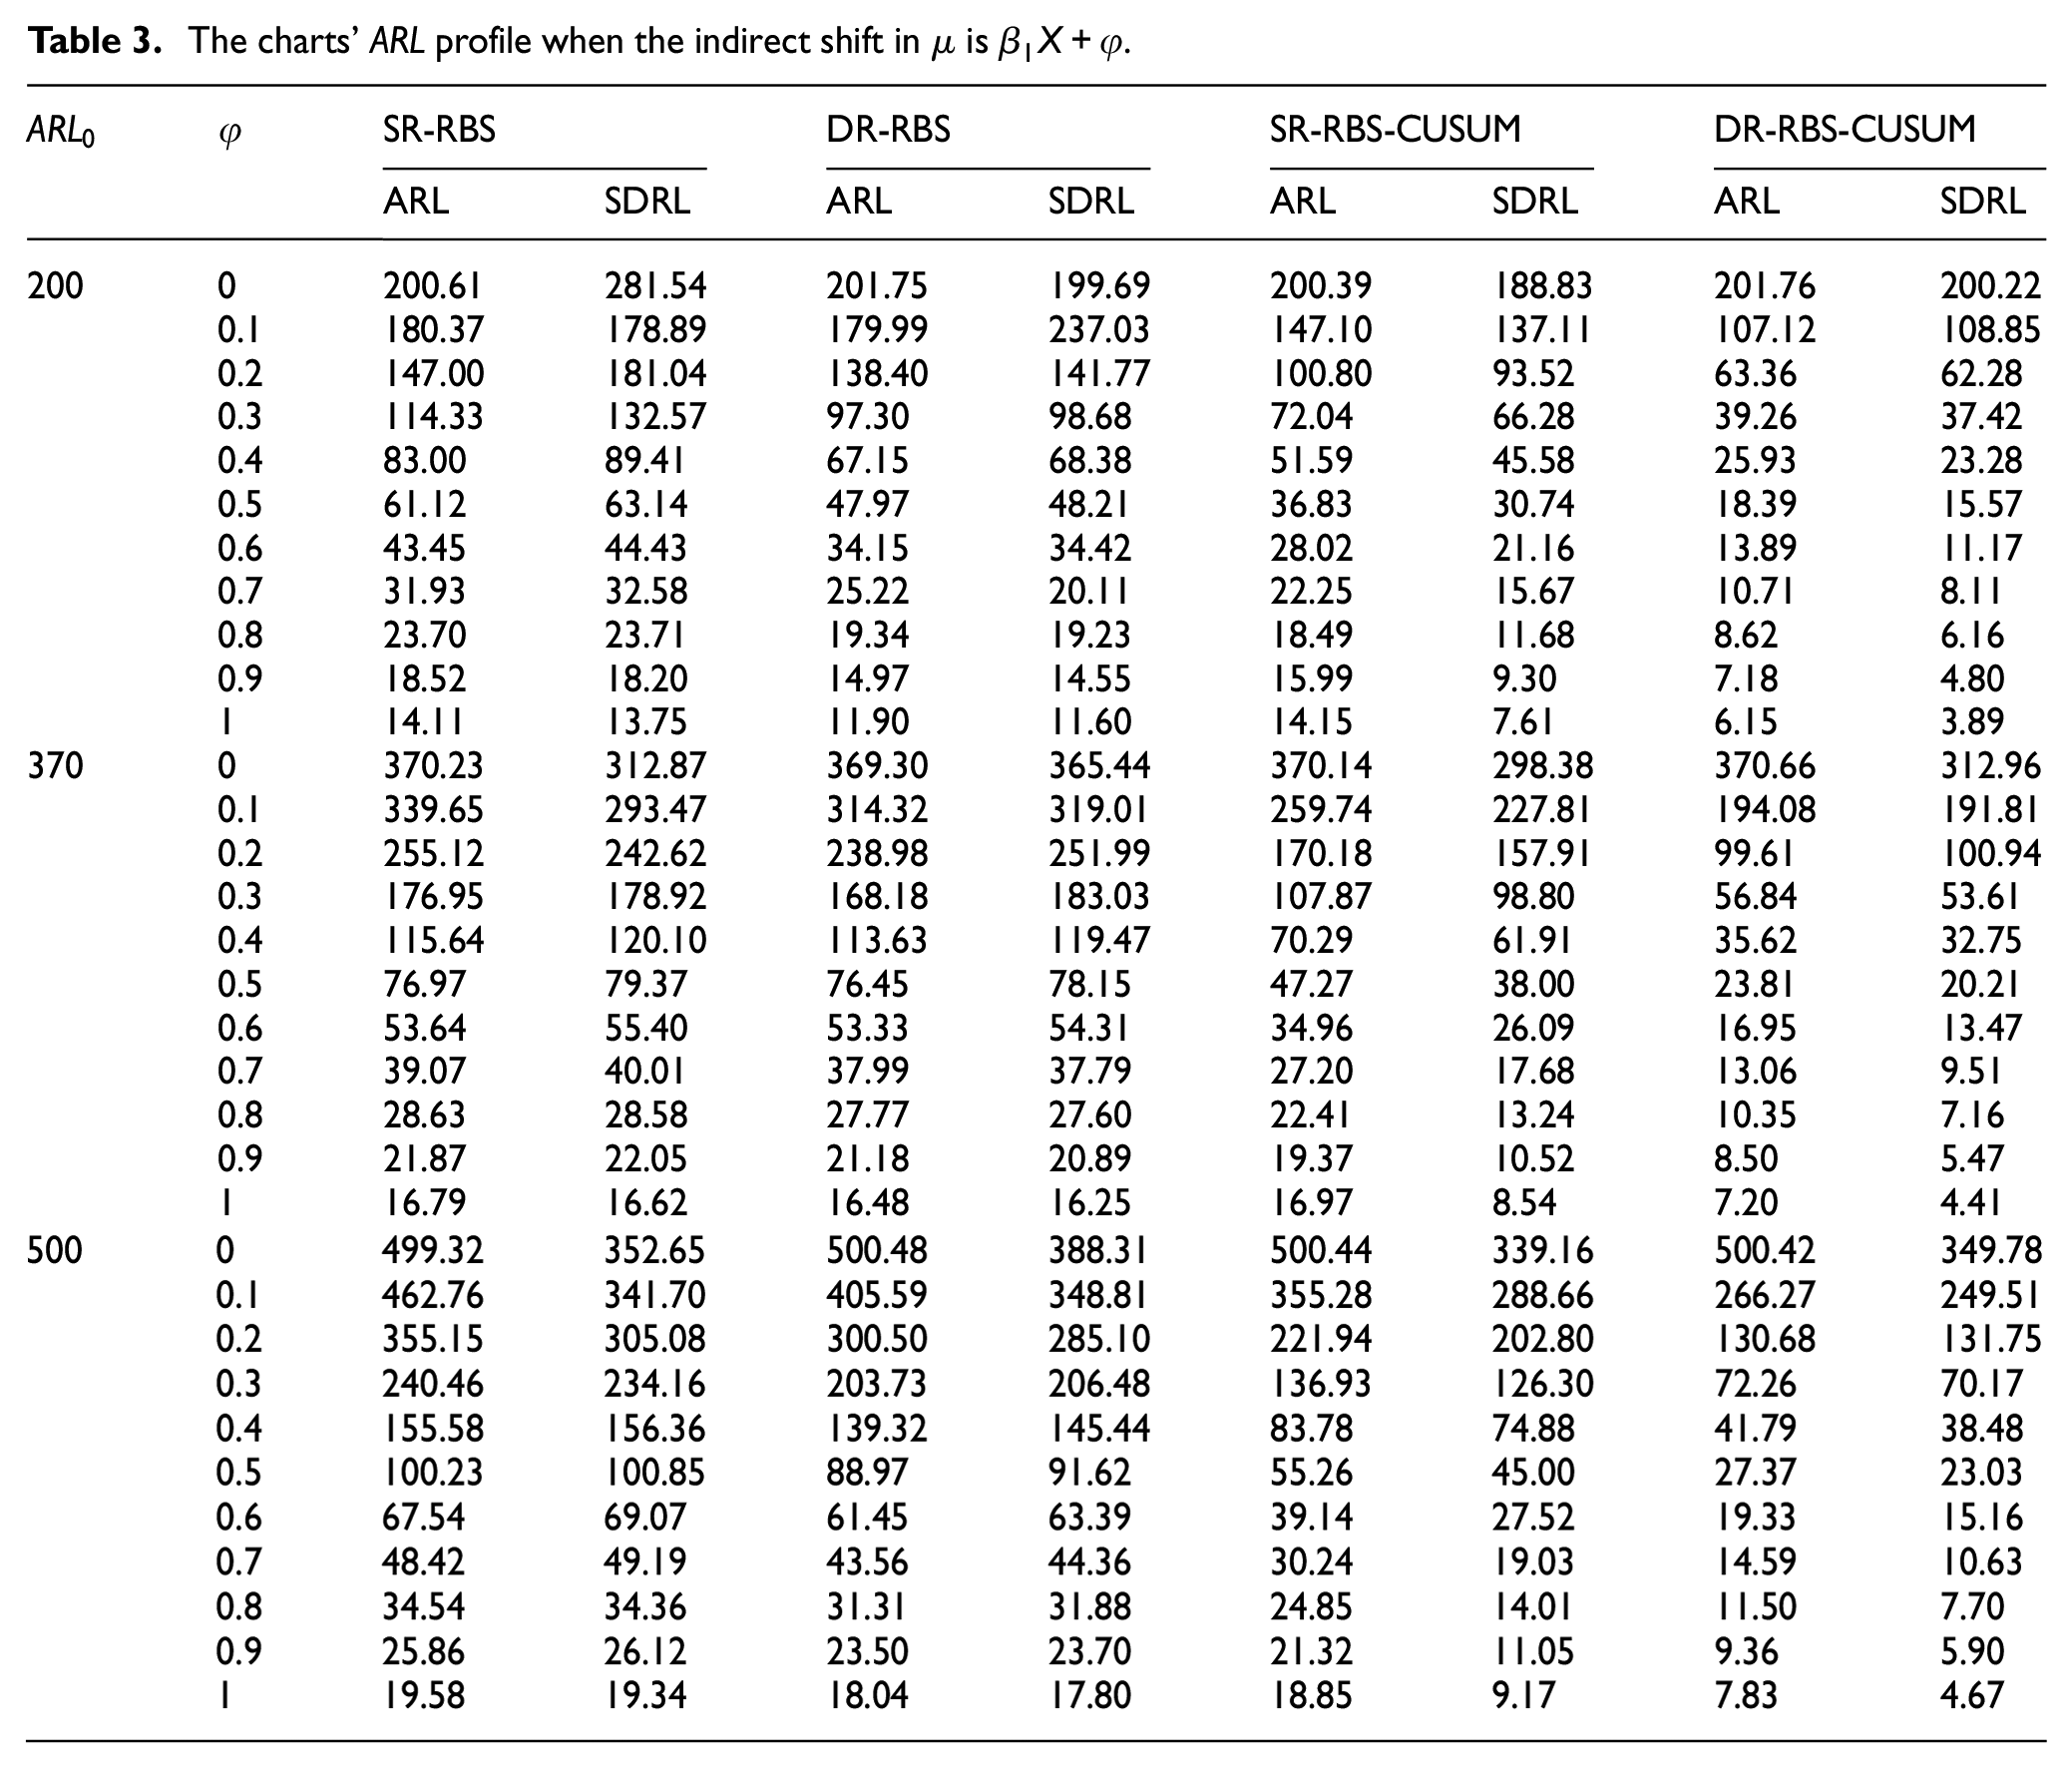
The charts’
The charts’
In Table 2, the suggested CUSUM charts are compared with the existing Shewhart charts for the detection of an indirect shift in mean with respect to
In terms of the indirect shift in mean with respect to
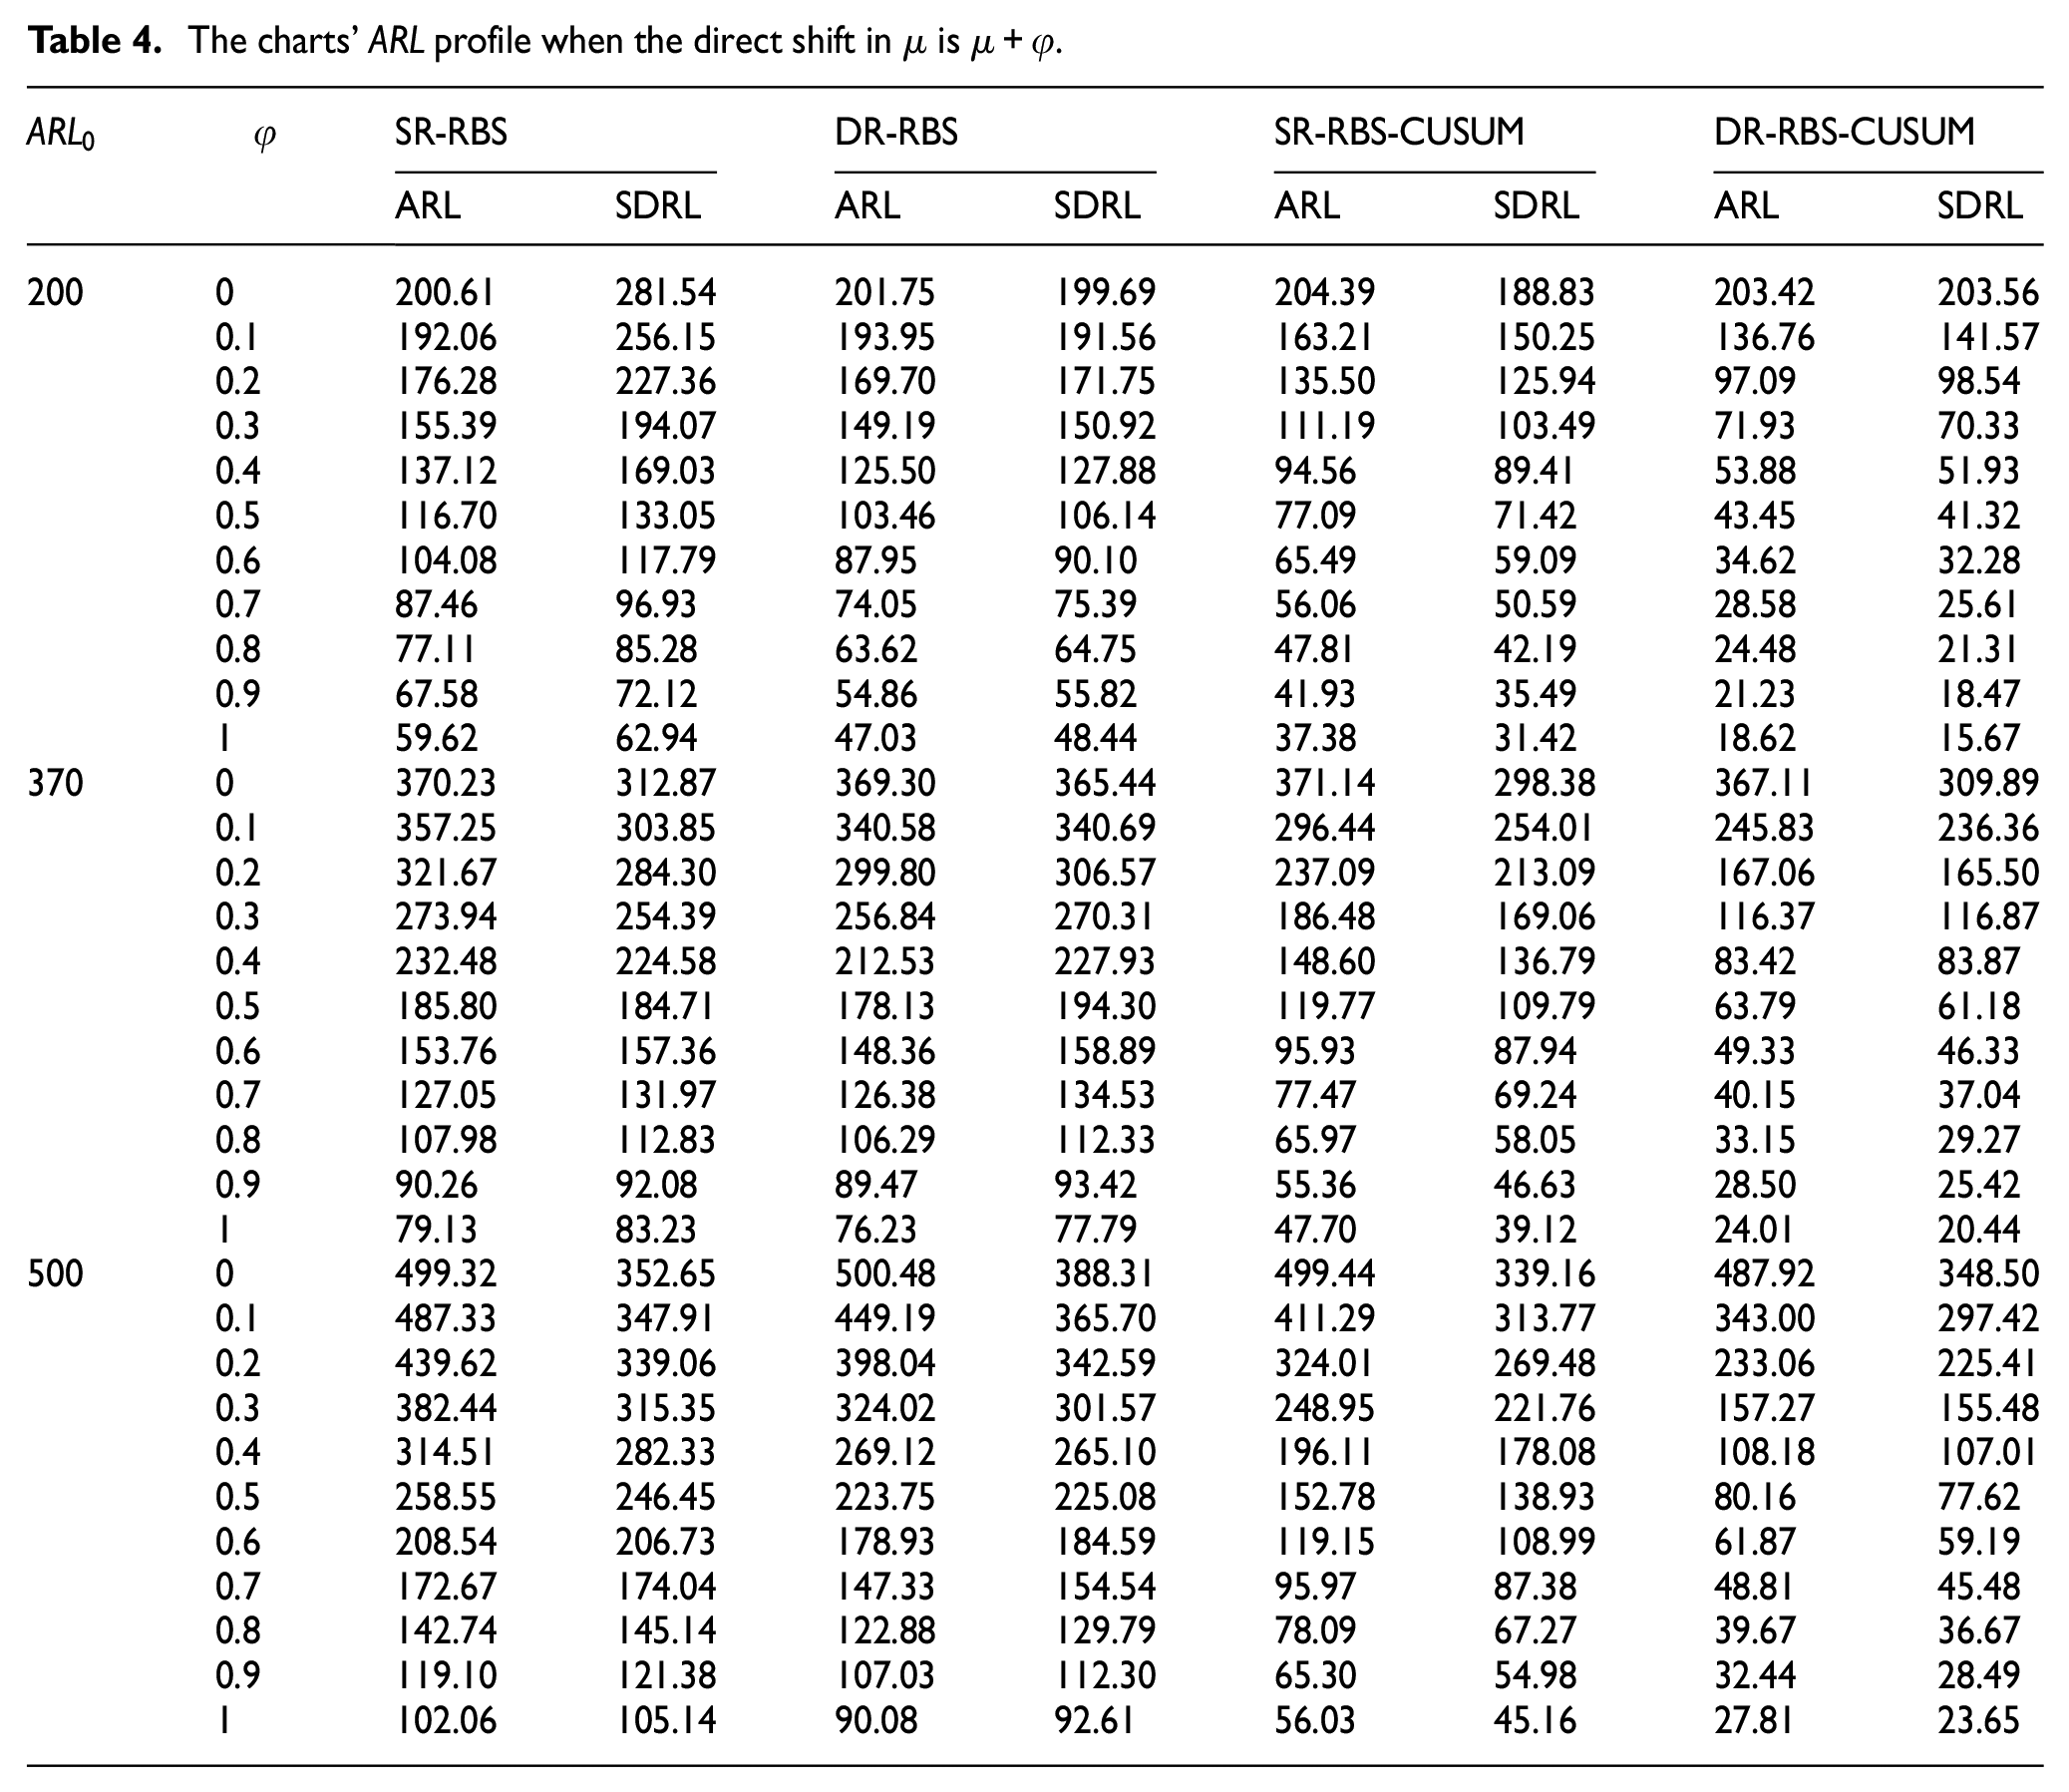
Table 4 compares the performance of the proposed CUSUM charts to that of the existing Shewhart charts by applying the direct shift in mean as
Overall, it is perceived that the DR-RBS-CUSUM control chart performs better than the other charts for all three types of shifts.
Impact of charting parameter K
The reference value
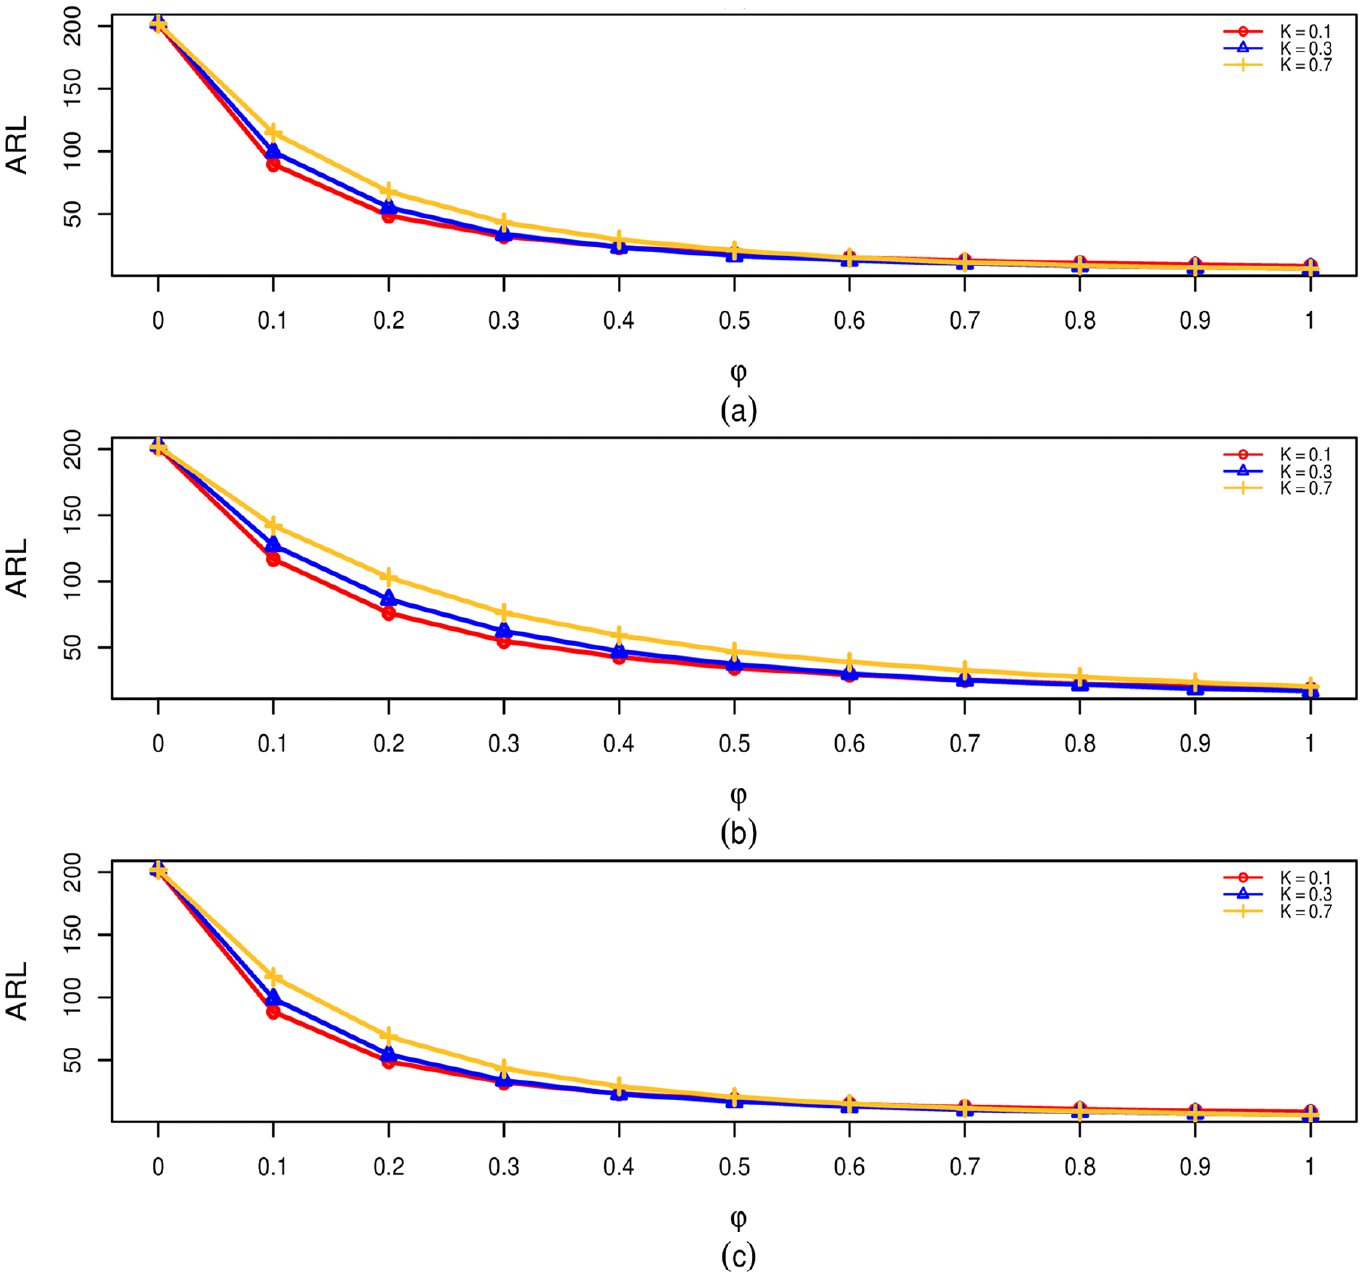
Impact of reference value K on the performance of DR-RBS-CUSUM control chart: (a) under shift
Implementation of combined cycle power plant (CCPP) data
Around the world, electricity serves as the primary engine for modern civilization and is one of the most important resources for human achievement. We need a significant quantity of electrical power for the economy and society to run smoothly, and as a result of the ongoing need for electricity, combined cycle power plants (CCPP) are being used more and more frequently. Power plants are built on a huge scale to supply the human population with the necessary amount of electricity. In this case, maintaining a stable and advantageous power generation system is of utmost importance for producing electrical power. The electrical energy output of a power plant is sensitive to Ambient conditions. This study takes the ambient temperature into account while analyzing the CCPP’s electric energy generation efficiency. To meet the objective, net hourly electrical energy output (
Descriptive statistics of net hourly electrical energy output.
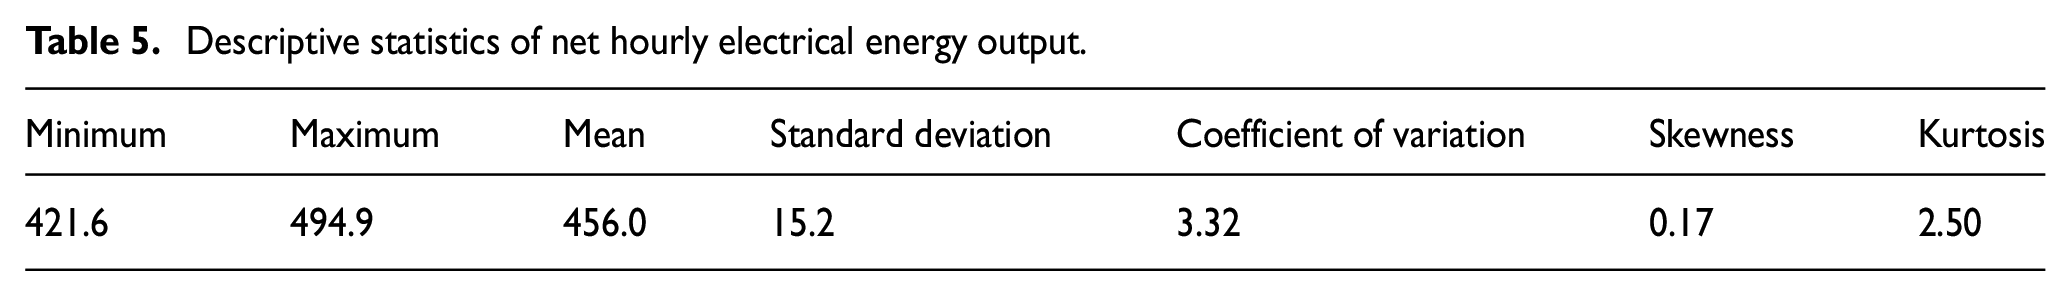
As shown by these descriptive statistics, the empirical distribution of net hourly electrical energy output is somewhat positively skewed in contrast to a normal (or Gaussian) distribution. These data properties may be seen in Figure 2, which shows a histogram roughly representing the probability density function of the energy output and shows that the RBS distribution, whose pdf is estimated with
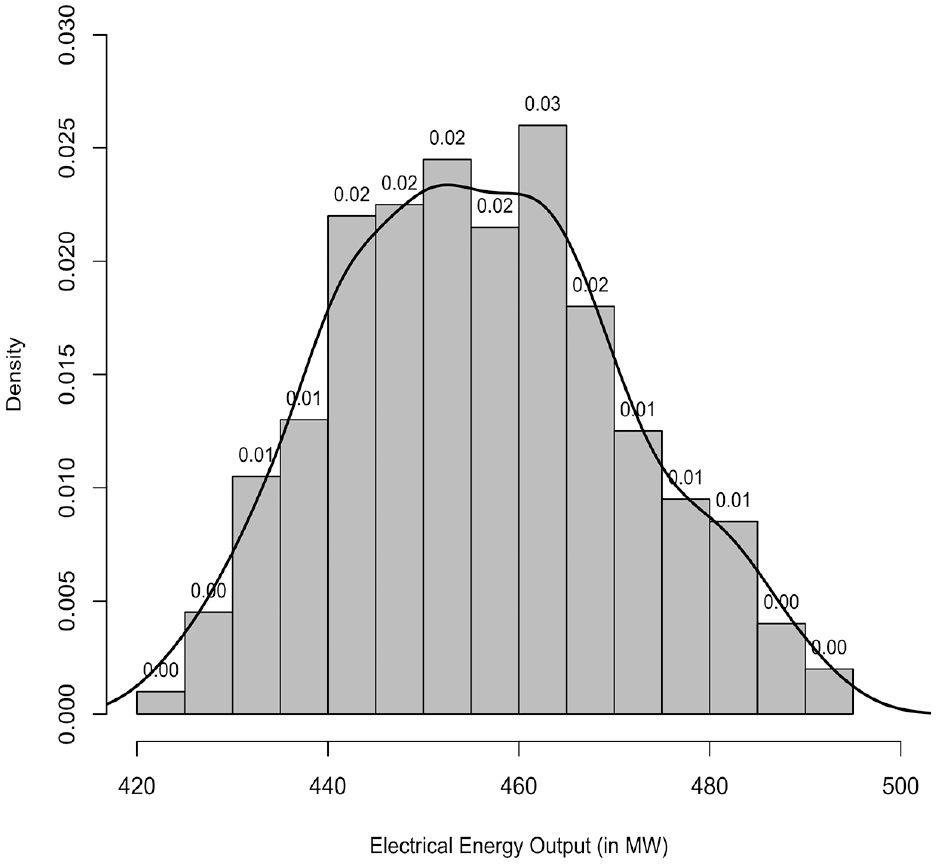
Histogram of electrical energy output of CCPP.
Also, Figure 3 displays a Q-Q plot with an envelope to evaluate the model’s distributional assumption. The hypothesis that the response variable follows an RBS distribution is supported by the plot’s lack of odd characteristics.
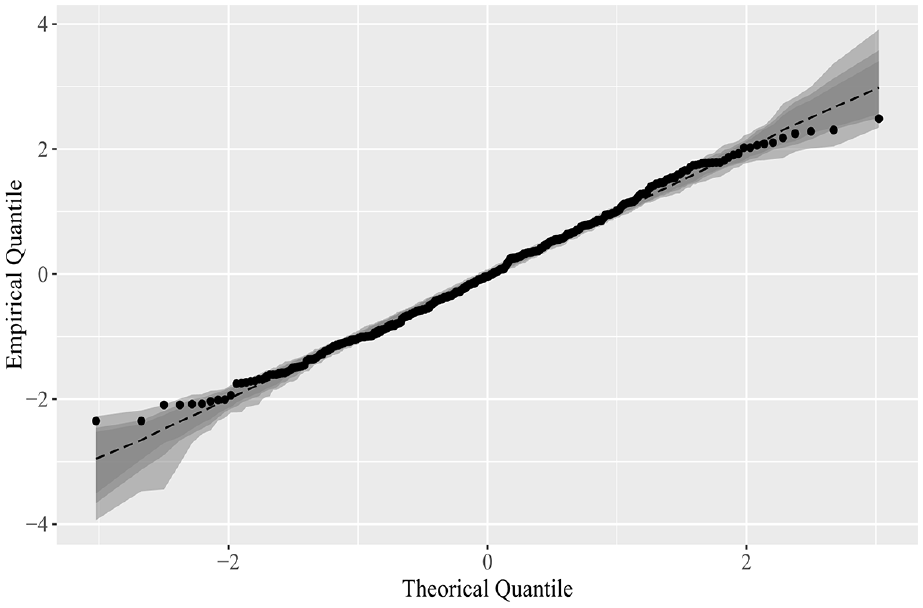
Q-Q plot for in-control RBS model with envelope.
Additionally, we utilized the Anderson-Darling and Cramer-von Mises goodness-of-fit tests
58
to examine the model fitting. The statistic
Next, RBS regression models between electrical energy output and ambient temperature are run using the IC and OOC datasets. The models are as follows:


The intercept and slope in both equations (2.10) and (2.11) are statistically significant with
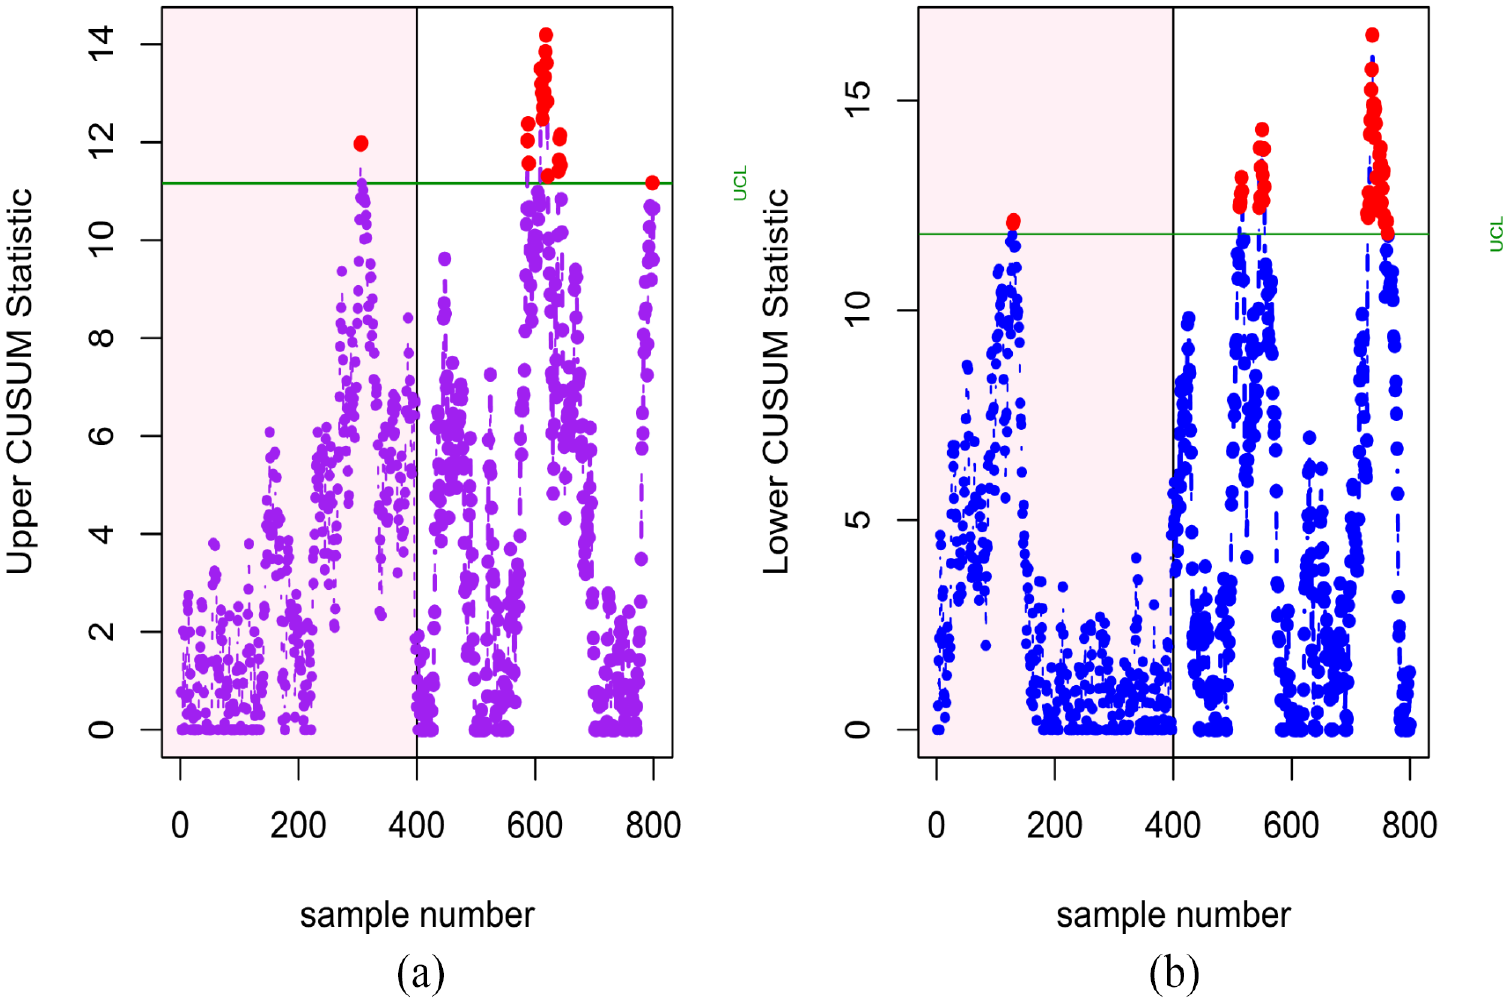
The SR-RBS-CUSUM and DR-RBS-CUSUM charts are employed and shown in Figures 4 and 5. The points under the pink window represent the IC state, whereas the OOC state is represented by the points under the white window. Plotting data are emphasized in blue and purple for an authentic appearance, and OOC points are indicated in red. It is noted that in Figure 4(a) SR-RBS-CUSUM chart has detected 20 OOC signals with 1 false alarm, and in Figure 4(b) it has detected 46 OOC signals with 1 false alarm.

Implementation of SR-RBS-CUSUM control chart on CCPP data: (a) Lower CUSUM chart and (b) Upper CUSUM chart.
Implementation of DR-RBS-CUSUM control chart on CCPP data: (a) Lower CUSUM chart and (b) Upper CUSUM chart.
In Figure 5(a), the DR-RBS-CUSUM chart has spotted 22 OOC signals with 1 false alarm, and in Figure 5(b), 47 OOC signals with 1 false alarm were detected. So, the simulated results and the findings from the illustrative examples are identical: the DR-RBS-CUSUM chart has greater detection power than the SR-RBS-CUSUM chart.
Conclusion and recommendations
Researchers interested in statistical process control are attracted to the idea of creating control charts that are more sensitive for speedier identification of process alterations, and there are many processes that generate positive asymmetric data. Symmetric distributions with support across the entire real number range are inappropriate for these data. The proposed novel CUSUM control charts in this research, which are based on the RBS regression model’s residuals (i.e. standardized and deviance residuals), have shown to be more sensitive for monitoring positively asymmetric data. We have undertaken a thorough simulation study to compare the suggested schemes with the existing Shewhart methods, and the results show that the control charts based on deviance residuals (i.e. DR-RBS and DR-RBS-CUSUM) outperform those based on standardized residuals (i.e. SR-RBS and SR-RBS-CUSUM) in terms of performance. Further research reveals that the new CUSUM type control chart (i.e. DR-RBS-CUSUM) beat the Shewhart type chart (i.e. DR-RBS). In order to apply the suggested control charts, an illustrative example based on combined cycle power plant (CCPP) data is presented.
When a process generates positively skewed measurements, practitioners are recommended to use the DR-RBS-CUSUM for effective monitoring of the process mean. The recommended monitoring techniques can be used to monitor and regulate processes in the fields of electrical engineering, the textile industry, environmental sciences, economics, epidemiology, healthcare, and highway safety surveillance, etc. They are quick ways to spot subtle changes in the process. For example, to improve overall operational efficiency, the proposed structures may direct the quality engineers to take appropriate action to control the anomalies in electrical energy output by taking into account additional critical parameters like exhaust, ambient pressure, humidity, and temperature. Moreover, these techniques can help practitioners to make strategic decisions about energy management, including system adjustments, maintenance schedules, and efficiency improvements. They can use predictive insights to anticipate changes in energy output and implement proactive measures. These advantages contribute to more effective research, optimized energy management, and improved system performance. For future studies, the scope of this study can be extended by using RBS regression modeling with varying precision, extreme value BS regression modeling, RBS semi-parametric modeling, and multivariate BS distribution to track many variables in BS modeling as well as by expanding the proposals to the most recent monitoring systems such as mixed EWMA–CUSUM and mixed CUSUM–EWMA.
Footnotes
Acknowledgements
The author “Tahir Mahmood” is thankful to the University of the West of Scotland for providing research facilities for conducting this research and providing APC charges.
Declaration of conflicting interests
The author(s) declared no potential conflicts of interest with respect to the research, authorship, and/or publication of this article.
Funding
The author(s) received no financial support for the research, authorship, and/or publication of this article.
Data availability statement
Data sharing not applicable to this article as no datasets were generated or analyzed during the current study.