
Abstract
In view of the problem that the distributed optical fiber-based deformation reconstruction method can produce serious accumulated errors, this paper developed a smart fiber optic sensor belt that employs a carbon-fiber composite material as the matrix and strain-sensing fiber optics as the sensing element and is based on the key-point dip angle information acquired by a high-precision tilt sensor. The method of in situ correction for the cumulative error of circumferential deformation was investigated, and the particle swarm optimization algorithm was adopted to perform in situ correction for the reconstructed circumferential deformation field of the sensor belt to reduce the cumulative measurement error of the circumferential deformation field. Simulations and indoor tests were systematically performed. After the correction, the errors of the simulation and indoor tests were reduced from 210.83 and 235.82 mm to 2.17 and 4.04 mm, respectively, which verified the effectiveness and accuracy of the aforementioned method.
Introduction
Shape-sensing technology has practical importance in various fields, such as safety monitoring of large infrastructure and aircraft structures, posture monitoring of intelligent robots, and deformation monitoring of smart materials.1,2 Real-time monitoring of critical parameters such as object deformation is also an effective way to prevent disaster accidents.
Common monitoring methods include laser scanning,3,4 total station measurements, 5 and machine vision-based structural deformation monitoring.6,7 However, these methods struggle to capture changes in the internal deformation field and are challenging to implement for continuous monitoring over time. Compared with traditional measurement techniques, fiber optic sensors offer several advantages, such as good electrical insulation, high sensitivity, resistance to interference, and low cost, and have been widely used in engineering structures.8,9 The distributed fiber optic sensing technology that has emerged in recent years can sense and locate environmental information and physical parameters along the length of the fiber optic cable. It can obtain the deformation of every structure along the fiber optic cable and achieve large-scale and refined monitoring of the measured structure, gradually becoming a research hotspot in related fields.10,11
Distributed sensing technology can be divided into two categories: quasi distributed and fully distributed fiber optic sensing technology. Quasi distributed fiber optic sensing technology usually refers to a sensing array composed of fiber Bragg grating (FBG), 12 which has a simple structure and has been widely used in deformation monitoring. Li et al. 13 used FBG monitoring technology to analyze the mechanism of stress redistribution in surrounding rock caused by tunnel excavation, and established tunnel models under different section bias angles, providing a viable method for evaluating structural stability post-tunnel excavation. Yue et al. 14 conducted a distributed strain monitoring study on bridges based on weak fiber Bragg grating arrays The static and dynamic loading tests show that the sensing optical cable can be monitored for strain variation in order to realize the functions of lane identification, weighing vehicle tonnage as well as velocity discrimination. The fully distributed fiber optic sensing technology can continuously sense the spatial distribution and variation information of physical parameters such as temperature, strain, vibration, etc. at every point on the fiber optic transmission path, and has also been applied to shape sensing in recent years. Among them, Optical Frequency Domain Reflectance (OFDR) technology achieves distributed strain and temperature measurement along the sensing fiber direction by detecting the beat frequency interference between Rayleigh scattering signals and reflected light. Meng et al. 15 propose a multicore fiber shape sensing method based on optical frequency domain reflectometry parallel measurements that can simultaneously measure the strain of multiple cores with only one measurement. This can achieve a maximum relative error of 3.37% for shape reconstruction. Parent et al. 16 developed an advanced interventional guidance platform using distributed shape sensing based on OFDR to track the tip and shape of a catheter in oncotherapy.
However, due to the long monitoring distance, the use of distributed fiber optic circumferential deformation reconstruction methods will result in serious cumulative errors along the longitudinal direction, which will seriously affect the monitoring accuracy of the deformation field. Zhang et al. 17 analyzed the relationship between the central wavelength shift and curvature of the multi-core fiber based on the principle of multi-core fiber shape sensing and investigated an error correction method based on regularized multilayer perceptron (MLP) networks, which has potential applications in shape sensing in the fields of biomedical engineering and aerospace. Li et al. 18 established a reconstruction error model of distributed shape sensing in OFDR based on the Frenet–Serret frame and the error delivering theory, which illustrates the relationship between the reconstruction error and parameters, such as curvature, torsion, fiber length, and strain measurement error. It is very useful to judge whether the shape reconstruction error meets the requirement according to the shape to be reconstructed. Wang et al. 19 studied in-situ calibrated deformation reconstruction method for fiber Bragg grating embedded smart Geogrid, which used an external sensor to provide a reference displacement and adopted Linear Descending Inertia Weight Particles Swarm Optimization (LDIW-PSO) algorithm to determine the optimal weighted coefficient so as to calibrate the reconstructed deformation. Simulation experiments and actual verification results showed that this method achieved high reconstruction accuracy.
In summary, there have been many research achievements in the application of fiber optic sensing technology in shape sensing. However, given the challenges of continuous monitoring, large cumulative errors, low measurement accuracy, and complex signal processing in circumferential deformation monitoring methods based on distributed fiber technology, in this study, we designed and constructed a distributed smart fiber optic sensor belt monitoring system. Considering the complexity of circumferential deformation changes in the horizontal and vertical directions, which makes it difficult to uniformly account for cumulative error variations, we explored an onsite correction method for cumulative errors in circumferential deformation based on key-point inclination information. High-precision inclinometers installed on the smart fiber optic sensor belt provide key-point inclination data, which serve as a basis for using the particle swarm optimization algorithm to correct the reconstructed circumferential deformation field in situ. Systematic simulations and indoor experiments were conducted to verify the effectiveness and accuracy of these methods.
Materials and methods
Smart fiber optic sensor belt monitoring system
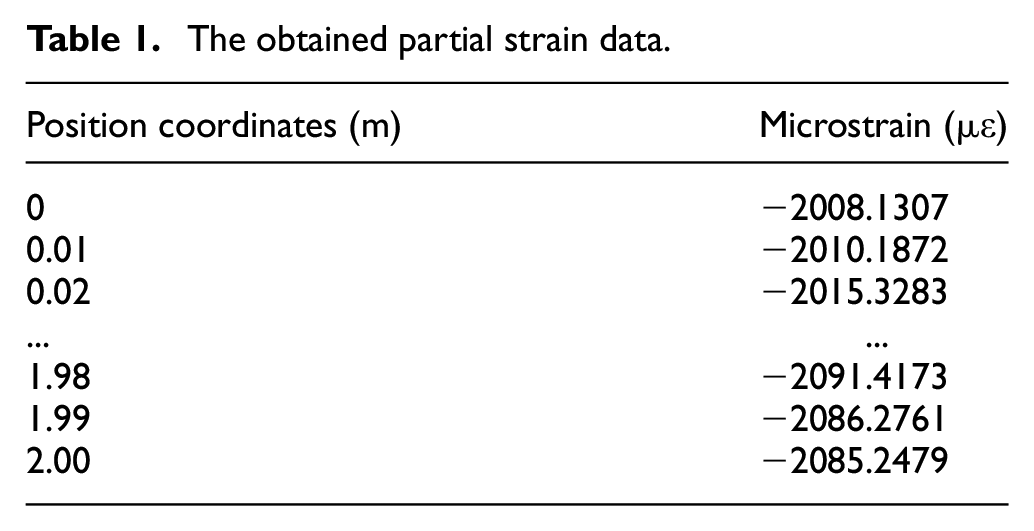
The smart fiber optic sensor belt monitoring system used for circumferential deformation monitoring is shown in Figure 1. It includes a smart fiber optic sensor belt and an optical frequency-domain reflectometry (OFDR) distributed fiber demodulator. The smart fiber optic sensor belt is installed on the surface of the object to be measured, with one end connected to an OFDR demodulator to read strain information. Two tilt sensors are installed at a 45° angle on the top of the circular sensor belt to continuously acquire tilt data. The OFDR distributed fiber demodulator is used to acquire strain data from each sensing point on the fiber deformation sensor, which are then used for reconstruction and correction of the deformation field. An example of the obtained partial strain data is shown in Table 1. The left side represents the coordinates of the sensing position, and the right side represents the corresponding micro strain at that position.
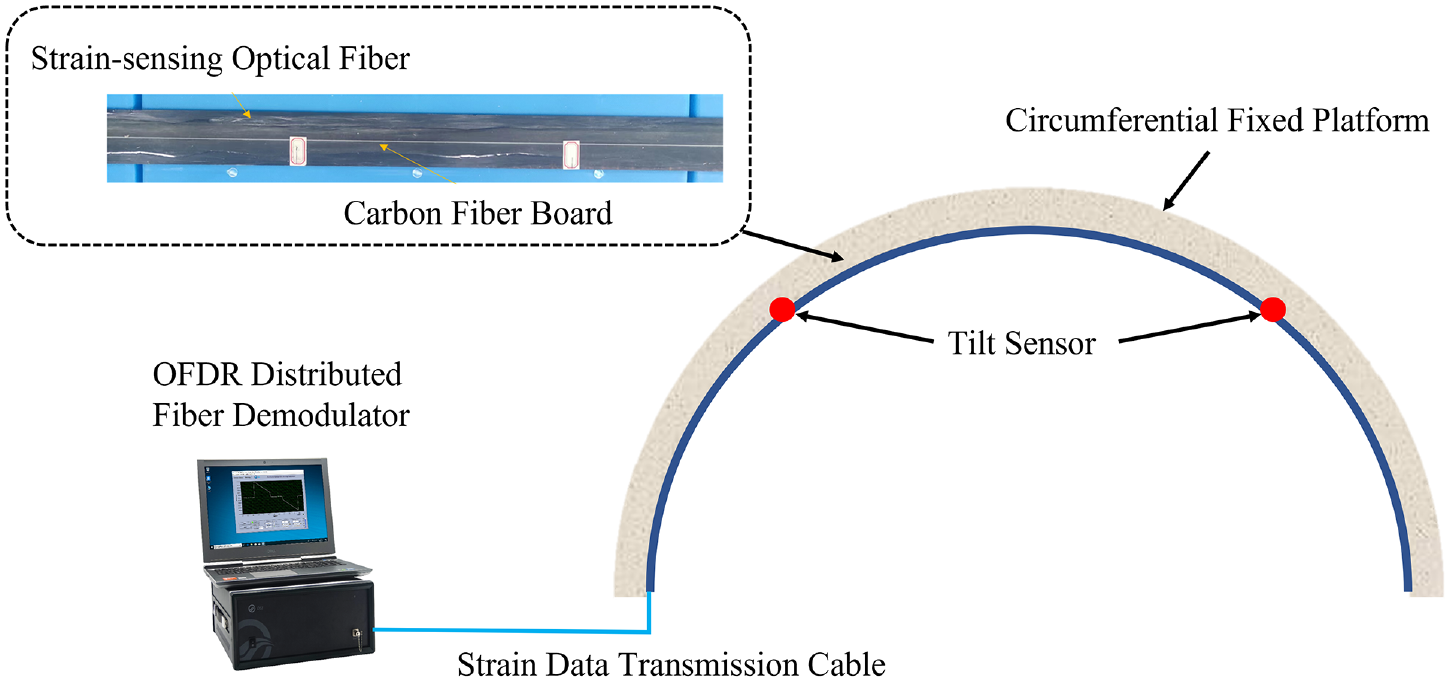
Schematic diagram of the smart fiber optic sensor belt monitoring system.
The obtained partial strain data.
A smart fiber optic sensor belt was fabricated by coupling the strain-sensing optical fibers to a flexible substrate. The flexible substrate was a strip of Carbon Fiber Reinforced Polymer (CFRP) generated by Shanmeibang Company, which is known for its high strength and corrosion resistance. It has a width of 50 mm and a thickness of 1.4 mm, and its length can be determined based on the size of the monitored structure. Additionally, a 0.9-mm-diameter high-transmission tight-buffered protective strain-sensing fiber generated by NanZee Sensing Company was selected. The preparation method was as follows. First, the optical fiber was aligned and preliminarily fixed along the central axis of the flexible substrate. The epoxy resin was mixed with a hardener at a 1:1 weight ratio, and a brush was used to apply it to the optical fibers previously fixed on the surface of the carbon-fiber substrate, allowing it to solidify to form a bonding layer and ensure good coupling between the optical fibers and the carbon-fiber substrate. The same operation was then performed on the reverse side of the substrate to fix another optical fiber, which provided temperature compensation. Finally, we led out the tail fibers at both ends of the substrate to connect to the OFDR-distributed fiber demodulator. The production process of the smart fiber optic sensor belt is shown in Figure 2.
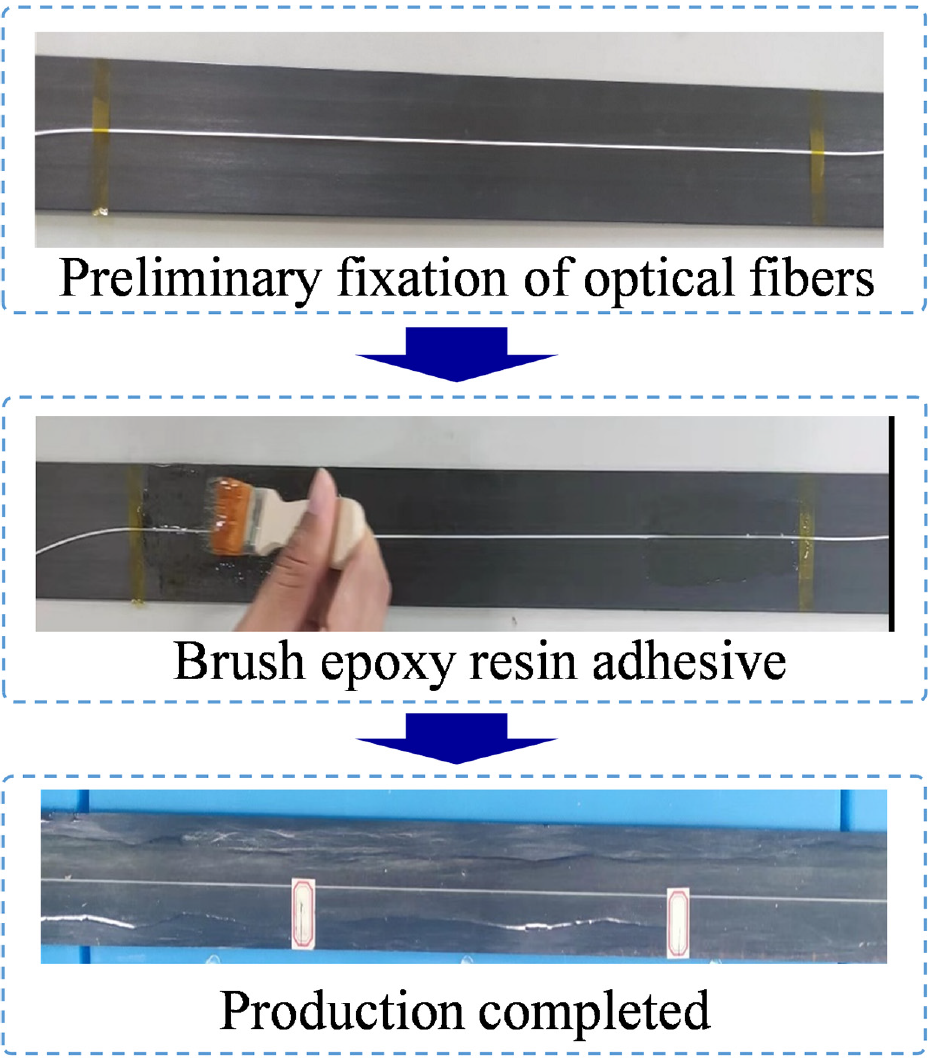
Production process diagram of the smart fiber optic sensor belt.
The strain data acquisition of the smart fiber optic sensor belt utilizes an OFDR distributed fiber demodulator based on optical frequency domain scattering technology. The device captures and analyzes the frequency shifts of Rayleigh scattering signals along the fiber, achieving a spatial resolution of 1 mm within a sensing range of hundreds of meters, which is equivalent to measuring 100,000 sensing points on a single fiber. The sensing accuracy reaches ±0.1°C/±1.0με, allowing high-resolution monitoring of extensive linear engineering projects.
In situ correction method for circumferential deformation error
For the proposed smart fiber optic sensor belt monitoring system, the deformation curve of the sensor belt was calculated using a two-dimensional deformation reconstruction algorithm based on curvature. In this system, the sensing points collected by the OFDR-distributed fiber demodulator were evenly spaced at a distance L on the flexible substrate of the sensor belt. A sensing segment centered on a sensing point and spanning length L can be considered the detection unit of the smart fiber optic sensor belt. According to the principles of differential calculus, the curvature of the sensing points within each detection unit can approximate the curvature of the entire arc. After collecting the strain of each sensing segment, in accordance with the kinematics of pure bending, the curvature of each sensing segment has a linear relationship with strain, expressed as equation (2-1), where
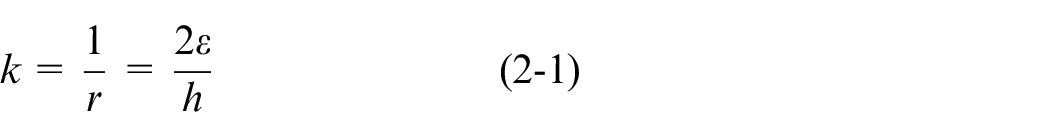
With the direction of the initial point and the curvature of each arc segment known, a recursive algorithm can be used to derive the curve equation for any segment of the arc, after which the coordinates at the end of each arc segment can be calculated.20,21
As shown in Figure 3, suppose that the fixed point of the flexible sensor, which is designated as the origin
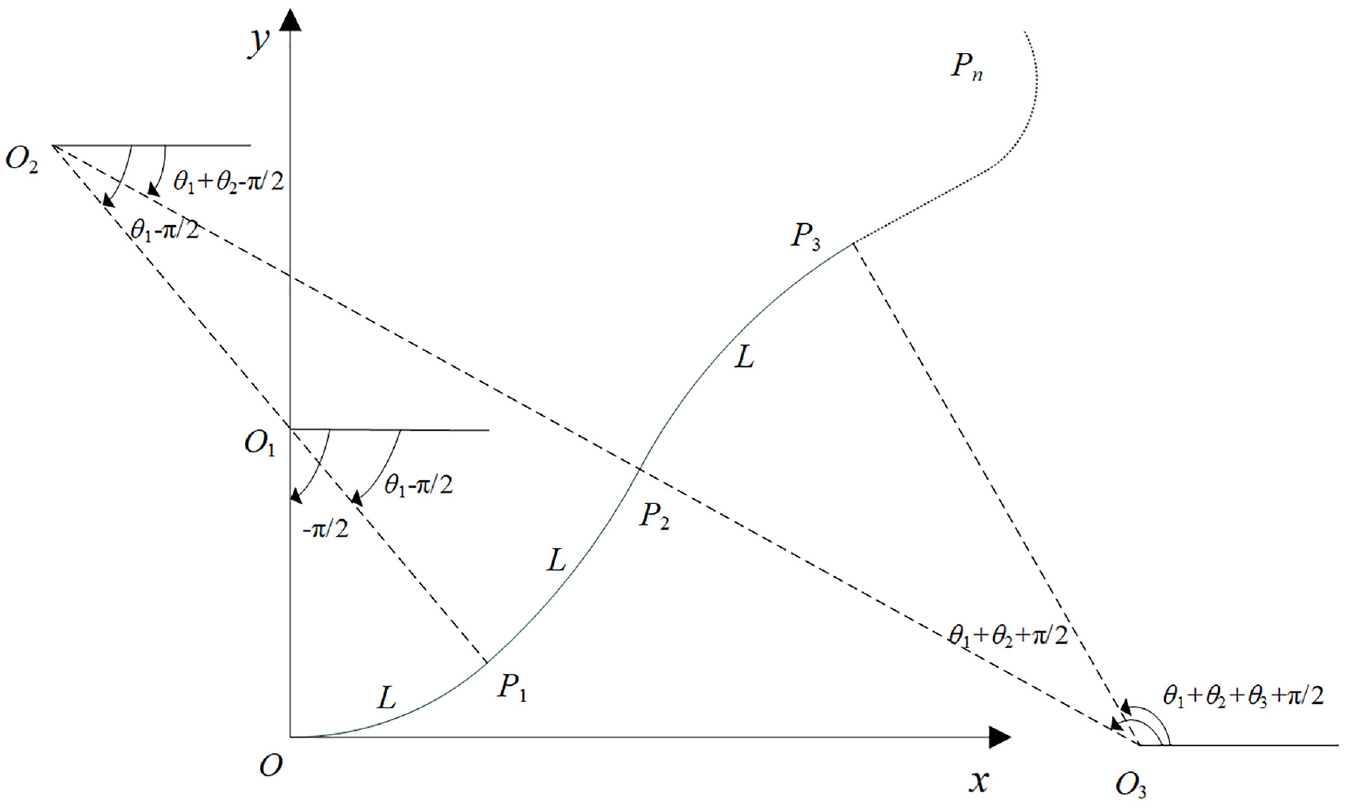
Schematic of the curvature-based 2D deformation reconstruction algorithm.
For the first arc segment, the coordinates of the center point
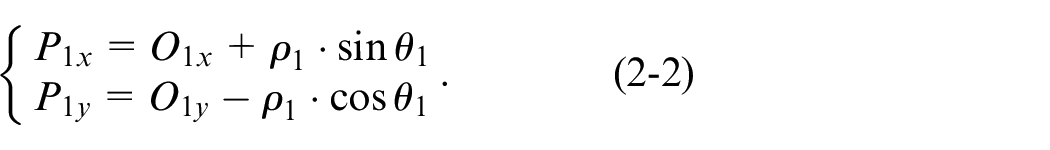
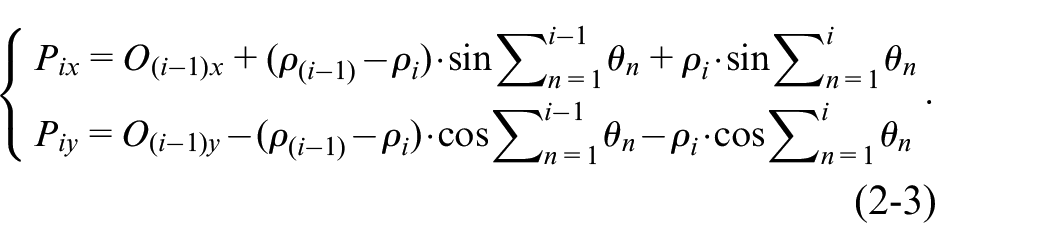
Following this pattern, when i ≥ 2, the coordinates of the endpoint
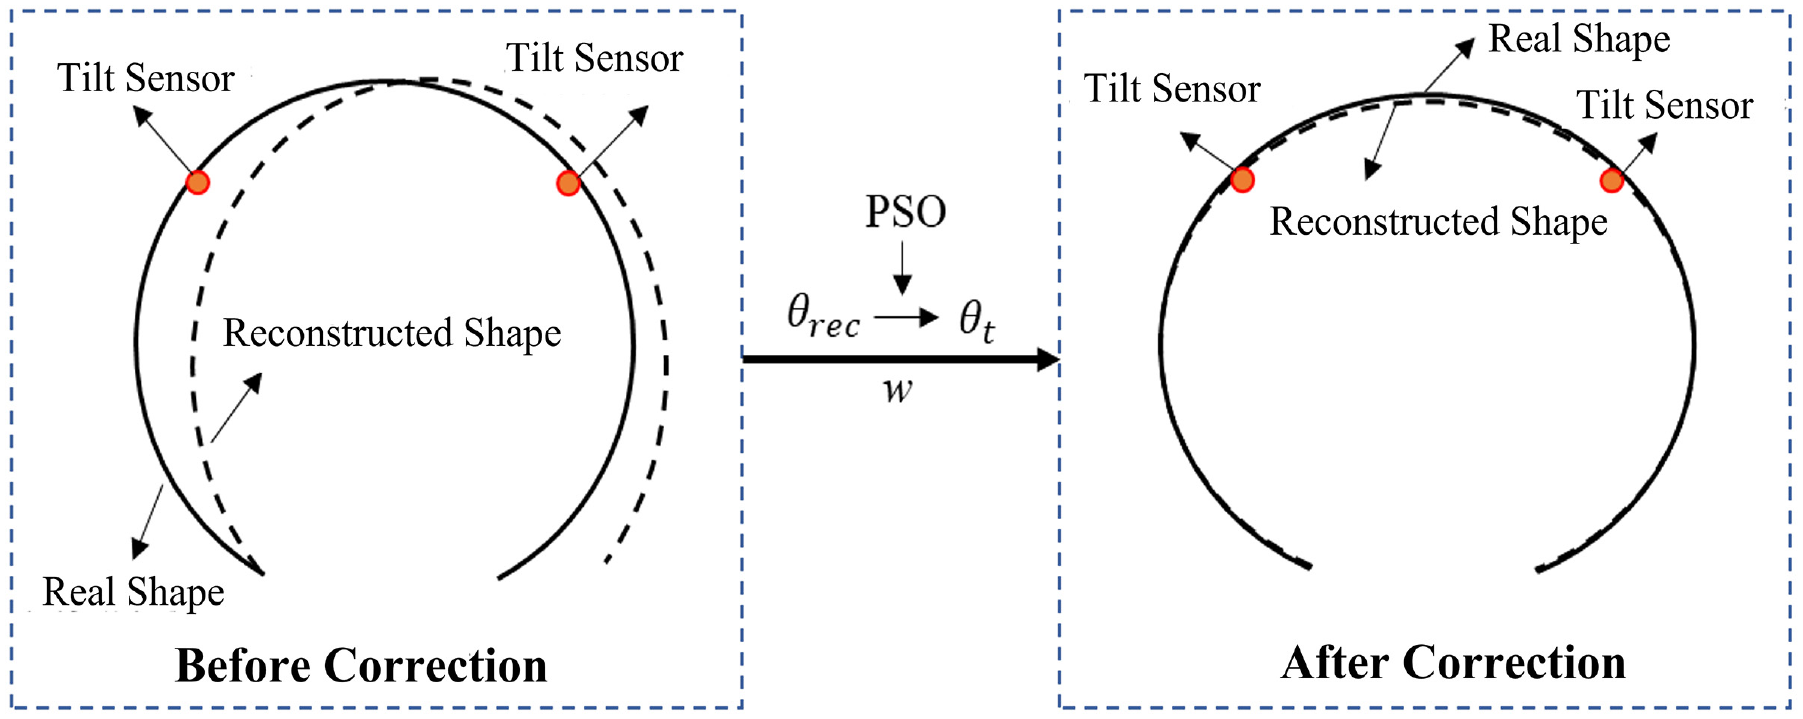
The method for the onsite correction of circumferential deformation cumulative errors based on key-point inclination information is illustrated in Figure 4. Two inclinometers are installed at a 45° angle on the top of the circular sensor belt to continuously acquire tilt data, which are denoted as
Schematic diagram of in situ correction based on key points inclination information.
The correction primarily uses the particle swarm optimization algorithm22,23 to optimize the strain correction coefficient
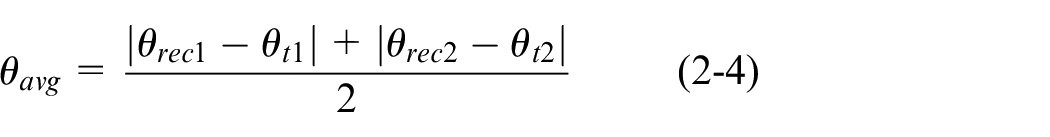
The objective function is used to measure the average error between the tilt angles
The sources of cumulative error are manifold, primarily including model errors and measurement errors. Model errors mainly involve the reconstruction principle: the sensing belt needs to be divided into shorter sensing segments according to the sampling interval, and the curvature at the sensing points is used to approximate the curvature of the entire sensing segment, which introduces approximation errors. In this paper, a sampling interval of 10 mm was chosen to minimize these approximation errors while ensuring a relatively short sampling time. Additionally, since the reconstruction algorithm performs recursive calculations point by point, the approximation error of the previous sensing point accumulates at the next sensing point. Therefore, as the monitoring distance increases, the cumulative error becomes progressively larger. Measurement errors primarily include random errors such as strain transmission loss and environmental temperature interference. Since the carbon fiber tape and the strain sensing fiber are bonded together with epoxy resin, the varying thickness of the adhesive layer due to production constraints leads to different degrees of strain transmission loss. Furthermore, environmental temperature interference also affects strain transmission. The method proposed in this paper mainly corrects the model errors that occur during the measurement process.
After cumulative error correction, to evaluate the effectiveness of the correction, the error between the reconstructed deformation of the sensor belt and the actual deformation is represented by the average absolute error in the X- and Y-coordinates.
The average absolute error for the X-coordinates is given as follows:
The average absolute error for the Y-coordinates is given as follows:
In equation (2-5),
Experimentation
Simulation verification
To verify the feasibility of the aforementioned correction method, finite-element method simulations were performed on the shape of the smart fiber optic sensor belt. As shown in Figure 5, considering a smart fiber optic sensor belt with a length of 2.4 m, width of 0.05 m, and thickness of 0.0013 m, the sensor belt model was connected end-to-end to establish a circumferential simulation model with a perimeter of 2.4 m. Within three-quarters of the circumference of the 2.4 m model, 1800 strain measurement points are set at intervals of 0.01 m for obtaining strain data, with a sensing range of 1.8 m. Additionally, 19 displacement measurement points are uniformly distributed at intervals of 0.1 m within the strain data range for obtaining actual coordinate data. Finally, inclinometer measurement points are set above the model on the left and right sides to obtain the tilt data used in the error correction, as indicated by the blue dots in the figure. Using the same parameters, a large-scale simulation model of a ring-shaped sensor belt spanning a length of 24 m and connected end-to-end is established for comparison. The sensing range is 18 m, and 37 displacement measurement points are uniformly distributed to obtain the actual coordinate data.
Schematic diagram of the simulation model of the circumferential sensor belt.
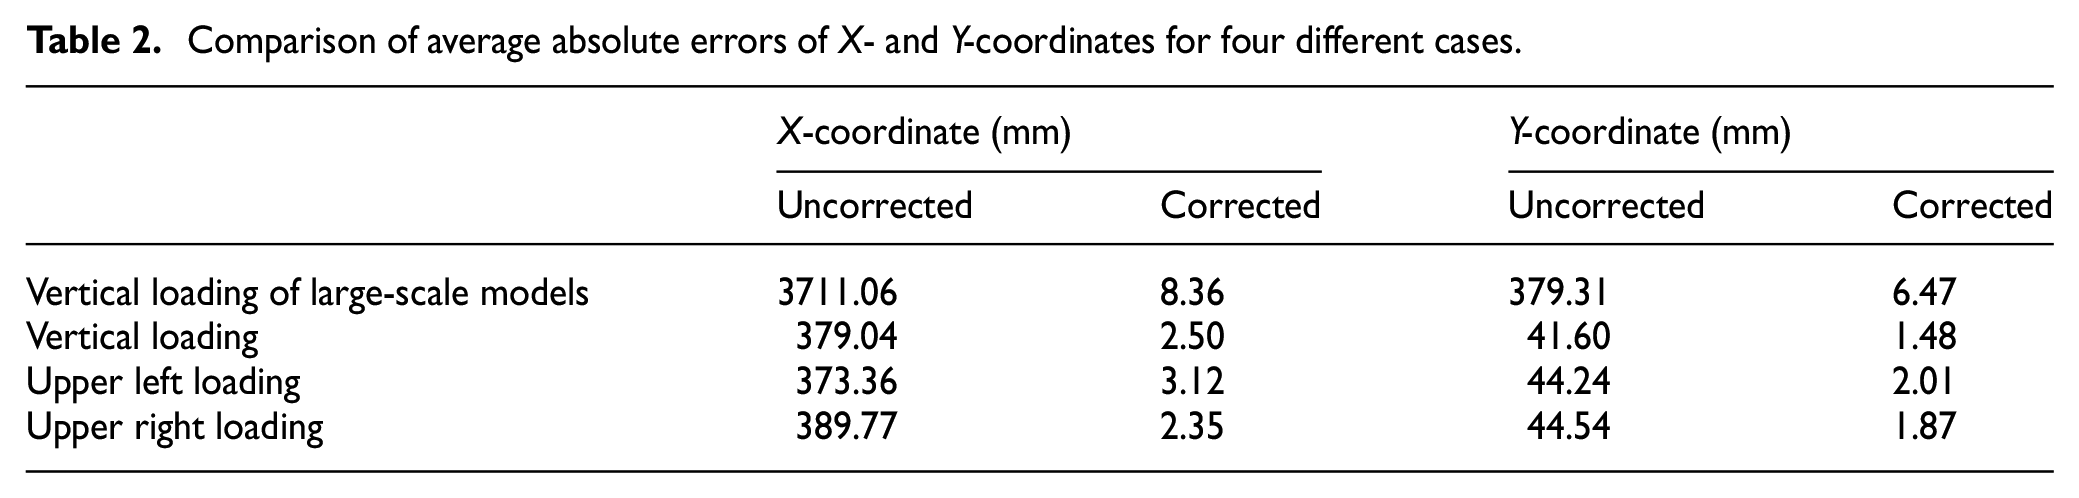
Figures 6–9 show the simulated loading tests on the ring-shaped sensor belt under different loading conditions. In the left images, the green arrows indicate the fixed constraints applied to the bottom side of the ring model to prevent displacement, whereas the yellow arrows at various positions on the top of the model represent the loading applied to simulate the circumferential bending deformation that the smart fiber optic sensor belt may undergo. The images on the right show a comparison of the reconstructed deformation fields of the ring-shaped sensor belt under different loading conditions, including the deformation fields before and after correction and the actual deformation coordinate points. Table 2 presents a comparison of the average absolute errors of the X- and Y-coordinates of the measurement points before and after the correction for the four loading tests. The large-scale model achieved a deformation-reconstruction accuracy close to that of the small-scale model after correction, indicating a similar correction pattern between the two scales. The above correction method significantly reduced the deformation errors of the ring-shaped sensor belt simulation models of different scales, verifying the feasibility of the cumulative error correction method based on key-point tilt information for circumferential deformation.
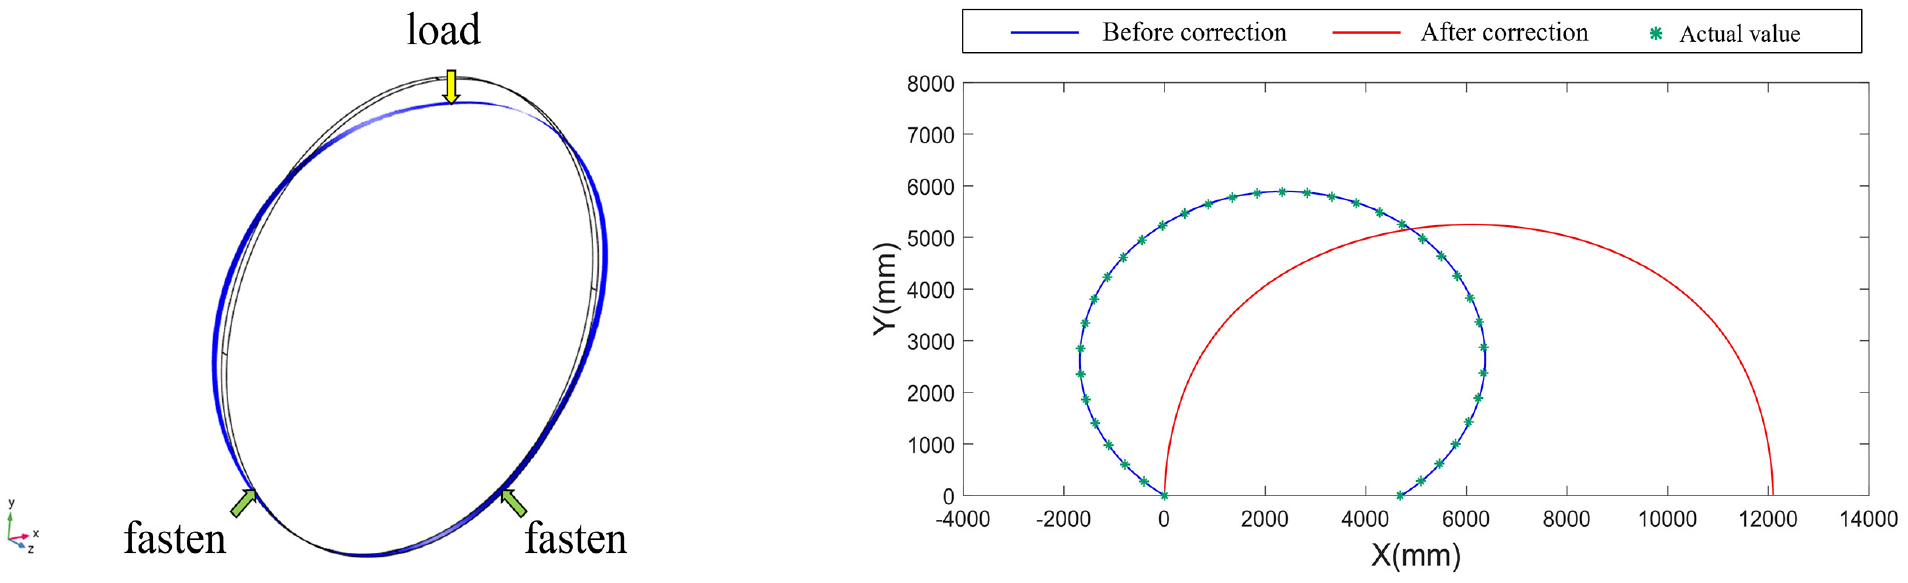
Large-scale model vertical loading test: (a) simulation model loading and (b) reconstruction result.
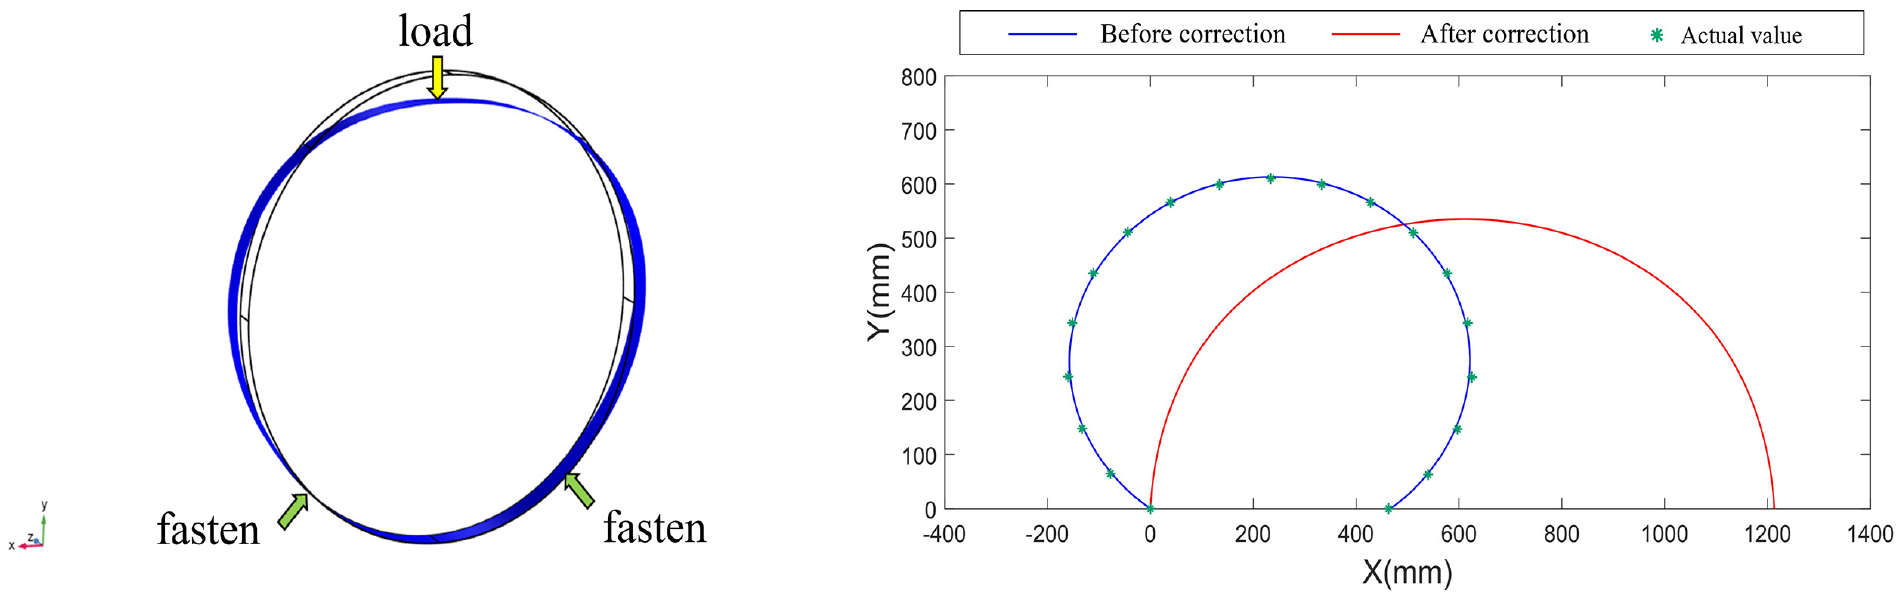
Vertical loading test: (a) simulation model loading (b) reconstruction result.
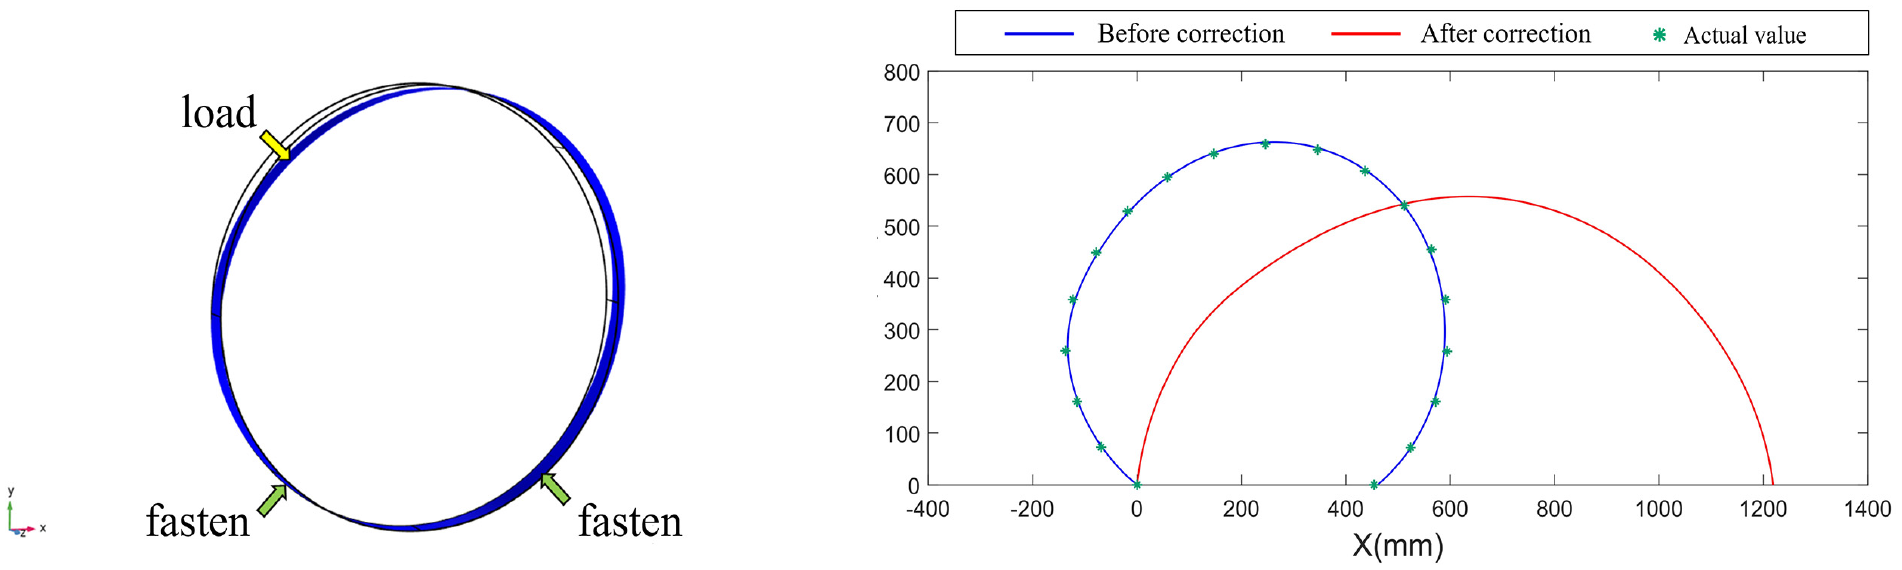
Upper left loading test: (a) simulation model loading (b) reconstruction result.
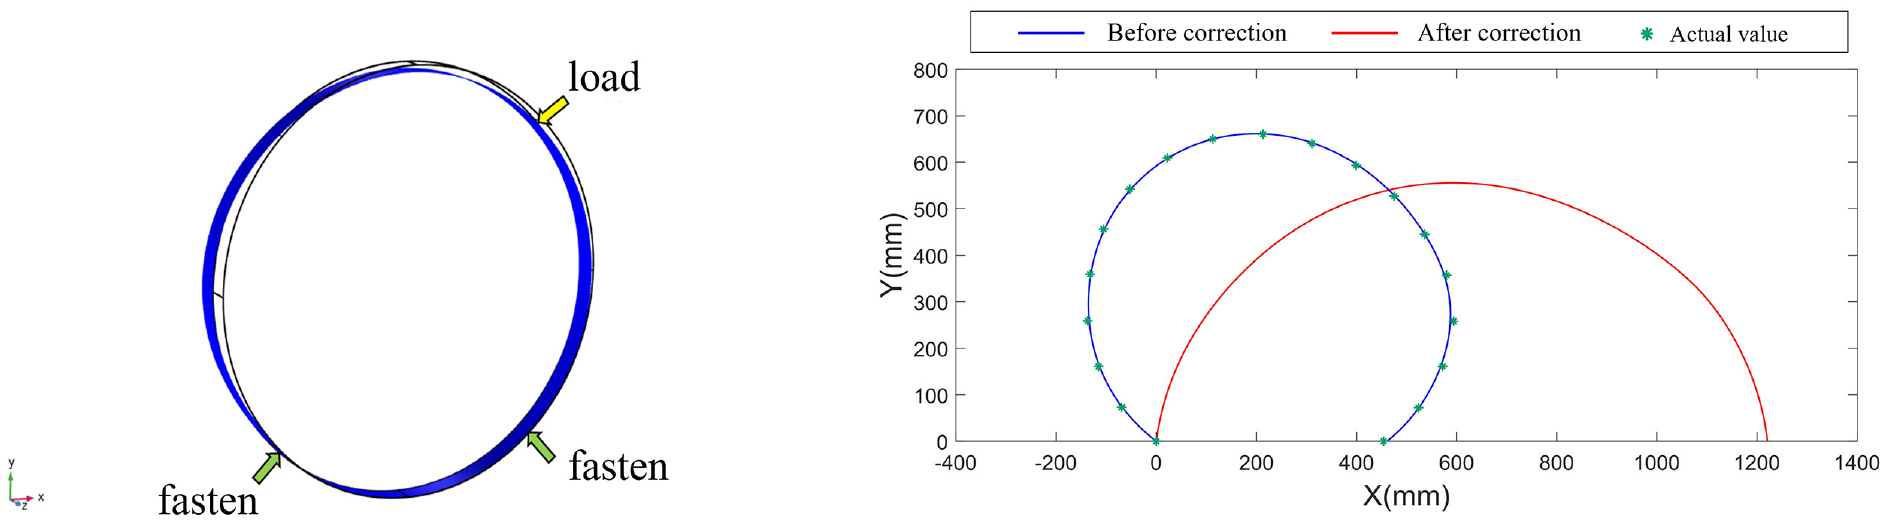
Upper right loading test: (a) simulation model loading (b) reconstruction result.
Comparison of average absolute errors of X- and Y-coordinates for four different cases.
Laboratory verification
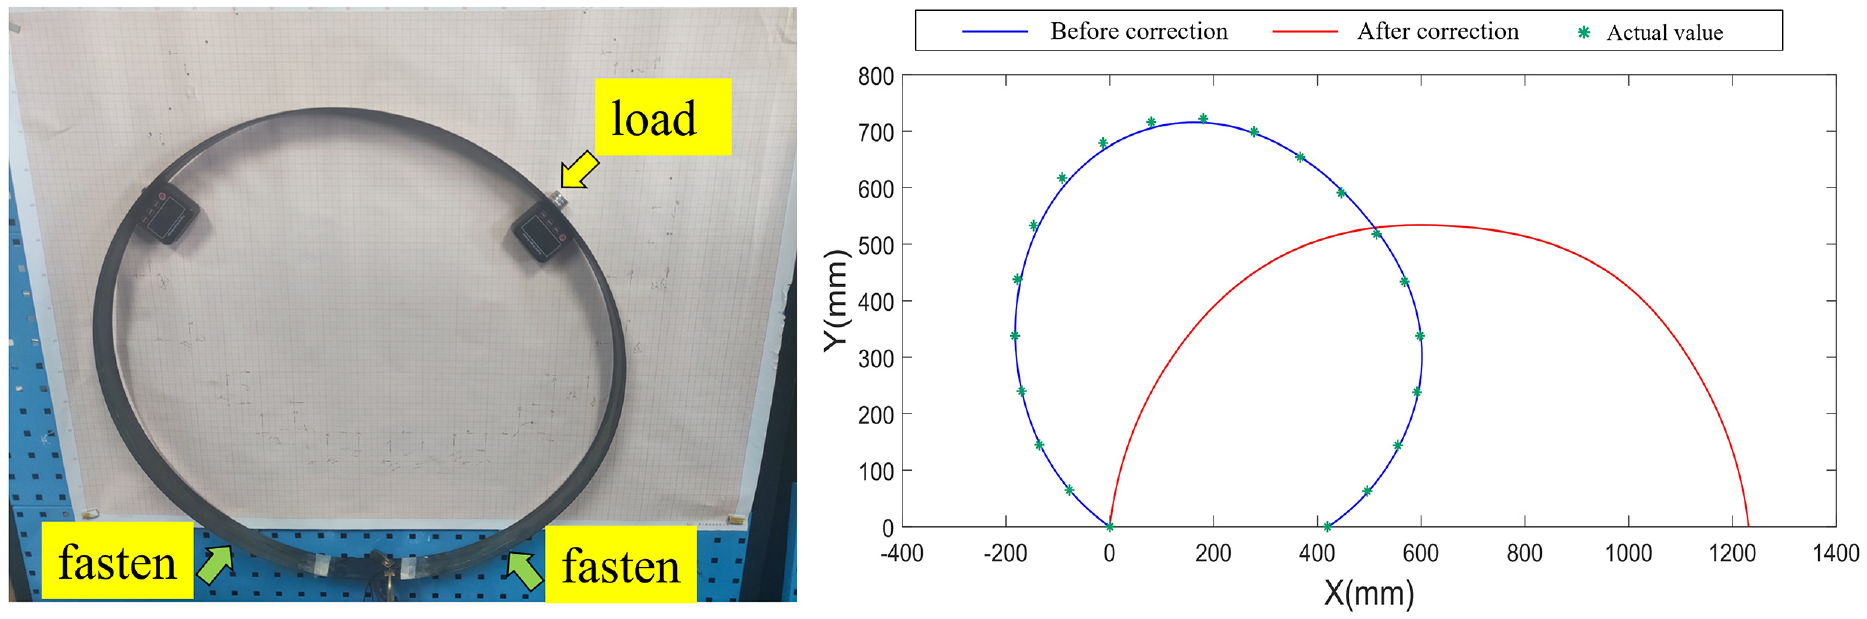
On the basis of the aforementioned simulation experiments, a circumferential deformation loading verification test was performed on a carbon smart fiber optic sensor belt manufactured in the laboratory. As shown in Figure 10, the manufactured smart fiber optic sensor belt was connected end-to-end and fixed using pins on the ring plate to simulate a circumferential monitoring scenario. Different loading conditions were tested. Two tilt sensors were placed above the ring sensor belt to measure the tilt angles. The tilt sensor had a measurement range of 0°–90°, a measurement resolution of 0.05°, and an error of ±0.1°. The yellow curve in the figure represents the sensing range of the strain-sensing optical cable, with a sensing length of 2000 mm. Strain measurement points are set at 10 mm intervals to collect strain data, resulting in a total of 200 strain measurement points. The displacement coordinates of the sensor belt were measured using coordinate paper. The displacement measurement points were set at intervals of 100 mm along the sensing range, for a total of 20 points. One end of the sensor belt was connected to the demodulator, which retrieved the strain data of the sensing points; these data were then transmitted to the computer via a network cable.
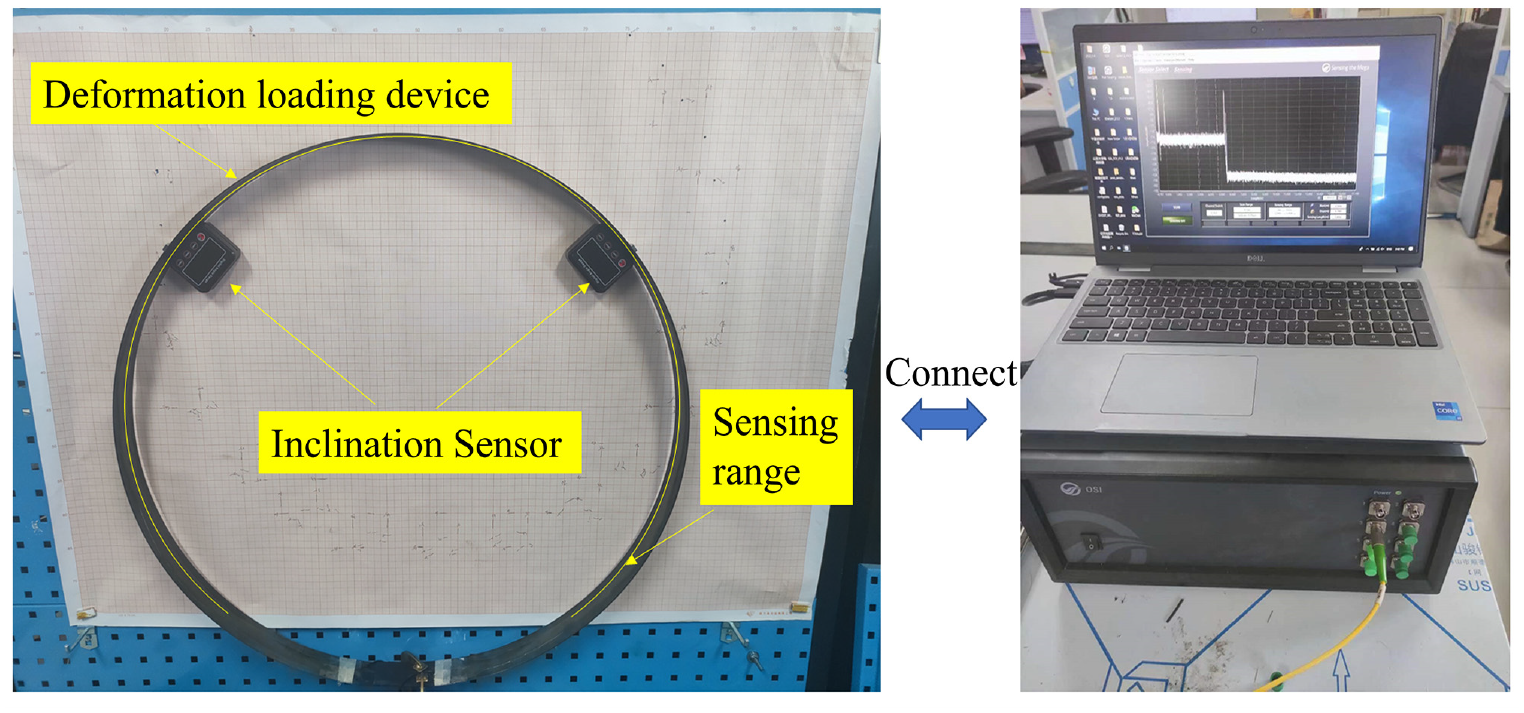
Schematic diagram of the test setup system.
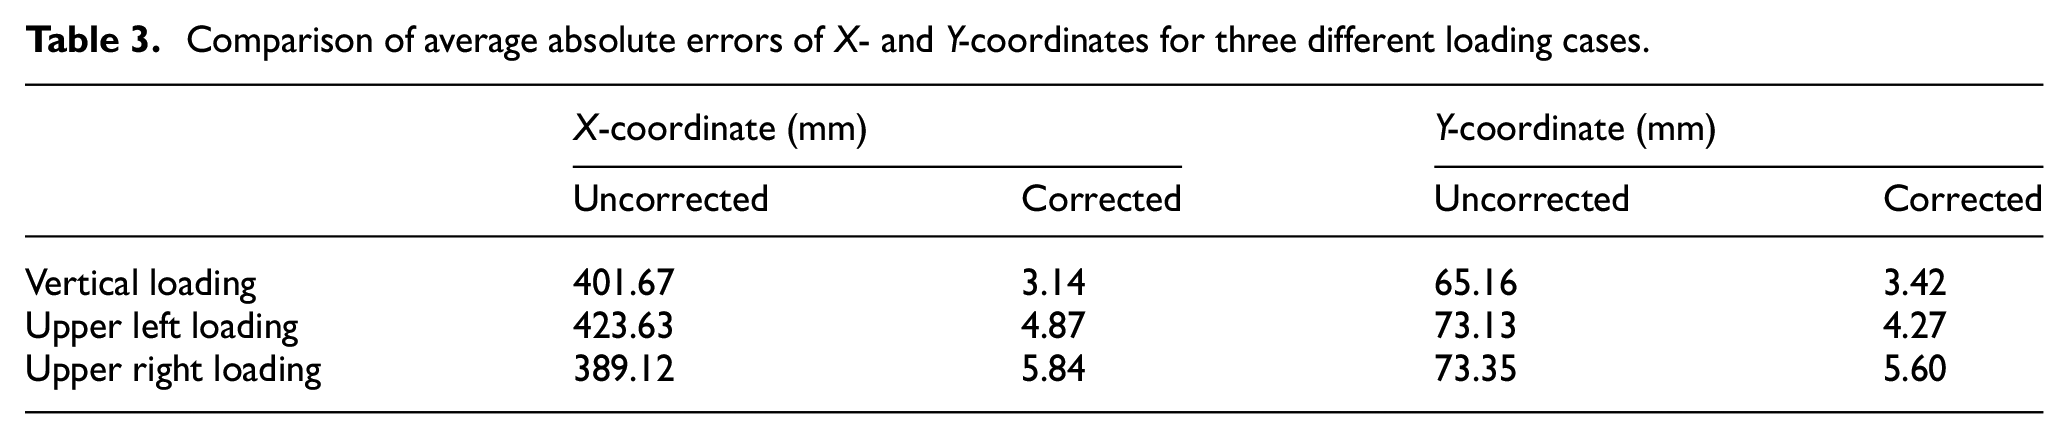
In the left-hand images in Figures 11–13, loading tests were conducted on circumferential deformations that the smart fiber optic sensor belt may undergo in engineering applications. As indicated by the green arrows in the figures, the lower ends of the sensor belt were fixed to the ring plate using pins to prevent vertical displacement. The yellow arrows in the figures represent the loading applied at different positions on top of the sensor belt using magnets on the ring plate to simulate possible circumferential deformations of the smart fiber optic sensor belt. The images on the right show a comparison between the reconstructed and actual deformation fields of the smart fiber optic sensor belt before and after correction under different loading conditions. Table 3 presents a comparison of the average absolute errors in the X- and Y-coordinates of the measurement points before and after correction under three different loading conditions. After correction, there were significant reductions in the average errors for both the X- and Y-coordinates, indicating that the method based on key-point tilt angle information for in situ correction of circumferential deformation accumulation errors has a good correction ability for reconstructing the circumferential deformation of the sensor belt.
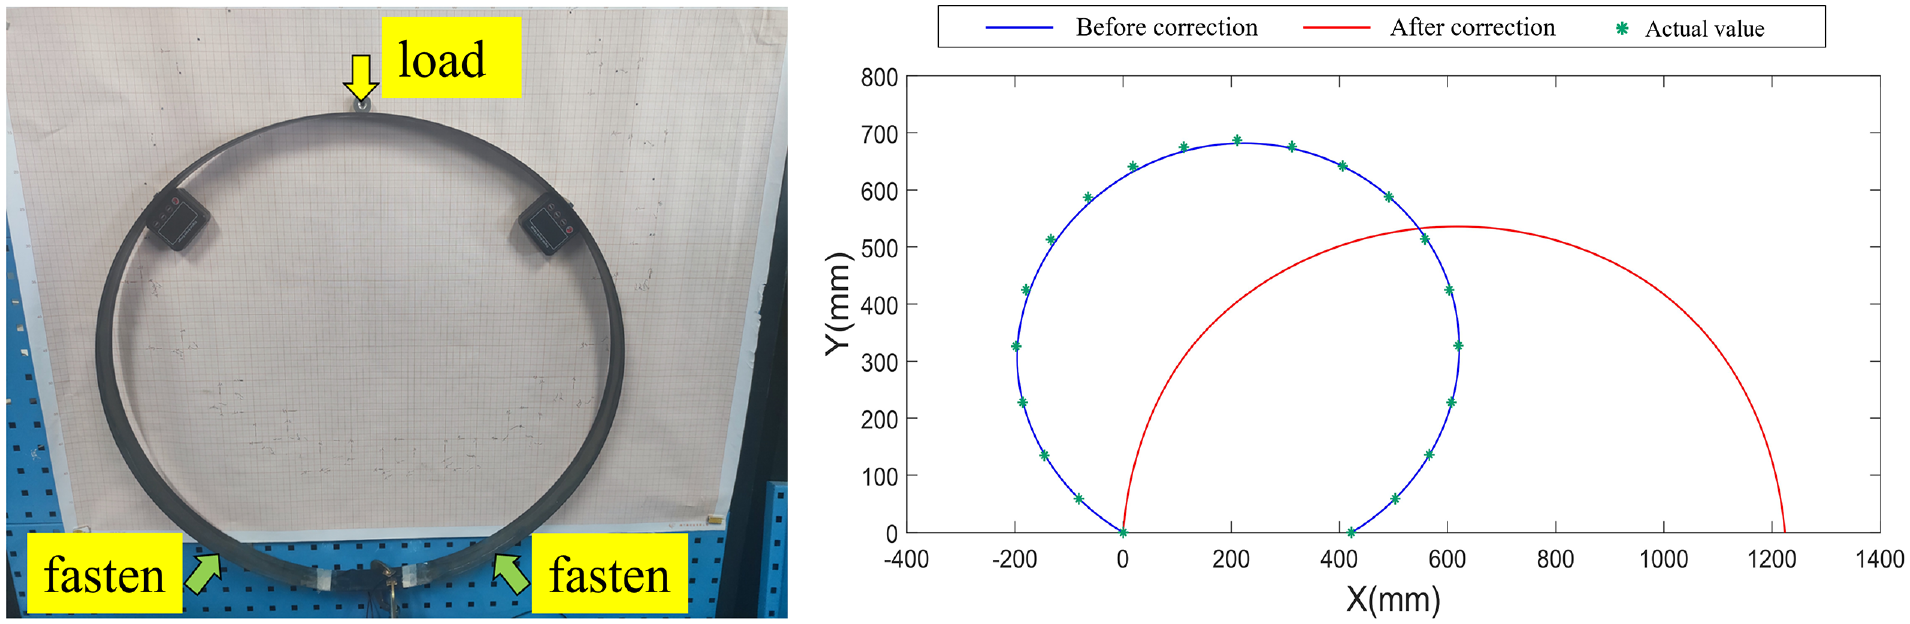
Vertical loading test: (a) actual loading and (b) reconstruction result.
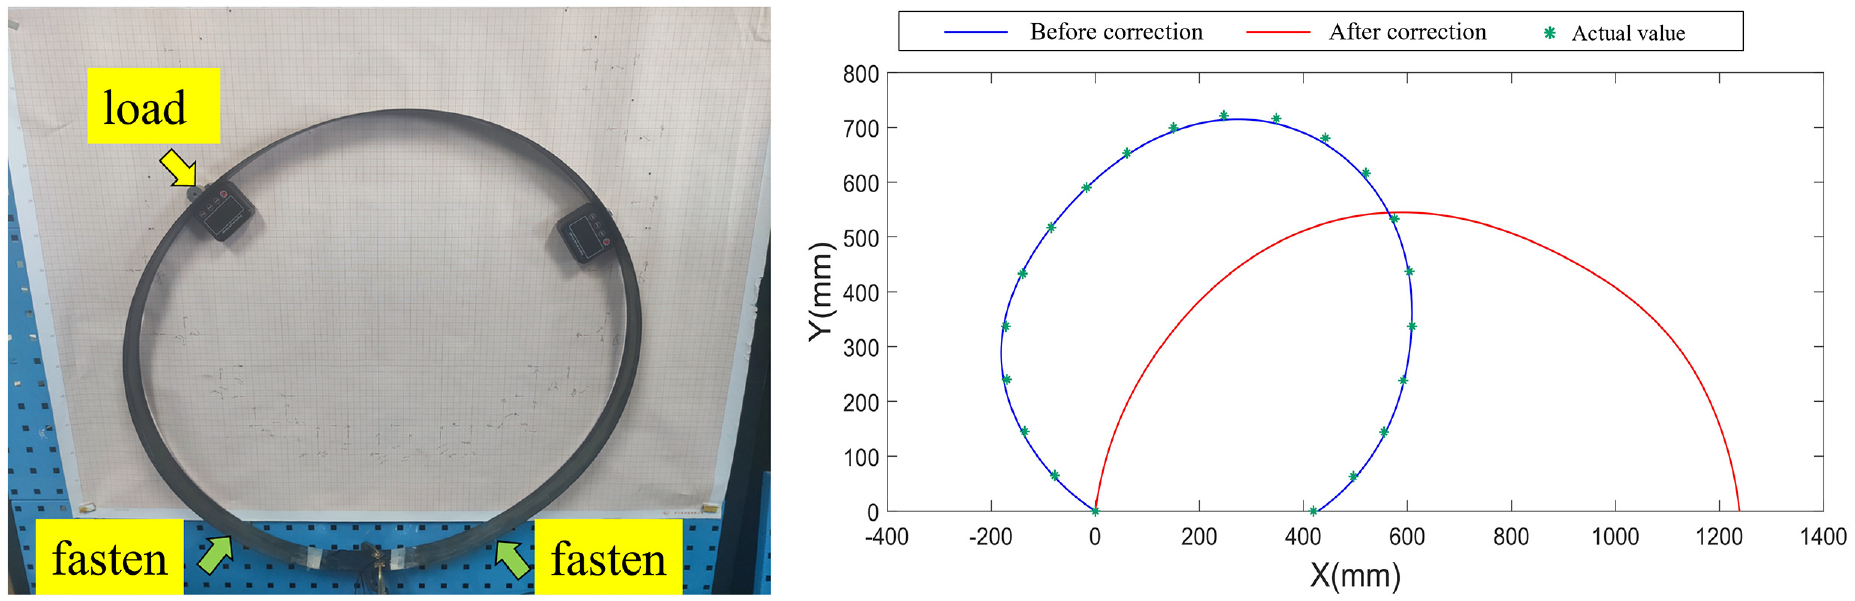
Upper left loading test: (a) actual loading and (b) reconstruction result.
Upper right loading test: (a) actual loading and (b) reconstruction result.
Comparison of average absolute errors of X- and Y-coordinates for three different loading cases.
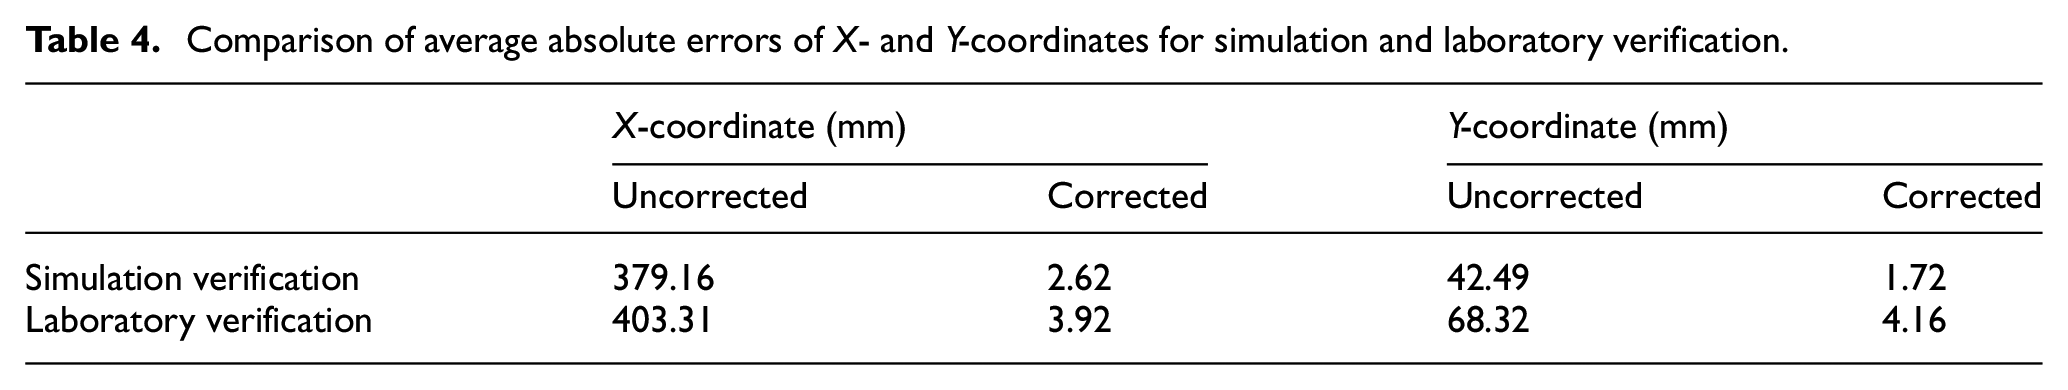
By averaging the errors under different loading conditions in both simulation experiments and laboratory experiments, as shown in Table 4, a comparison of the simulation results with the laboratory results can be made. It can be observed that in the simulation experiments, the corrected X and Y coordinates are 2.62 and 1.72 mm, respectively. In the laboratory experiments, the corrected X and Y coordinates are 3.92 and 4.16 mm, respectively.
Comparison of average absolute errors of X- and Y-coordinates for simulation and laboratory verification.
Discussion
By observing the error comparison between the simulation experiment and laboratory verification in the previous section, it can be seen that the commonality between the two is that the errors are significantly reduced compared to the uncorrected values. The difference is that due to system errors (e.g. strain transmission loss during fiber optic bonding) or human operational errors in the laboratory experiments, the errors in the laboratory results are slightly larger than those in the simulation results.
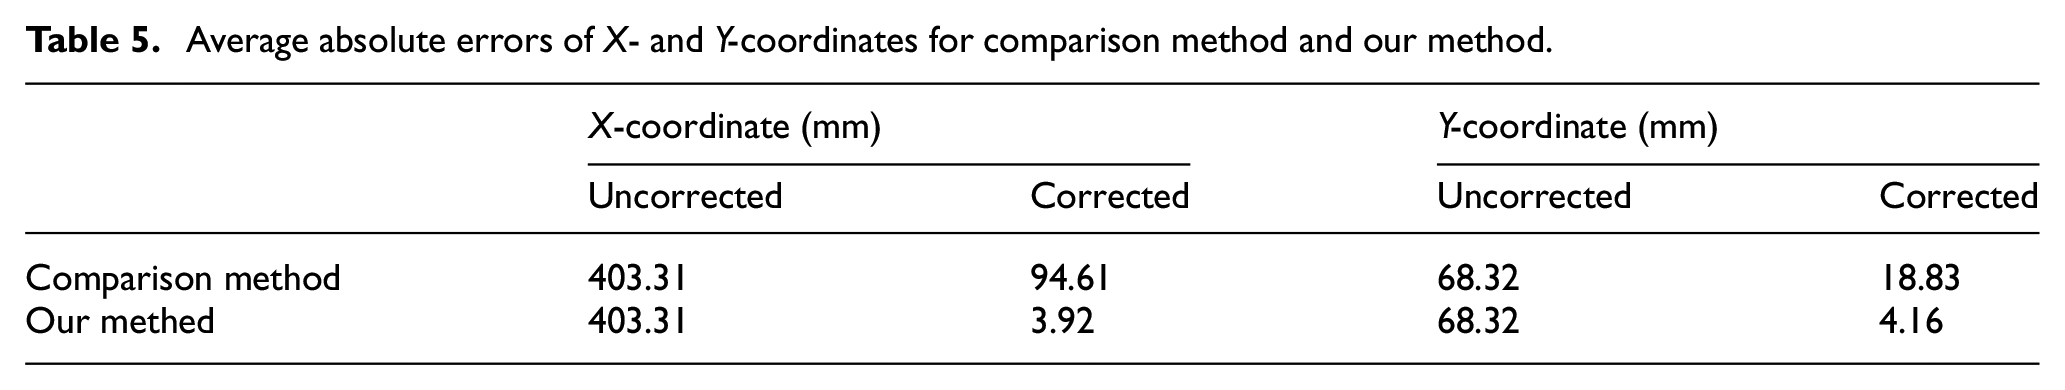
To further verify the effectiveness of the proposed method, a representative method using a displacement sensor for cumulative error correction was selected for comparison. The reconstruction comparison results are shown in Table 5. It can be seen that the proposed method achieves higher reconstruction accuracy. Moreover, installing a displacement sensor requires drilling holes in the measured substrate, which is time-consuming and labor-intensive. In contrast, the angle sensor in this study only needs to be attached to the sensing belt, making the installation simple and non-destructive, without damaging the original structure of the measured substrate.
Average absolute errors of X- and Y-coordinates for comparison method and our method.
However, this study only conducted simulation analysis and experimental verification on specific circumferential deformation modes. The limit of detection is 0.003 mm. The dynamic range is within ±10 cm in the vertical direction and within ±7 cm in the horizontal direction. For other shapes or application scenes beyond this range, the correction effect may deteriorate, and adaptability is limited. In the future, the sensor structure will be upgraded and the correction algorithm will be optimized and updated to adapt to more complex and variable monitoring scenes, targeting a wider range of deformation models and application scenes.
Conclusion
The objective of this study was to accurately monitor circumferential contour deformation. High-strength and high-flexibility carbon-fiber composite substrates were coupled with strain-sensing optical fibers to construct a smart fiber optic sensor belt-monitoring system. To address the complex variations in circumferential deformation in the horizontal and vertical directions, we developed an onsite correction method for the cumulative error in circumferential deformation based on key-point inclination information. High-precision inclinometers installed on the smart fiber optic sensor belt gather inclination information at key points. Using these data as a reference, the particle swarm optimization algorithm is applied to correct the reconstructed circumferential deformation field of the sensor belt, reducing the cumulative errors. Validation through simulations and indoor experiments indicated that before correction, the average errors for the horizontal and vertical coordinates in small-scale simulations and indoor tests were 210.83 and 235.82 mm, respectively. After correction, they were reduced to 2.17 and 4.04 mm, respectively. The experimental results indicate that this method can accurately reconstruct circumferential deformations and has broad application prospects.
Footnotes
Appendix
Comparison of abbreviations appearing in the paper.
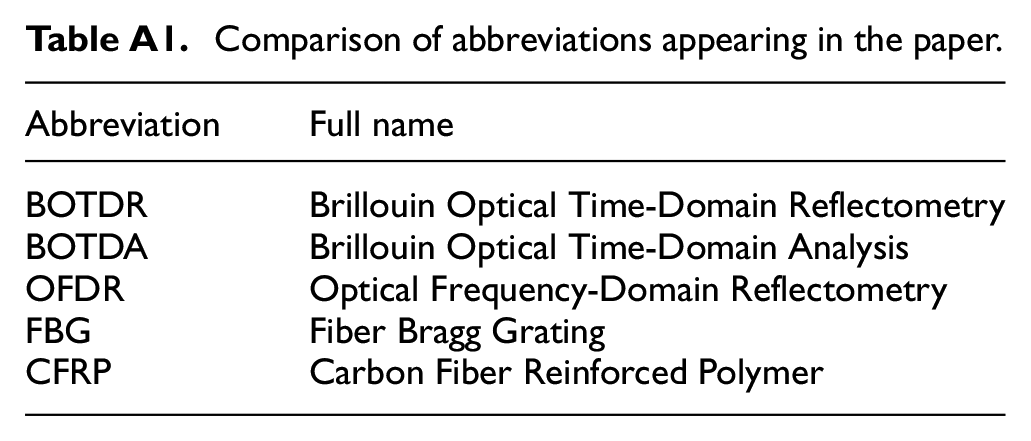
| Abbreviation | Full name |
|---|---|
| BOTDR | Brillouin Optical Time-Domain Reflectometry |
| BOTDA | Brillouin Optical Time-Domain Analysis |
| OFDR | Optical Frequency-Domain Reflectometry |
| FBG | Fiber Bragg Grating |
| CFRP | Carbon Fiber Reinforced Polymer |
Declaration of conflicting interests
The author(s) declared no potential conflicts of interest with respect to the research, authorship, and/or publication of this article.
Funding
The author(s) disclosed receipt of the following financial support for the research, authorship, and/or publication of this article: This work was supported in part by the Natural Science Foundation of Guangdong Province under grant number 2021A1515011782, in part by the Youth Innovation Team Program of Shandong Higher Education Institution under grant number 2022KJ008, and in part by the Shandong Province Science and Technology Innovation Capacity Enhancement Project for Small and Medium-sized Enterprises under grant number 2023TSGC0116.
Data availability statement
Data sharing not applicable to this article as no datasets were generated or analyzed during the current study.