
Abstract
This paper introduces a method to quickly and accurately identify the sound quality of automatic transmission in a vehicle by testing the objective vibration parameters on automatic transmission EOL (end of line) test bench. In this study, 50 automatic transmissions serve as the research object, and the vibration parameters of each gear of the transmission are measured on the EOL bench. Then, the transmission is mounted on a vehicle, the vibration parameters and acoustic parameters of corresponding working conditions are measured, and the subjective evaluation of the noise quality of the vehicle is carried out by using a grade scoring method. After this data is collected, the specific vibration parameters and acoustic parameters that are the dominant factors of sound quality are determined by correlation analysis. Based on the multiple linear regression method, the following mathematical models are formulated: the vibration parameters and the subjective evaluation of a vehicle, and the acoustic parameters and the subjective evaluation of a vehicle. Among these models, the mathematical models of the vibration parameters and the subjective evaluation of a vehicle were verified to be more accurate. The consistency between the vibration value in a vehicle and the vibration value on EOL test bench is analyzed and the EOL vibration value is determined to be the most objective evaluation of the data. After batch testing of 100 sets, the effectiveness of this model is within 95%. Finally, the value of critical amplitude of the condition of each gear of transmission is analyzed to form the judgment standard of transmission EOL vibration to ensure better sound quality for the vehicle.
Introduction
With the steady growth in customer requirements for automobile sound quality and the increase of laws and regulations on noise limits, the sound quality of automatic transmission is gaining more and more attention. For this reason, there is an increase in the urgency of noise control. Automobile transmission noise is a kind of high frequency sound, with a frequency range of about 300–3000 Hz. Gear whine can be considered to be a major noise contributor. The human ear is more sensitive to tonal noises and can pick out the gear whine from all the other noises. 1 After the automatic transmission is manufactured and assembled, it should be tested on the assembly line. Then, the qualified transmission is installed on a vehicle. However, the transmission is required to have satisfactory sound quality when installed on the vehicle. Therefore, it is particularly important to identify the vibration and noise quality of automatic transmission before loading. The current technology for noise recognition is used to measure the gear meshing vibration characteristics of transmission on the EOL bench to investigate sound quality. 2 Compared with the traditional subjective detection method based on the human ear, this is a more advanced and reliable method. The difficulty of this method is in the selection of vibration parameters and how to determine the critical value of vibration to ensure the high correlation between the objective vibration parameters of EOL testing and the subjective evaluation of vehicle noise.
The research of sound quality is gradually becoming a major research direction of modern automobile NVH (Noise, Vibration, and Harshness). At this time, a great deal of research has already been conducted on the correlation between transmission Noise and Vibration testing. Ding et al. 3 conducted vibration tests on gearboxes and summarized the time-frequency domain characteristics of vibration signals, laying a sturdy foundation for the development of down-line testing and a diagnostic system for gearboxes. Shi et al. 4 extracted fault feature vectors through vibration signals, identified fault types, and designed an EOL fault diagnosis system. Shi et al. 5 selected transmission noise as the research object, collected extensive transmission noise samples, combined this data with the subjective evaluation results, and established a sound quality prediction model. This study showed that transmission noise is affected by SPL, loudness and other parameters. Guo et al. 6 carried out subjective evaluation of the sound quality of automobile drivelines and established an objective evaluation model of sound quality that is consistent with subjective evaluation. Pietila and Lim 7 used nested artificial neural networks to directly learn pairing preferences, and the results showed that this method can eliminate the need for comprehensive listening tests and has good accuracy for nonlinear preferences. Kim et al. 8 studied the objective evaluation of sound quality in passenger cars during acceleration, and proposed that the roar and rumble were the main sound characteristics and correlated with loudness, sharpness and roughness. Finally, based on the subjective evaluation results, the objective evaluation of sound quality was achieved by using the artificial neural network method. This provides a feasible framework and method to establish the relation between the subjective and objective evaluation of sound quality. Wang et al. 9 used the neural network model based on wavelet theory to predict the quality of interior noise. The results show that this method can effectively predict the sound quality of both steady-state noise and unsteady noise, which verifies that the neural network is an effective method suitable for analyzing and solving nonlinear mapping problems. Zeng and Sun 10 used GA-BP neural network to study automotive exhaust noise, and regularized non-stationary regression (RNR) was used to calculate WVD as the input of the network. The results showed that this method could effectively reflect the sound quality under accelerating conditions. Based on correlation analysis and linear multiple regression analysis, Lu et al. 11 determined 13 objective metrics that have a strong positive correlation with the 5 subjective characteristics through regression analysis and verification. Xu et al. 12 adopted intelligent genetic algorithm (GA) and particle swarm optimization (PSO) to optimize and analyze the sound quality prediction model, and tested to verify the accuracy of the model. Wang et al. 13 analyzed the correlation between the vibration of the EOL bench and the noise and vibration of the meshing order of gears of each gearbox on the whole vehicle. This analysis provided the basis for identifying the optimal measurement position on the bench and the value of the critical amplitude of acceptable noise. Xing et al. 14 studied a detecting method for “weak” friction-induced vibration based on cross-correlation analysis between vibration and sound signals. Willecke et al. 15 analyzed the evaluating the capability of acoustic characteristic values for accessing the gearbox quality. Zhang et al. 16 studied the numerical investigation to vibro-acoustic responses of HEV transmission with compound planetary gear train.
Although these studies have taken into account the subjective and objective evaluation of sound quality and established corresponding evaluation models, there are three additional aspects of these studies that should be noted.
1) The majority of these vibration and noise studies are exclusively conducted on the bench or on the vehicle. However, to ensure the sound quality on the actual vehicle, it is important to consider how to effectively identify and control the vibration of automatic transmission on the EOL bench.
2) The majority of the vibration data and regression model data that is collected in these studies is based on a small sample size. However, a large amount of validation data is needed to ensure that the objective vibration parameters of EOL testing that are selected have a high correlation with the subjective evaluation of vehicle noise.
3) The majority of these studies have identified and controlled the main parameters that affect transmission noise. However, to ensure satisfactory sound quality after the transmission is installed on the vehicle, effective transmission EOL bench test and judgment standards must be formulated.
In view of these issues, this paper firstly conducted EOL vibration tests for transmission17,18 and subjective evaluation of vehicle acoustic quality, established mathematical models of subjective evaluation and objective evaluation with the multiple linear regression method, verified models with batch transmission loading, and formulated the EOL vibration test standard of transmission EOL.
Objective and subjective evaluation method of sound quality
In the process of subjective evaluation, the evaluation team subjectively scores the vibration and noise of automatic transmission by utilizing a grade scoring method, analyzes the evaluation results with statistical theory, and quantifies the subjective evaluation results. Whereas, objective evaluation is implemented by testing the objective parameters of vibration and noise of automatic transmission to obtain the objective parameter values.
Subjective evaluation method of sound quality
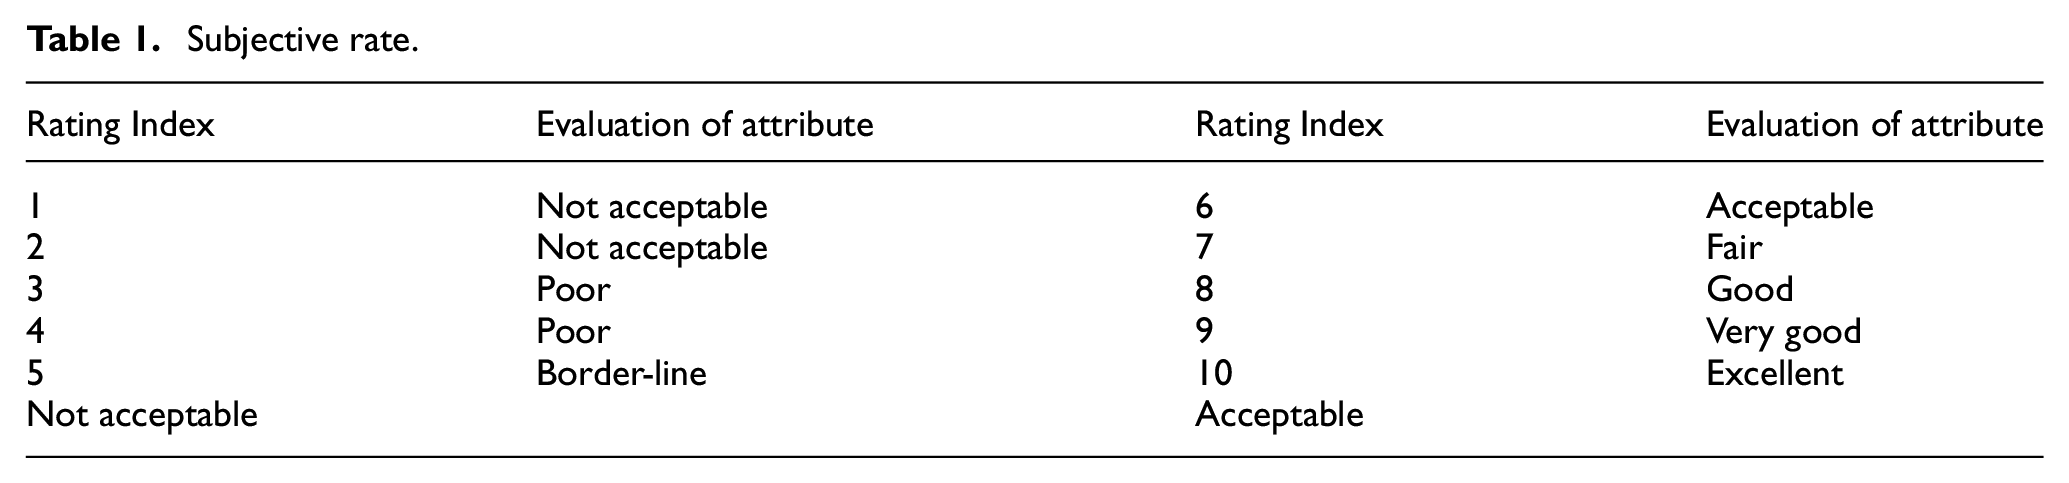
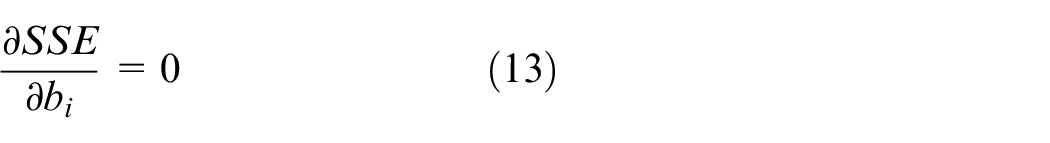
The subjective rate was adopted as the method for the Subjective evaluation of acoustic quality, 19 with “unacceptable – acceptable” as the evaluation index. The subjective rate was divided into 10 grades, and the rating 6 as acceptable standards were stipulated, as shown in Table 1.
Subjective rate.
Objective evaluation method of sound quality
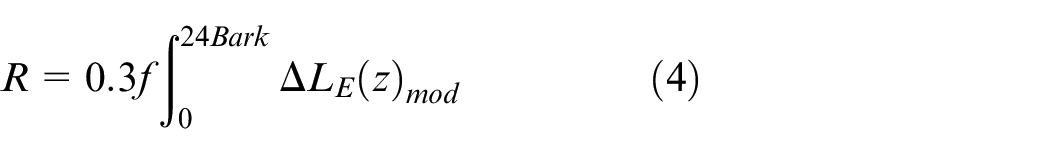
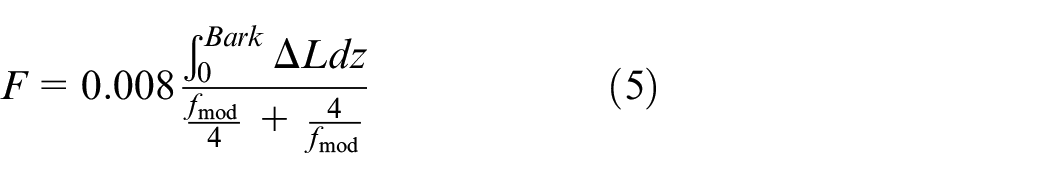
For the objective evaluation of sound quality, vibration parameters and acoustic parameters are firstly selected as the evaluation quantity. Acoustic parameters include A-weighted sound pressure level, sound pressure level difference, loudness, roughness, sharpness, and jitter. 20 Vibration parameters include the vibration value of meshing frequency of each gear pair, the vibration value of 2X frequency of each gear pair, and the vibration value of side frequency of each gear pair. Considering the EOL testing environment in mass production of the automatic variable speed, only vibration tests can be conducted.
Sound pressure level (SPL) is based on the characteristics of the response of the human ear to changes in the intensity of sound, which leads to a pair of values that represent sound intensity. The formula is as follows.
Where,
Loudness is a psychoacoustic parameter based on the masking characteristic of human ear to sound spectrum, which reflects the perception degree of human ear to sound intensity.
Where,
Sharpness reflects the frequency characteristics of a sound. The greater the ratio of the high frequency of a sound, the greater the Sharpness of the sound.
Where, N is the total characteristic loudness.
High frequency variation of sound produces Roughness. When the modulation frequency is greater than 20 Hz, it gradually increases in Roughness, and the corresponding formula is as follows.
The jitter degree is applied to the modulation frequency below 20 Hz. At this frequency range, the human ear can directly perceive the changes of sound level. As a result, the fluctuations of the signal are amplified.
The vibration acceleration level is the logarithm base 10 of the ratio of the vibration acceleration to the reference acceleration multiplied by 20, denoted as VAL.
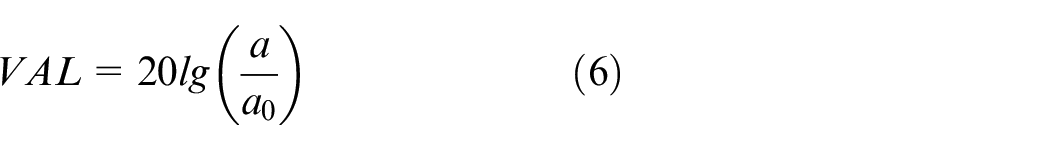
Where, VAL is the vibration acceleration level (
If the driving speed of gear pair is
Where,
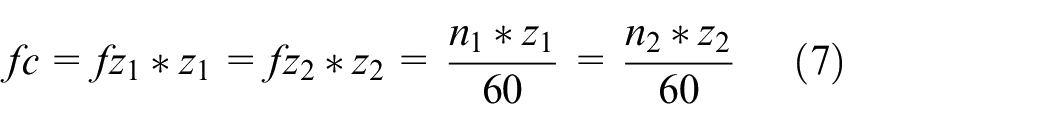
The multiple frequency of vibration refers to the integer multiple of the frequency of vibration equivalent to the corresponding frequency of rotational speed. Here it refers to the 2 *
Gear side frequency is the side band formed on both sides of gear meshing frequency due to the phenomenon of amplitude and frequency modulation in gear vibration signal, and its calculation formula is as following.

Where,
The vibration value of a gear is the vibration acceleration at the meshing frequency, 2X frequency or side frequency of the gear.
Order is also classified as order ratio. When studying rotating parts, the reference axis or input axis rotation frequency is defined as the fundamental frequency (first order), and other frequencies are multiples of the reference axis frequency, this multiple is n times order.
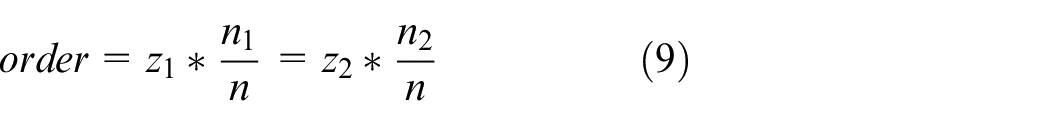
Where,
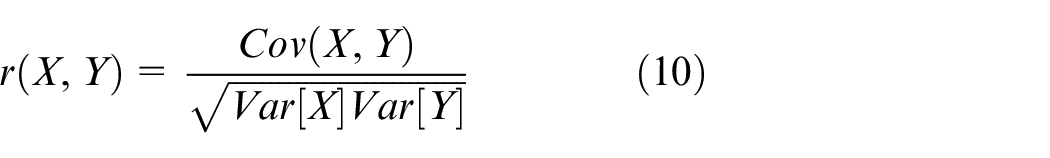
Correlation analysis
Correlation is used to measure the degree of correlation between factors of subjective and objective evaluation.
21
In engineering, the correlation between the two factors is generally required to be greater than 0.8. The correlation calculation
Where,
Multiple linear regression analysis
Regression methods include models such as multiple linear regression, nonlinear analysis neural networks, and vector machines. The multiple linear regression model considers multiple variables, runs quickly when dealing with small batch samples, and has high reliability. Deception attacks on event-triggered distributed consensus estimation for nonlinear systems 22 and neural network regression models converge slowly and have lower computational accuracy when there are fewer samples. The parameter selection of vector machine regression model is sensitive, has a significant impact on computational accuracy, and cannot directly handle multi class problems. Therefore, this article chooses the multiple linear method to establish an analysis model.
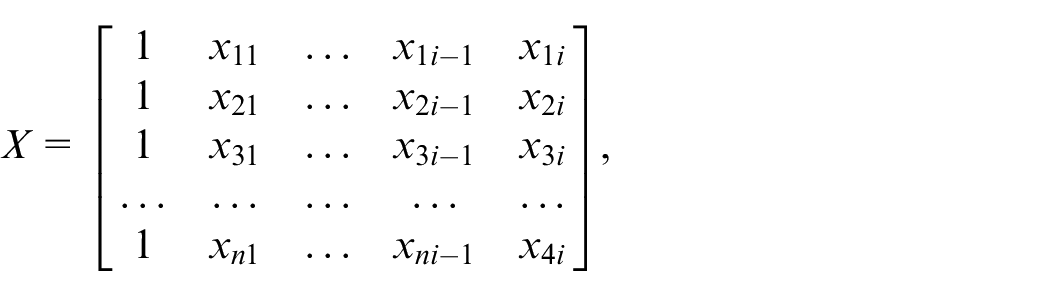
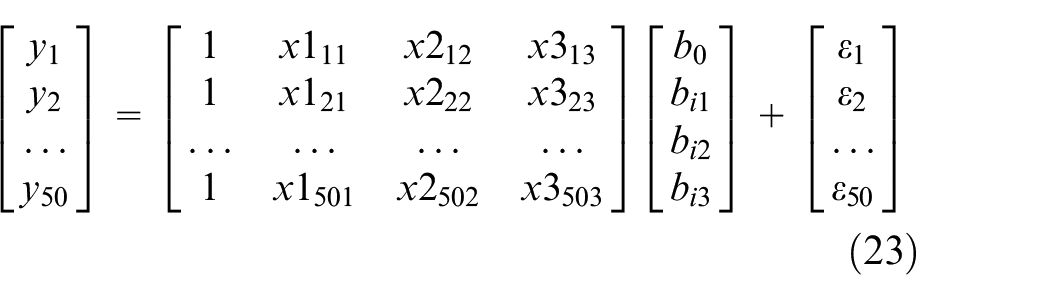
Multiple linear regression uses multiple independent variables (
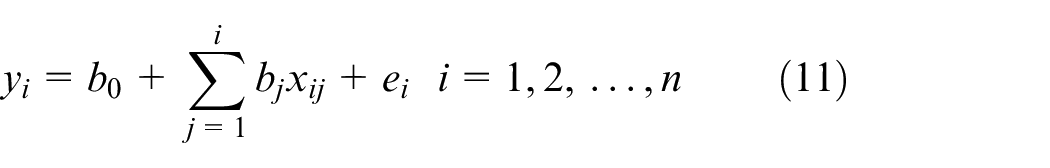
Where,
To solve the regression coefficient, that is, the smallest sum of squares of error,
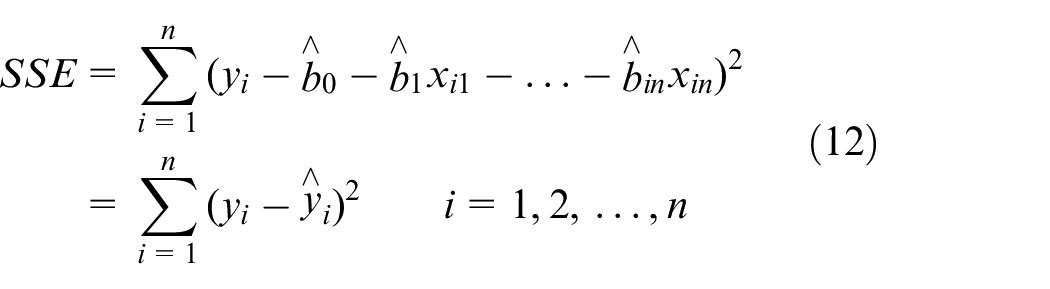
In addition, the partial derivative of
After sorting, the following equations are obtained.


……

If,
Then,

And you obtain that result by changing the form.

In order to verify the validity of the equation, it is necessary to perform the F-test on the equation.
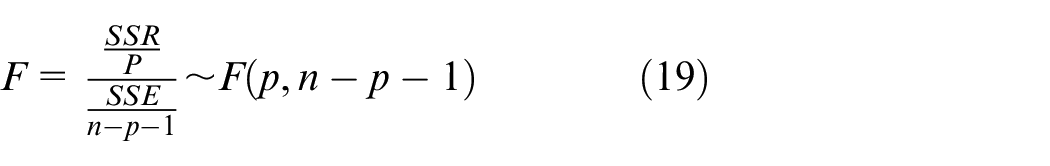
Where,
After verifying the validity of the equation, it is necessary to verify the significance of the coefficients.
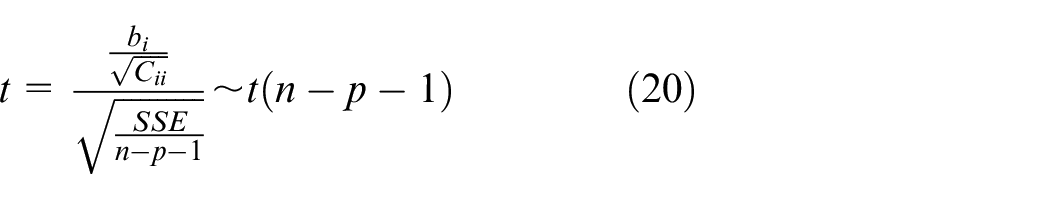
Where,
In order to verify the model fitting degree, the complex correlation coefficients
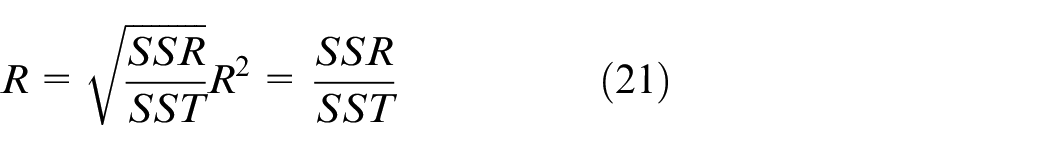
Where,
Theoretical model of subjective and objective evaluation
In this paper, the vibration value of meshing frequency of each gear pair, the vibration value of 2X frequency of each gear pair, and the vibration value of side frequency of each gear pair are taken as independent variables, and 50 transmissions are selected as samples to predict the subjective evaluation score of

Where,
The linear regression equation of 50 sound samples is as follows.
Subjective and objective evaluation test of acoustic quality
The subjective and objective evaluation model of sound quality is used to unify quantitative subjective evaluation results with objective evaluation results by means of a statistical method. This way, the study can predict subjective evaluation results based on objective data, so as to control the vibration and noise of automatic transmission.
Subjective evaluation test of sound quality
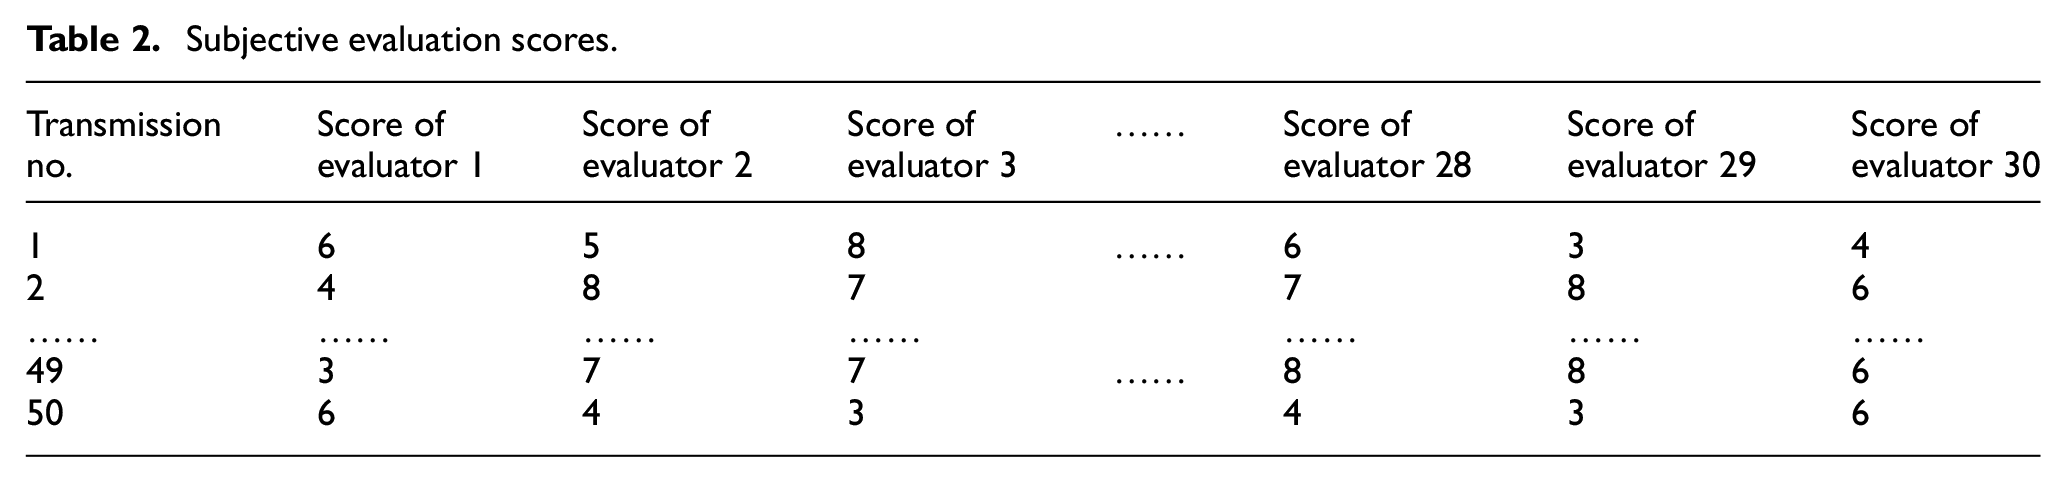
The factors to be considered in the selection of evaluators include the number of evaluators, whether they have relevant acoustic quality evaluation experience, the ratio of male and female evaluators, whether they have driving experience, etc. According to statistics, men with driving experience pay more attention to car noise, and women pay less attention to car noise. However, men who pay more attention to noise have less experience in voice quality evaluation. This paper selects 30 evaluators, including 20 men and 10 women. Of these candidates, 22 evaluators have driving experience, 8 evaluators have no driving experience, 10 evaluators have valuable evaluation experience, and 20 evaluators have priceless evaluation experience.
30 evaluators graded the sound quality of 50 automatic transmissions in turn, and 30 groups of scores were obtained. The specific score statistics of the evaluation test are shown in Table 2.
Subjective evaluation scores.
Correlation analysis was conducted on the results of subjective evaluation tests, and the evaluation results with large differences were removed. The average correlation coefficient of 30 evaluators was calculated, as shown in Figure 1.
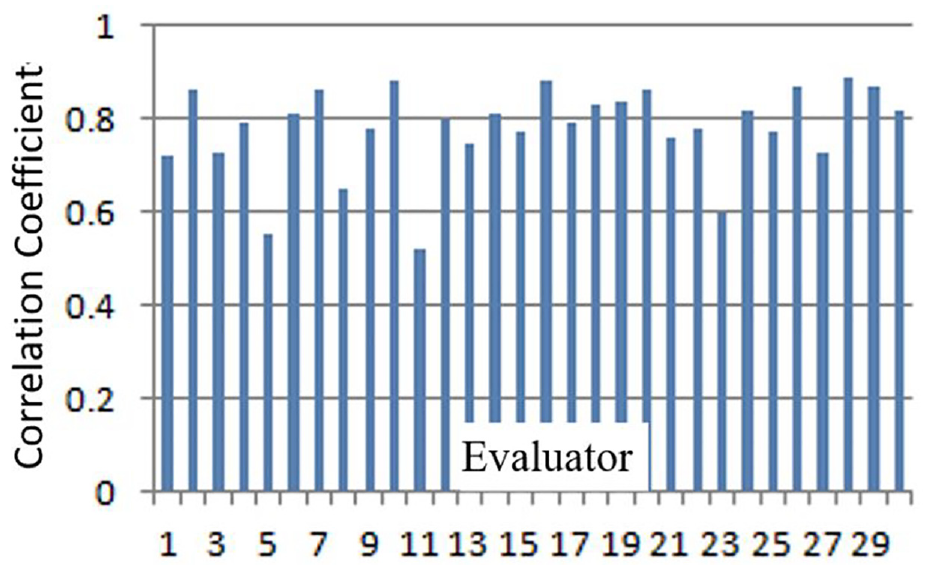
Correlation of evaluation results.
After sorting the scores of 30 evaluators, the average correlation coefficient of evaluators was calculated. After analyzing the data, it is concluded that the evaluation results of the fifth, eighth, eleventh and twenty-third evaluators have poor correlation with other evaluators, indicating that the scoring error of the four evaluators is significant and thus not suitable for analysis. Therefore, these sets of data should be removed.
Objective evaluation test
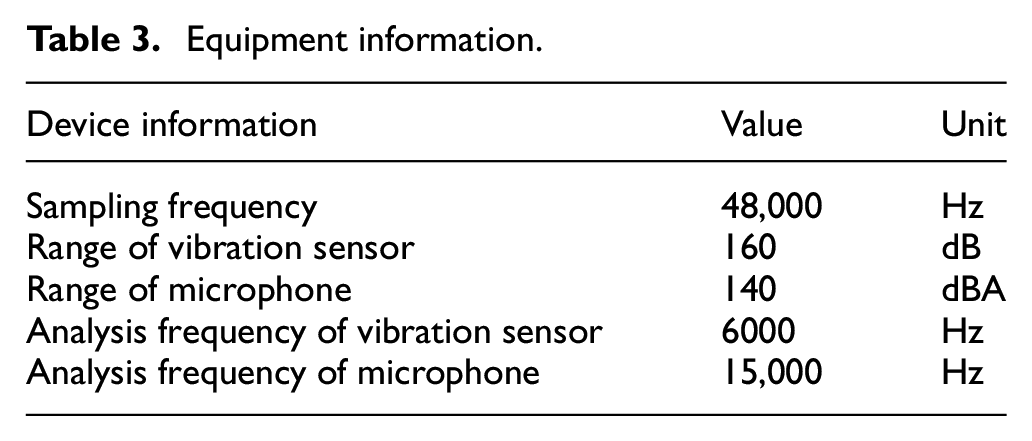
Objective evaluation of the transmission will be carried out on the EOL vibration test bench and the vehicle respectively. Due to the noisy environment in the factory, acoustic measurement is not possible. The vibration value of gears is mainly tested on EOL bench, and the vibration and noise are tested in the vehicle environment. Test equipment information is shown in Table 3.
Equipment information.
Vehicle noise testing
The test condition of the vehicle was TU representing the speed up condition, in which the throttle was opened 10%−20%, and the input shaft speed was 1000–2000 rpm. TD represents coasting condition, in which the throttle is opened 0%, and the input shaft speed is 2000–1000 rpm. Vibration and noise signals in this working condition were collected for subsequent analysis and calculation, and the test is shown in Figure 2 below.
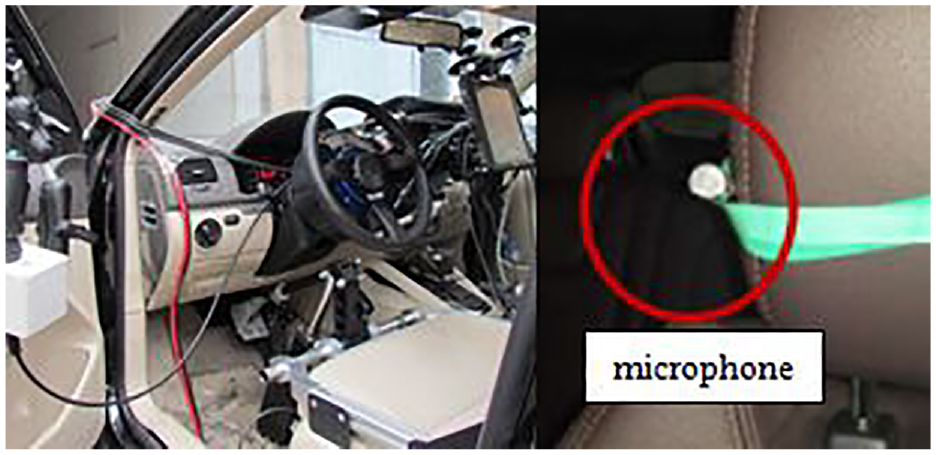
Location of microphone: next to driver’s right ear.
EOL bench vibration test
The condition of the EOL bench test is consistent with the vehicle test condition. Similarly, TU represents speed up condition, in which the input torque is 60 Nm, and input speed is 1000–2000 rpm. TD represents the input torque of coasting condition at 20 Nm and the input speed is 2000–1000 rpm. During the EOL bench test, sensor positions must meet two factors of convenience for testing and accuracy of data. Sensor positions in this paper are shown in Figures 3 and 4. The gear vibration acceleration levels were calculated from the objective data of 50 transmissions by the vibration analysis system. The vibration data is shown in Table 4.
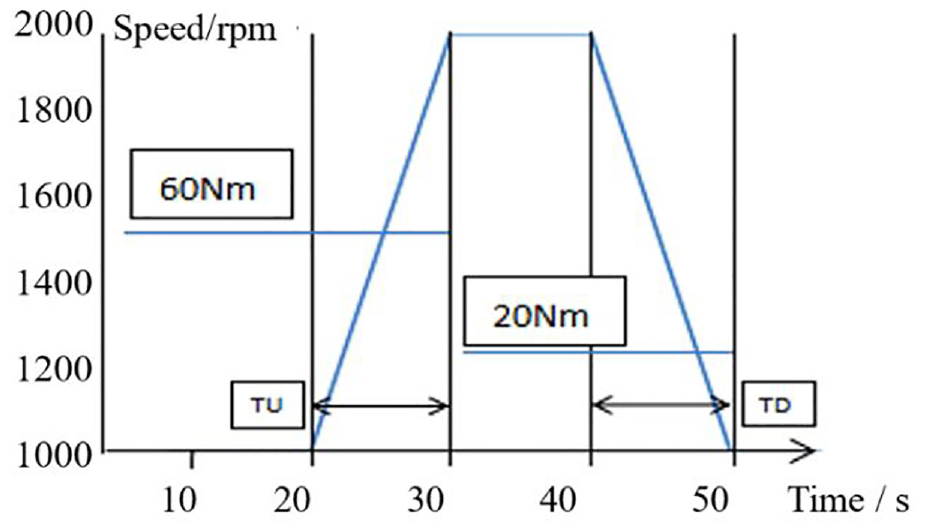
Schematic diagram of EOL bench test conditions.
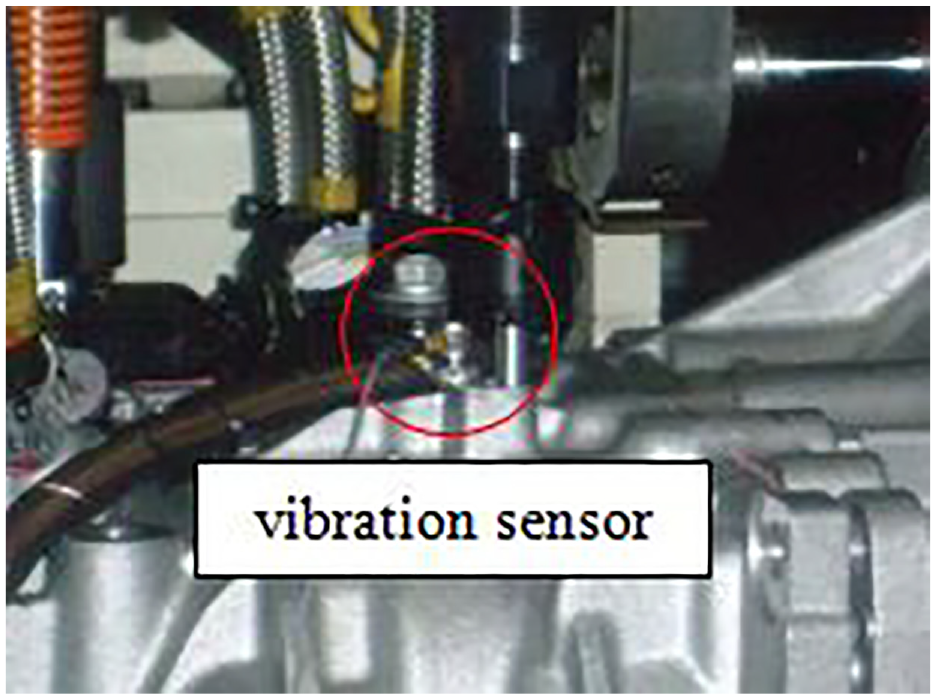
Location of vibration sensor.
Objective evaluation data.
Correlation of subjective and objective evaluation
After tested on the EOL bench, 50 transmissions were loaded in turn for noise testing and subjective evaluation. According to the acoustic data, sound pressure level, sound pressure level difference, loudness, sharpness, jitter, and roughness were calculated. The subjective and objective evaluation data of 50 automatic transmissions on the whole vehicle is shown in Table 4.
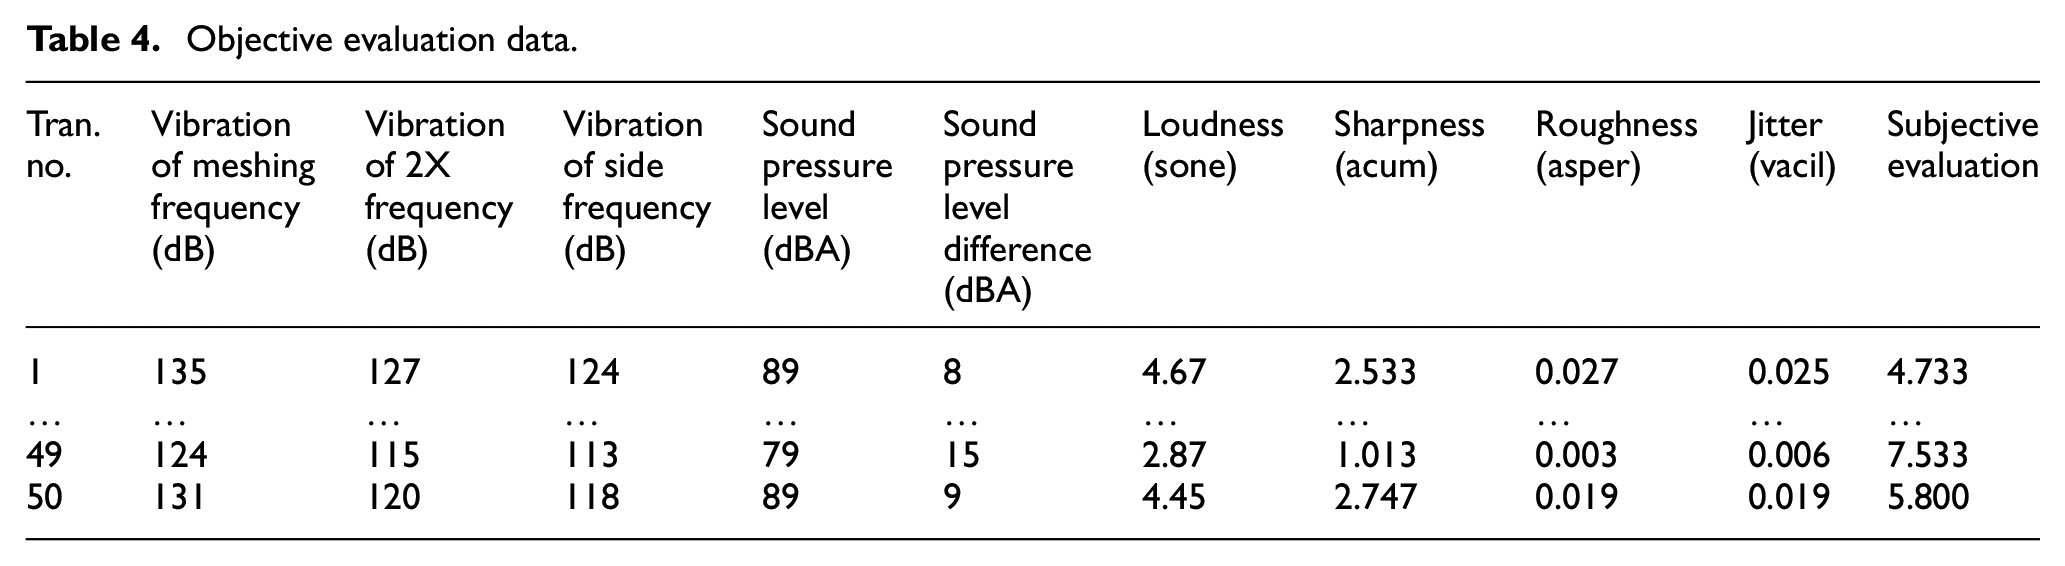
Further analysis of the data in the above table shows the relationship between EOL vibration parameters and subjective evaluation, as shown in Figure 5.
Relationship between EOL vibration and subjective evaluation.
As shown in the figure above, the corresponding subjective evaluation score is reduced due to the increase of the vibration value of gears, the vibration value of gear meshing frequency, and the vibration value of side frequency, which is essentially in a linear relationship, indicating that the correlation between vibration value and subjective evaluation is very high.
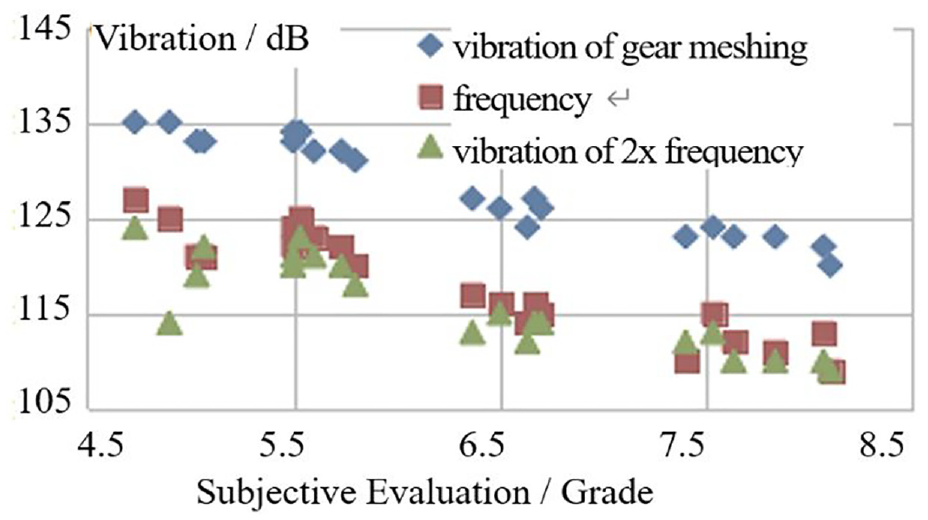
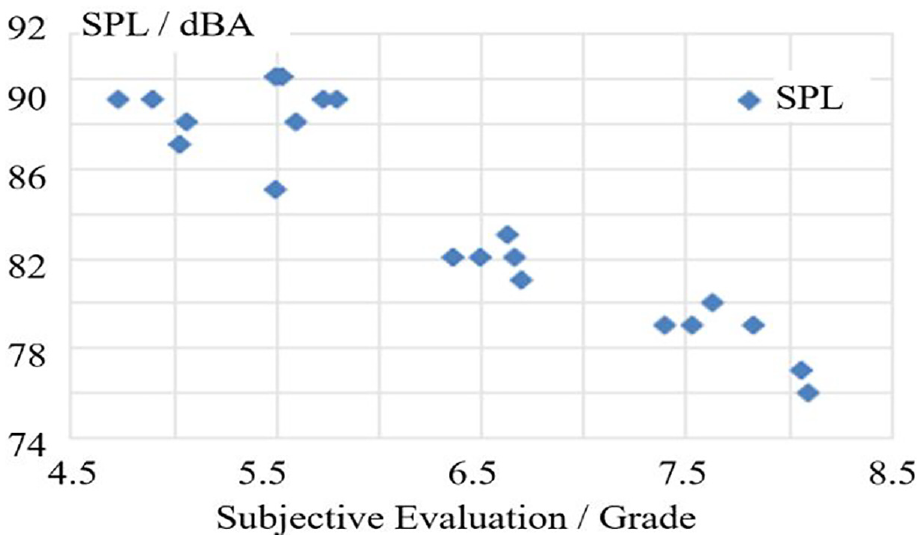
The analysis of the relationship between subjective evaluation and SPL, SPL difference, loudness, sharpness, roughness, and jitter is shown in Figures 6 to 8.
Relationship between SPL and subjective evaluation.
Relationship between sound pressure level difference, loudness, sharpness, and subjective evaluation.
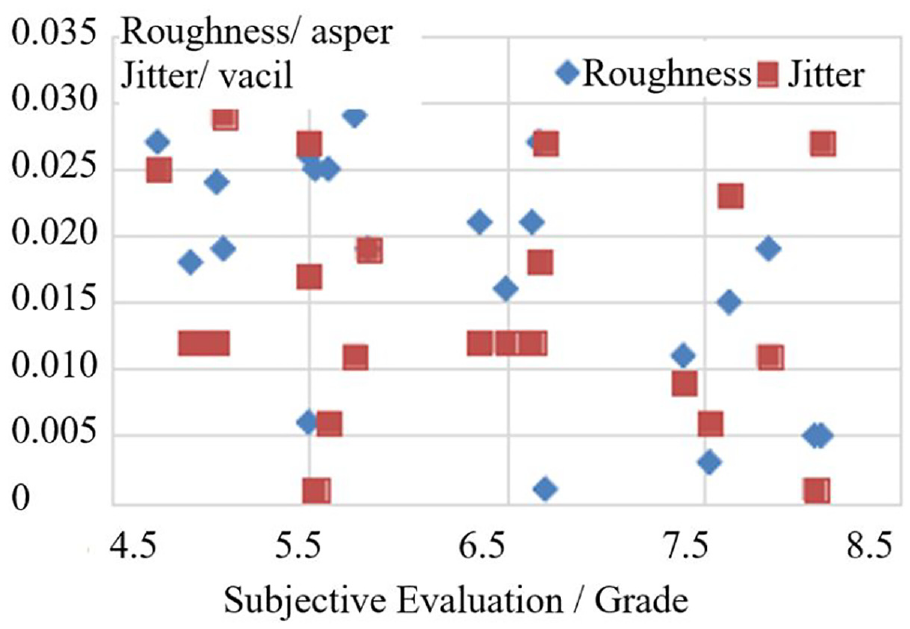
Relationship between roughness, jitter degree, and subjective evaluation.
It can be seen from the above figure that SPL, loudness and sharpness are inversely proportional to subjective evaluation value, SPL difference is directly proportional to subjective evaluation value, that is, the greater the SPL, loudness, and sharpness, the smaller the SPL difference and the worse the transmission noise. However, roughness and jitter degree have no obvious relationship with subjective evaluation, indicating poor correlation.
After the subjective and objective tests are completed, the correlation between the results is calculated. Formula (10) was used to calculate the correlation between EOL objective data and vehicle subjective evaluation, and the results are shown in Table 5.
Correlation coefficient between objective quantity and evaluation results.
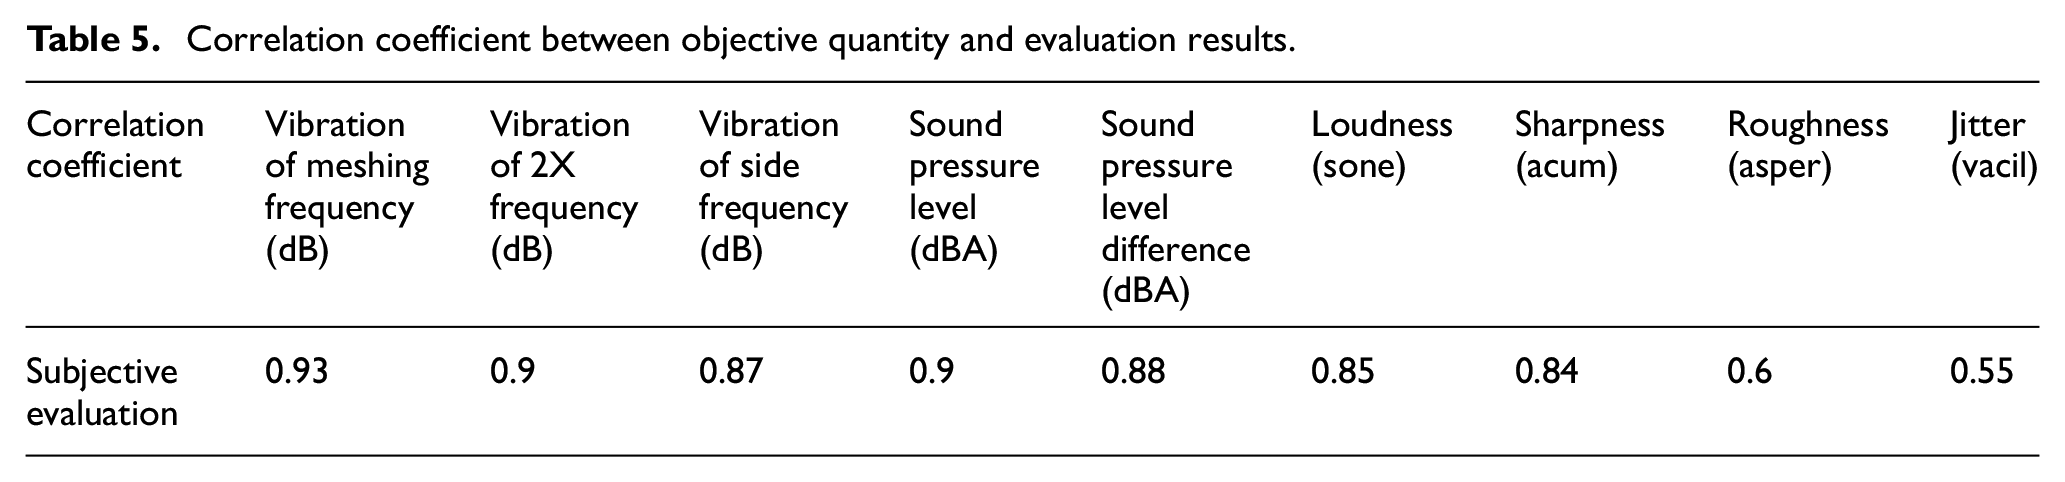
As can be seen from the above table, the correlation between the vibration value of meshing frequency, the vibration value of 2X frequency, the vibration value of the side frequency, the sound pressure level, the sound pressure level difference, the loudness, the sharpness, and the subjective evaluation are all greater than 0.8, and the correlation between the roughness, the jitter degree and the subjective evaluation is low, which is consistent with the above analysis. Based on this data, the vibration value of meshing frequency, the vibration value of 2X frequency, the vibration value of the side frequency are established as vibration parameters. Similarly, sound pressure level, sound pressure level difference, loudness and sharpness are established as acoustic parameters. Note that these parameter sets are used in the subjective evaluation prediction model.
Comparison the vibration between EOL testing and vehicle testing
The vehicle and EOL vibration tests were carried out for 50 transmissions, and the vibration acceleration levels were calculated based on the objective data of 50 transmissions by the vibration and noise analysis system. First of all, the consistency of vehicle vibration data and EOL vibration data under the same working conditions is analyzed. If the difference between the two is less than 3 dB, EOL vibration data can be used to replace the vehicle vibration data for objective evaluation, as shown in Figures 9 to 11:
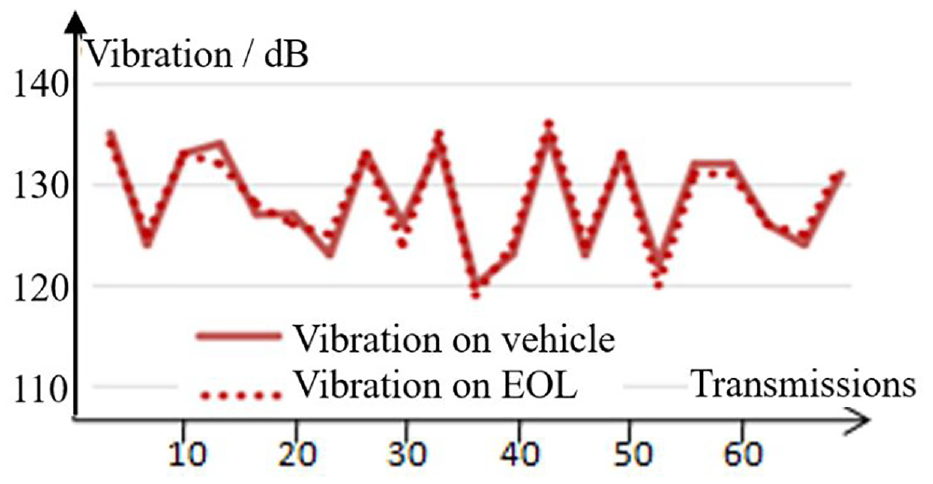
Comparison of the vibration values of meshing frequency between the vehicle and EOL.
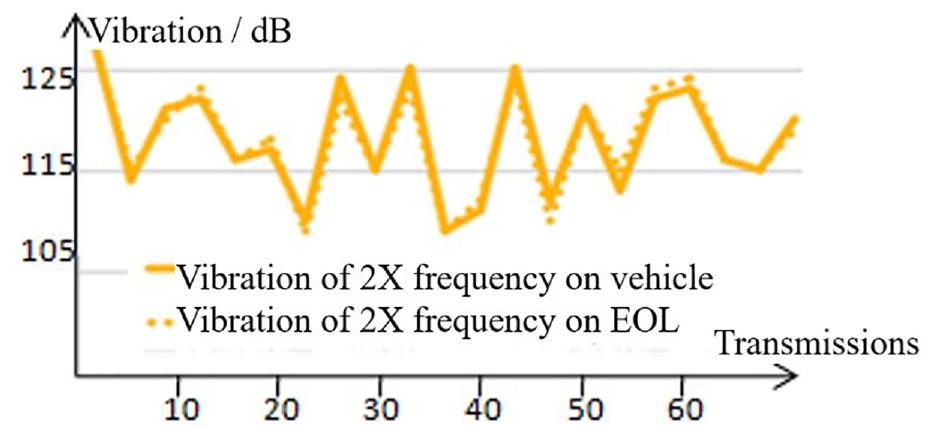
Comparison of the vibration values of 2X frequency between the vehicle and EOL.
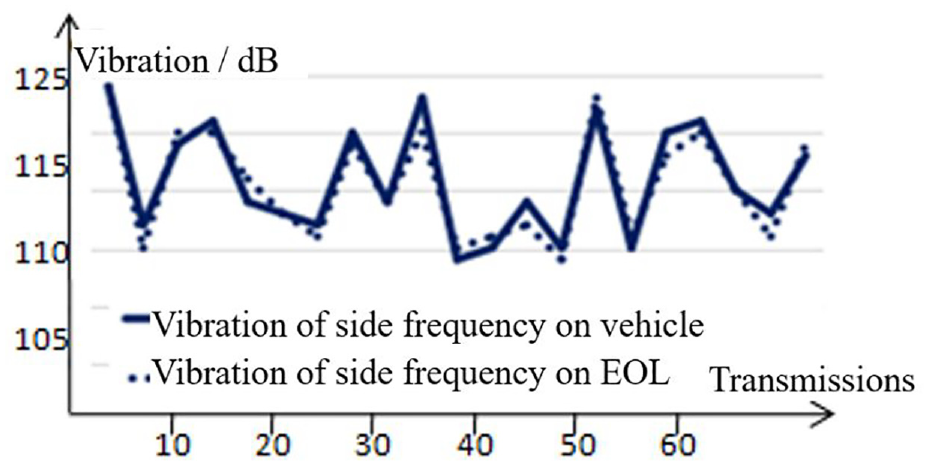
Comparison of the vibration values o side frequency between the vehicle and EOL.
It can be seen from Figures 9 to 11 that the vibration value of the vehicle is consistent with EOL vibration value, and the maximum difference between these values is 2 dB. Therefore, EOL vibration value can be used as objective evaluation data.
Subjective and objective evaluation model
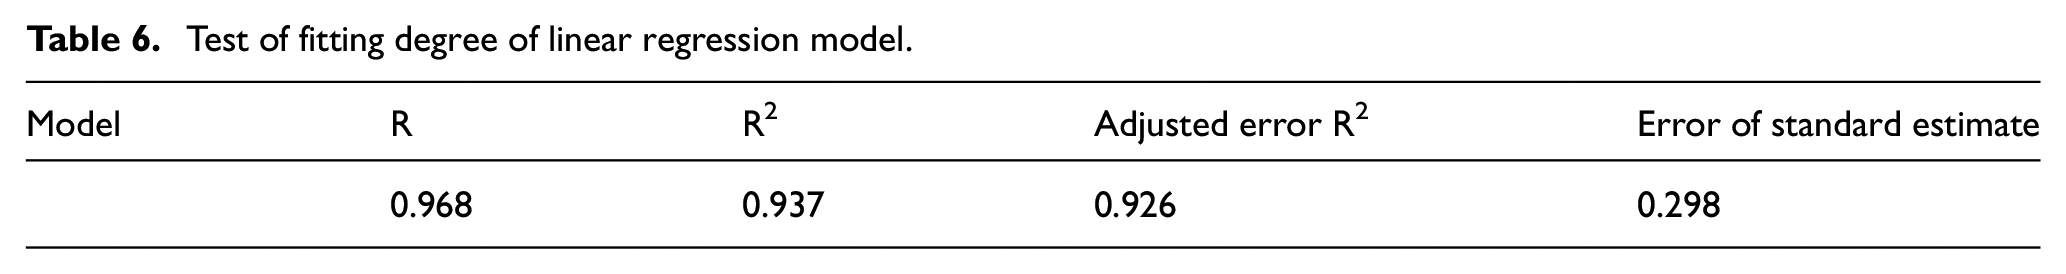
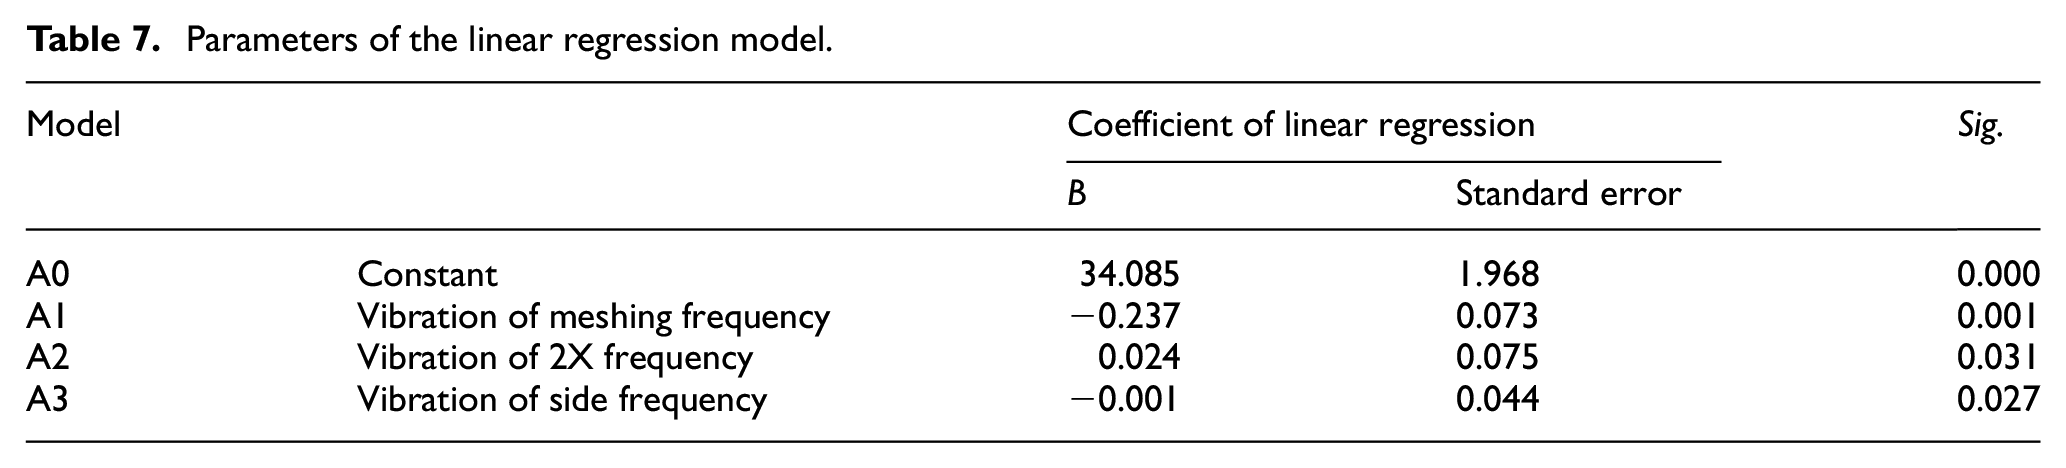
Mathematical statistical analysis software was used to calculate vibration parameters and a subjective evaluation model, as shown in Tables 6 and 7.
Test of fitting degree of linear regression model.
Parameters of the linear regression model.
As shown in Table 6, correlation coefficient R is 0.968, R2 is 0.937. The model has a high degree of fitting, which proves the validity of the prediction model.
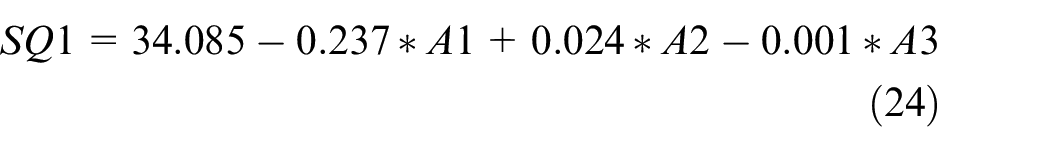
As shown in Table 7, the vibration linear regression model can be expressed as:
Similar, the acoustic linear regression model calculated by the same method is expressed as:
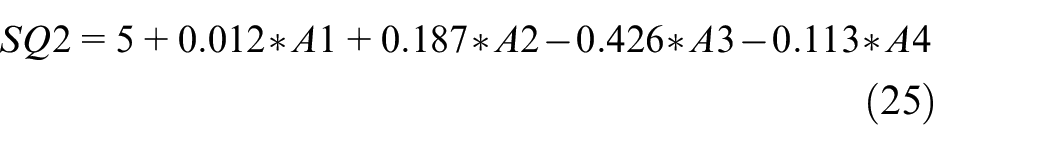
Where,
Comparative validation of prediction models
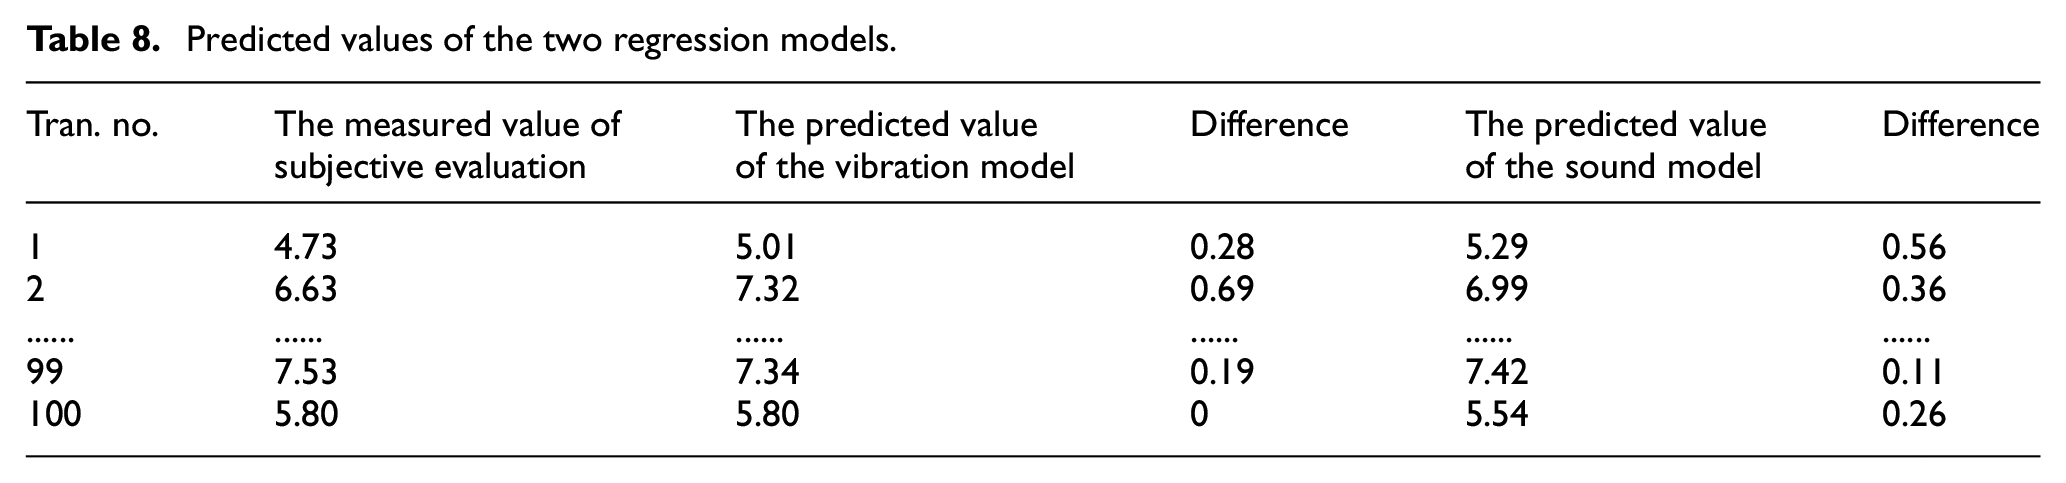
The linear regression model of vibration data based on EOL testing and vehicle subjective evaluation needs to be verified by a large number of tests. 100 EOL tested transmissions were randomly selected for loading, and the vehicle evaluation of each transmission was conducted to obtain subjective evaluation scores. The above model was used to predict the evaluation scores of each transmission and compared with the actual evaluation scores to verify the effectiveness of the model, as shown in Table 8.
Predicted values of the two regression models.
The analysis of the difference between the two predicted values and the measured values is shown in Figure 12 bellowing.
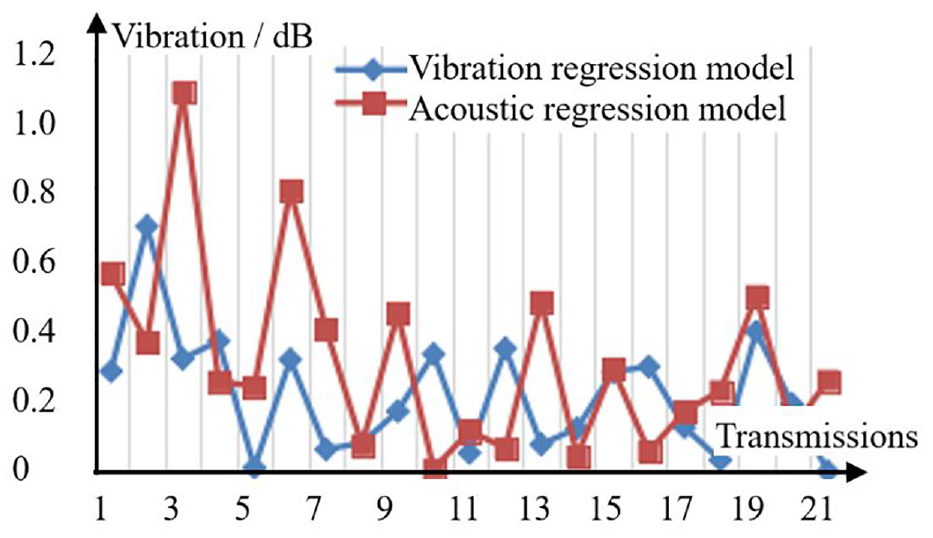
Comparison of prediction differences.
According to the figure above, the maximum difference of the acoustic regression model is 1.1, and the maximum difference of the vibration regression model is 0.7. In terms of the overall prediction trend, the vibration regression model is superior to the acoustic regression model, that is, the vibration regression model is more accurate in prediction.
The comparison of predicted values and measured values of the vibration model is shown in Figures 13 and 14.
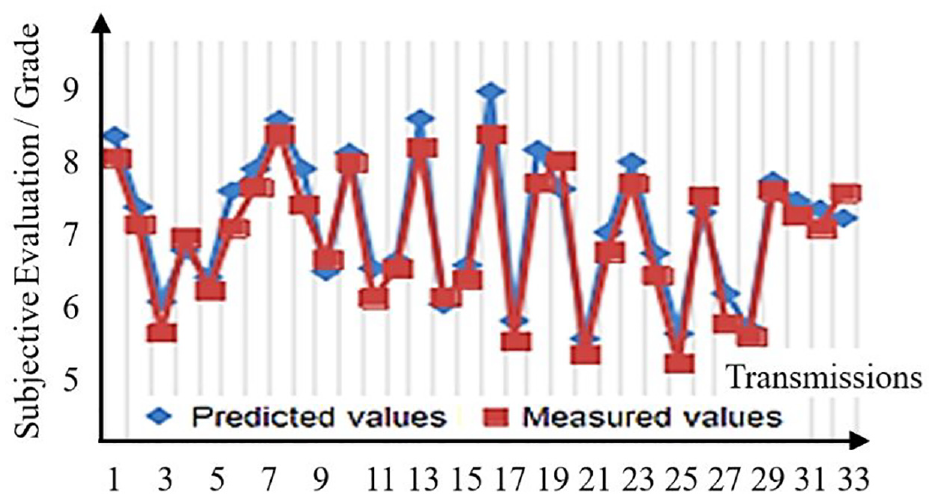
Comparison of predicted and measured values.
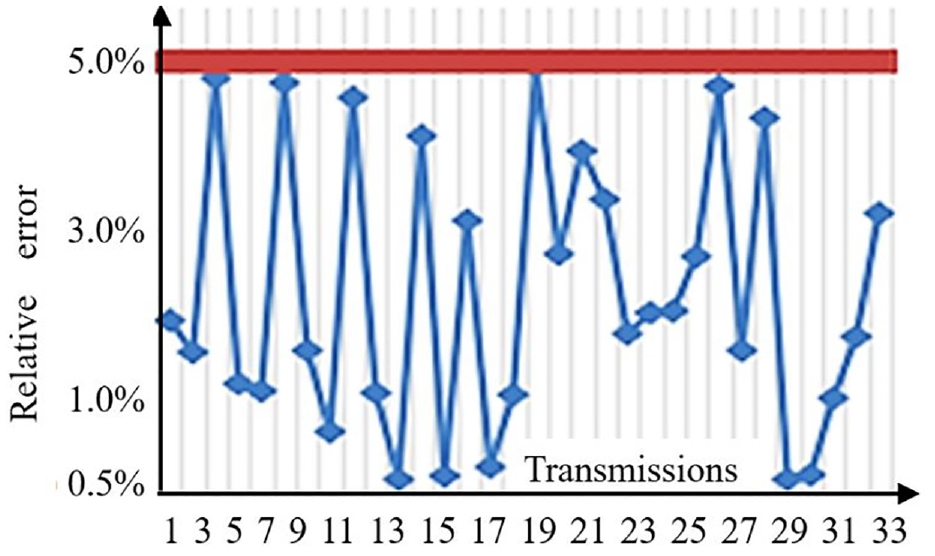
Relative error between predicted values and measured values.
According to the data analysis in Figures 13 and 14, the trend of the predicted value and the measured value of sound quality is consistent, and the maximum relative error of the two values is 5%. Therefore, this indicates that the model can accurately predict the sound quality level of the whole transmission.
For transmission products, we can extract the vibration value of meshing frequency, the vibration value of 2X frequency, and the vibration value of the side frequency of the gears after EOL testing, and using a similar model to predict the vehicle noise level.

Where,
Subjective and objective evaluation system and EOL testing standards
Subjective and objective evaluation system
According to the above subjective and objective evaluation test and prediction model, the automatic transmission EOL testing takes the vibration value of meshing frequency, the vibration value of 2X frequency, and the vibration value of the side frequency of the gear pair as parameters to monitor the vibration and noise level of the entire automatic transmission, and the subjective and objective evaluation system is shown in Figure 15.
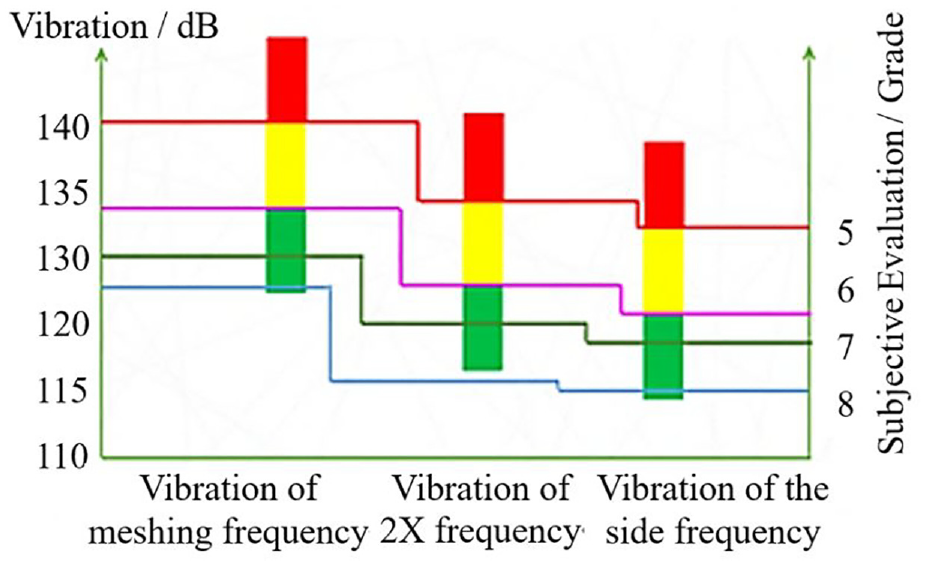
Subjective and objective evaluation system.
EOL testing standard
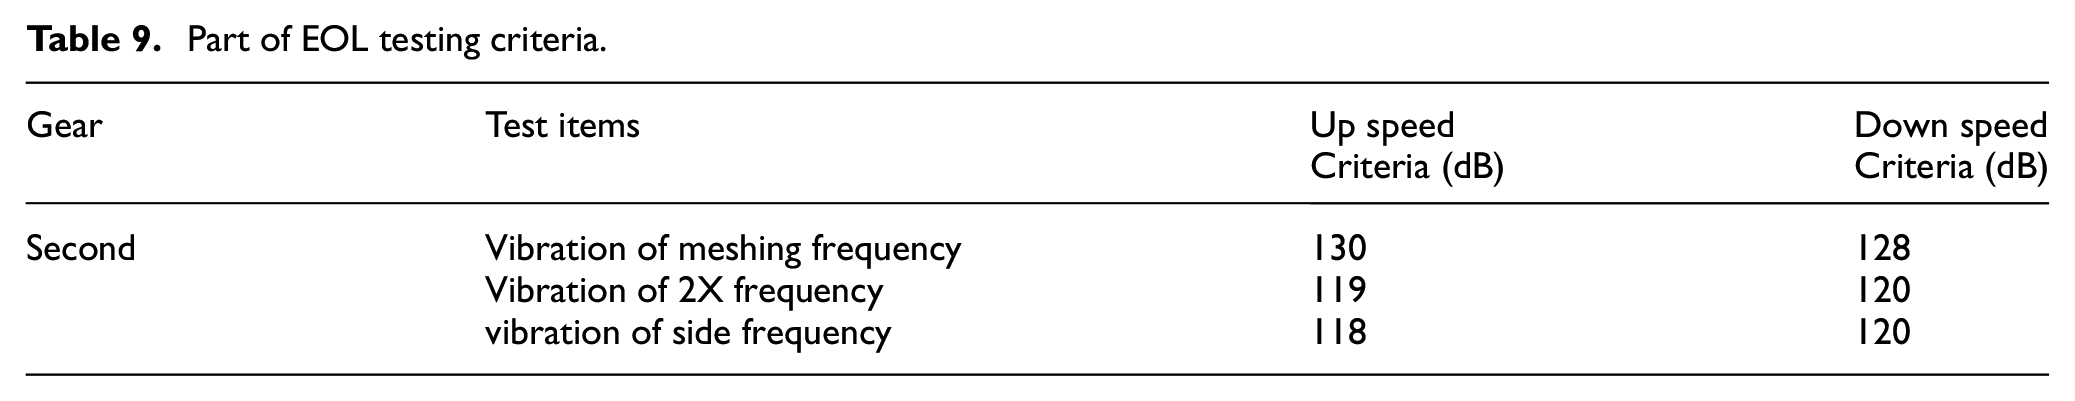
In actual mass production, the vibration and noise of all gear pairs of automatic transmission in each gear position were assessed to ensure that the subjective score of the vehicle could not be less than 6 points. According to the above subjective and objective testing and evaluation system, the automatic transmission EOL testing standard is shown in Table 9.
Part of EOL testing criteria.
EOL testing standard validation
For the purposes of this test, two transmissions were selected. For transmission No. 1, the vibration value of meshing frequency was 135 dB, the vibration value of 2X frequency was 122 dB, and the vibration value of the side frequency was 121 dB. For transmission No. 2, the vibration value of meshing frequency was 130dB, the vibration value of 2X frequency was 118 dB, and the vibration value of the side frequency was 119 dB. According to EOL testing standards, transmission No. 1 is below 6 points, and transmission No. 2 is at 6 points. The test data of these transmissions is shown in Figures 16 and 17:
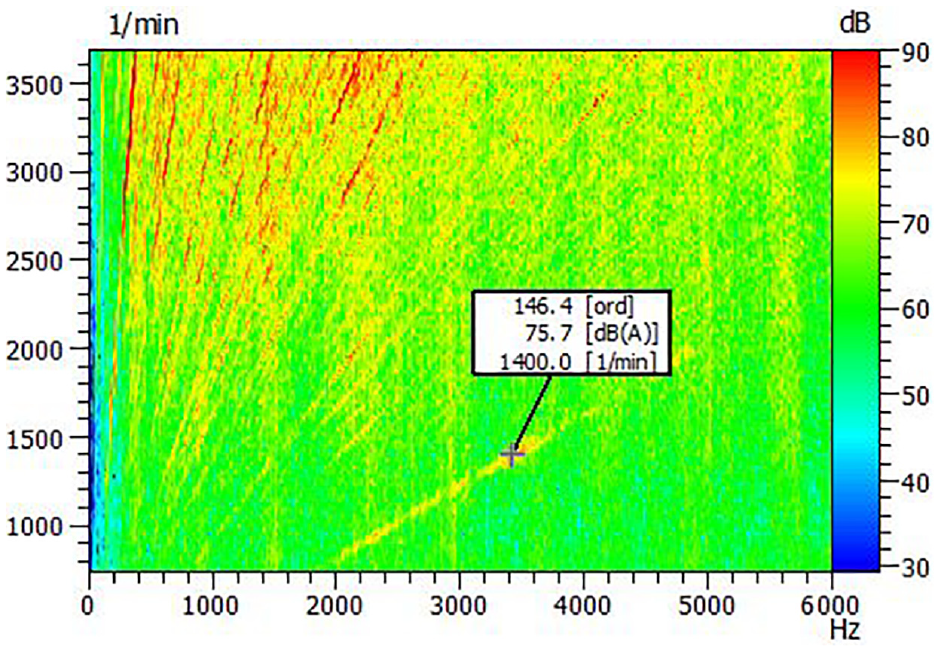
Test data of transmission No. 1.
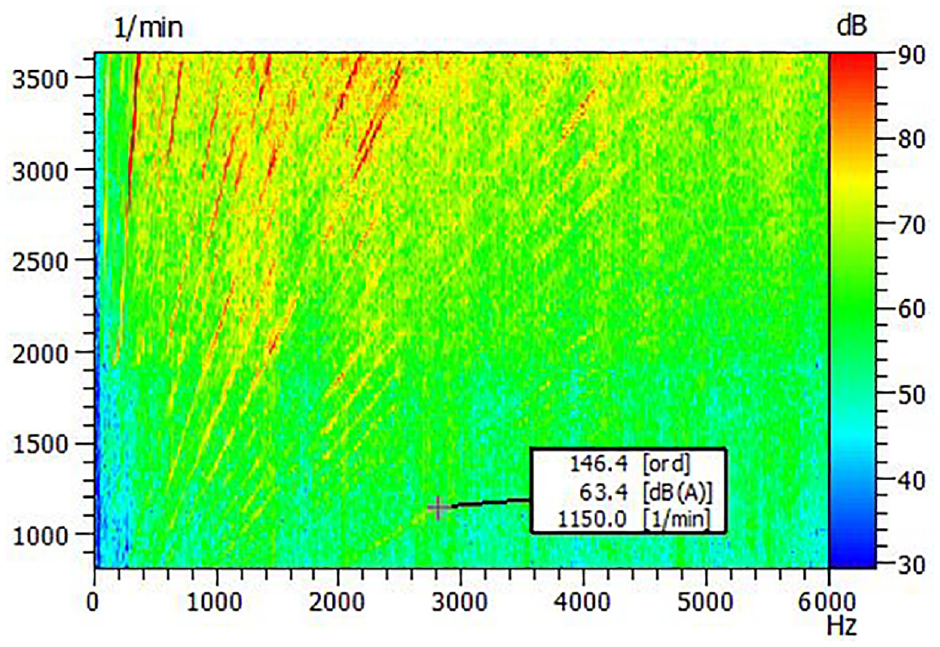
Test data of transmission No. 2.
Based on the test data, it is evident that there is obvious gear noise in transmission No. 1, and the subjective evaluation is 5 points. Transmission No. 2 has no obvious gear noise, and subjective evaluation is 6 points. Therefore, the evaluation is consistent with the EOL standard and proves the rationality of the EOL testing standard.
Conclusion
Based on the research of vibration testing and subjective evaluation of automatic transmission quality and a large number of subjective and objective tests, the following conclusions are obtained:
1) The factors with higher correlations (>0.8) are identified, which can used to establish a prediction model.
2) The vibration parameter regression model is more accurate than the acoustic parameter regression model.
3) The standard limit value of EOL testing is established to ensure the sound quality of the vehicle.
In this study, an effective method was established for quickly and accurately identifying the sound quality of automatic transmission in a vehicle by testing the objective vibration parameters on automatic transmission EOL bench, which has a great significance for engineering and EOL quality control.
Footnotes
Declaration of conflicting interests
The author(s) declared no potential conflicts of interest with respect to the research, authorship, and/or publication of this article.
Funding
The author(s) disclosed receipt of the following financial support for the research, authorship, and/or publication of this article: This work is supported by the Talent Fund of Beijing Jiaotong University (V23XKRC00040).
Data availability statement
All relevant data are within the paper.