
Abstract
Frequency is one of the most significant indicators of power system, which needs accurate estimation to provide a reliable basis for monitoring, control, and protection. Owning to the efficiency, DFT is widely used in the frequency measurement of power systems. However, the inherent defects, that is, the spectral leakage and picket fence effect, decrease the accuracy of DFT. One of the variants, named the windowed phase difference method (WPD), addresses the problem using the phase variation of two windowed sequences in the frequency domain and achieves accurate frequency estimation. Suffering from the ignored negative component and contamination of noise, there are still undesired errors in WPD-based frequency estimation. To reduce the influence of the undesired errors, this paper first analyzes the systematic error of WPD introduced by spectrum leakage and proposes an improved WPD (IWPD) through systematic error compensation to achieve more accurate frequency estimations. Then, the windowing effect on IWPD-based frequency estimation of a noisy signal is studied by deducing the theoretical expression of frequency estimation variance. Finally, the proposed IWPD is validated by extensive computer simulations and practical experiments.
Introduction
The increasing proportion of renewable energy in power systems not only aggravates the imbalance between the power supply and demand but also deteriorates the power quality, because of the penetration of power electronic equipment and non-linear loads. 1 As one of the products, frequency fluctuations bring great challenges for the safety and stable operation of power systems.2,3 To address this issue, high-precision frequency estimation is needed to monitor the status of the power system, which can provide a reliable basis for power system control and protection.4–6
In recent decades, several methods have been utilized to provide accurate frequency estimation, such as discrete Fourier transform (DFT),7–9 Phase-locked loop, 10 Prony’s-method, 11 wavelet transform, 12 least-squared technique, 13 Kalman filter, 14 Taylor method, 15 demodulation technique, 16 and artificial neural network, 17 etc. Among them, DFT is widely used for its efficient implementation, the fast Fourier transform (FFT). With coherent sampling, DFT can estimate the frequency with extremely high accuracy. 18 However, acquiring the signal coherently always encounters intricate problems due to the frequency fluctuation in practice. Under non-coherent sampling, the inherent defects of DFT, for example, the spectral leakage and picket fence effect, will be produced, which are detrimental contributions for accurate frequency estimation. 19 Many tricks, such as the window functions and spectral correction algorithms, have been applied to DFT to reduce the errors introduced by those inherent defects, which can be called the windowed DFT methods. 20 Weighting the discrete signal by window function in the time domain can effectively suppress the spectral leakage. 21 In addition, it is known that the accuracy of windowed DFT on frequency estimation is mainly determined by the window adopted. Thereby, various windows, Hanning window, Blackman-Harris (BH) window, Nuttall window, Maximum sidelobe Decay window (MDW), and the convolution windows, etc., are used. The tradeoff between the major lobe width and the sidelobe behaviors is unavoidable when selecting the window for frequency estimation. 21
A popular spectral correction method to eliminate the picket fence effect is the interpolation in the frequency domain. In which, the dual-spectrum lines and multi-spectrum lines are widely utilized thanks to their good performance on spectral correction. 22 However, getting the window’s frequency estimation interpolation polynomial involves solving high-order equations which may increase the computational burden. The Windowed Phase Difference method (WPD) utilizes the inherent relation between the estimated frequency and the phase difference of two groups of DFT. Compared to the interpolated DFT, since WPD avoids solving high-order equations, it has the merits of simple calculation and easy embedding. In Wen et al., 20 a discrete phase difference correction algorithm based on a desirable sidelobe window is proposed for harmonic analysis, and the result validates that it can considerably reduce spectral leakage and harmonic interference. In Xia and Liu, 23 the systematic error of the phase angle of unwindowed DFT coefficients in a single-phase system is analyzed. Although a “quasi-positive-sequence-DFT” is proposed in Xia and Liu 23 to compensate for the systematic error, the frequency estimation precision is still limited without the help of windows.
As well known, in actual measurement, the inherent noise and the noise introduced by the sampling system, including the transducers, converters, conditioning circuits, etc. are unavoidable. Since the noise will decrease the accuracy of frequency estimation, evaluation of the frequency estimator’s performance under noisy conditions is mandatory. 24 The windowing effect on the bias and variance of the DFT-based frequency estimation is investigated in Schuster et al. 25 The influence of noise on the power system frequency estimation is studied in Wen et al.,22,26 and Belega and Petri. 27 The difference is that 22 concentrates on the triple-line interpolated DFT, while 26 focuses on a double-line interpolated DFT with a triangular self-convolution window. In addition, the noise effect of the phase difference method without weighting effect (rectangle window) on frequency estimation is analyzed in Hwang and Liu. 28 As mentioned before, the performance of the rectangle window (without windowing) is not so satisfying in frequency measurement under incoherent sampling. Therefore, it is necessary to analyze the systematic error of the WPD-based frequency estimator and the frequency variance under noisy conditions.
To the best of the authors’ knowledge, for the WPD, the error sourced from the negative part and the windowing effect on the measurement variance have not been investigated yet. Thus, to fill this gap, the systematic error of the WPD-based frequency estimator is first analyzed in this paper, and then an improved WPD (IWPD) is proposed to compensate for the systematic error. After that, the weighting effect of the window function on the noise is investigated, and the variance expression of frequency estimation is derived theoretically. At last, the computer simulations and experimental tests are carried out to verify the proposed systematic error and variance expressions, as well as the performance of the proposed IWPD.
The organization of this paper is as follows. In Section 2, the WPD for power frequency estimation is recalled. In Section 3, the systematic error of the WPD-based frequency estimator is analyzed and the IWPD is presented. Section 4 derives the theoretical variance and mean of WPD for frequency estimations under noisy conditions. Afterward, the simulations and experiments are carried out in Sections 5 and 6, respectively, to validate the proposed expressions and the IWPD. Finally, Section 7 discusses the conclusion.
Frequency estimation by WPD
A power system signal corrupted by harmonics acquired by a sampling frequency
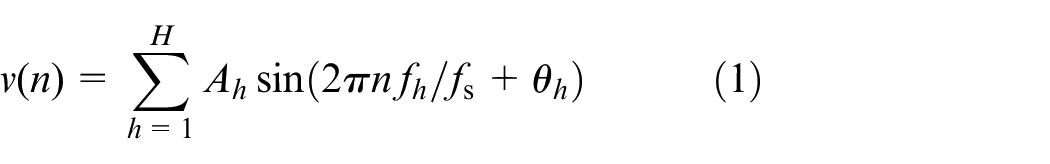
where
To reduce the spectrum leakage caused by the truncation and incoherent sampling, an N-samples window function w(n) is employed to truncate v(n) in the range [0, N-1] in the time domain as:

The DFT coefficients of
where
Note that
where
As for the power system frequency
According to the principle of DFT, the phase

It is worth noting that
When the signal is truncated by the same window
where

It is straightforward that the difference of the initial phase between the two truncated samples is
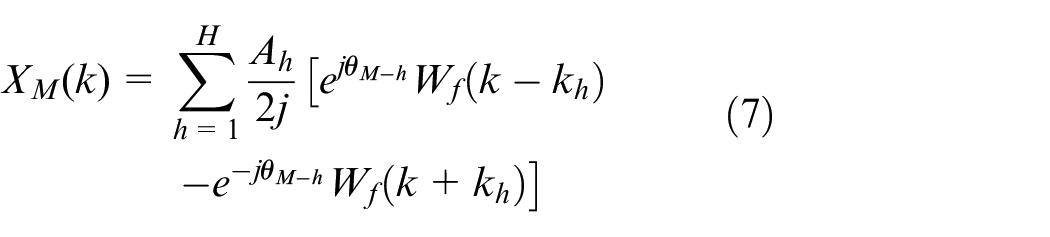
Similarly, the complex spectrum of the
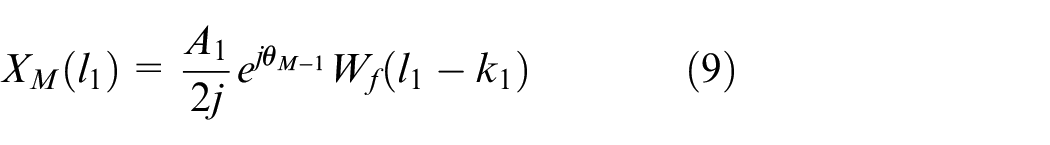
The phase of the

As can be seen from the comparison of (6) and (10), the phase difference between the

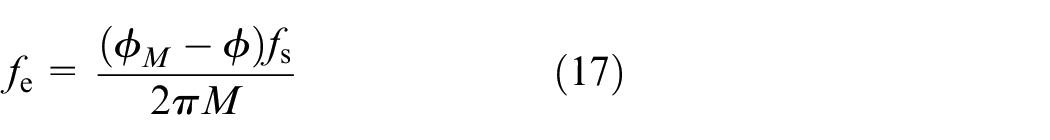
Thus, the frequency of the power system is estimated by the following equation:

where

where * denotes the complex conjugate, ∠ expresses the angle of a complex number.
The process of the WPD for power system frequency measurement is shown in Figure 1.
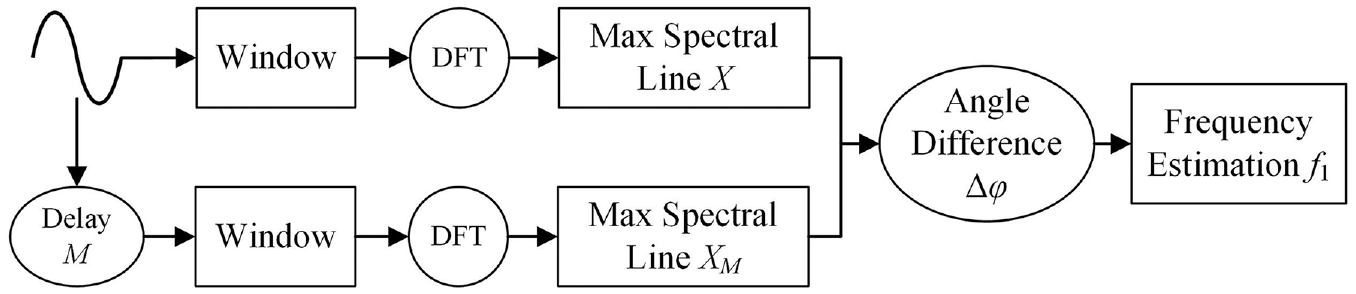
Schematic diagram of WPD for power system frequency estimation.
Improved WPD by systematic error compensation
The operation in (14), which ignores the influence of harmonics and negative fundamental frequency components, leads to an error in the frequency estimation. To lower this undesired error, the IWPD based on systematic error compensation is presented in this section.
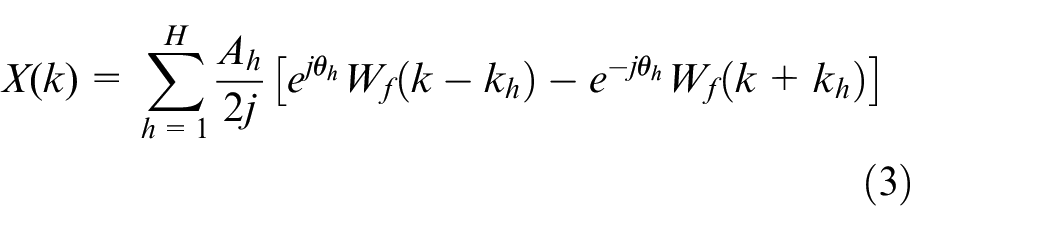
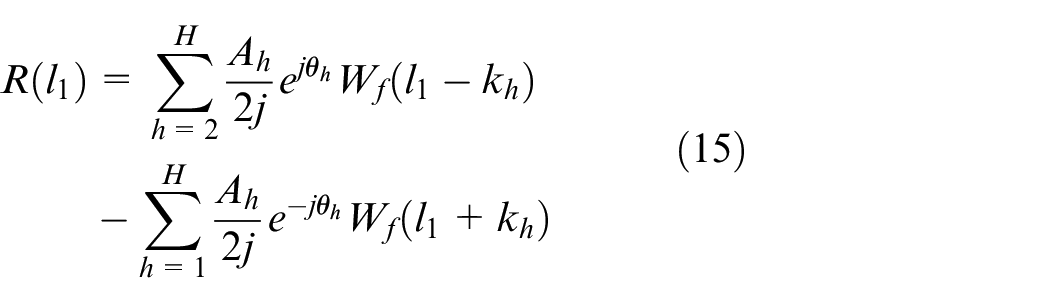
According to the expression of DFT coefficient given in (3), the
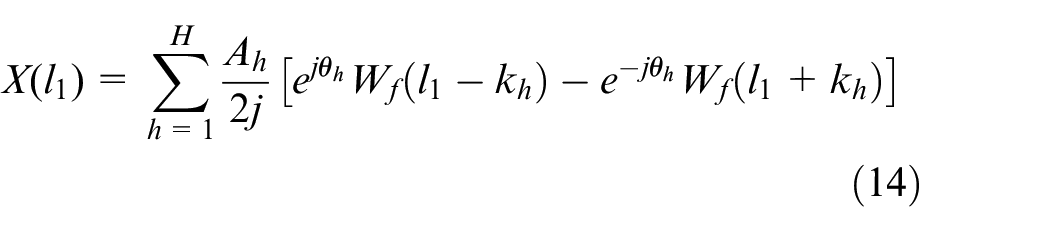
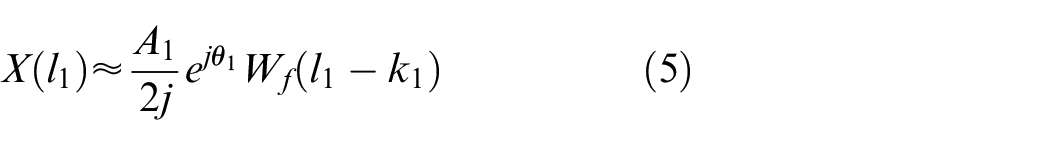
Comparing (14) and (5), it can be seen that, except for the component
The phase error
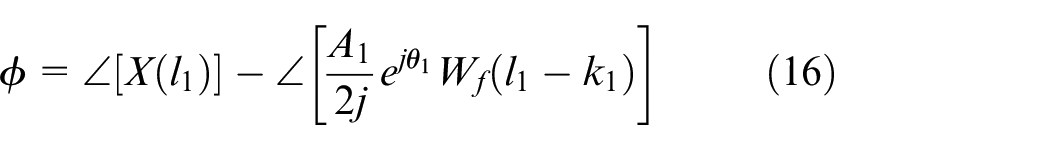
Define
According to Zhang et al.,
29
the expression of
where
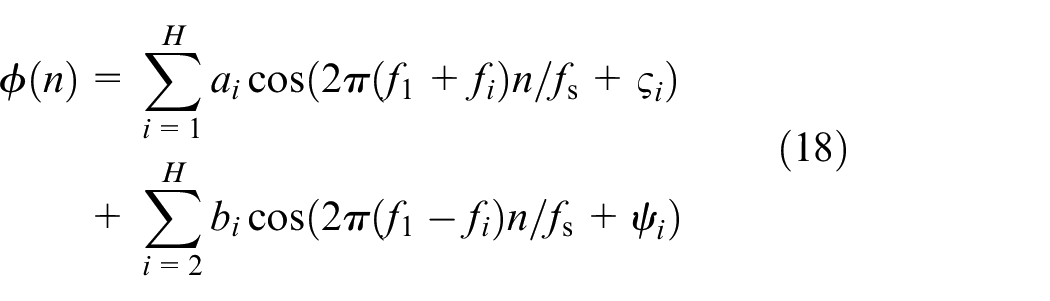
According to (18), it can be observed that the variation period of
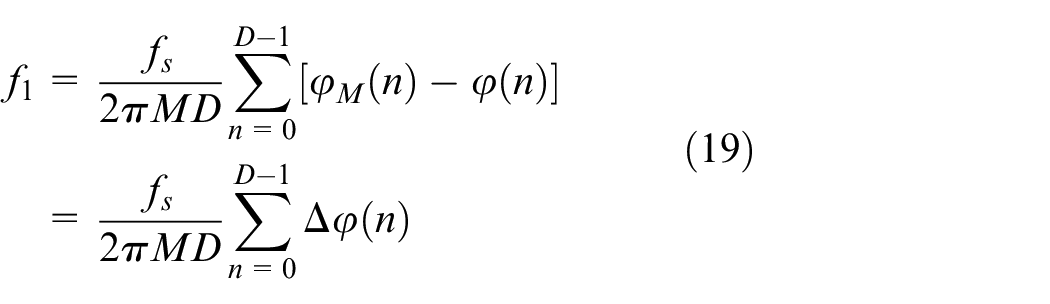
To improve the calculation efficiency, based on the sampling theorem, only necessary samples in sequence
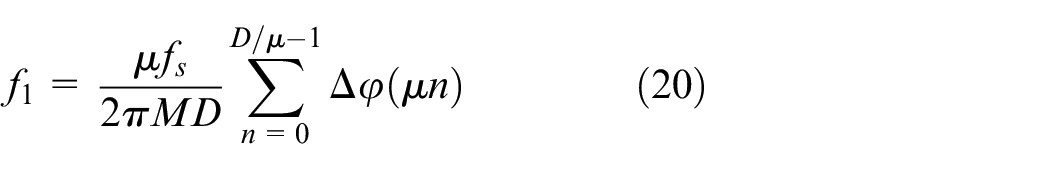
where
Noise analysis of WPD on frequency estimation
The analysis of noise is mandatory due to the inevitability of noise in actual measurement. Thus, the effect of noise on frequency estimation by WPD is studied in this section.
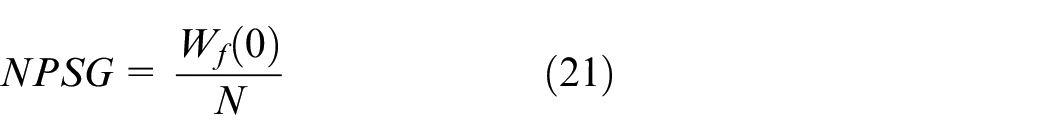
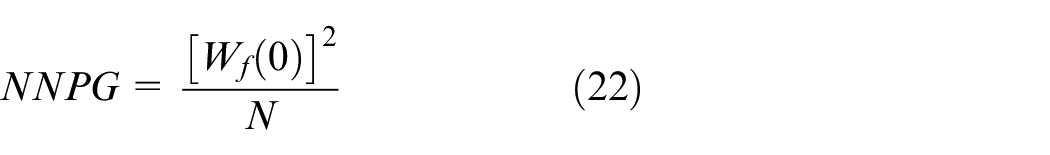
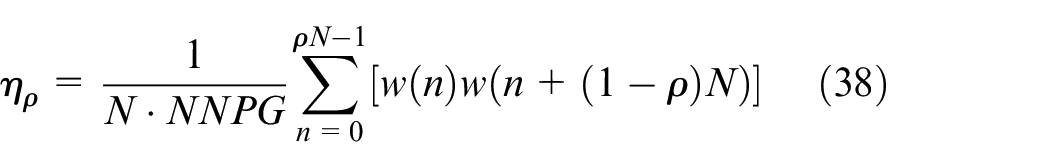
First, some of the merits of a window function are introduced. That is, normalized peak signal gain (NPSG), normalized noise power gain (NNPG), equivalent noise bandWidth (ENBW). The definitions of the mentioned merits are given by the following equations. 31

As we know, the sampled signal in practical measurement of the power systems can be expressed as:

where
After being weighted by the window function

while its DFT coefficients can be calculated by equation (26).

where
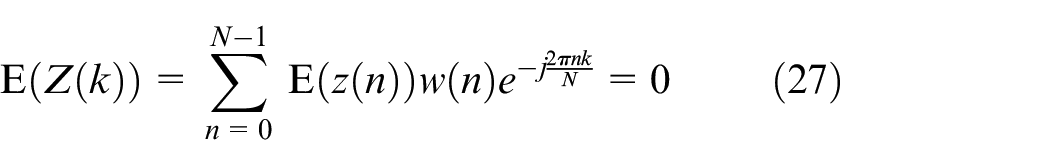
where E() and Var() represent the expectation and variance, respectively. Besides, more equations about the statistical properties of

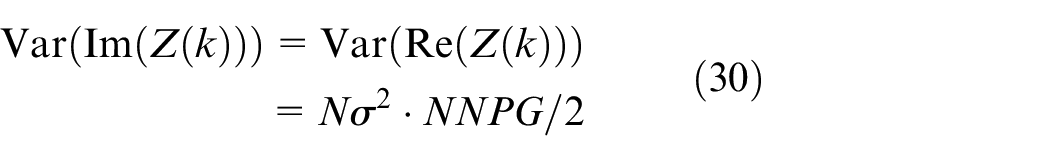
where Im() and Re() express the imaginary and real parts of a complex number, respectively.
Variance of the estimated frequency
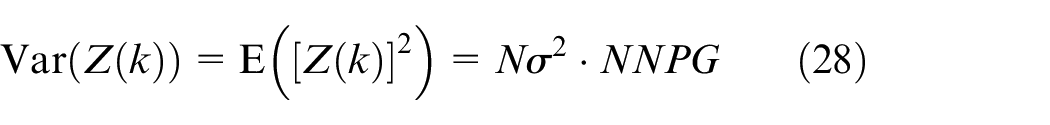
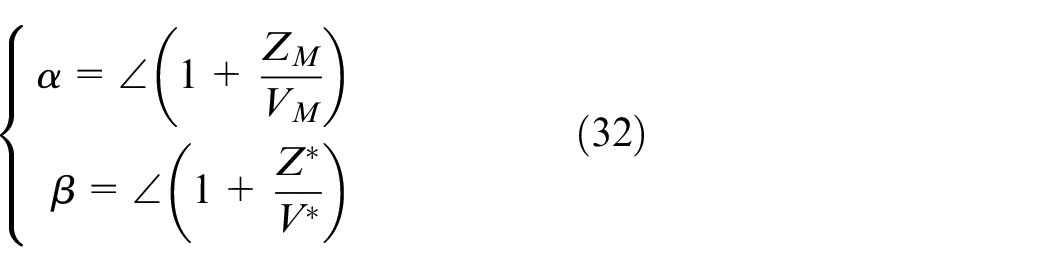
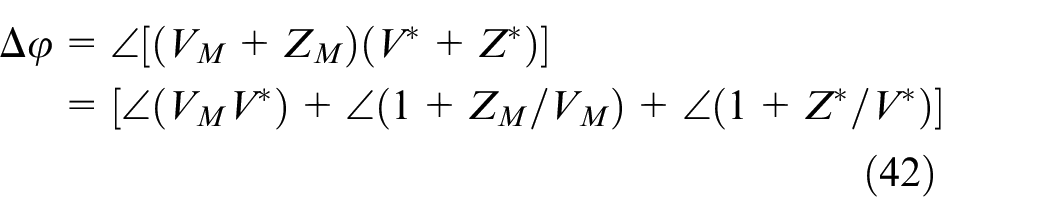
After performing DFT calculation on two windowed signals having a time delay M, the phase difference
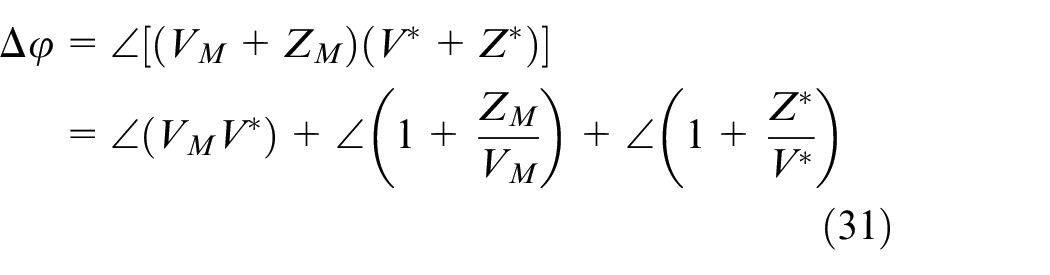
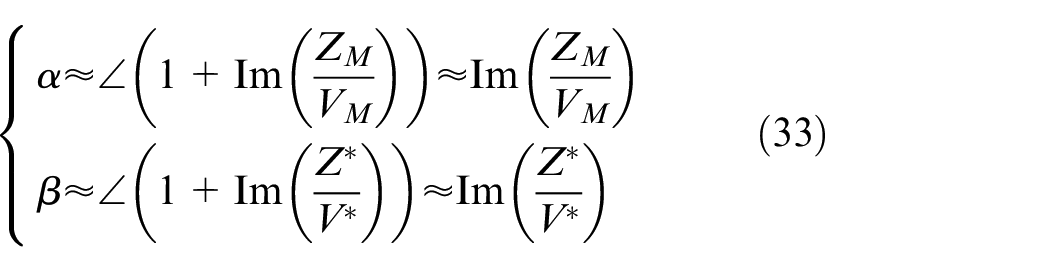
Notice that the first term in (31) is the desired one, and the rest two terms related to
Generally, the power of noise is neglected compared to the power of the signal when
When

Meanwhile, the means of
Since E
When
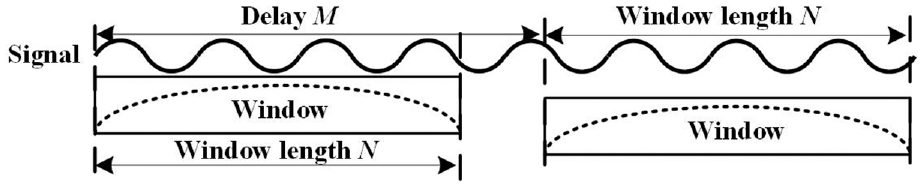
Schematic diagram of WPD when
While
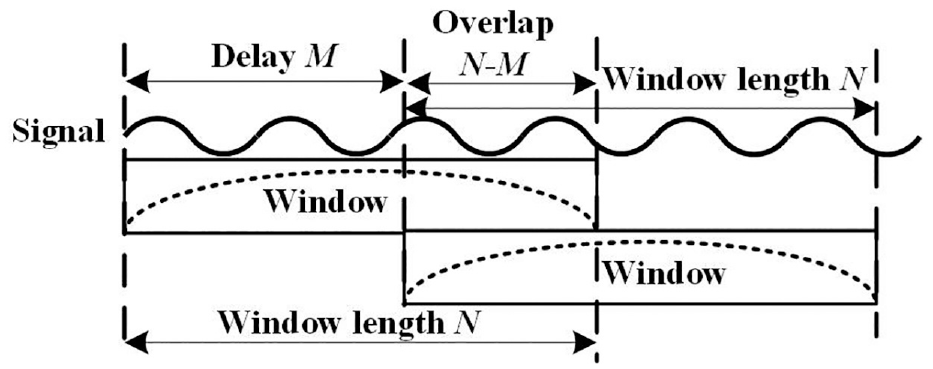
Schematic diagram of WPD when
where
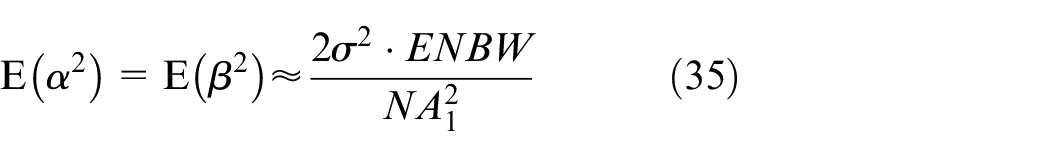
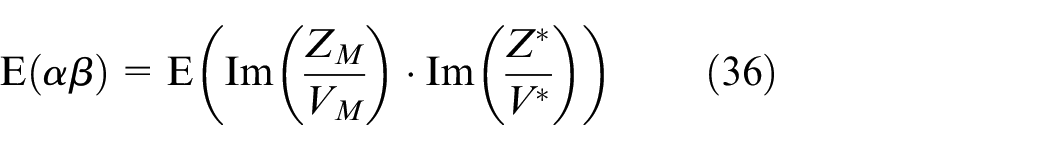
By applying OC, we can easily obtain the E
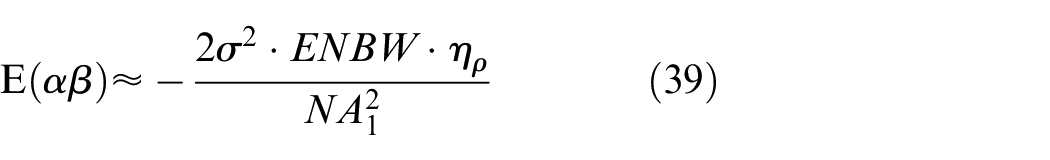
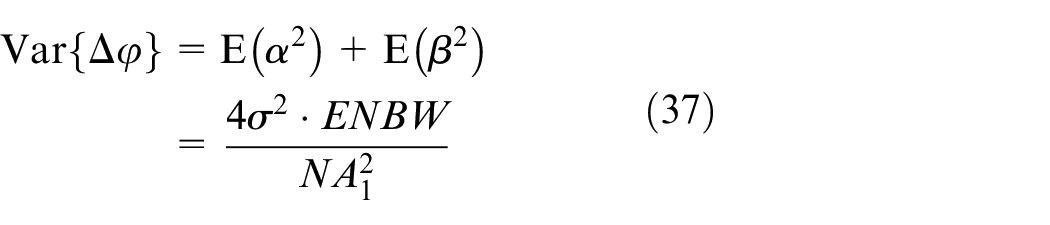
Then, the variance of phase difference
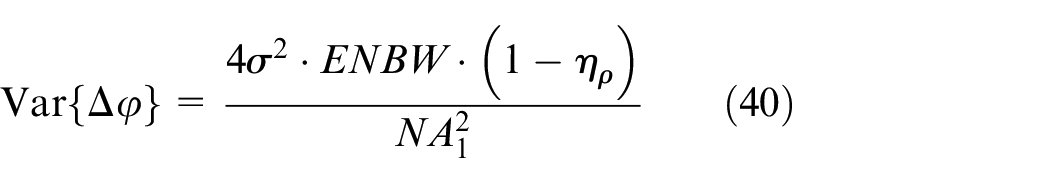
From the comparison of (40) and (37), it can be found that (37) is the result of (40) when
According to the relationship between frequency and phase difference, the variance of frequency estimation is obtained as:
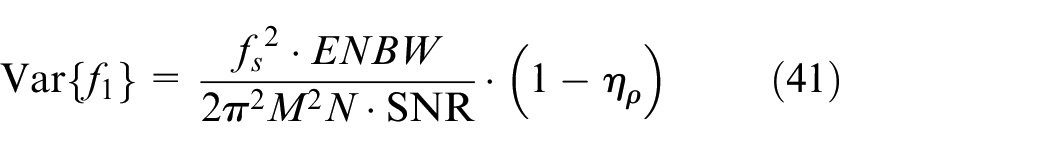
Based on (41), it can be seen that the frequency variance of WPD is in direct proportion to ENBW. Meanwhile, it is inversely proportional to SNR and N. What is more, the variance will be significantly reduced while M increases.
Mean of the estimated frequency
To analyze the windowing effect on the mean of frequency estimations, (31) is rewritten as:
The mean of phase difference
Then the mean of the estimated frequency is obtained as:
When

Simulations tests and results
This section contains the simulation analysis to validate the proposed systematic error, variance, and mean expressions of WPD for frequency estimation, as well as the performance of the proposed IWPD.
Simulation of systematic error of frequency estimation
To verify the correctness of the proposed systematic error expression (17), a pure voltage signal distorted by harmonics is employed. The sampling frequency
Parameters of harmonics.
Effect of time delay on systematic error
Figure 4 depicts the variations of frequency versus different delay
The effect of delay on systematic error of frequency estimation by WPD.
The agreement between theoretical and simulated systematic error shown in Figure 4 confirms the correctness of the proposed expression of systematic error of frequency estimation. Besides, it can be seen that as the time delay
Effect of frequency deviation on systematic error
The influence of frequency deviation on the systematic error of the WPD-based frequency estimator is evaluated by changing the fundamental frequency
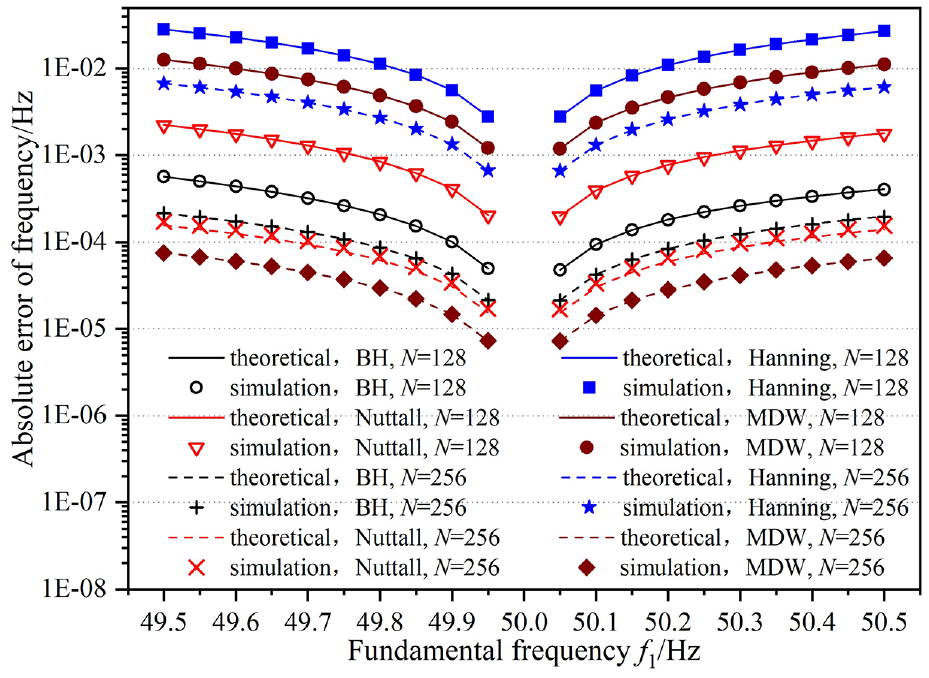
The comparison of theoretical and simulation systematic errors of fundamental frequency estimation with different frequency deviations.
From Figure 5, the consistency between theoretical and simulated systematic errors validates the effectiveness of the proposed expression. 17 Other than this, the following conclusions can be summarized as (1) the systematic error will be reduced as the frequency deviation decreases. (2) An increment of window length can decrease the systematic error.
Performance of the IWPD
To evaluate the performance of the IWPD, the signal shown in Table 1 with
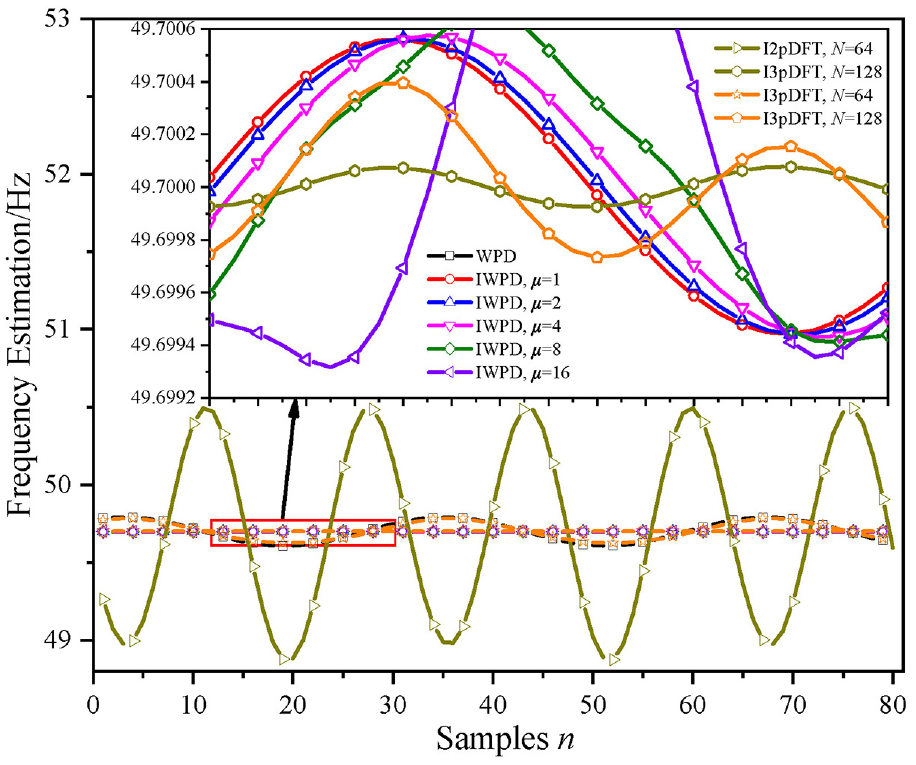
Performance of systematic error compensation for frequency estimation.
In Figure 6, the frequency estimations, sliding along
Validation of variance and mean of frequency estimation
To assess the correctness of the proposed variance and mean expressions shown in (41) and (45), simulations applied on a single-tone frequency voltage signal in the presence of the zero-mean additive white Gaussian noise are carried out. The parameters of the single-tone frequency signal are
Effect of SNR
First, simulations are performed with noise at different SNRs ranging from 10 to 100dB, while the frequency of sine-wave is set as
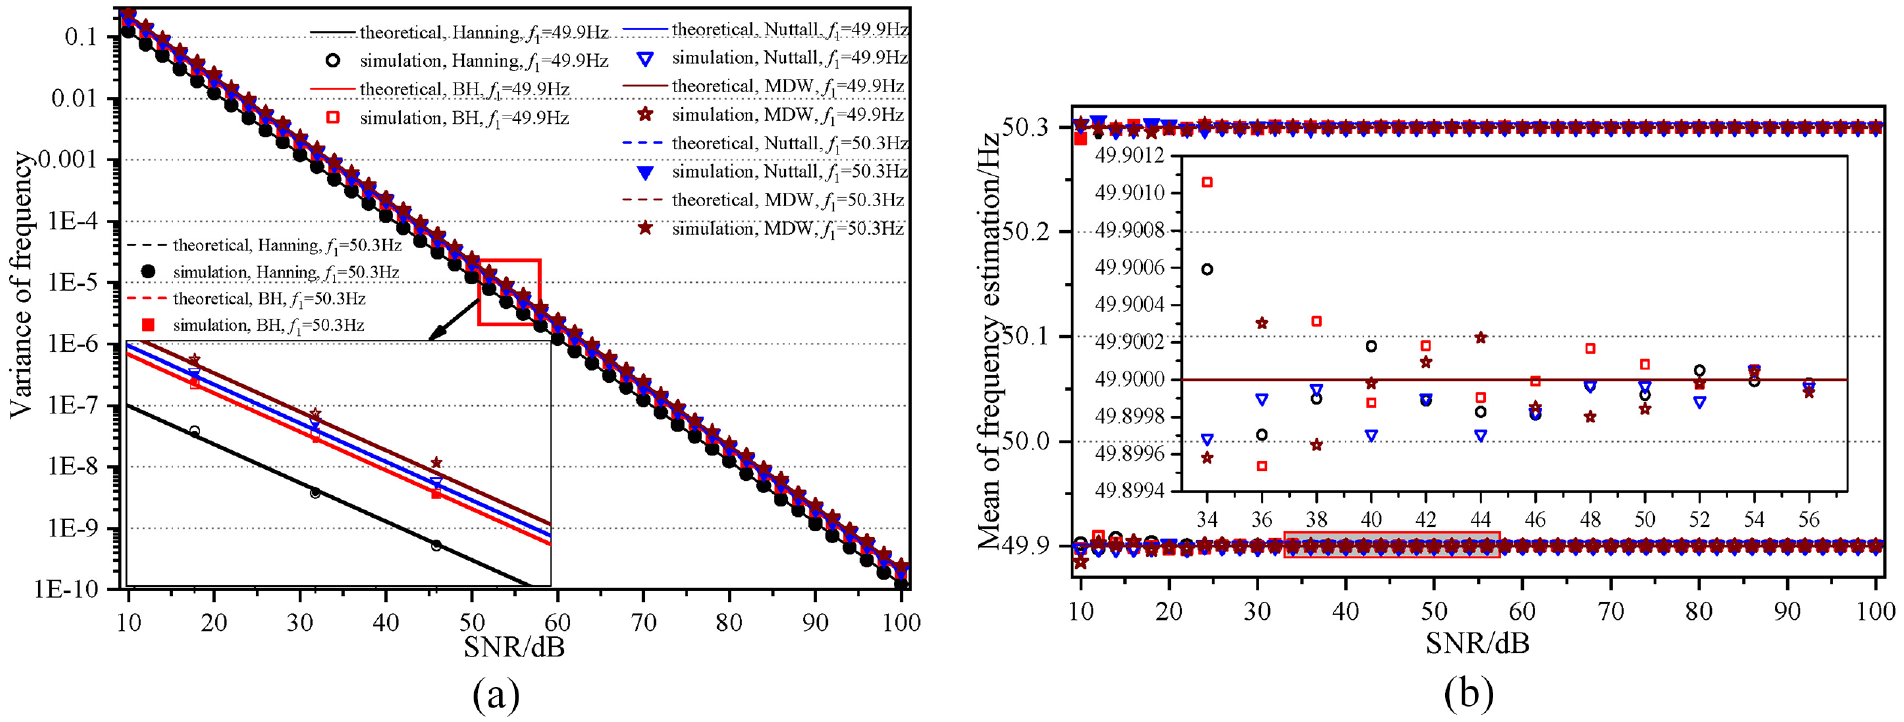
Variances and means of frequency estimations versus different SNRs: (a) variances of frequency,
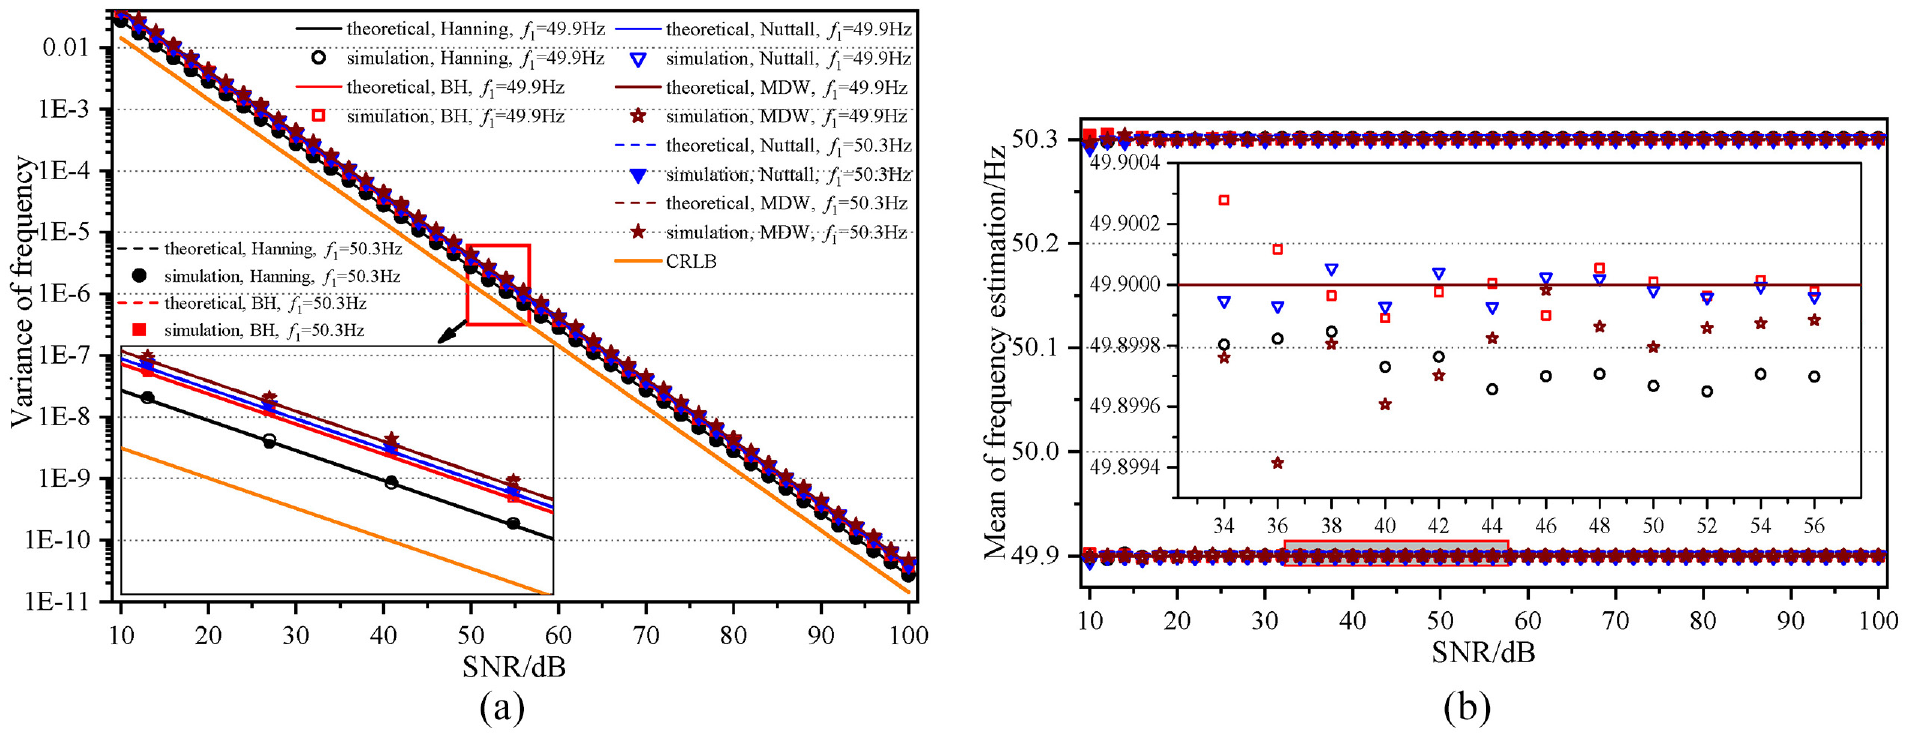
Variances and means of frequency estimations versus different SNRs: (a) variances of frequency,
Figure 7 shows that the variances and means of
As for the mean of the frequency estimations shown in Figures 7(b) and 8(b), the bias reaches 0.003 Hz only when the SNR is lower than 20 dB. Moreover, we can see that the increase in SNR leads to a reduction of the bias. In detail, the bias can be lower than 0.0004 Hz when SNR>40, which can be seen in the pictures.
Effect of the delay M
As a key parameter of WPD, it is important to evaluate the effect of time delay
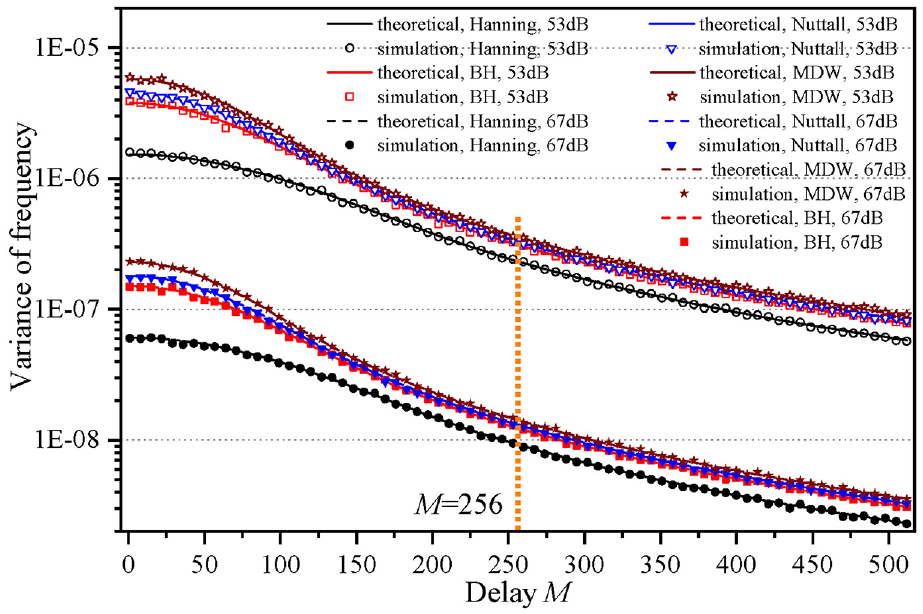
Variances of frequency estimates versus different delay
As shown in Figure 9, higher SNR produces lower frequency variance, and it shows good agreement between the theoretical and simulation variance results versus different
Experimental tests and results
In this section, practical tests are carried out through a PC-based platform shown in Figure 10 to evaluate the performance of the IWPD. The pure sinusoidal signals are generated by calibrator FLUKE 6105A, conditioned by the preprocessing circuit, sampled by the PCI-6221 data acquisition board, and then stored and processed in the PC. The parameters of the signal are,
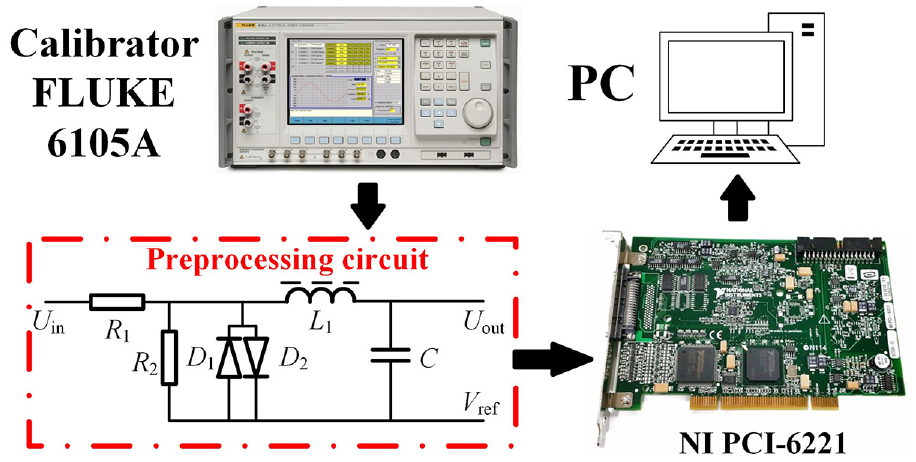
Hardware platform of the experiments.
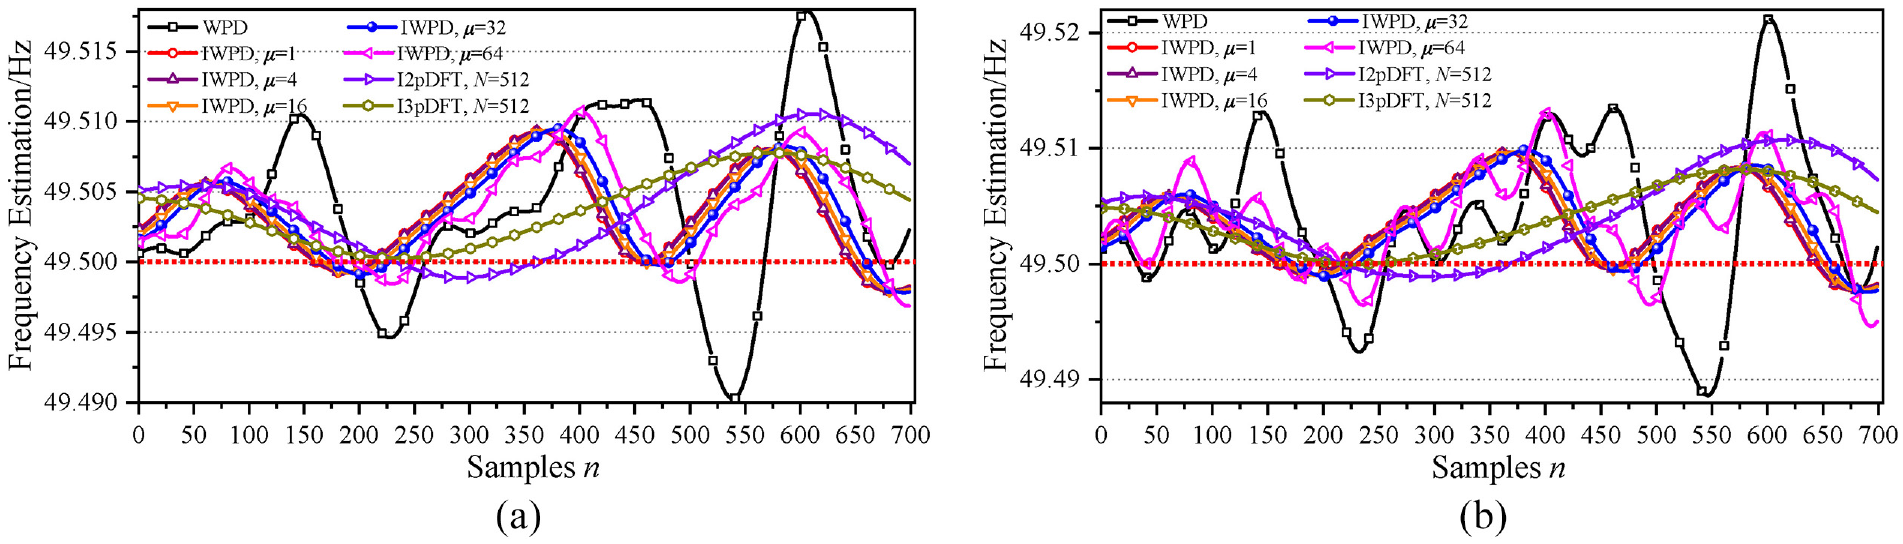
Performance of the IWPD: (a) Blackman-Harris window and (b) 4-term 3-order Nuttall window.
As shown in Figure 11,
Conclusion
The performance of WPD on the power frequency estimation is affected by the systematic error and the noise inevitable in practical measurement. This paper firstly analyzed the systematic error of frequency estimation based on WPD, and then the IWPD through systematic error compensation is proposed. After that, the variance of frequency estimation under noisy conditions is studied by introducing the ENBW and OC of the window function. The IWPD and the proposed expressions are verified by the simulations and practical measurements. Some significant findings in this paper can be drawn as follows:
(1) The proposed IWPD overpasses the WPD with the same adopted window, and its accuracy level is related to the value of
(2) According to the derived variance expression, it can be known that the frequency variance is inversely proportional to SNR, whereas it is proportional to ENBW of the adopted window.
Although the error compensation improved the accuracy of the WPD-based frequency estimations, the samples needed will be increased simultaneously. Therefore, error compensation with fewer samples can be the focus of future work.
Footnotes
Declaration of conflicting interests
The author(s) declared no potential conflicts of interest with respect to the research, authorship, and/or publication of this article.
Funding
The author(s) disclosed receipt of the following financial support for the research, authorship, and/or publication of this article: This work was supported by the Hunan Provincial Natural Science Foundation of China under Grant 2023JJ30197, and by the Changsha Natural Science Foundation under Grant kq2208057.
Data availability statement
Data sharing not applicable to this article as no datasets were generated or analyzed during the current study.