
Abstract
In actual combat, the attack of the warhead on the target is a dynamic process, and there is a significant difference in shock wave pressure between dynamic and static explosions of ammunition, while dynamic explosions are more in line with actual combat situations. Therefore, conducting research on the distribution law of dynamic explosion shock wave pressure in ammunition has more practical value for evaluating the damage power of ammunition and guiding its use. This study used the display explosion dynamics simulation software AUTODYN to conduct simulation analysis on the pressure distribution patterns of static and dynamic explosion shock waves, clarifying the differences in pressure distribution between dynamic and static explosions. Considering the factors that affect the distribution law of dynamic explosion shock wave pressure, a BP neural network based correlation prediction model for static and dynamic explosion shock wave pressure was constructed, and the prediction accuracy of the model was verified. The analysis results indicate that the pressure distribution of dynamic explosion shock waves has a significant velocity tendency; The prediction accuracy of the static and dynamic shock wave pressure correlation prediction model based on BP neural network is better than 90.7%. The research results have improved the accuracy of the calculation of dynamic explosion shock wave pressure in warheads, providing effective calculation methods and scientific data support for the calculation of dynamic explosion shock wave pressure and the evaluation of damage power.
Keywords
Introduction
In actual combat, ammunition usually explodes in high-speed motion, so dynamic explosion is closer to the real combat environment. 1 The effectiveness of dynamic explosion damage is influenced by many factors, and it is necessary to consider the coupling effect between shock waves and the ground or target in combination with the parameters of the warhead’s flight speed, attack attitude, and landing point,2–4 to accurately measure the distribution of the warhead’s dynamic explosion damage power field. However, the factors affecting the pressure distribution law of dynamic explosion shock waves and the mechanism of which each factor affects the pressure distribution law remain unclear. The testing methods for dynamic explosion shock wave pressure are severely insufficient and challenging to address in the short term. In contrast, static explosion shock wave pressure testing has the advantages of fewer influencing factors, mature testing methods, and high reliability of test results. Therefore, it becomes necessary to construct a correlation prediction model between static explosion and dynamic explosion shock wave pressure. The shock wave pressure of dynamic explosion can be estimated by inverting static explosion shock wave pressure. It can improve the acquisition rate of dynamic explosion shock wave pressure data, which provides reference and guidance for the evaluation of ammunition damage power and guiding ammunition design.5,6
To date, relevant researchers in the field of explosion damage testing have conducted partial research on the propagation law of dynamic explosion shock wave pressure of ammunition and achieved corresponding research results. For example, Li et al. 7 studied the influence of low temperature and low pressure conditions corresponding to different altitudes and their decoupling on the overpressure field of explosive shock waves of moving charges. It clarified that the range of action and the impact of overpressure of high altitude environments on explosive shock waves of moving charges mainly depend on low pressure conditions, and the impact of low temperature conditions is relatively small. Wang et al. 8 conducted numerical simulations of cylindrical charges near ground explosions with different terminal ballistic parameters using AUTODYN-3D software, analyzing the evolution process of shock waves, peak pressure, and Mach rod height. Zhou et al. 9 conducted numerical simulations of the shock wave field of aerial explosion with different propellant velocities, and clarified that the shape of the shock wave front is no longer spherical under the influence of propellant velocity. The shock wave field exhibits a phenomenon of moving along the direction of propellant velocity. Wu et al. 10 conducted high-speed imaging of the shock wave front diffusion process of ammunition warhead’s static detonation and dynamic detonation using high-speed laser shadowgraphy imaging technology. Based on the calculation model of static explosive shock wave overpressure field and the velocity vector of ammunition movement, a correlation analysis of shock wave overpressure between static and dynamic detonations was performed. Ji et al. 11 used laser high-speed photography to obtain images of initial changes in static and dynamic shock waves, and used pressure sensors to obtain and analyze partial shock wave pressure data. Clarified the impact of charge motion speed on shock wave pressure and three wave point height. Chen et al. 12 used AUTODYN to simulate and calculate the pressure field of explosion shock waves at multiple charge velocities. The results indicate that the magnitude of the overpressure peak varies sinusoidal along the azimuth angle. Jiang et al. 13 used AUTODYN to conduct numerical simulation calculations on the pressure field of air explosion shock waves of different velocity charges, and quantitatively studied the distribution characteristics of air explosion shock wave field of moving charges. The simulation results indicate that the velocity of explosives has a significant impact on the spatiotemporal distribution of the shock wave field. Tian et al. 14 proposed a testing method for the pressure distribution of dynamic explosion shock wave in the cabin, addressing issues such as uneven pressure field distribution, high-speed fragments, and uncertain detonation point location. The results indicate that the propagation of dynamic explosion shock wave in the cabin is uneven. High-energy and reflected overpressure disrupts the distribution pattern of shock wave overpressure, greatly increasing the overpressure value in the direction of explosive movement. Chang et al. 15 conducted numerical simulations of near-surface detonation processes of different propellant velocities using AUTODYN. They found that the propellant velocity has a gain effect on the peak overpressure of the ground shock wave, and this gain effect increases with the increase in propellant velocity. However, the gain effect of propellant velocity on the peak overpressure decreases gradually as the scaled distance increases.
Notably, most of the existing research on the distribution law of dynamic explosion shock wave pressure focused on testing methods. The correlation characteristics between static explosion and dynamic explosion shock wave pressure was rarely reported. Therefore, it is necessary to research the correlation prediction model between static and dynamic explosion shock wave pressures, in order to solve the problems of low reliability and poor calculation accuracy of dynamic explosion shock wave pressure test results.
This study used display explosion dynamics simulation software to establish a finite element simulation model for the pressure distribution of static and dynamic explosion shock waves. The static explosion shock wave pressure of typical TNT explosives was simulated and analyzed. The dynamic explosion shock wave pressure distribution law of explosives with motion speeds of 421 and 675 m/s was simulated, and the differences in the pressure distribution law of static and dynamic explosion shock waves were compared and analyzed. Taking into account the factors that affect the distribution of dynamic explosion shock wave pressure, a correlation prediction model for static and dynamic explosion shock wave pressure was constructed based on BP neural network. The prediction accuracy of the model was tested using experimental test data.
Numerical simulation model for the distribution pattern of static and dynamic explosive shock wave pressures
The finite element simulation model of explosion shock wave pressure propagation established using AUTODYN, which mainly includes three parts: air, sand, and TNT explosives. The structural size of the air domain model is 2000 × 20,000× 6000 mm (Long × Wide × High). To simulate the semi-infinite air domain in the actual explosion of ammunition, the boundary conditions of all surfaces except for the ground are set as pressure outflow, that is, no pressure reflection occurs. The air model mesh type is Euler, and the mesh size is 2 × 2 mm; The ground material is sand, and the size of the sand model structure is 2000 × 20,000 × 2000 mm (Long × Wide × High), the sand model mesh type is Lagrange, and the mesh size is 2 × 2 mm; The boundary conditions at the interface between sand and air are set as fluid solid coupling to simulate the reflection of shock waves when colliding with the ground; The mass of TNT explosive is 9.53–27.53 kg, and simulation is conducted every 2 kg. The aspect ratio of the explosive is 1:1, and the initiation method is the center point initiation. TNT explosive is added to the air by filling. Set a pressure monitoring point every 1 m from the center of the explosion and a column of pressure monitoring points every 30° counterclockwise, with the positive direction of the x-axis as the positive direction of the explosive movement speed. The established finite element simulation model for the propagation law of explosion shock wave pressure is shown in Figure 1, where 1–70 is the set pressure monitoring point. The projection results of the pressure monitoring point positions are shown in Figure 2.
Finite element numerical simulation model.
Pressure monitoring points location.
In the above simulation model, air is an ideal gas (with ambient temperature of 15°C and altitude of 0 m), described using the Ideal Gas state equation, as shown in equation (1).16,17

In equation (1),
Parameters of the ideal gas state equation.
The TNT explosive explosion process is described by JWL state equation as follows20,21:
where P is the pressure; V is the volume; E is internal energy; A and B are material parameters; R1, R2 and
JWL state equation parameters.
Analysis of pressure distribution patterns for shock waves under static and dynamic explosion
Use the finite element simulation model established above to conduct simulation analysis on the pressure distribution laws of static and dynamic explosion shock waves under different explosion conditions. Due to the high mass and charge velocity of simulated TNT explosives, the obtained shock wave pressure data cannot be displayed one by one. Select static explosion shock wave pressure curves with TNT explosives weighing 9.53 and 11.53 kg, charging velocities of 0, 421, and 675 m/s, measuring point azimuth angle of 0°, and measuring point explosion center distance of 1–6 m, and dynamic explosion shock wave pressure curves with measuring point explosion center distance of 1–10 m for display. The shock wave pressure curves are shown in the following Figures 3 to 5.
Static explosion shock wave pressure curve: (a) 9.53 kg and (b) 11.53 kg.
9.53 kg TNT dynamic explosion shock wave pressure curve: (a) 421 m/s and (b) 675 m/s.
11.53 kg TNT dynamic explosion shock wave pressure curve: (a) 421 m/s and (b) 675 m/s.
Extracted the pressure peaks of static and dynamic detonation shock waves at different TNT explosive masses and measurement points, and plotted the pressure peak histogram as shown in Figures 6 to 9.
9.53 kg TNT static explosion shock wave pressure peak histogram.
11.53 kg TNT static explosion shock wave pressure peak histogram.
9.53 kg TNT dynamic explosion shock wave pressure peak histogram (V = 421 m/s).
9.53 kg TNT dynamic explosion shock wave pressure peak histogram (V = 657 m/s).
Analyzing the variation law of peak pressure of static and dynamic detonation shock waves, it can be observed that for static detonation, the shock wave pressure front propagates outward in an approximately spherical shape. Therefore, the distribution of shock wave pressure from static detonation is relatively uniform in all directions. The difference in peak pressure of the shock wave at the same distance but different orientations from the detonation point is small and can be approximated as equal. The evolution cloud diagrams of static explosion shock wave pressure at different explosion times are shown in the following Figure 10.
Cloud diagrams of static explosion shock wave pressure evolution: (a) 0.06 ms, (b) 0.11 ms, (c) 0.13 ms and (d) 0.17 ms.
For dynamic explosions, the shock wave wavefront no longer propagates outward in the form of a sphere due to the movement of TNT explosives. Instead, it expands outward in the shape of an ellipsoid. When measurement points are distributed within an angle of 0°–90° with respect to the direction of TNT explosive movement, the peak pressure of the dynamic detonation shock wave under the same mass of TNT explosive is greater than that of the static detonation shock wave, indicating that the velocity of the explosive enhances the peak shock wave pressure. When the measurement points are distributed within an angle of 90°–180° with respect to the direction of TNT explosive movement, the peak pressure of the dynamic detonation shock wave under the same mass of TNT explosive is less than that of the static detonation shock wave, indicating that the velocity of the explosive attenuates the peak shock wave pressure. As the velocity of the TNT explosive increases, the peak pressure of the measurement points within the 0°–90° range gradually increases, while the peak pressure of the measurement points within the 90°–180° range gradually decreases. Therefore, it can be concluded that the effect of explosive velocity on shockwave pressure is region-specific and does not show a uniform trend of either growth or decay at all measurement point locations.
To quantitatively analyze the impact of TNT explosive velocity on the propagation of shockwave pressure, based on the static explosion shock wave pressure peak value, the relative change rate
Shock wave pressure peak relative change rate: (a) 9.53 kg TNT (V = 421 m/s), (b) 9.53 kg TNT (V = 675 m/s),(c) 11.53 kg TNT (V = 421 m/s), and (d) 11.53 kg TNT (V = 675 m/s).
Analysis of the shock wave pressure peak relative change rate, the relative change rate of the dynamic blast shock wave peak pressure in the
Predictive model for the relationship between static and dynamic explosion shock wave pressures
Static and dynamic explosion shock wave pressure function correlation expressions
In shock wave pressure testing, the static explosive shock wave pressure at the same distance from the detonation center primarily depends on the mass of the TNT explosive. The testing methods and conditions for static explosion shock wave pressure are relatively mature, and the testing results for static explosion shock wave pressure of ammunition have high credibility.10,24 In comparison to static explosions, there are many factors that influence the propagation characteristics of shockwave pressure in dynamic explosions. The mechanisms by which these factors affect the distribution pattern of shockwave pressure are not yet clear, resulting in lower reliability of testing methods and results for dynamic explosive shockwave pressure. As a result, the obtained dynamic explosive shockwave pressure data cannot be effectively used for evaluating the destructive power of ammunition explosions. 11 Therefore, it is necessary to study the correlation between the shock wave pressure of static and dynamic explosions, to calculate the shock wave pressure of dynamic explosions based on the shock wave pressure of static explosions. This will help improve the acquisition rate of dynamic explosive shock wave pressure data.
When analyzing the dynamic explosion shock wave pressure distribution law, the relevant factors affecting the dynamic explosion shock wave pressure distribution law are comprehensively considered and taken as the independent variable
The above equation
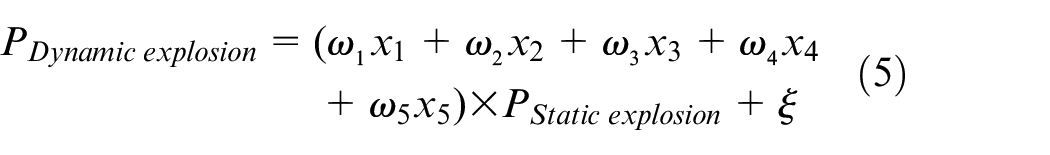
In practical use, to obtain the function expression with high calculation accuracy, it is necessary to fit and modify the aforementioned function relationship using a large amount of finite element simulation data and measured data. By adjusting the correlation coefficients and correction coefficients in equation (5) multiple times, a correlation prediction model that meets the requirements of practical engineering calculation accuracy can be obtained.
Assuming there are a total of n sets of dynamic and static shock wave pressure data, with pressure peaks of
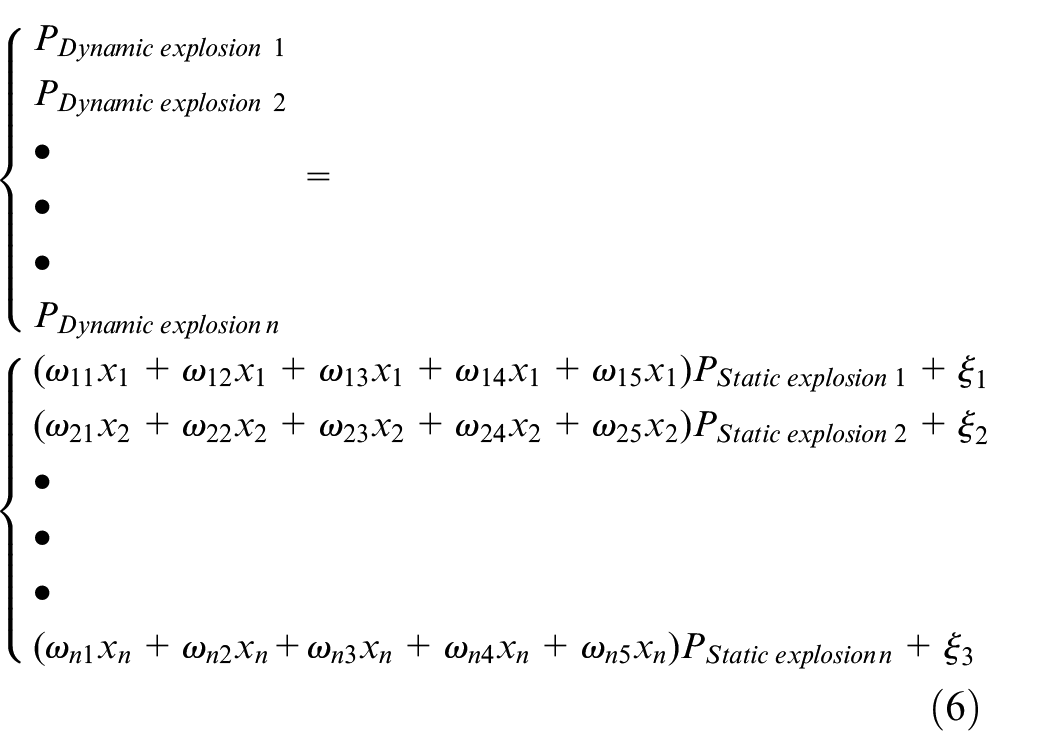
In actual engineering testing, the pressure data of dynamic and static explosion shock waves obtained under different explosion conditions are uniquely determined, and the functional relationship in equation (6) is also uniquely determined. Therefore, the corresponding relationship between the peak pressure of dynamic and static explosion shock waves can be characterized by the correlation coefficients
Predictive model for static and dynamic explosion shock wave pressures based on BP neural network
Based on the established mathematical models for the pressure correlation between static and dynamic explosion shock waves, it can be concluded that based on the static explosion shock wave pressure, considering the factors that affect the distribution of dynamic explosion shock wave pressure, establishing a correlation coefficient matrix
BP neural network has strong self-learning and adaptive capabilities, and its basic mathematical expression is highly consistent with the above equation (6). Therefore, BP neural network is used in this study to establish static and dynamic explosion shock wave pressure prediction models. The basic structure of BP neural network is shown in Figure 12. 12
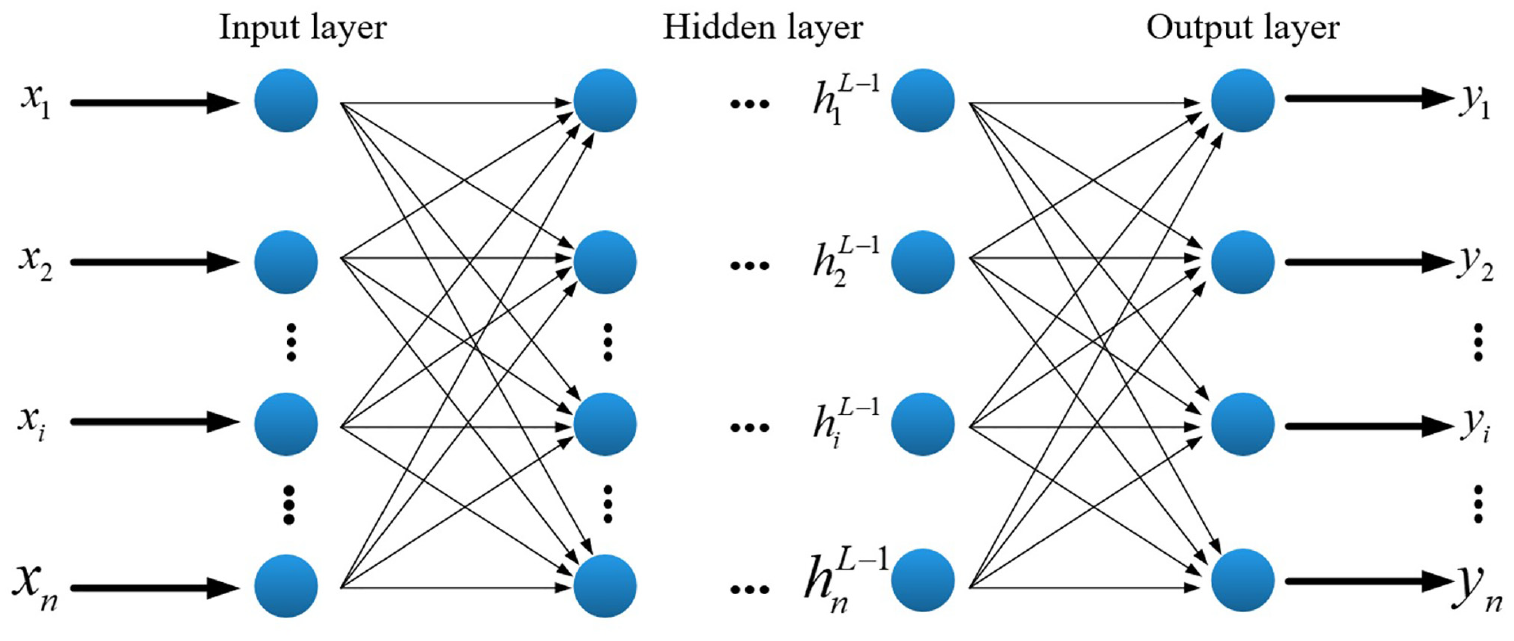
BP neural network basic structure.
According to relevant records, when a neural network model has an input layer, a hidden layer, and an output layer with a linear activation function, the network model can theoretically approximate any rational function. As the number of hidden layers increases, the extraction of data features will also be more accurate. However, as the number of layers in the network model increases, it will lead to a complex model structure that is not easy to operate, and an increase in the number of layers will lead to problems such as prolonged model training time and computational power consumption. Based on equation (6) and combined with the distribution characteristics of static and dynamic shock wave pressure data, the BP neural network model is set up with three layers, namely an input layer, a hidden layer, and an output layer. According to the above analysis, the factors that affect the distribution of dynamic explosion shock wave pressure are five factors: TNT charge quality, blast center distance, measurement point angle, ammunition movement speed, and ammunition attack angle. Therefore, the number of input layer neurons is set to 5; The final output of the model is the dynamic explosion shock wave pressure value, therefore, the number of neurons in the output layer is set to 1; There is currently no definite calculation method for the number of neurons in the middle hidden layer. The number of neurons in the hidden layer is too small to perform good feature extraction on the input sample data, and the corresponding relationship between the data and the data cannot be learned to the maximum extent, resulting in a large output error of the neural network model and a prediction result that does not meet the actual requirements. That is, the learning state of the neural network model is “underfitting,” and the generalization of the neural network is poor at this time; If there are too many neurons in the hidden layer, it will extract too many features from the sample data, and extract and memorize the features that do not belong to the sample data, that is, record the noise signal. This situation is called “overfitting” of the neural network model. At this time, the neural network has poor generalization due to learning too many unnecessary features, and cannot predict the actual measured values using such a neural network model. Therefore, it can be concluded that the number of hidden layer neurons in a neural network model has a significant impact on the prediction accuracy of the model. The number of hidden layer neurons in initial training can be calculated according to equation (7).

In equation (7), m is the number of hidden layer neurons, n is the number of input layer neurons, a is the number of output layer neurons, and a is the empirical value. Usually, a constant between 10 and 20 is sufficient. In this study, the number of neurons in the input layer is 5, and the number of nodes in the output layer is 1, a taken as 17, so the number of neurons in the hidden layer is 20.
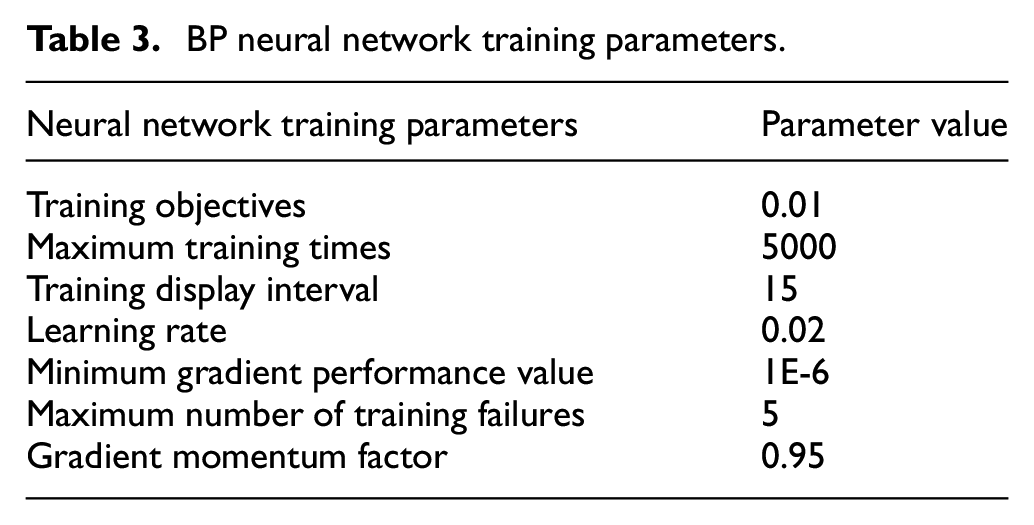
The type of transfer function from input layer to hidden layer and from hidden layer to output layer directly affects the predictive performance of neural networks. The purelin function enables neurons to learn linear relationships, while the trainbr function uses Bayesian regularization algorithm to train neural networks, which can improve their generalization ability. Based on the corresponding relationship between static and dynamic shock wave pressure data, using the purelin function as the transfer function from the input layer to the hidden layer, and the trainbr function as the transfer function from the hidden layer to the output layer can make the constructed neural network model have strong generalization, thereby improving the prediction accuracy of the neural network.25–27 The remaining parameter values in the neural network model are listed in Table 3.
BP neural network training parameters.
The BP neural network model built above is used to train the existing static explosion and dynamic explosion shock wave pressure data. The training results are shown in the following Figure 13.
BP neural network training results: (a) training error descent gradient, (b) training data fitting error, and (c) data consistency check.
According to the gradient graph of training error descent, when the training frequency is 222, the training error reaches the set value, as shown in Figure 13(a). Analysis of the gradient graph of training error descent shows that the downward trend of this curve is not smooth. By analyzing the structure of the network model and the training dataset, it was found that the main reason for the unsmooth curve was the presence of outliers in the training dataset, which led to significant errors in the neural network’s processing of these unexpected data, leading to an unsmooth error reduction curve. As shown in Figure 13(b), there is a significant difference in the fitting relative error of the neural network model with different training data. This is due to the fact that during experimental testing, warhead explosions generate a large number of high-speed flying fragments, which can hit pressure sensors and sensor mounting plates, resulting in inaccurate collected shock wave pressure signals and introducing abnormal results, leading to intermittent jumps at outliers during neural network training. The sum of squares of the relative errors between the training data and the prediction data of the BP neural network is 0.98465. The training data is evenly distributed on both sides of the BP neural network prediction results, indicating that the established neural network model has strong explanatory power for the training data, as shown in Figure 13(c). From this, it can be seen that the BP neural network model constructed in this study can well reflect the correlation between static explosion and dynamic explosion shock wave pressure.
To evaluate the advantages and disadvantages of the constructed BP neural network model, it is necessary to analyze the model’s generalization. Model generalization needs to be analyzed from the complexity of network structure and the size of the dataset. The BP neural network model established in this study has a three-layer structure, which is not complex and does not cause overfitting during the data fitting process; There is a significant correspondence between input data and output data, with a large dynamic range of data distribution, which helps to reduce the model’s over learning of noise and outliers; The selection of transfer functions from input layer to hidden layer and from hidden layer to output layer is based on the pressure distribution laws of static and dynamic explosion shock waves. The purelin function and trainbr function are selected to minimize the error between the network output results and the expected results, thereby improving the model’s generalization ability. Increasing the training data size of the model can quickly and efficiently improve its generalization ability. Therefore, in subsequent research, it is necessary to accumulate relevant static and dynamic shock wave pressure data, increase the size of the training dataset, and improve the generalization of the constructed model.
BP neural network prediction model prediction accuracy test
To verify the prediction accuracy of the BP neural network correlation prediction model constructed above, we carried out a typical high-energy warhead explosion shock wave pressure test. The high-energy warhead equivalent TNT mass is 29.53 kg, and the ammunition movement speed is 0 m/s (static explosion) and 421 m/s (dynamic explosion) respectively. The explosion shock wave pressure measurement system is used to obtain the distribution data of the shock wave pressure propagation generated during the ammunition explosion. The shock wave pressure measurement system includes a high-precision piezoelectric pressure sensor produced by the American PCB company, a 32 channel data collector produced by the Swiss ELSYS company.18,28 The data collector is connected to the high-precision synchronous starting controller developed by Nanjing University of Science and Technology, providing a unified trigger time benchmark for the 32 channels of the data acquisition system. The explosion field shock wave pressure measurement system is shown in Figure 14.
Shock wave pressure measurement system.
In the above blast shock wave pressure measurement system, the linearity of the surface reflection pressure sensor is ±1% FSO, the frequency response is ≥500 kHz, and the resolution is 0.001 psi. TranNET 308S data collector can realize data acquisition of 32 channels at a sampling rate of 1 MS/s at the same time, the working bandwidth is ≥4 MHz, the input noise (sampling rate 1 MS/s) is less than 0.03 mVrms, and the resolution is 14bits. The high-precision synchronous control trigger can output a square wave pulse signal of ±5 v. Taking the warhead explosion time as the time reference, the synchronization time accuracy of each channel’s output signal is less than 1 μs. The data collector and the terminal computer are connected by a gigabit network cable, and the delay in the data transmission process between the two is negligible.
In actual experimental process, for static explosion, the ammunition is placed stationary on the ammunition rack, and the electric detonator is used to trigger the explosion. Pressure sensors and measurement system are arranged in a certain range around the explosive center to obtain the distribution pattern of static explosion shock wave pressure. The installation structure for static explosion of ammunition is shown in Figure 15(a). For dynamic explosion, the projectile is fired from the cannon to give it a velocity of 421 m/s, and it will hit the target triggering the front fuse to detonate the warhead. Pressure sensors and measurement system are deployed behind the target to obtain the distribution pattern of shock wave pressure during the dynamic explosion of ammunition. The structure schematic diagram for firing projectiles from cannon is shown in Figure 15(b). 29
Ammunition static explosion and dynamic explosion structure schematic diagram: (a) ammunition static explosion installation structure and (b) artillery launched projectile structure diagram.
During the actual test, the horizontal distance between the measuring point and the vertical projection point of the explosion center is 1–5 m, and the measuring point azimuth angle is 0°–180°. The peak values of static explosion and dynamic explosion shock wave pressure of ammunition obtained by using the above constructed shock wave pressure measurement system are shown in Figure 16.
Peak pressure of static and dynamic explosion shock wave: (a) static explosion shock wave pressure peak and (b) dynamic explosion shock wave pressure peak (V = 421 m/s).
Input the obtained static and dynamic shock wave pressure peaks and explosion parameters into the trained static and dynamic shock wave pressure correlation prediction model, and obtain the dynamic shock wave pressure peak calculated by the correlation prediction model as shown in Figure 17.
Shock wave pressure peak prediction by correlation prediction model.
From the calculation results of the BP neural network prediction model mentioned above, it can be seen that at the same measurement line azimuth angle, the closer it is to the explosion center, the larger the peak value of the shock wave pressure calculated by the model. As the distance between the explosion center at the measurement point increases, the peak value of the shock wave pressure gradually decreases. The model calculation results conform to the attenuation law of shock wave pressure propagation in the explosion field. At different azimuth angles of the measuring line, the peak pressure of the dynamic explosion shock wave obtained from the 30° measuring line is the highest, and the peak pressure of the dynamic explosion shock wave obtained from the 180° measuring line is the lowest. The model calculation results are consistent with the measured results and the theoretical analysis results mentioned above, which can significantly distinguish the influence of the charge motion speed on the distribution law of the shock wave pressure. However, there are certain differences in the peak shock wave pressure at different measurement points.
To compare the relative error rate between the peak pressure of the dynamic explosion shock wave calculated by the correlation prediction model and the measured peak pressure of the dynamic explosion shock wave, the relative error rate of peak pressure at different measurement point positions is calculated according to equation (8). The relative error rate of peak pressure at different measurement point positions is shown in Figure 18.
Relative error rate of dynamic explosion shock wave pressure peak value at different measuring points.
According to the analysis of the shock wave pressure peak value relative error rate histogram, the peak value minimum relative error rate of the dynamic explosion shock wave pressure calculated by the correlation prediction model occurs when the distance between the measuring point and the explosion center is 4 m, the measuring point azimuth angle is 150°, resulting in a minimum relative error rate of 0.286%; The maximum relative error rate occurs when the measurement point is 2 m away from the blast center with an azimuth angle of 30°, reaching 9.232%. The relative error rates of peak pressure at other measurement point positions fall between these two extremes. Therefore, the prediction accuracy of the above BP neural network based correlation prediction model for static and dynamic explosion shock wave pressure is better than 90.7%. This model’s calculation accuracy far surpasses the existing function relationship models for calculating the peak pressure of dynamic explosive shockwaves. It can provide reliable data support for studying the distribution pattern of dynamic explosive shockwave pressure.
Conclusions
This study employed to perform finite element simulation analysis on the distribution pattern of shock wave pressure propagation for static and dynamic explosions, clarifying the influence of the explosive motion state on the distribution pattern of shock wave pressure. By taking into account various factors that affect the distribution pattern of dynamic explosion shock wave pressure, a correlation predictive model between static and dynamic explosion shock wave pressures was constructed based on BP neural network. The accuracy of the correlation predictive model was validated using measured data. The research results demonstrate that:
(1) There are significant differences between static explosion and dynamic explosion shock wave pressure distribution. The shock wave pressure distribution of static explosion is approximately spherical, while that of dynamic explosion is ellipsoidal. Specifically, in the area where the angle with the explosive velocity positive direction is
(2) Taking into account the influence of TNT explosives quality, distance between measuring points and explosion center, measuring point azimuth, and explosive movement speed on the pressure distribution of the dynamic shock wave, a static-dynamic shock wave pressure correlation prediction model was constructed based on BP neural network. The result of verified test data shows that the prediction accuracy of the model is better than 90.7%, which significantly improves the computational accuracy of the pressure distribution law of dynamic shock waves.
The research findings clarify the distribution laws of static and dynamic shock wave pressure and establishes a static-dynamic shock wave pressure correlation prediction model constructed based on BP neural network. It provides a novel and highly accurate computational method for the distribution laws of dynamic shock waves pressure. This study offers scientific and reliable theoretical and data support for evaluating the destructive power of ammunition dynamic shock wave pressure, indicating strong military application value.
Footnotes
Declaration of conflicting interests
The author(s) declared no potential conflicts of interest with respect to the research, authorship, and/or publication of this article.
Funding
The author(s) received no financial support for the research, authorship, and/or publication of this article.
Data availability statement
All data that support the findings of this study are included within the article (and any supplementary files).