
Abstract
Petroleum refineries are one of the main sources of hazardous air pollutants, so the accurate determination of petroleum pollutants is of great significance to maintain ecological balance. In this study, three-dimensional (3D) fluorescence spectroscopy combined with pattern recognition algorithm is adopted to distinguish the composition and content of oil pollutants efficiently and accurately. Three hundred samples of kerosene, diesel, and gasoline mixed solutions with different concentrations are prepared. The principal component analysis is used to extract the optimal feature variables, and the correlation coefficient method is used to obtain eight groups of principal component features in the spectra. The dimension is selected as 8, and the principal component score is calculated, which is used as the input data of the extension neural network. Next, the pattern recognition method is improved, and the designed neural network has functions of both resolution and measurement. The results of neural network pattern recognition are used as the input of the concentration network. The first 270 samples are used as the training samples to train the network model, and the remaining 30 samples are used as test samples, which are applied to the input layer of the trained neural network. The relative fluorescence intensity, relative slope, and comprehensive background parameters are used as the input parameters, and the extension neural network is used for pattern recognition and evaluation of oil pollutants. The experimental results show that the average recognition rate of the improved pattern recognition algorithm for oil pollutants is 98.43%, and the average recovery rate of concentration is 98.67%. Further, the average time for pattern recognition is 1.53 s, while the parallel factor analysis algorithm takes 2.89 s. This suggests that the improved extension neural network is an effective and reliable pattern recognition method for the identification of mixed oil pollutants.
Keywords
Introduction
Oil pollution causes significant harm to the human health, environment, and local ecosystems. The main oil pollutants are the wastewater discharged from factories and offshore oil leakage, which cause severe water pollution.1–3 Therefore, the accurate and efficient detection of the composition and content of oil pollutants is of great significance to maintain the ecological balance. Fluorescence spectroscopy is a sensitive technique with high measurement accuracy, which usually requires small concentration of experimental samples. It has been extensively applied for the detection of fluorescent substances such as oil pollutants, pesticides, food, etc.4–7 The aromatic components in pollutants such as gasoline and diesel have strong fluorescence characteristics under ultraviolet light excitation.8–11 The three-dimensional (3D) fluorescence spectrum reflects the simultaneous change in fluorescence intensity with the excitation and emission wavelengths, and it essentially represents the continuous distribution of energy in a two-dimensional (2D) region.12–14 Compared with the traditional 2D fluorescence spectroscopy, the 3D fluorescence spectroscopy provides more comprehensive information and has strong recognition ability, which is suitable for the detection of multi-component fluorescent substances.15–18 Traditional pattern recognition methods have poor detection accuracy and low speed. In the recent years, several scholars have extracted the characteristic parameters of fluorescence spectrum and applied statistical indicators such as origin moment and kurtosis coefficient for the spectral analysis,19–21 which can only reflect the overall characteristics of 3D fluorescence spectrum.
Wang et al. 22 used the back propagation (BP) neural network combined with alternating trilinear decomposition (ATLD) and 3D fluorescence spectroscopy to examine the composition and content of fluorescent substances. The results showed that the BP neural network has good data compression effect, and this method can be extended for the qualitative/quantitative analysis and rapid detection of trace polycyclic aromatic hydrocarbons (PAHs) in water. Azcarate et al. 23 used front-face fluorescence spectroscopy for the non-destructive evaluation of mayonnaise samples stored at two different temperatures. The results confirmed that the excitation-emission matrices (EEMs) in combination with N-way partial least square discriminant analysis (NPLS-DA) provide information related to the mayonnaise fluorescent molecular structure, facilitating the classification of samples as a function of the storage time. Wu et al. 24 applied total synchronous fluorescence (TSyF) spectroscopy and convolutional neural networks (CNNs) to identify and quantify counterfeit vegetable oils. The results confirmed the feasibility of this method for vegetable oil identification. Catena et al. 25 used the second-order calibration of EEMs and parallel factor analysis (PARAFAC) decomposition as an analytical approach for the detection of PAHs in food matrix (smoked tuna). The experimental results showed that the PAHs were clearly identified and quantified with decision limit (CCα) and capability of detection (CCβ) equal to 0.11 and 0.21 µg/L, respectively, for benzo[a]pyrene (BaP). Lenhardt et al. 26 used fluorescence spectroscopy coupled with PARAFAC and partial least squares discriminant analysis (PLS DA) for the characterization and classification of honey. The number of fluorophores present in honey, excitation and emission spectra of each fluorophore, and their relative concentration were determined using a six-component PARAFAC model. The PLS DA classification model, constructed from PARAFAC model scores, detected fake honey samples with 100% sensitivity and specificity. The honey samples were also classified using PLS DA with errors of 0.5% for linden, 10% for acacia, and nearly 20% for both sunflower and meadow mix.
In this study, three-dimensional (3D) fluorescence spectroscopy combined with pattern recognition algorithm is adopted to distinguish the composition and content of oil pollutants efficiently and accurately. Three hundred samples of kerosene, diesel, and gasoline mixed solutions with different concentrations are prepared. The first 270 samples are used as the training samples to train the network model, and the remaining 30 samples are used as test samples, which are applied to the input layer of the trained neural network.The principal component analysis is used to extract the optimal feature variables, and the correlation coefficient method is used to obtain eight groups of principal component features in the spectra. The dimension is selected as 8, and the principal component score is calculated, which is used as the input data of the extension neural network. Next, the pattern recognition method is improved, and the designed neural network has functions of both resolution and measurement. The results of neural network pattern recognition are used as the input of the concentration network.The relative fluorescence intensity, relative slope, and comprehensive background parameters are used as the input parameters, and the extension neural network is used for pattern recognition and evaluation of oil pollutants. The experimental results show that the average recognition rate of the improved pattern recognition algorithm for oil pollutants is 98.43%, and the average recovery rate of concentration is 98.67%. Further, the average time for pattern recognition is 1.53 s, while the parallel factor analysis algorithm takes 2.89 s. The experimental results show that 3D fluorescence spectroscopy combined with the extension neural network as the pattern recognition method is a reliable method for detecting oil pollutants.
Theory
Principle of principal component analysis
Principal component analysis (PCA) is a statistical method that uses orthogonal transformation to convert a set of possibly correlated variables into a set of values of linear variables, called principal components. Specifically, the fewer new variables are a linear combination of the original variables, which retain as much original statistical information as possible.27–29 From a mathematical point of view, PCA is a data dimensionality reduction technique that maps the high-dimensional data into lower dimensions.30,31
Based on the idea of dimensionality reduction, many original variables
The specific steps of PCA are as follows:
Standardize the original data, that is, subtract each variable by the mean value and then divide it by the standard deviation to eliminate the effect of dimension.
Calculate the correlation coefficient matrix
Calculate the eigenvalues and eigenvectors of the correlation coefficient matrix R to determine the number of principal components. Firstly, the characteristic equation
Select the appropriate number of principal components for final analysis.
The standardized fluorescence spectrum data of each sample to be tested are used to obtain the principal components, and the scores of each principal component of each sample
Pattern recognition based on extension neural network
The standard
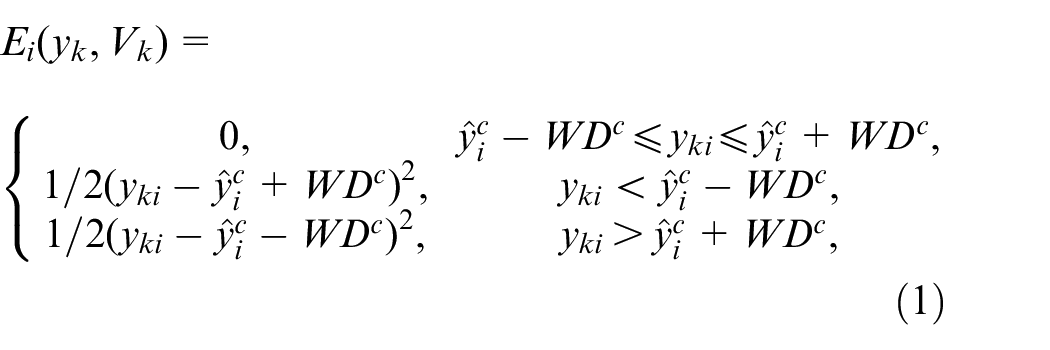
The learning algorithm of the extension neural network model is based on the principle of BP error. The expected output region
Three-dimensional data and second-order calibration
A three-dimensional spectral image consisting of emission wavelength and excitation wavelength as X-axis, Y-axis and fluorescence intensity as Z-axis is called a three-dimensional fluorescence spectrum (EEM, Excitation-Emission Matrix). The three-dimensional fluorescence spectrum mainly reflects the shape of the fluorescence spectrum of the substance and the gradient of the fluorescence intensity from the macroscopic aspect. It is a three-dimensional characteristic curve that can simultaneously obtain the fluorescence intensity and excitation and emission wavelength changes. The fingerprint can quickly and accurately determine the fluorescence intensity corresponding to the specific excitation-emission wavelength, and Rayleigh scattering and Raman scattering can also be easily distinguished in the fingerprint. Accurately Locating the Optimum Emission Wavelength of Matter by Emission Spectra. The excitation spectra accurately determines the optimal excitation wavelength of the substance.
Three-dimensional fluorescence spectroscopy has become a hot choice for many researchers to detect petroleum pollutants due to its high sensitivity, good selectivity, rich information content and non-destructive material structure. Compared with the two-dimensional spectrum, the three-dimensional spectrum can more completely reflect all the spectral information contained in the mineral oil spectrum, which enables the three-dimensional fluorescence analysis method to better realize the qualitative and quantitative analysis of the substance.
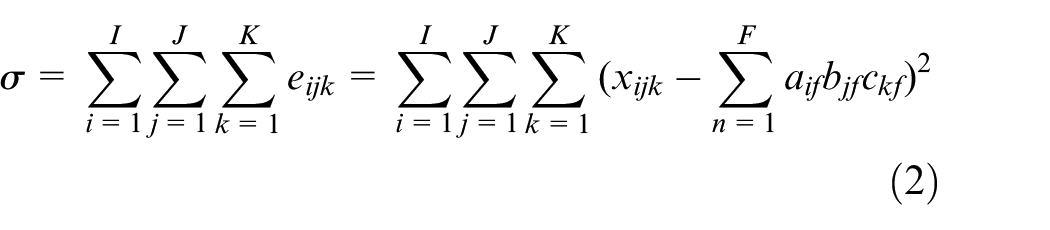
With the development of sophisticated instruments, the understanding of the 3D data is gradually becoming mature, and the 3D data and second-order calibration method are increasingly applied for the analysis of complex chemical systems. A data matrix can be generated by a single measurement on an analytical sample, and a set of matrices can be obtained by simultaneously or sequentially measuring a number of analytical samples. Thus, a 3D data matrix can be obtained by combining multiple matrices. The second-order correction method is a method for analyzing a 3D data matrix. Tucker
35
proposed the three-mode PCA model (called the Tucker3 model) for the processing of 3D data matrix. Its essence is to decompose the 3D data matrix
where
Experiment
The Hitachi F-7000 fluorescence spectrometer has been adopted as an experimental instrument, which can quickly complete 3D spectral scanning. The voltage of photomultiplier (PMT) was 400 V, the scanning rate was 12,000 nm/min, the scanning step was 5 nm, the incident slit was 10 nm, and the exit slit was 10 nm. The excitation wavelength range was 250–400 nm, and the emission wavelength range was 270–500 nm. The starting point of the emission scanning wavelength is always 20 nm behind the excitation wavelength to fully avoid the interference of Rayleigh scattering spectrum. The algorithm is implemented on MATLAB8.0 and above.
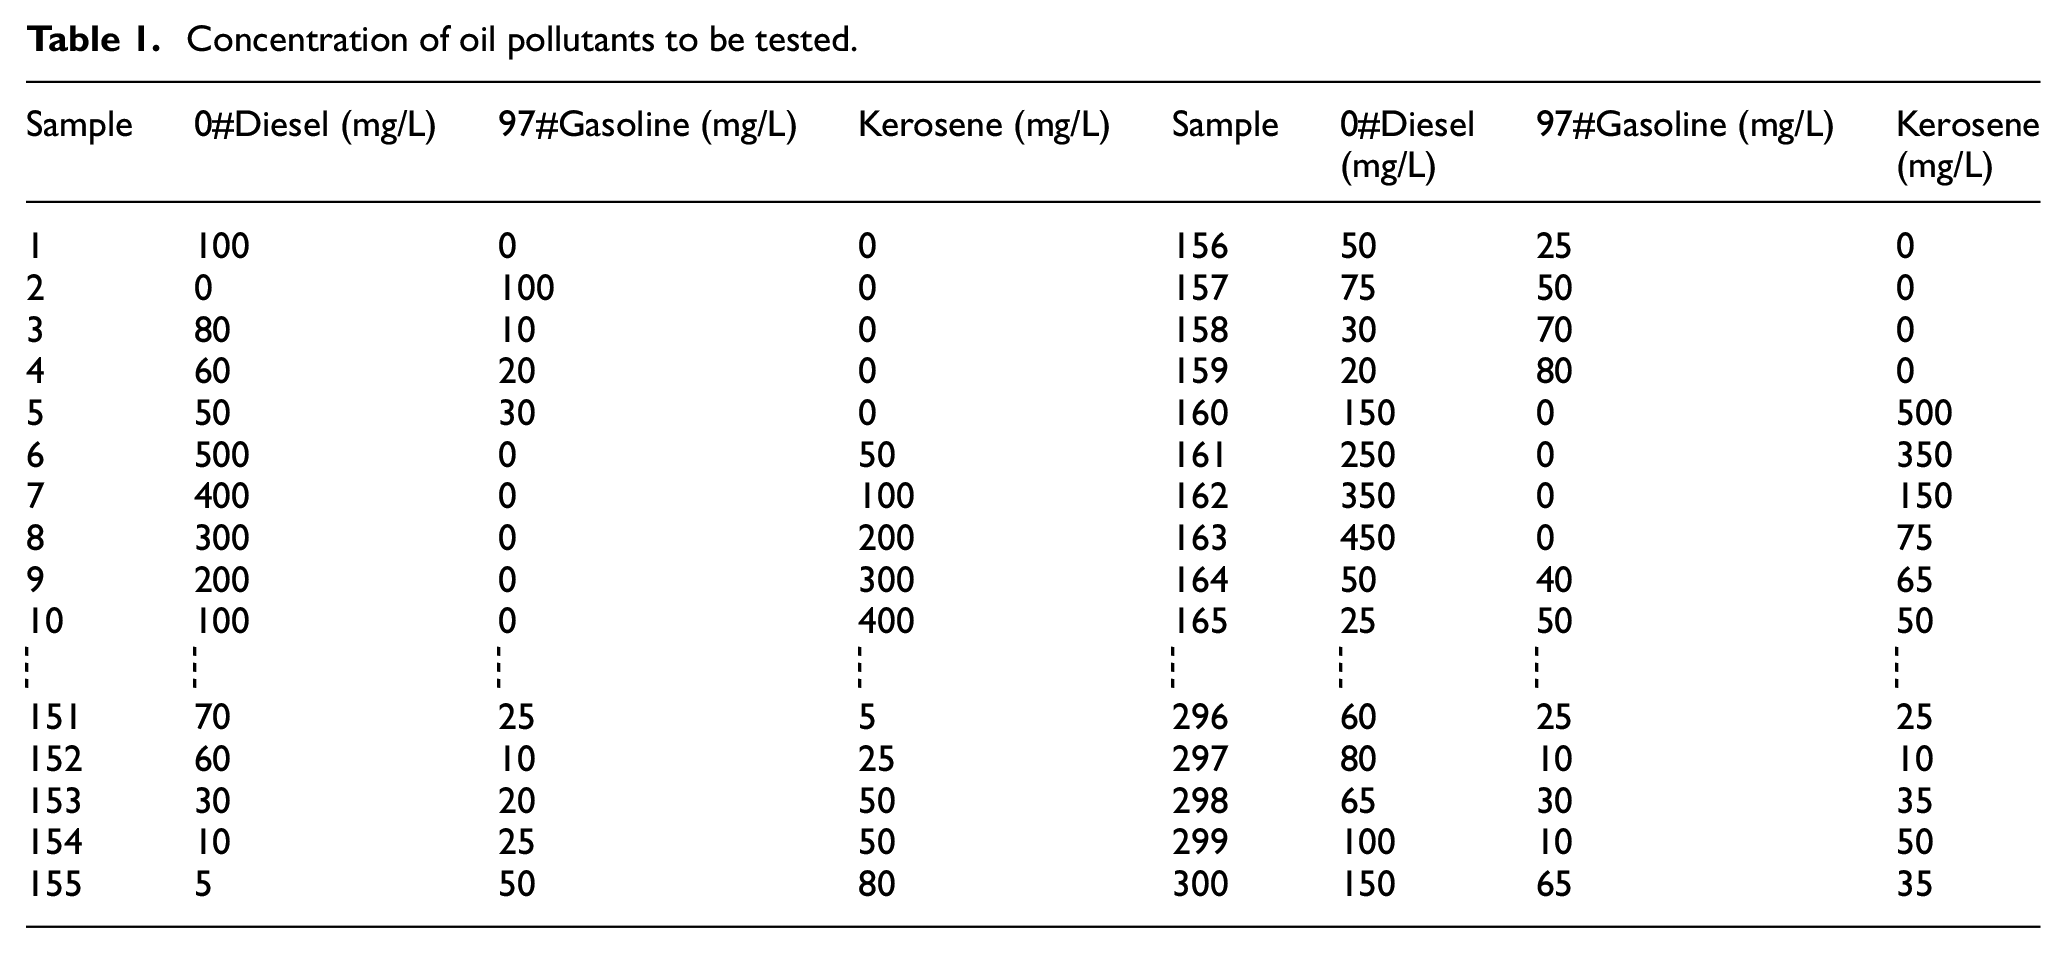
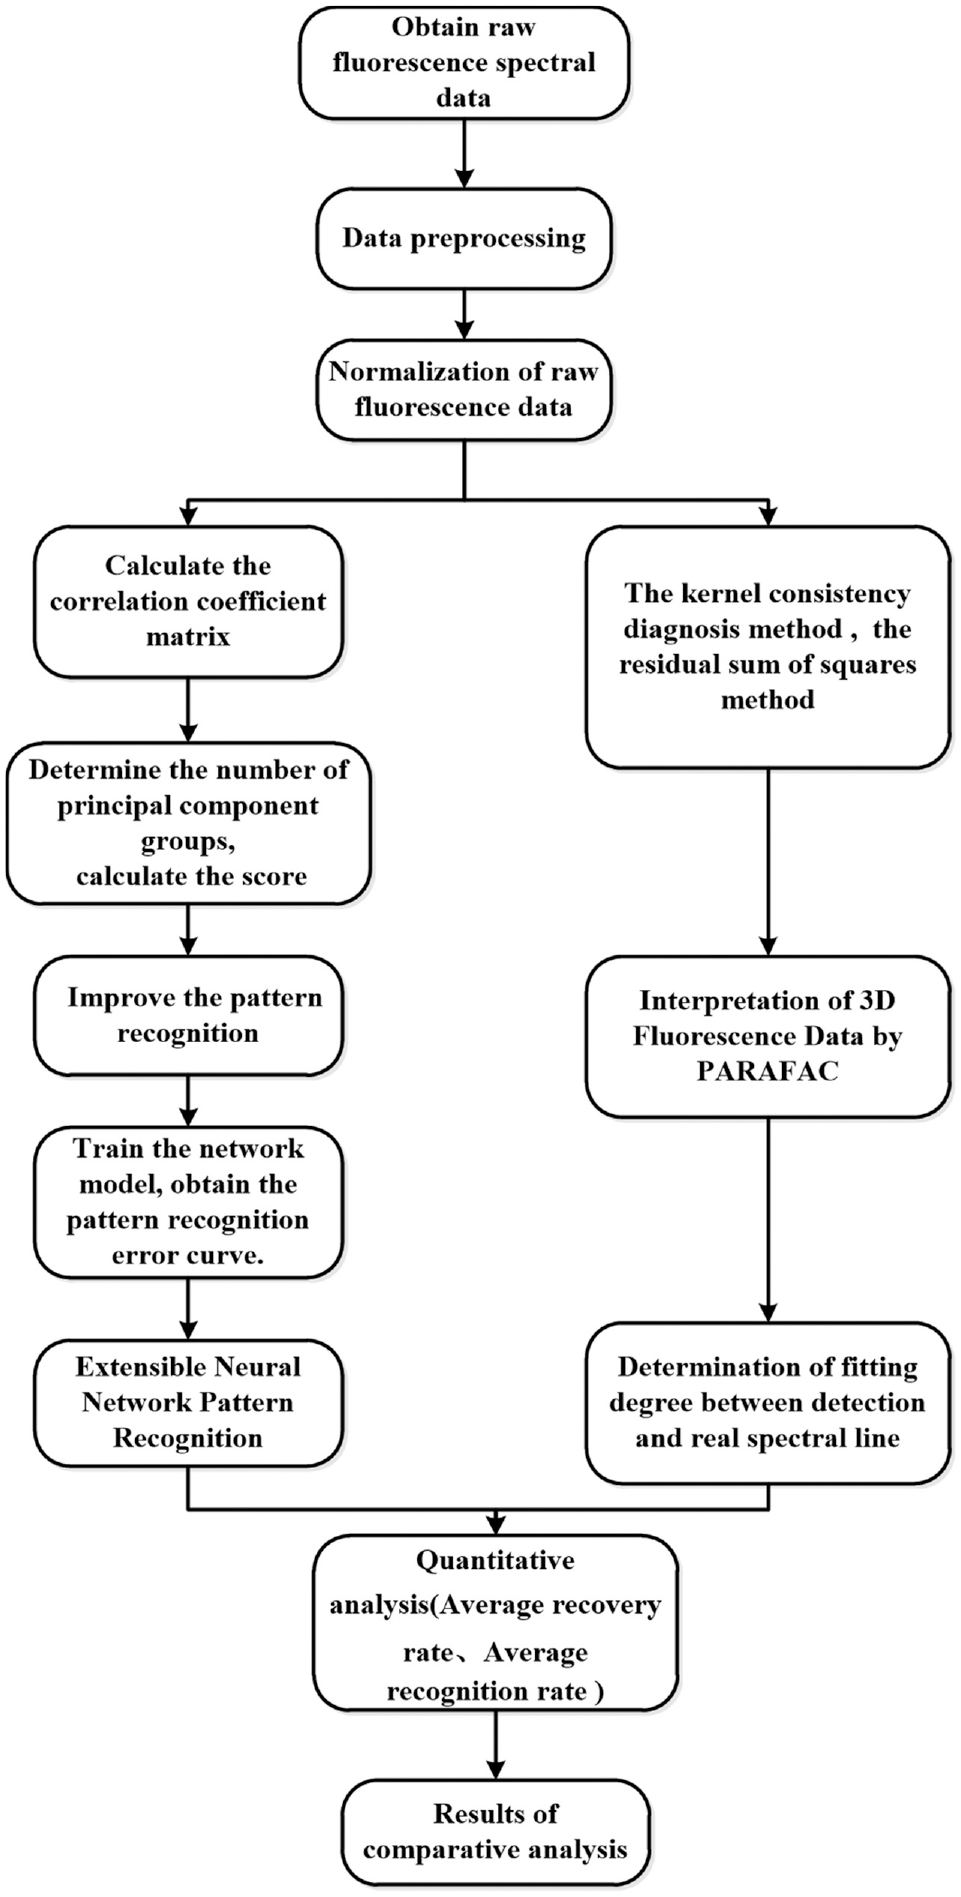
A solution of carbon tetrachloride and oil pollutants was prepared. The ratio of the oil substance and the carbon tetrachloride was 1:1000, which was used to gradually dilute 300 samples with different concentrations. The samples no. 1–270 samples were used as the training samples, and the samples no. 271–300 samples were used as the test samples. The concentrations of difficult oil pollutants tested are shown in Table 1. The realization process of oil component detection in petroleum oil in Figure 1.
Concentration of oil pollutants to be tested.
The realization process of oil component detection in petroleum oil.
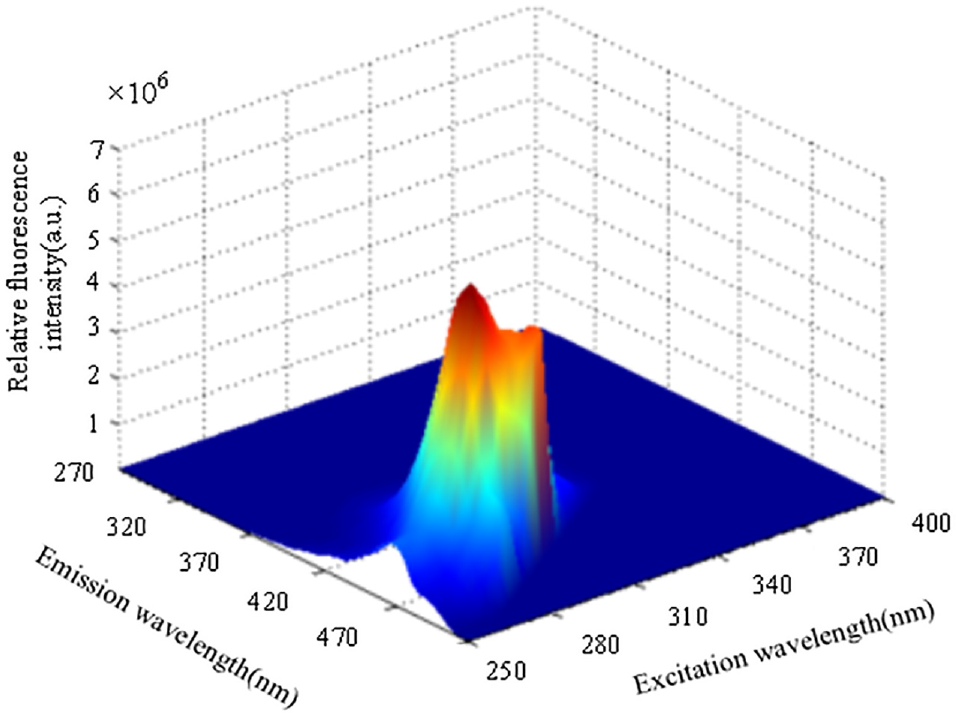
The 3D fluorescence spectrum of sample no. 4, which is a solution of diesel and gasoline, is shown in Figure 2. It can be seen that although the fluorescence intensity of each oil is different, the spectra of the two mineral oils are seriously overlapped, and it is difficult to realize spectral distinction and concentration prediction by chemical methods. Further, the 3D spectrum of other samples cannot distinguish between the components, so they are not shown here.
3D fluorescence spectrum of mixed solution of 0#Diesel and 97#Gasoline.
Results and dscussion
Improved pattern recognition
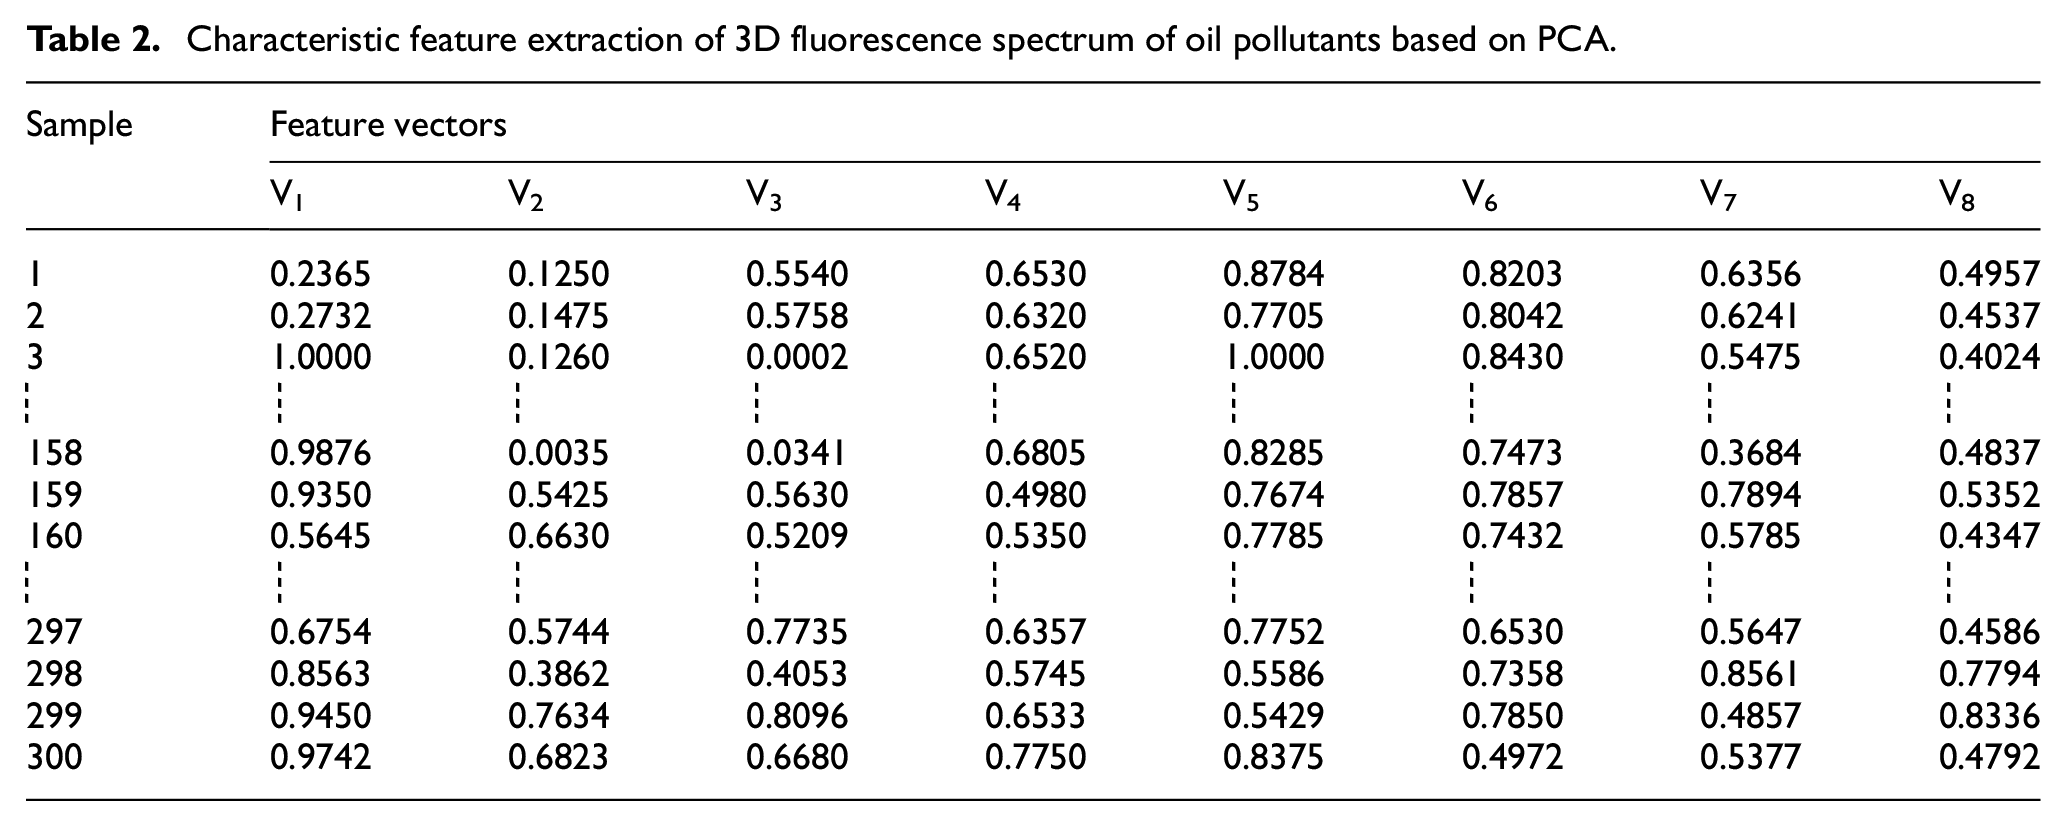
Firstly, the original fluorescence spectral data were standardized, and the correlation coefficient matrix was calculated. The dimension of the feature spectrum was selected as 8. Secondly, the optimal feature variables, which could reflect the complete features of fluorescence spectrum, were selected. The dimension of the feature space was compressed to reduce the amount of calculation, which was beneficial for selecting the feature with the largest amount of information and with the most significant effect on the spectrum classification. The correlation coefficients between the parameters were calculated. Finally, the principal component, which can be regarded as the characteristic spectrum of the original fluorescence spectrum of the sample, was selected. The extracted feature vectors are listed in Table 2.
Characteristic feature extraction of 3D fluorescence spectrum of oil pollutants based on PCA.
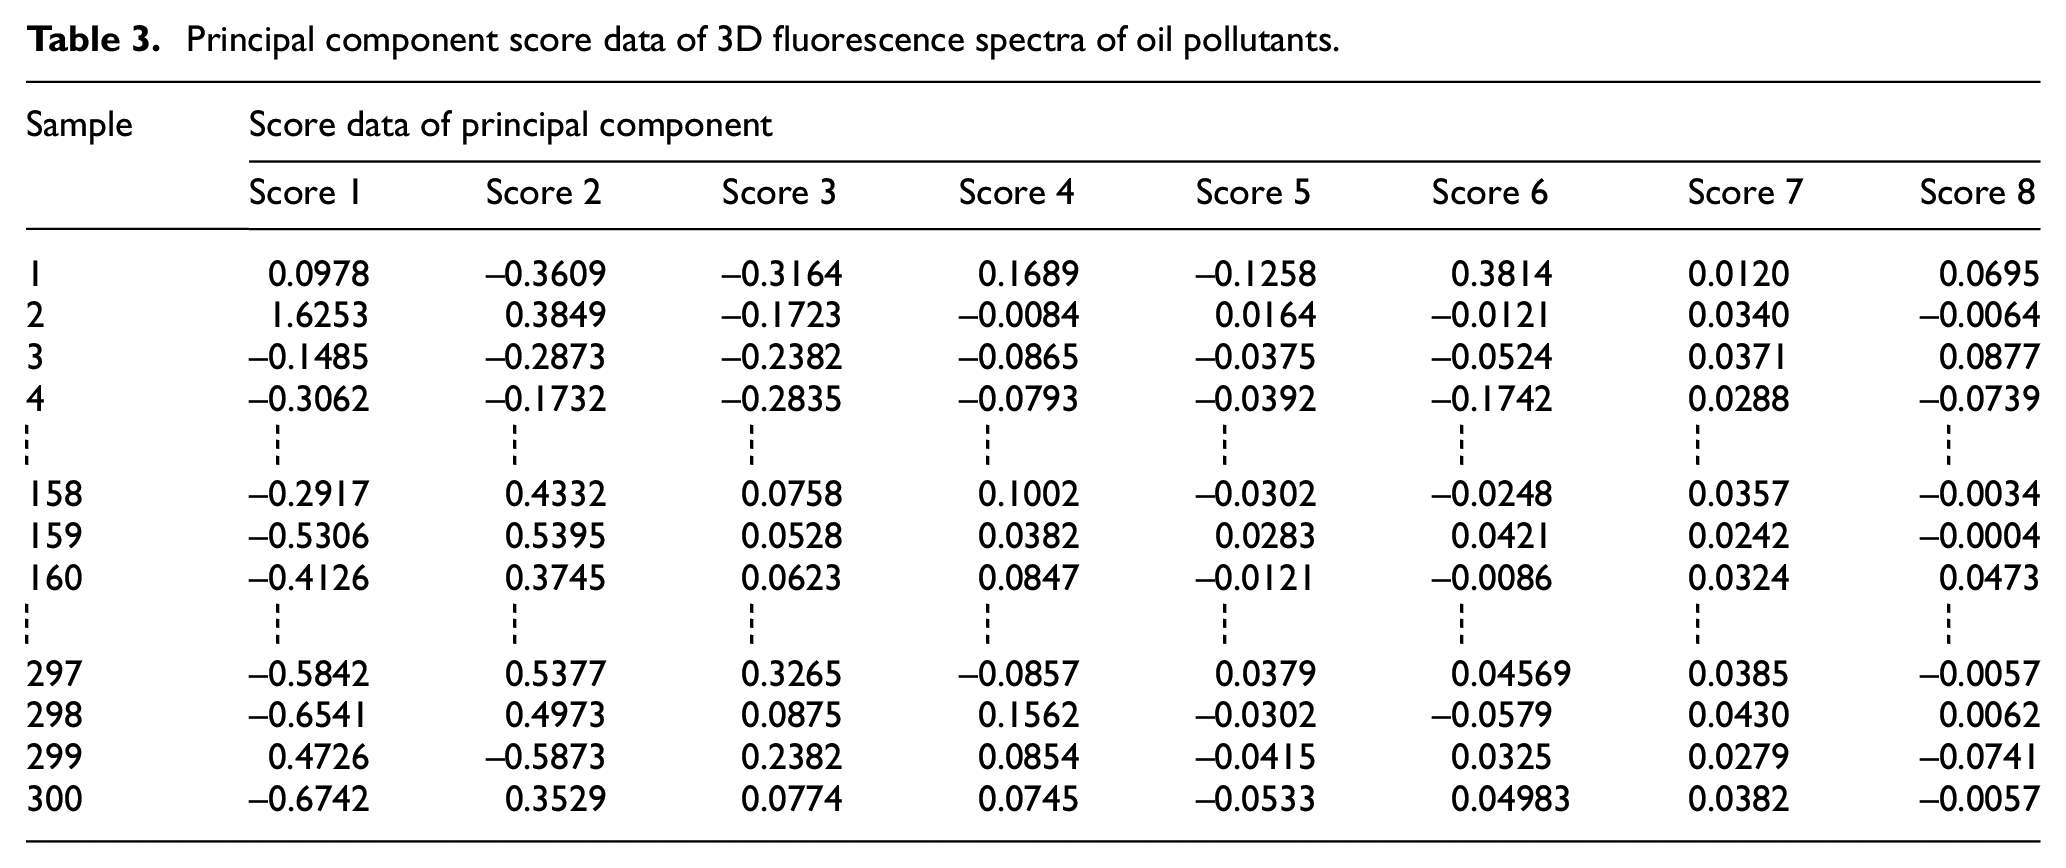
The load of a variable is defined as the coefficient of the variable in the linear combination equation multiplied by the square root of the corresponding eigenvalues of the principal component, but the coefficient itself is often called the load. The larger the load, the more the similarity of this variable with the main component. Therefore, the load can be regarded as the correlation between the variable and the principal component. A sample corresponding to a primary component is called the score by a combined calculation. The network input data is the main component score, as listed in Table 3.
Principal component score data of 3D fluorescence spectra of oil pollutants.
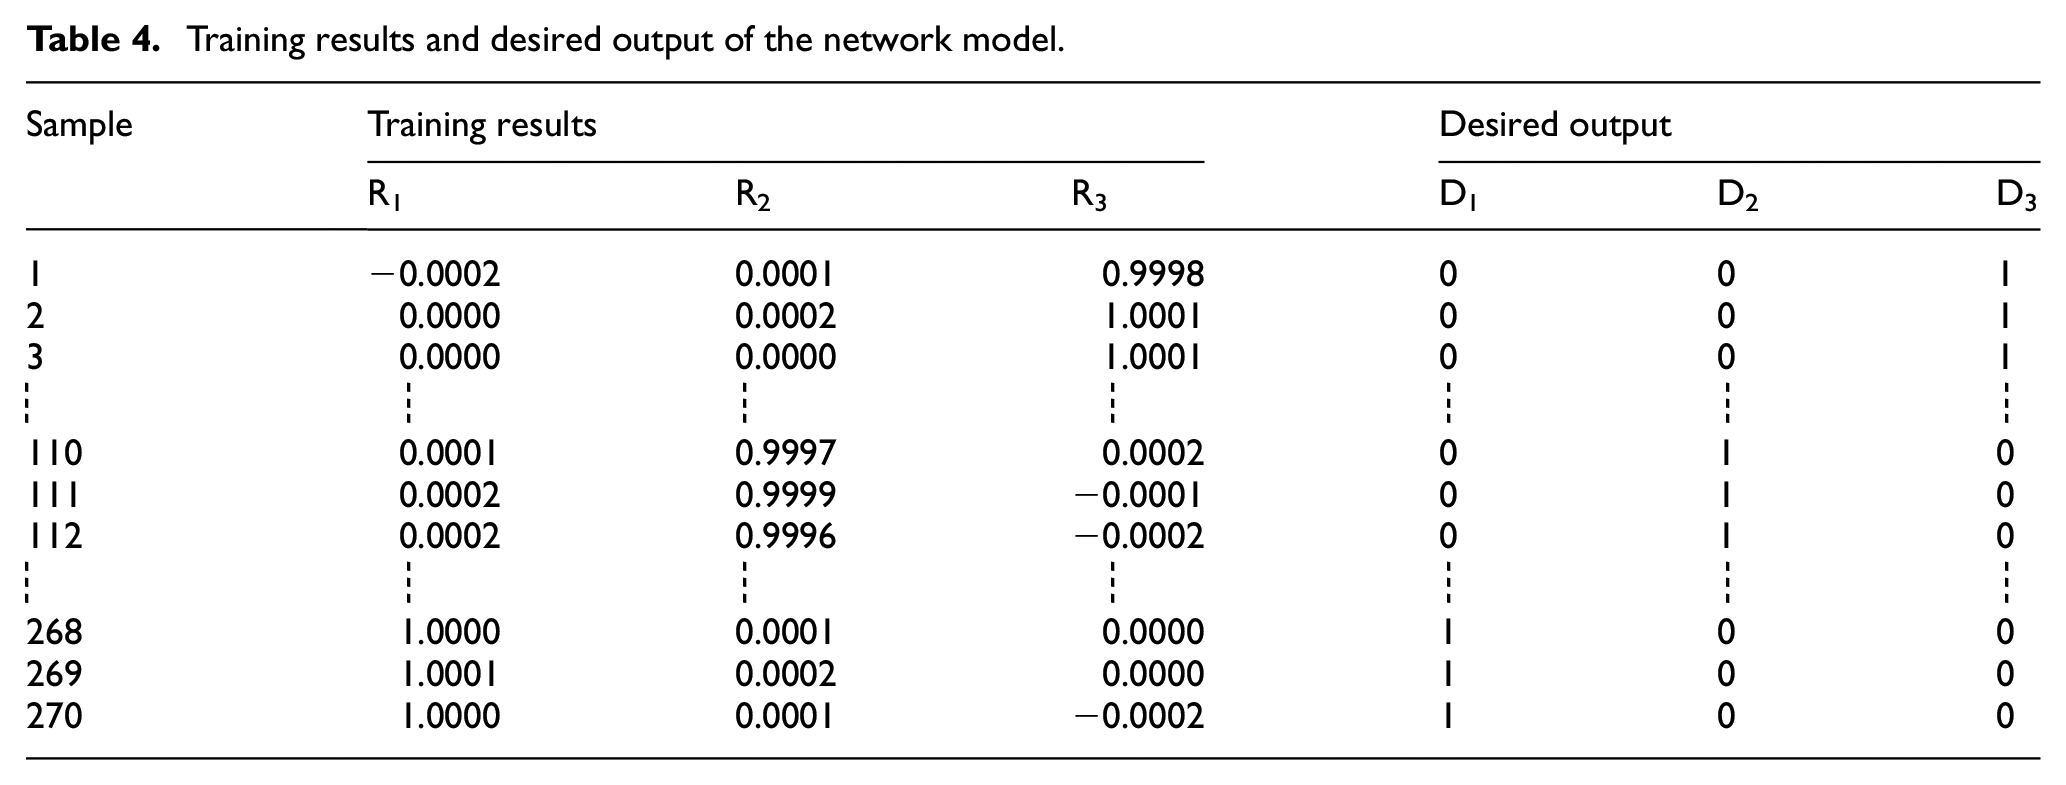
The above principal component score data were input into the network as new data. The cross-validation method was used to avoid the occurrence of over-fitting in the classification process. Under the premise of having enough information, the top five characteristic parameters were selected (except concentration information). The number of input nodes of the network model was set to 5, and the number of output nodes, that is, the number of refined oil types, was set to 3. In the extension neural network, the initial weight is directly related to the training results. Under the initial weight equalization, the training samples can be trained by the network, where the loop iteration in the learning algorithm generates training errors, and the training results of the network model represent the approximate sample and the desired output. The neural network can be used for both accurate value calculation and pattern recognition. When used for pattern recognition, its output node number is related to the number of intensive points. If there are two (three) types, two (three) nodes can be used. Accordingly, the three classes can be expressed as (1,0,0), (0,1,0), and (0,0,1), that is, the expected output is (D1, D2, D3). The training results and expected output of the network model are listed in Table 4. The pattern recognition error curve is shown in Figure 3.
Training results and desired output of the network model.
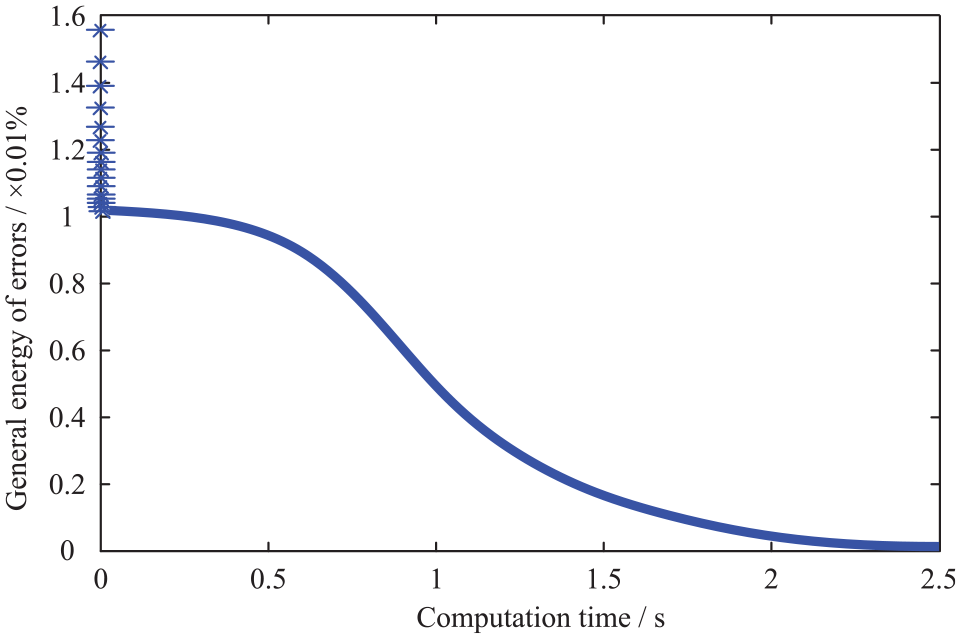
Error curve of pattern recognition.
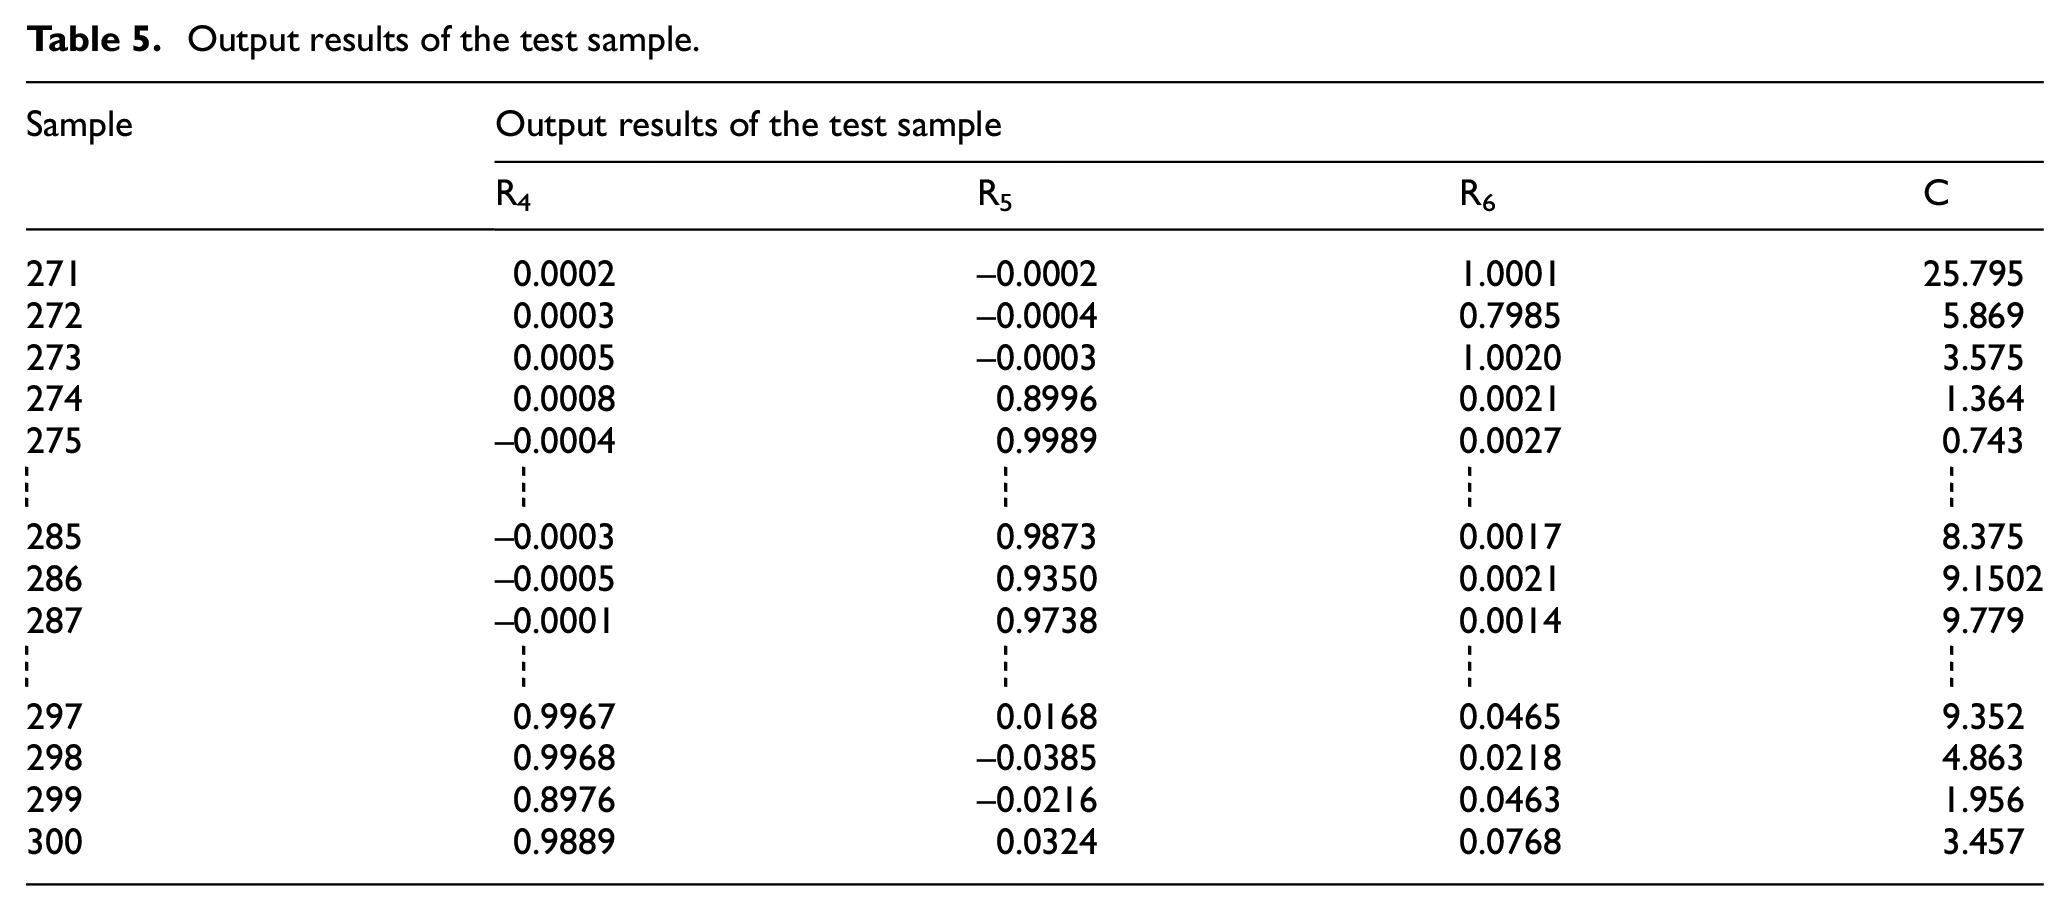
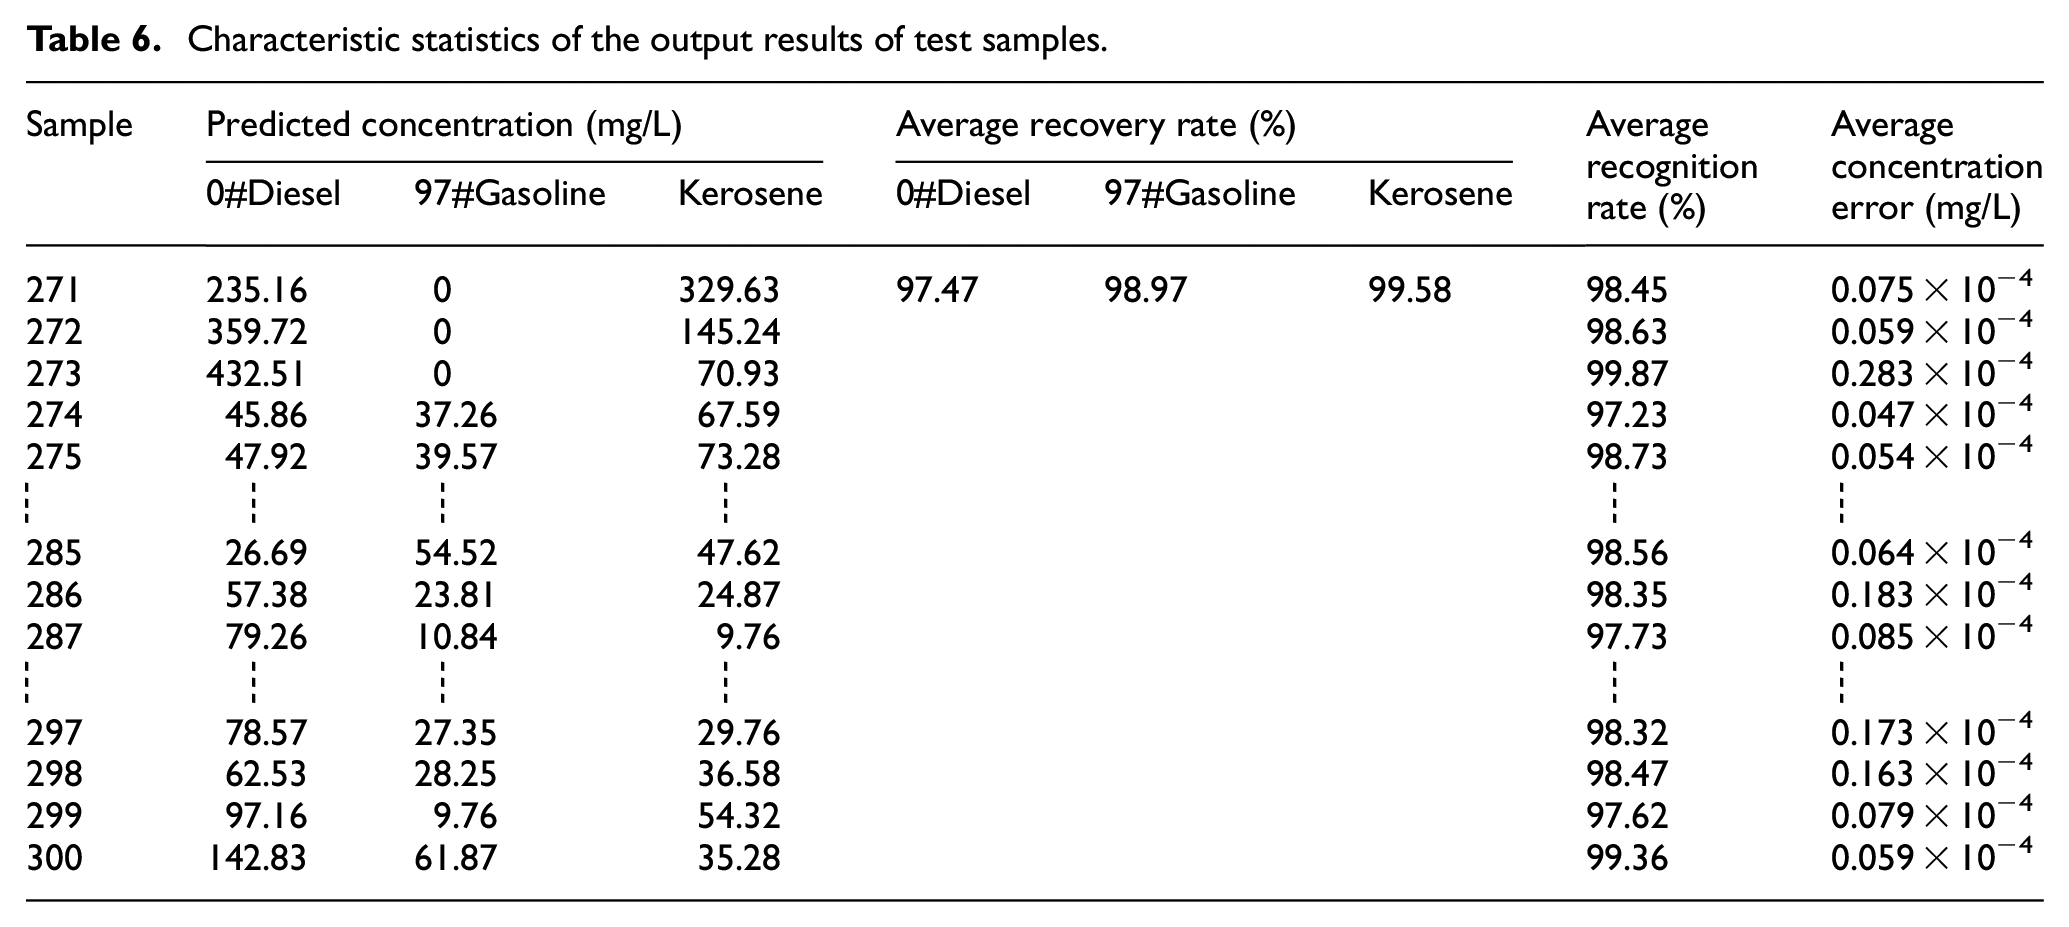
After training the network model with the training samples, the data of the test samples were input into the trained neural network, and the input parameters included the concentration information (relative fluorescence intensity, relative slope, comprehensive background parameters) for pattern recognition and measurement of oil pollutants. In the process of concentration measurement, the output value of the pattern recognition network was used as the weight coefficient of the relative slope (the change in the slope value of the relationship curve between concentration and fluorescence intensity of the sample). The output results of the network model for the test sample are listed in Table 5. The statistical data of corresponding characteristics are listed in Table 6. The extension neural network was used as the pattern recognition method, and the concentration measurement process took 1.53 s.
Output results of the test sample.
Characteristic statistics of the output results of test samples.
Parafac algorithm for the detection of oil pollutants
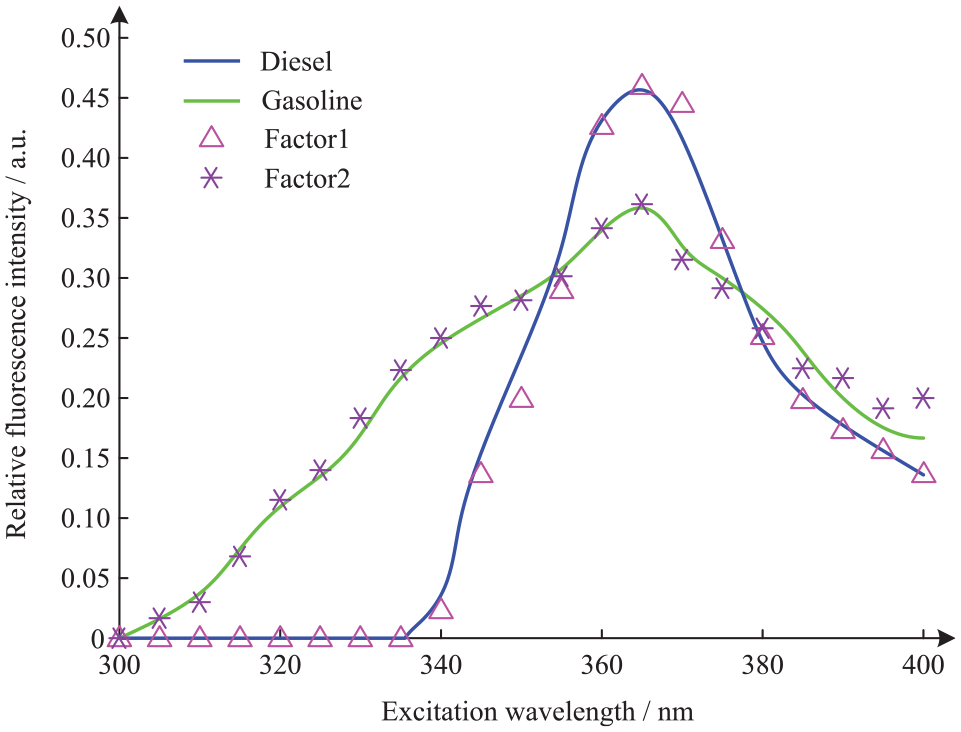
The PARAFAC algorithm was applied for the analysis of oil pollutants. The kernel consistency diagnosis method and the residual sum of squares method were used to jointly estimate the number of factors. When the number of factors was 3, the kernel consistent coefficient decreased significantly, and the residual sum of squares also decreased. In this study, the number of factors was selected as 2. The analysis results of the PARAFAC model for the mixed solution sample are presented in Figures 4 and 5. Figure 4 shows a comparison between the theoretical and experimentally measured fluorescence excitation spectrum, and Figure 5 shows a comparison between the theoretical and experimentally measured fluorescence emission spectrum. Table 7 presents the prediction results and recovery data of test samples obtained by the PARAFAC algorithm.
Comparison between the theoretical and experimentally measured fluorescence excitation spectrum.
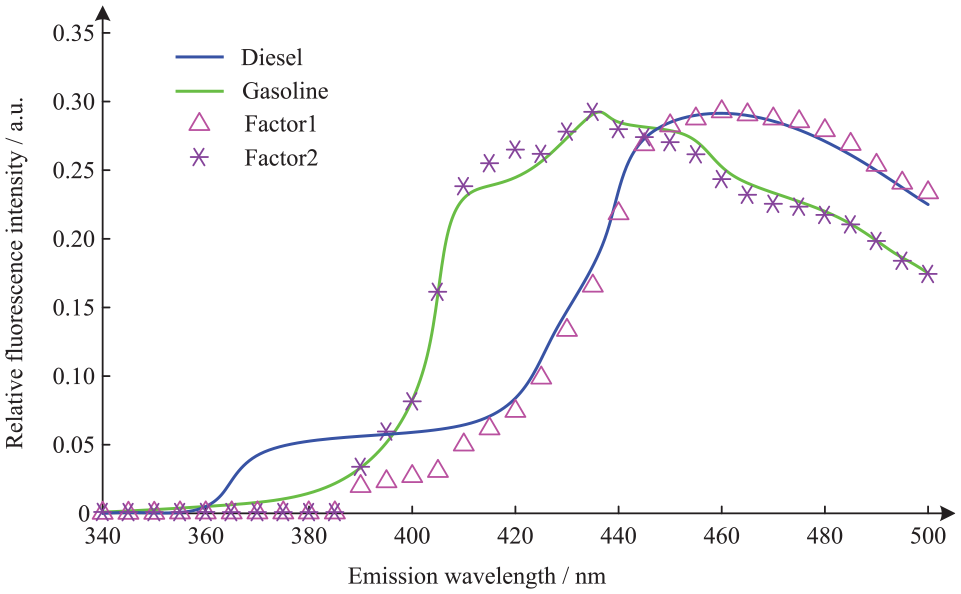
Comparison between the theoretical and experimentally measured fluorescence emission spectrum.
Prediction results of the test sample based on PARAFAC model.
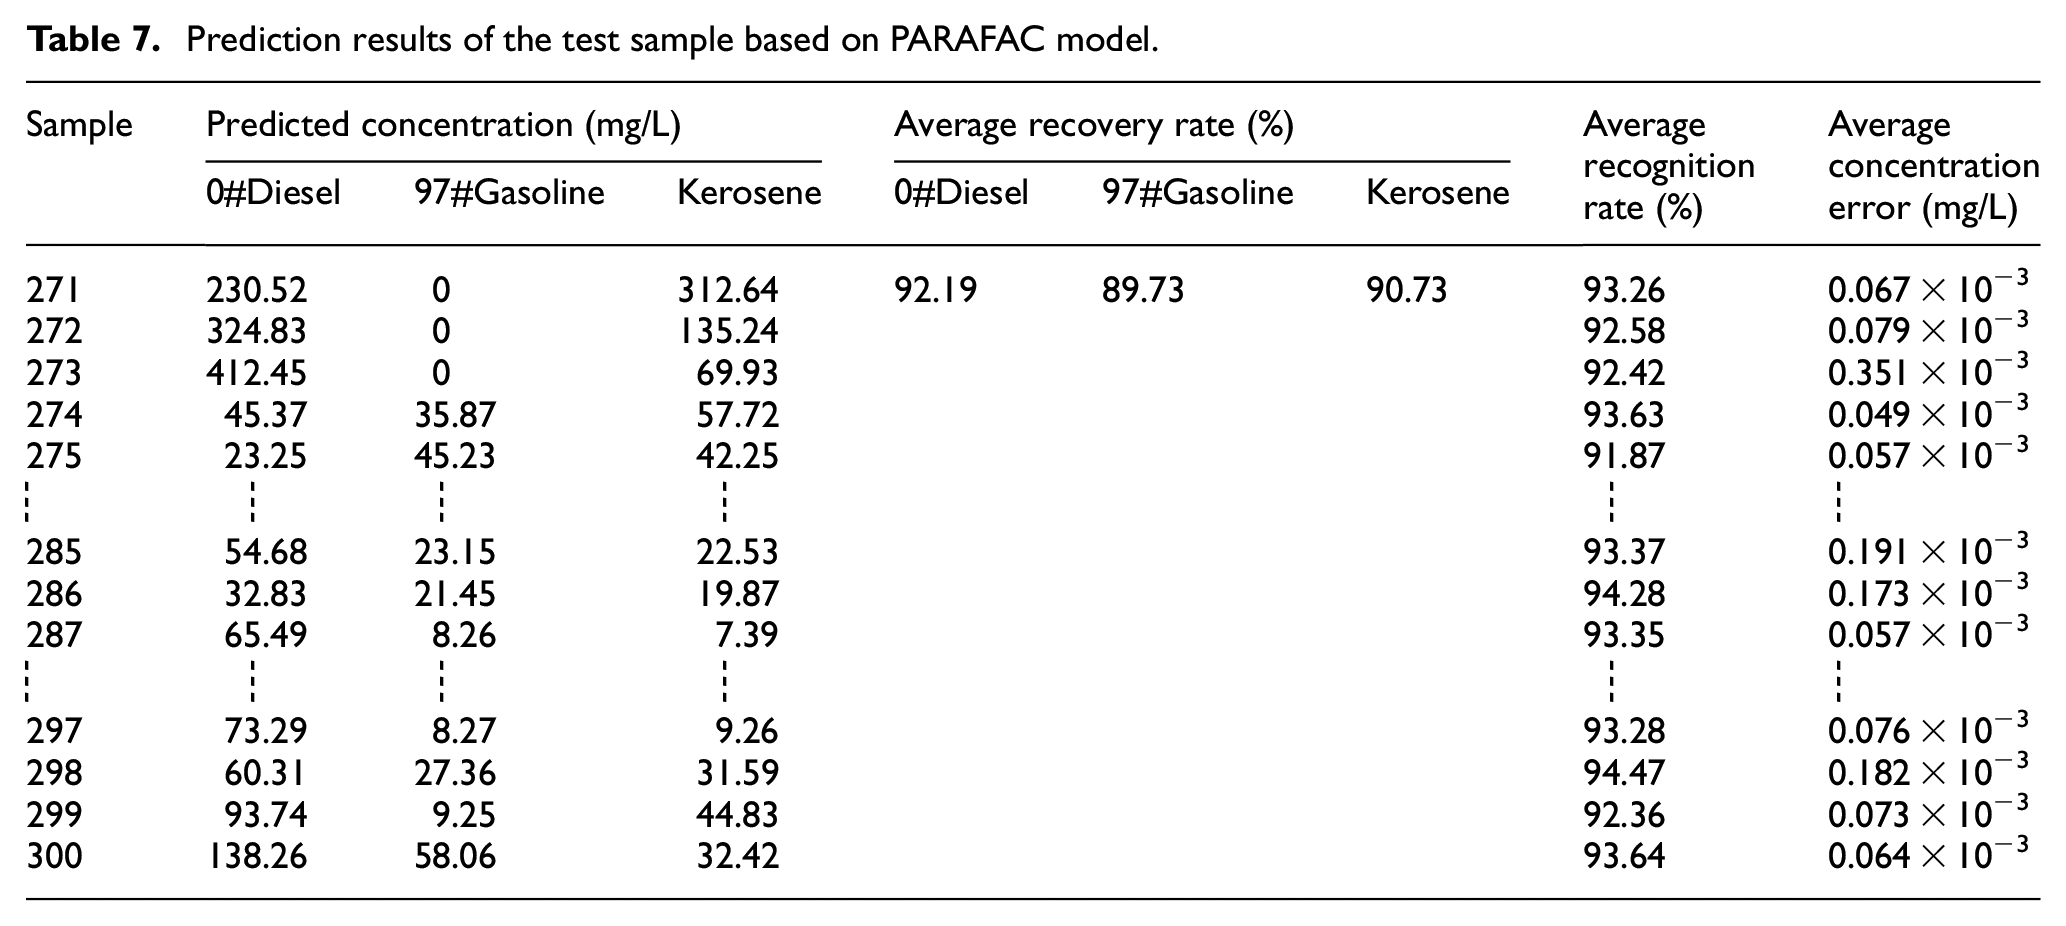
The experimental results show that the average pattern recognition rate of the oil pollutants based on the PARAFAC model is 93.1%. The average recovery rates of diesel and gasoline are 92.19% and 89.73%, respectively, and the average analysis time of PARAFAC model is 2.89 s. Both the concentration recovery rate and the time consumption confirm that the extension neural network is more effective than the PARAFAC model.
Conclusion
Combining the advantages of the data representation of PCA and the pattern recognition of extension neural network for mixed component system, the refined oil products were effectively identified and measured.The principal component analysis is used to extract the optimal feature variables, and the correlation coefficient method is used to obtain eight groups of principal component features in the spectra. The dimension is selected as 8, and the principal component score is calculated, which is used as the input data of the extension neural network. Next, the pattern recognition method is improved, and the designed neural network has functions of both resolution and measurement. The results of neural network pattern recognition are used as the input of the concentration network. The relative fluorescence intensity, relative slope, and comprehensive background parameters are used as the input parameters, and the extension neural network is used for pattern recognition and evaluation of oil pollutants. The experimental results show that the average recognition rate of the improved pattern recognition algorithm for oil pollutants is 98.43%, and the average recovery rate of concentration is 98.67%. The average pattern recognition rate of the oil pollutants based on the PARAFAC model is 93.1%. The average recovery rates of diesel and gasoline are 92.19% and 89.73%, Further, the average time for pattern recognition is 1.53 s, while the parallel factor analysis algorithm takes 2.89 s. The comparison between the theoretical and experimental characteristic fluorescence excitation and emission spectra was used to verify that the extension neural network is a very powerful tool for spectral data analysis.
In this paper, the Pattern Recognition of Extension Neural Network still has the shortcomings of easy to fall into local optimum and slow convergence in the application. In the future research, it still needs to be improved to improve the recognition accuracy and efficiency, and the recognition effect in the fields of health care and food safety is studied to expand its application fields.
Footnotes
Acknowledgements
Thanks to the financial support provided by the National Natural Science Foundation of China (Nos. 61771419, 21807034), and the Natural Science Foundation of Hebei Province of China (Nos. F2019209323, F2019209443, F2019209599). It also grateful to North China University of Science and Technology (Hebei, China), for providing fluorescence spectrometer instruments.
Declaration of conflicting interests
The author(s) declared no potential conflicts of interest with respect to the research, authorship, and/or publication of this article.
Funding
The author(s) disclosed receipt of the following financial support for the research, authorship, and/or publication of this article: This work was supported in part by the National Natural Science Foundation of China under Grant 61771419 and 21807034, and the Natural Science Foundation of Hebei Province of China under Grant F2019209323, F2019209443, and F2019209599.