
Abstract
Ticket pricing, which is critical to increasing the revenue for high-speed railways, is typically optimized with a given train stop plan. However, the passenger distributions are restricted by fixed train stop plans, and the optimal ticket price scheme may not be achieved. Therefore, a mixed-integer linear programming model is proposed to optimize collaboratively train stop planning and ticket pricing in this study. The objective is to maximize the total ticket revenue, while the total number of train stops is limited to guarantee service quality. Furthermore, equity concerns of passengers are addressed by ensuring that passengers have equitable travel costs and opportunities to access high-speed railways. Finally, numerical experiments are conducted on a hypothetical railway line and the Zhengzhou-Xi’an high-speed railway corridor to demonstrate the application of the proposed approach. The computational results indicate that the proposed method can increase the total ticket revenue by 27% through adding 14 train stops and formulating a new ticket price scheme compared to the traditional method. In addition, the equity performance can be kept at a level of 1.5.
Introduction
Motivation
In many countries such as France, Japan, and China, the high-speed railway (HSR) system has played a crucial role in promoting rapid and convenient passenger transportation. In the past decade, HSR networks have been extended worldwide, particularly in China. As of December 2020, China’s HSR mileage reached 37,900 km, which is the largest HSR network in the world. However, the investment in HSR construction is tremendously massive, thereby incurring a large debt for many railway companies in the world, such as the China State Railway Group. Therefore, railway companies are compelled to pursue strategies and methods that help increase their profits.
Ticket pricing is an efficient approach for railway companies to boost their profits. To survive fierce competition, railway companies in many countries have formulated flexible fare policies, among which the differential fare strategy is one of the most common policies. In this strategy, the tickets of trains are priced differently for the same origin-destination (OD) pair. In general, HSR tickets are priced within a specified range. Passengers, given their age, income, and travel purpose, are sensitive to the ticket price at different degrees. If all the ticket prices are increased to the upper limits, some passengers would give up HSR and switch to other transportation modes (e.g. long-distance buses). Consequently, the loss of passengers may have a negative impact on the total revenue despite the increase in ticket prices. Furthermore, ticket pricing is typically optimized with pre-determined train stop plans. Under this circumstance, the passenger-to-train assignment is constrained, and thus, the optimal ticket price scheme may not be generated because the passenger distributions corresponding to the optimal prices may contravene the given train stop plans. Consequently, it is necessary to collaboratively optimize train stop planning and ticket pricing considering the price elasticity, in order to increase the total ticket revenue.
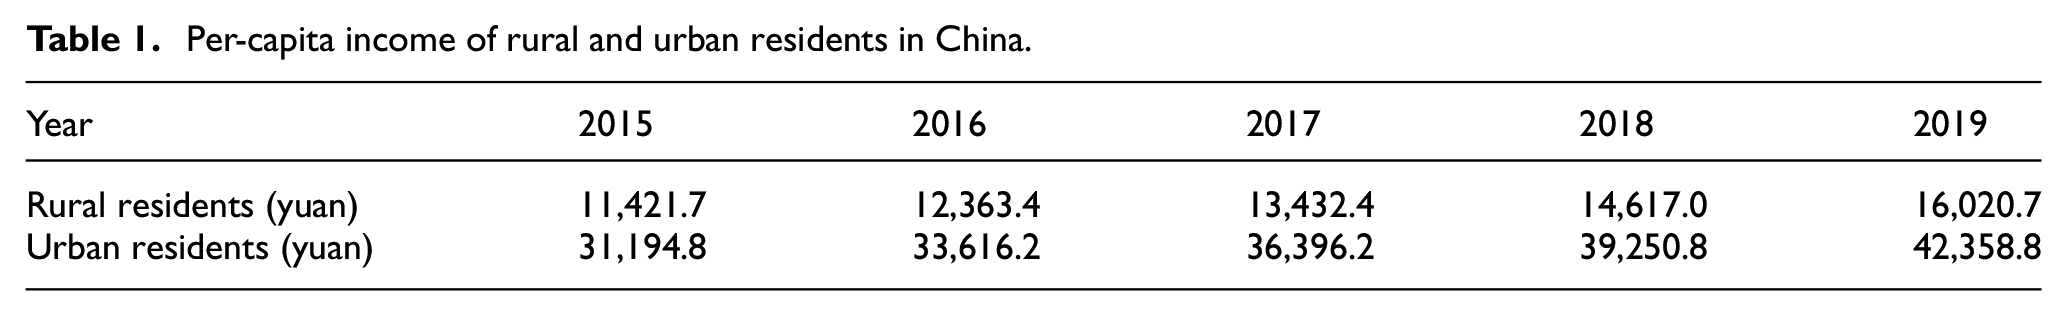
The ticket pricing may cause inequality, 1 since passengers have different income levels and price sensitivities. The per-capita incomes of rural and urban residents from 2015 to 2019 in China are listed in Table 1. The per-capita income of rural residents is significantly lower than that of urban residents. Accordingly, with the current flat ticket price structure, low-income passengers would have fewer opportunities to access HSRs than high-income passengers. Furthermore, low-income passengers would bear a greater financial burden and thus, perceive higher travel costs each time they travel by HSRs. Therefore, it is necessary to consider the difference of passenger incomes when formulating the fare scheme to enhance the fairness among passengers. Specifically, a ticket price scheme ensuring that passengers have equitable travel costs and the chance to travel by HSRs is desired.
Per-capita income of rural and urban residents in China.
Here, an example is presented to demonstrate the need for collaborative optimization of ticket pricing and train stop planning with the equity concerns of passengers. Consider a simple HSR corridor comprising three stations and two sections. For simplicity, the number of passengers in any OD pair is assumed to be 10, with seven high-income and three low-income passengers. Assume that the incomes of low- and high-income passengers are 1000 and 2000 yuan, respectively. The maximum train loading capacity is 10, and two trains operate to serve the corridor. For OD pairs (A, B), (B, C), and (A, C), the original ticket prices are 100, 100, and 200 yuan, respectively. These prices can range from 50% to 150% of their original values. In addition, assume that the maximum affordable ticket prices are 120, 120, and 240 yuan for low-income passengers. The various stop plans, price schemes, and passenger distributions are illustrated in Figure 1. Note that the detailed passenger-to-train assignment corresponding to a specific stop plan and price scheme (i.e. indicated by the red numbers in the brackets) is presented using the passenger distribution rectangles (see, Qi et al. 2 ).
In general, Plan (a), where train 1 stops at each station and train 2 does not stop at station B, is formulated to minimize the total number of stops. Plan (a) can yield a revenue of 4000 yuan because the original prices are used.
Assume that the railway company intends to increase the revenue by adopting a flexible ticket pricing strategy. Plan (b) indicates that all prices increased by 50%. In this situation, the low-income passengers in each OD pair would give up HSR because the prices exceed their maximum affordable prices. Consequently, a total revenue of 4200 yuan is generated.
In Plan (c), the prices are determined based on the maximum affordable prices of low-income passengers; thus, no passengers would be lost from the HSR. Plan (c) can produce a revenue of 4,800 yuan.
The above plans are formulated based on the given train stop plans. If ticket pricing is considered at the train stop planning stage, Plan (d) can be made, where trains 1 and 2 are both all-stop trains and the tickets are priced for the high- and low-income passengers, respectively. The revenue of Plan (d) is 5640 yuan, which is the highest compared with those of Plans (a), (b), and (c).
Plan (e) is formulated by considering passenger equity. In Plan (e), the prices for low-income passengers are decreased, to balance the ratio of ticket price to income between the two types of passengers (i.e. improving access to HSR for low-income passengers). Plan (e) can generate a total revenue of 5400 yuan. Therefore, Plan (e) not only increases revenue by 35% compared to Plan (a), but also improves equity.
Following the above analyses, it is of great importance to integrate train stop planning and ticket pricing into one fundamental optimization model, in order to boost revenue for railway companies and ensure equity performance simultaneously.
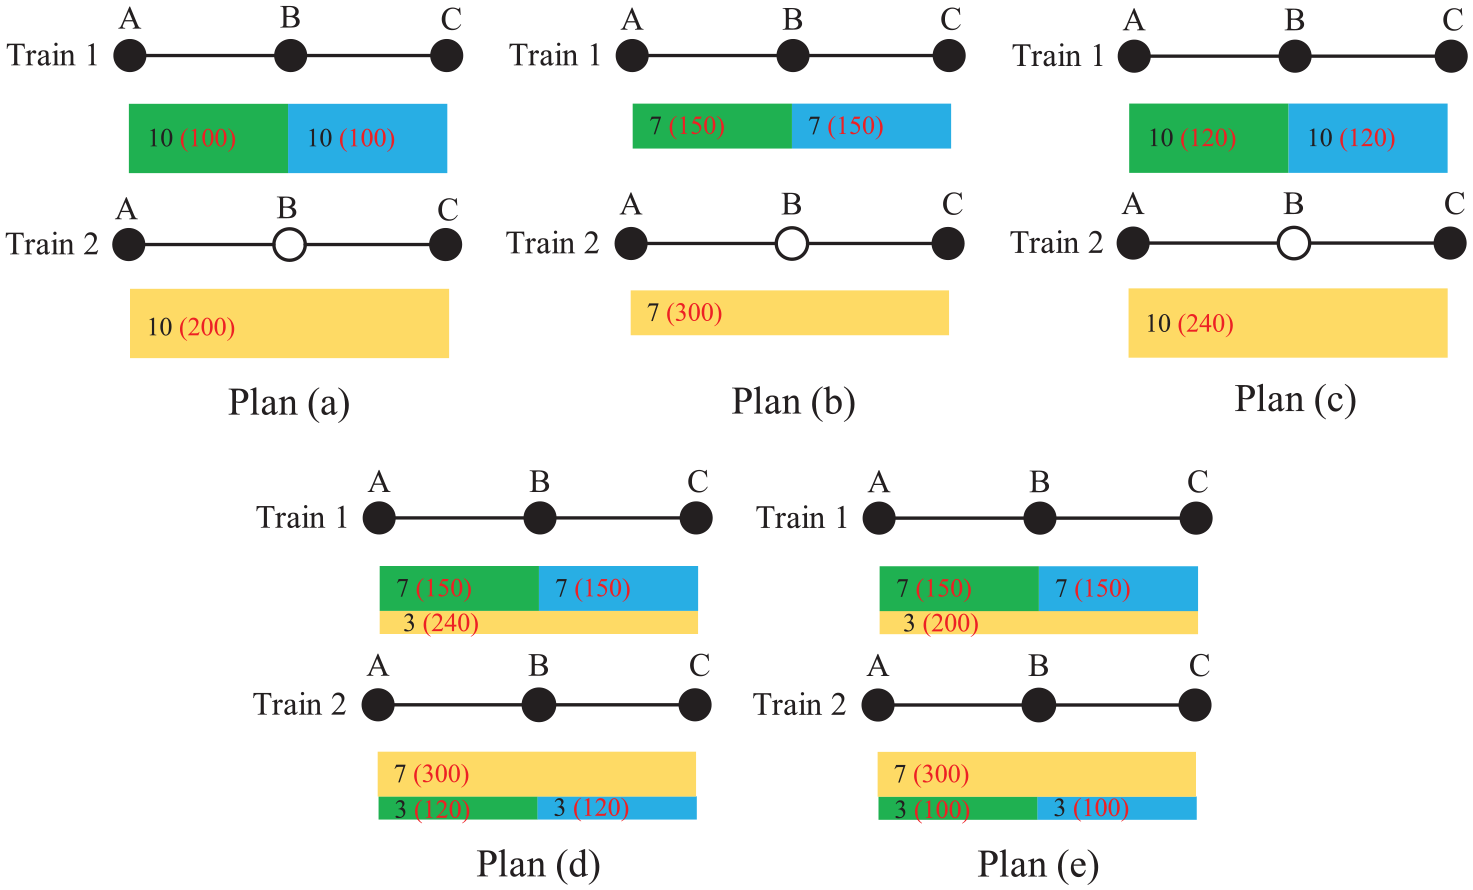
Various stop plans, price schemes, and passenger distributions.
Literature review
Since the integrated problem has not attracted sufficient attention in the literature, the studies related to train stop planning, ticket pricing, and equity concerns in transportation field are reviewed, respectively.
Train stop planning
Many studies on train stop planning have been conducted. Train stop planning aims to determine the stations at which each train stops with given passenger demands. Typically, it is treated as a subproblem in the entire line-planning problem (for instance see Fu et al. 3 ). However, given that train stop planning can complicate the line-planning problem, many researchers have studied it as an independent problem for a given train set and train type. Xia et al. 4 adopted a passenger transportation-like organization strategy for railway container transportation and studied the incurred stop planning problem accordingly.
To improve service and operation efficiency, different stop strategies have been applied in the literature. (1) All-stop strategy. This strategy forces trains to stop at each station along their routes and is widely used in urban rail transit systems in many cities, such as Hong Kong. 5 Although it decreases the travel speed, especially for long-distance passengers, it allows passengers to get on any train when they arrive at the stations, cutting down on their waiting time. (2) Combined stop strategy. To apply this strategy, the stations are generally classified; further, several stop patterns (i.e. stop at different grades of stations) can be predetermined and combined to provide high-quality services. The combined stop strategy helps decrease the total travel time of passengers and facilitates the construction of a periodic timetable. However, this may contravene passenger demands. Goossens et al. 6 solved the line-planning problem with multi-type stop patterns (i.e. regional trains, interregional trains, and intercity trains). (3) Skip-stop strategy. The stop patterns are not pre-given in this strategy. Dong et al. 7 considered the time-dependent demands and optimized the integrated train stop planning and timetabling problem with a skip-stop strategy.
Because the passenger flow is generally heterogeneously distributed in the spatial dimension, some studies found it necessary to embed the detailed passenger-to-train assignment in the train stop planning process to ensure that the stop plans are consistent with the passenger demands. Qi et al. 2 considered detailed passenger distributions and optimized the train stop plan and operation zone collaboratively. Cacchiani et al. 8 studied integrated train stop planning and timetabling problems embedded with detailed passenger distributions.
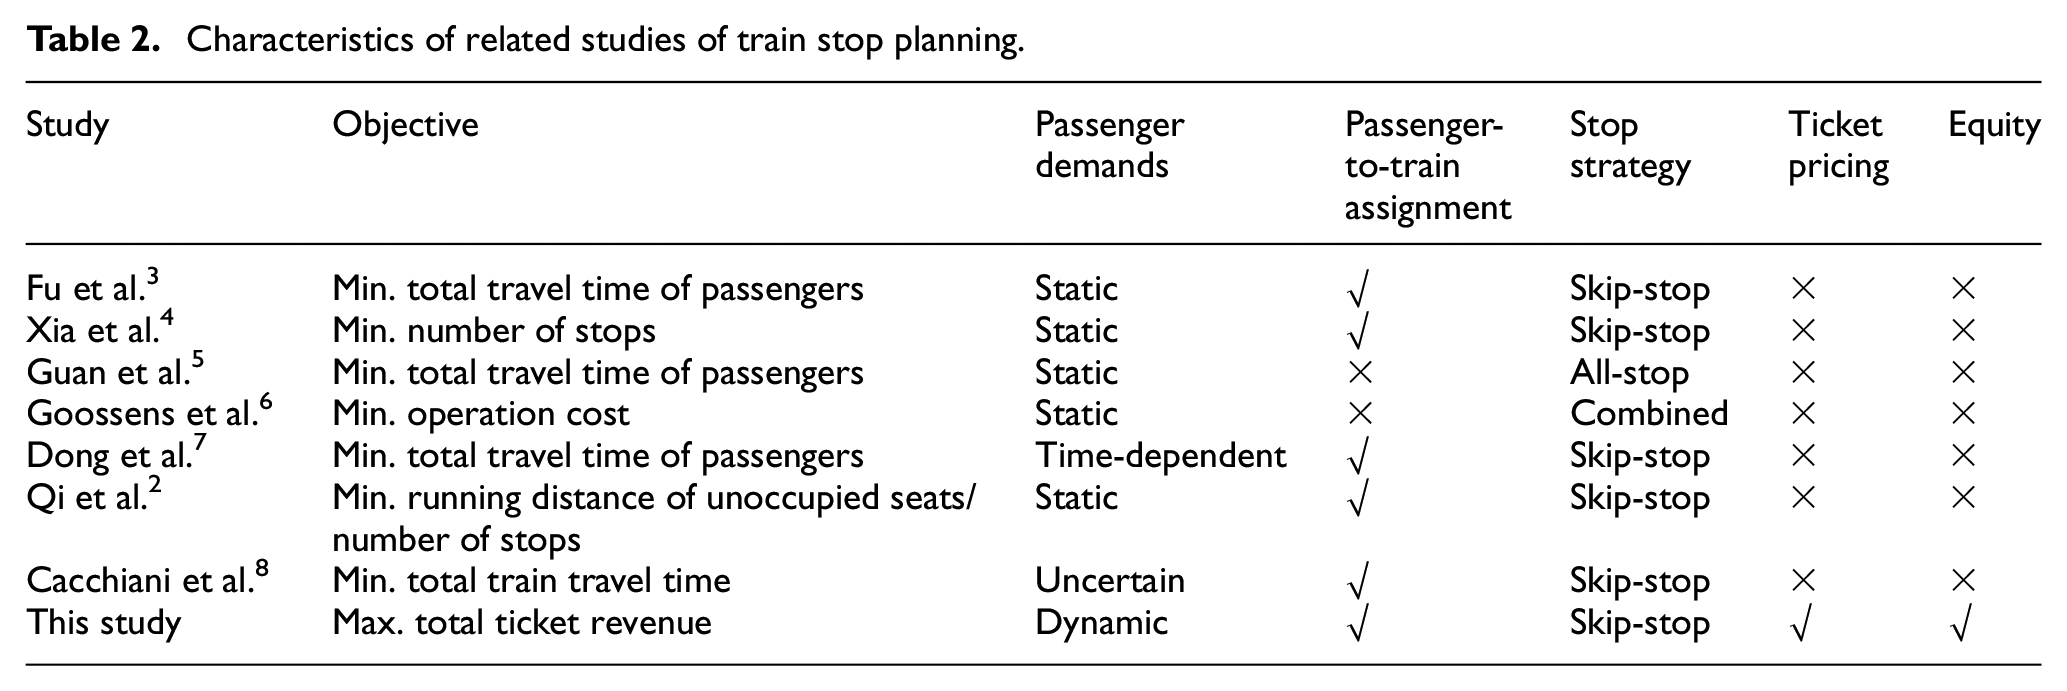
In this study, train stop planning is an important part of the considered integrated problem. The skip-stop strategy is applied, and detailed passenger distributions are considered. Furthermore, this study aims to maximize the total ticket revenue, while the total number of stops is limited to ensure service quality. Notably, the passenger exclusion problem is considered in this study, meaning that passenger demands are dynamic. The differences between this study and previous studies related to train stop planning are shown in Table 2.
Characteristics of related studies of train stop planning.
Ticket pricing
Adopting reasonable ticket pricing strategies is conducive for boosting the revenue of railway companies and enhancing the competitiveness of the railway. 9 Although ticket pricing has been widely studied and successfully applied in the airline industry, it remains a challenge for railway companies to price tickets appropriately. 10 The primary reasons are that multi-origin to multi-destination services are normally provided by railways, and these services share common sections.
The foundation of ticket pricing is market segmentation. Owing to the heterogeneity of passengers in travel purpose, age, income, etc., they normally have various tastes for departure time, travel time, and ticket price. Hence, many researchers have investigated the influence of ticket price on passenger choice behavior (including mode choice and route choice) and attempted to formulate a ticket price scheme that adapts to the preferences of different passengers. Based on the expected departure time, travel time, and price, Nuzzolo et al. 11 built a passenger choice model to evaluate different pricing policies. Qin et al. 12 implemented a differential ticket pricing strategy in the off-peak and peak periods for railways in China, and found that a price-reducing strategy in the off-peak period can yield more profits for railway companies.
In the railway system, passengers may book a seat for a period prior to their trips. However, reservations are not distributed in a balanced way during the ticket selling period (see, Hetrakul and Cirillo 13 ). Therefore, many researchers have focused on the dynamic pricing problem to enable ticket prices to accommodate passengers’ reservation habits (for instance see Qin et al. 14 ). Owing to the complementary relationship between ticket allocation and ticket pricing, the collaborative optimization of these two problems has attracted the attention of researchers. Hetrakul and Cirillo 13 and Li 15 formulated optimization models for the integrated problem. The objectives were to maximize the total revenue, and the train capacity and passenger choice constraints were considered.
In the above literature, the train stop plans and timetables were assumed to be predetermined when optimizing ticket prices. However, the consideration of ticket prices at the planning stage, which can improve the consistency between ticket price schemes and operation plans, has not yet attracted enough attention. Robenek et al. 16 adopted a flexible ticket pricing strategy in the train timetabling process to increase the revenue and make the train service convenient for passengers.
Transportation equity
Litman 1 defined transportation equity as the extent to which the distribution of transportation benefits and costs is considered fair and appropriate. In practice, equity considerations in the transportation field are multifaceted. 17 For examples, do disadvantaged people have the same opportunity to access the transportation system? Does the price structure of the transportation system prevent low-income people from traveling? Such concerns lead to two types of equity: horizontal equity and vertical equity. The former refers to the equitable distribution of benefits and costs between individuals and groups with equal abilities and needs, whereas the latter focuses on individuals and groups with unique abilities and needs.
In the past few decades, many researchers have attempted to solve equity problems in different transportation systems. Owing to the complexity and difficulty in addressing multidimensional equity concerns using a unified methodology framework, most studies concentrate on specific equity issues. In these studies, various measurements were adopted to evaluate equity. In the system of urban rail transit, Shang et al. 18 improved horizontal equity. The number of missed trains of all passengers was balanced in their work by formulating a train scheduling optimization model based on the skip-stop strategy. In road traffic, Meng and Yang 19 developed a bi-level programming model to guarantee that each OD pair can benefit from the capacity expansion associated with the network design problem. Furthermore, equity issues in air transportation were studied. The equity problem associated with the ground delay program was solved by minimizing the total deviation from the “pure” ration-by-schedule (see Kuhn 20 ). For other research areas of transportation, Camporeale et al. 21 used a revised Gini coefficient method to quantify equity in a transit network planning problem.
Recently, equity issues in HSR systems have attracted increasing attention. Many researchers are concerned with whether the benefits brought by HSRs are fairly distributed in the spatial dimension, such as economic output (see Zhang et al. 22 ). However, only a few studies consider equity in the HSR planning process. Zhan et al. 23 incorporated equity into the train scheduling problem for HSRs by adopting a floating fare strategy.
The proposed method
In the current planning process of HSRs, tickets prices are determined after train stop planning, which means that the stop plan of each train is pre-defined when optimizing ticket prices. This phased planning method prevents the railway companies from increasing their profits, since the fixed train stop plans affect how the passengers can be assigned to the trains.
This study focuses on the integrated optimization of train stop planning and ticket pricing for HSR corridors. To the best of our knowledge, this comprehensive problem has not been investigated previously. This study makes the following contributions.
As a novel concept, this study proposes a mixed-integer linear programming model to optimize collaboratively train stop planning and ticket pricing. Compared with the traditional ticket pricing strategies,16,23 this work has two innovations: (a) the train stop plans are treated as the decision variables in the process of ticket pricing, to eliminate the restriction of the fixed stop plans on passenger distributions and accordingly generate a better ticket price scheme; (b) instead of the section-based pricing technique that is used previously, the OD-based pricing technique is adopted, in order to obtain a more flexible ticket price scheme and help increase the total ticket revenue.
In the formulation process, the interests of three parties are all considered. The ticket revenue is maximized for railway companies, and the number of train stops is constrained to decrease the travel cost for passengers. Furthermore, the equity performance is kept at a high level to meet the government’s requirement. Different from the related study (Zhan et al. 23 ), the passengers at different income levels not only have equitable travel costs, but also have similar opportunities to access HSRs.
Numerical experiments are implemented on a simple railway line and on the Zhengzhou-Xi’an HSR corridor to demonstrate the practicality of our approach. The CPLEX solver is used to search for the optimal and near-optimal solutions. Some additional experiments are also conducted by setting various values for different parameters to examine the relationships among revenue, equity, stop plan, ticket price, and passenger distribution.
The remainder of this paper is organized as follows. Section 2 presents a detailed description of the integrated problem. In Section 3, a mixed-integer linear programming model is formulated. Section 4 presents the numerical experiments on a simple railway line. In Section 5, a real-world experiment is conducted. Finally, the conclusions and future research are discussed in Section 6.
Problem statement
A demand model
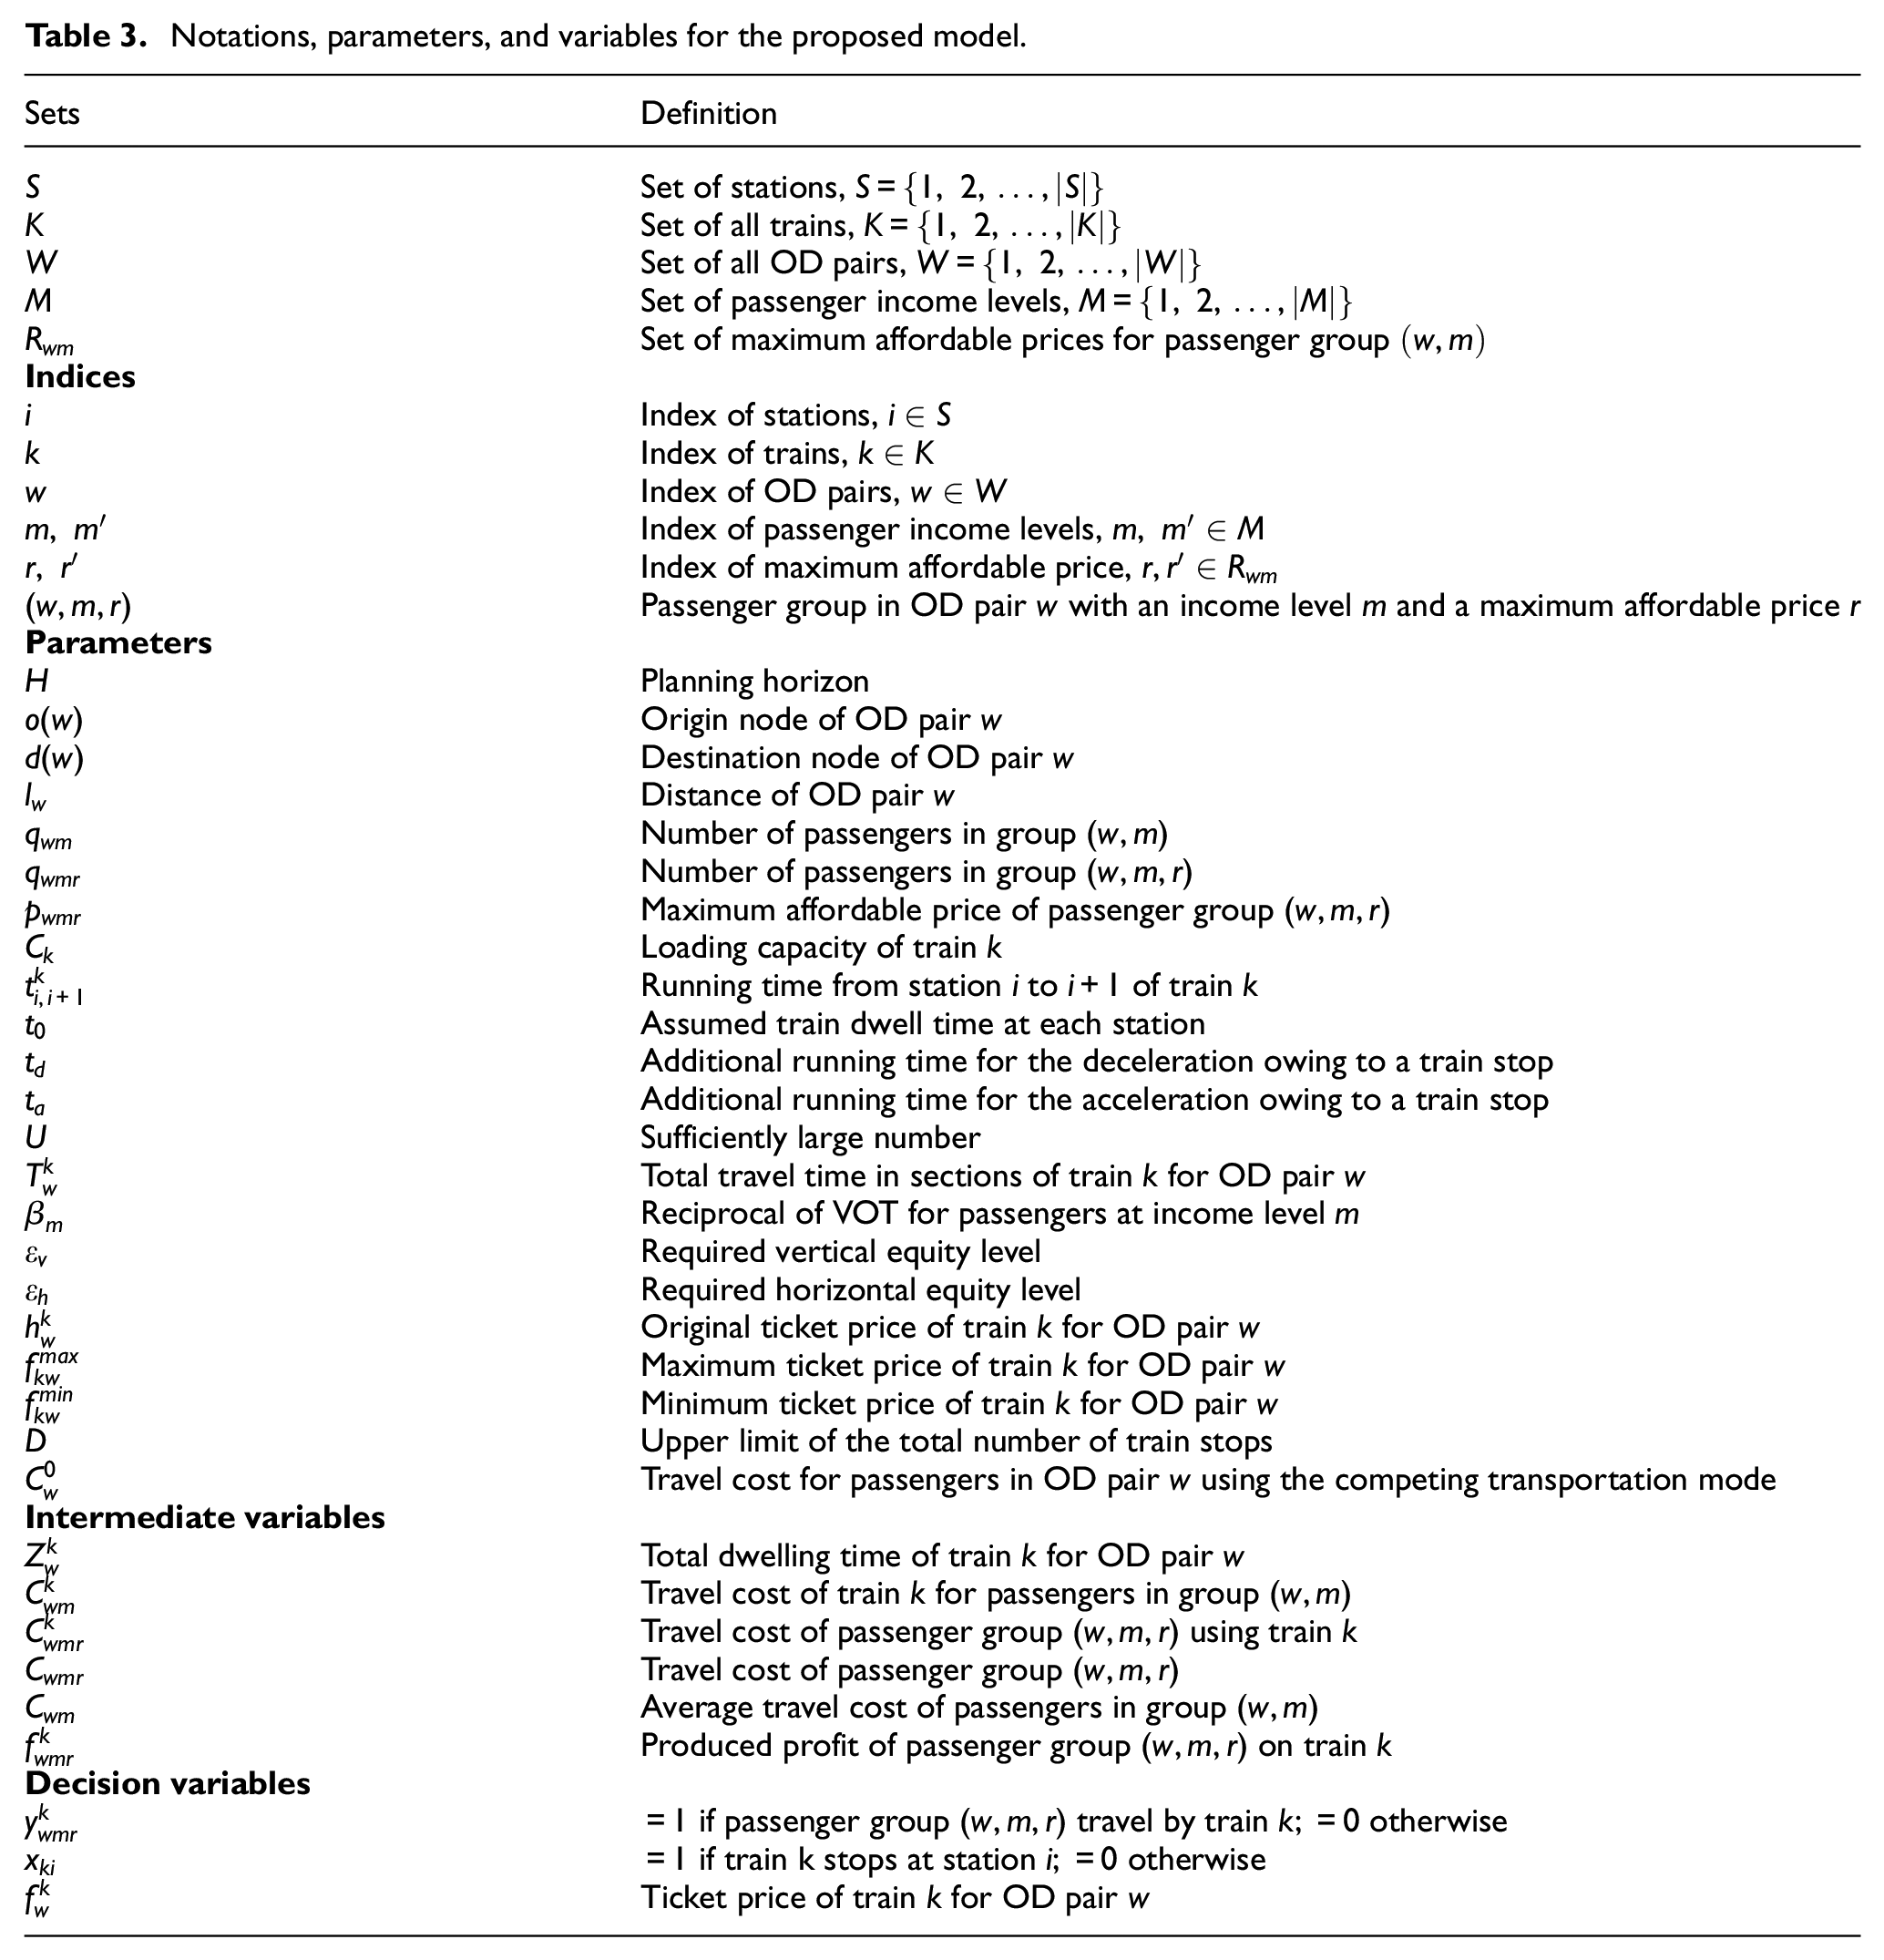
The mathematical symbols used in this study are listed in Table 3. Consider a typical HSR corridor with a station set
Notations, parameters, and variables for the proposed model.
In this study, the passenger grouping technique, which is frequently used in the railway optimization process (for instance see Robenek et al.,16,24 Zhan et al.
23
), was adopted to model the passenger exclusion problem. Among the factors that affect the sensitivity of passengers to ticket prices, income is a key factor.
23
Therefore, divide the passengers in an OD pair are divided into three groups based on income level first: high-income passengers, medium-income passengers, and low-income passengers. We use
An example is presented to explain the definition of passenger groups in this study. Suppose that six passengers, denoted as 1, 2, 3, 4, 5, and 6 in OD pair
To boost revenue, railway companies optimize ticket prices based on the maximum affordable price of each group. If the price of train
With the above analysis, the passenger exclusion problem can be formulated as below:
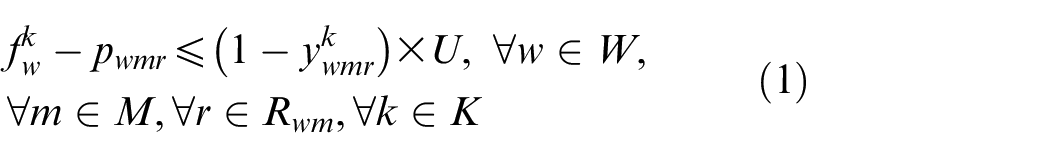
In equation (1),
Travel cost of passengers
The equity concerns of passengers are addressed in this study by ensuring that passengers at different income levels have equitable travel costs (see Section 2.3). Therefore, it is necessary to define the travel costs for different types of passengers. The travel cost comprises two parts in this study, one of which is associated with the total travel time, whereas the other is related to the ticket price and income level.
Generally, the total travel time comprises the travel time in the sections, dwelling time, and transfer time. (1) The travel time in the sections depends on the train speed and the distance of each section. It can be treated as a fixed value. (2) The precise dwelling time at each station cannot be determined until the specific train timetable is formulated, and the passengers make trip decisions based on all features of the trips, including dwelling time. However, our fundamental goal is to balance the travel costs of different passenger groups by reducing the fare for low-income passengers. Therefore, the dwelling time at each required station of each train is set to an equal and fixed value at the train stop planning stage to estimate the total dwelling time of a journey. (3) The last part is associated with transfers. In an HSR corridor, which is our research environment, passengers do not prefer a transfer during their trips. Accordingly, the transfers in HSR corridors are not considered. Consequently, the transfer time could be dismissed.
Recall that the heterogeneity of passengers, which is commonly ignored in the traditional train stop planning method, is considered in this study. As discussed in Section 1, the travel cost of passengers is affected by income level. With these concerns, the travel cost

In equation (2), the notations
Measurement of equity
The purpose of this study is to design a profitable train stop plan and maintain system-wide equity performance at a reasonable level. As discussed in Section 1, equity concerns are addressed from the perspective of allowing passengers to have fair travel costs and opportunities to travel by HSRs. In equation (2), the parameter
Enlightened by Zhan et al.,
23
equity performance is constrained for each OD pair. In the case of OD pair
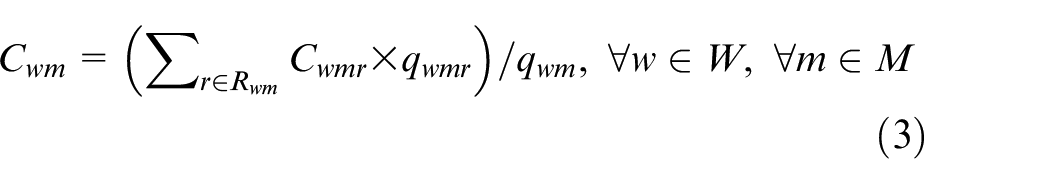
In equation (3),
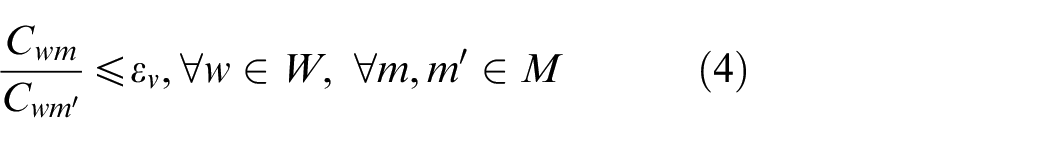
In essence, equation (4) only enables the travel cost of the high-, medium-, and low-income passengers in an OD pair to be kept equitable; however, it cannot guarantee that the passengers at the same income level (i.e. in group
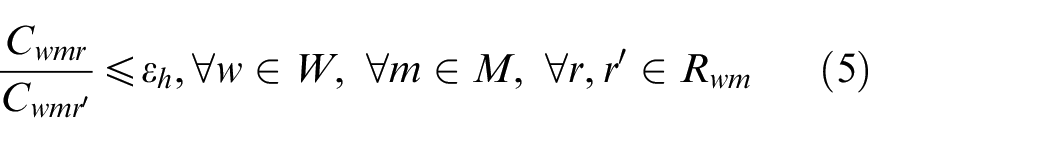
In equation (5), the parameter
Obviously, the smaller the values of
Ticket pricing strategy and revenue
A flexible ticket pricing strategy is adopted in this study; the ticket prices of different trains could be unequal for the same OD pair. In general, two techniques are used for ticket pricing, namely section-based and OD-based pricing techniques. The total prices of all sub-trips would add up to the same price as the direct trip if the section-based technique is applied, because the price of each section is regarded as the variable. However, this rule is not strictly followed in China. Consequently, the OD-based pricing technique is used, which means that the ticket price of each train for each OD pair is treated as a variable.
The original ticket price of train

By employing the flexible ticket pricing strategy discussed above, the total ticket revenue of railway companies can be calculated as:
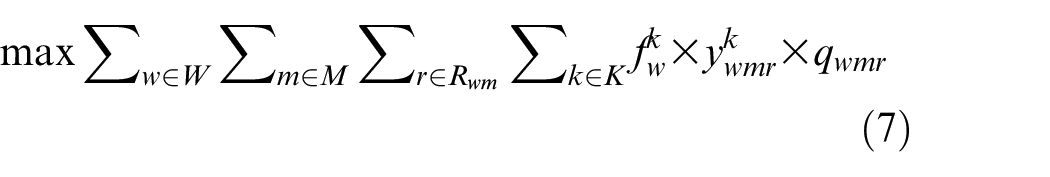
It should be noted that equation (7) is not linear because of the product of the two decision variables. The linearized model is presented in Section 3.
Mathematical model
Assumptions
To facilitate the model formulation, the following assumptions are introduced.
Objective function
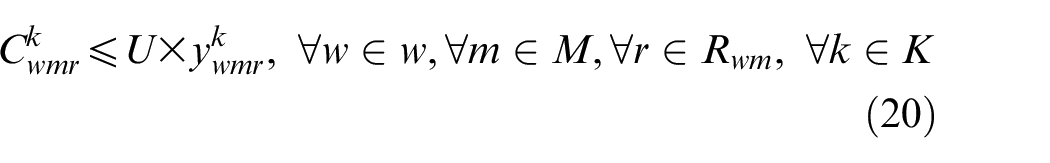
The objective of the proposed model is to maximize the total ticket revenue. To linearize equation (7), the intermediate variables
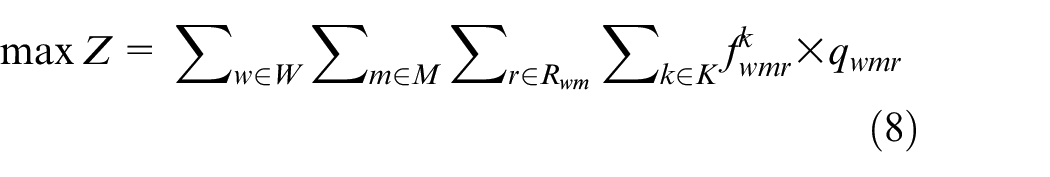
It should be noted that a new set of constraints should be included to guarantee the correct behave of the added variables (See constraint (25) and (26) in Section 3.3).
System constraints
To generate the optimal operational strategy, the following constraints are proposed to specify the relationships among train stop plans, passenger assignments, ticket prices, and equity.
Passenger demand constraints
In this study, a competing environment is considered. Each passenger group can travel by HSR or competing transportation modes, depending on the specific ticket prices. Therefore, the passenger demand constraints are formulated as equations (9) and (10):
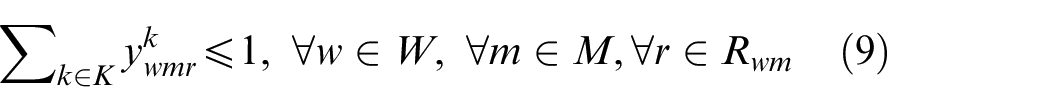
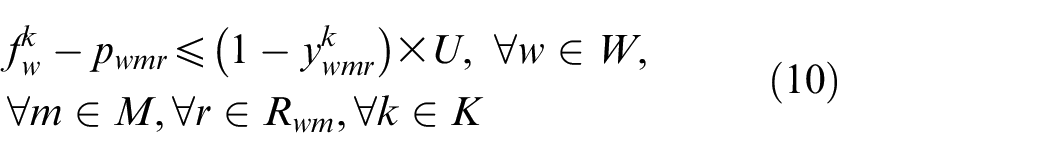
Equation (9) indicates that the passenger group
Train stopping constraints
There should be no conflict between train stop plans and passenger assignment. In addition, the travel time and energy consumption will increase with growing number of train stops. Accordingly, the train stop constraints are expressed as:
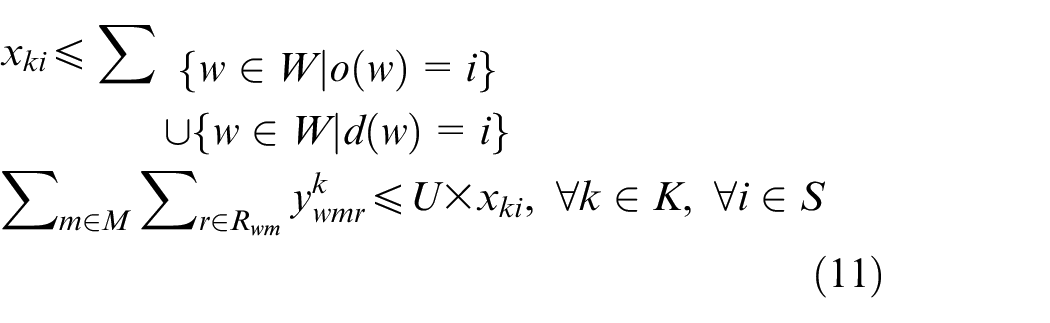
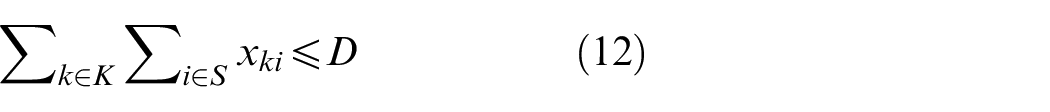
Eq. (11) states the relationship between the decision variables
Train capacity constraints
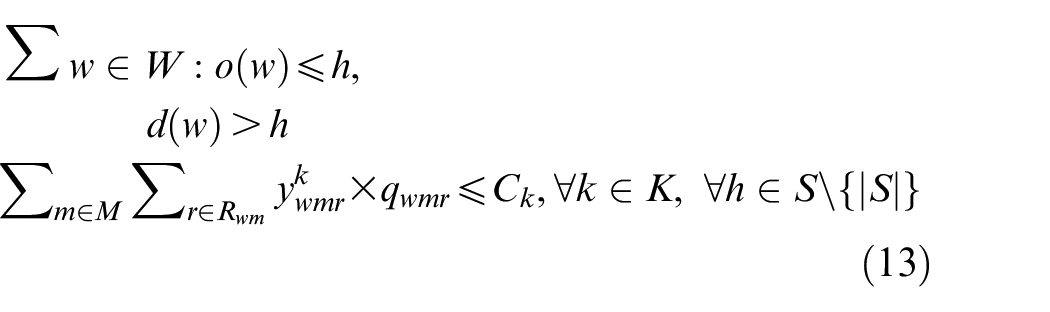
Realistically, when a train stops at a station, the relevant boarding and alighting movements will cause changes in the train occupancy in different sections. Obviously, the number of passengers transported by a train in a section must not exceed the train loading capacity. To satisfy this requirement, the train capacity constraints can be expressed as Equation (13).
Ticket pricing constraints
The ticket pricing strategy constraints are formulated below.

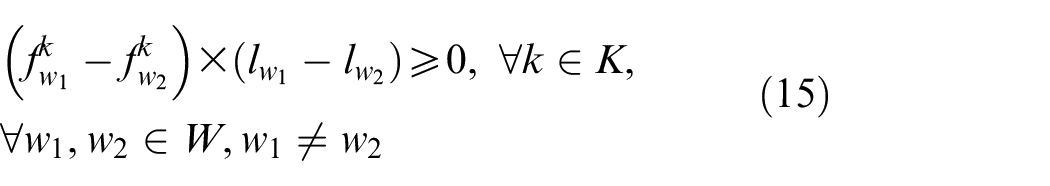
Equation (14) specifies the lower and upper limits of the ticket price
Travel cost constraints
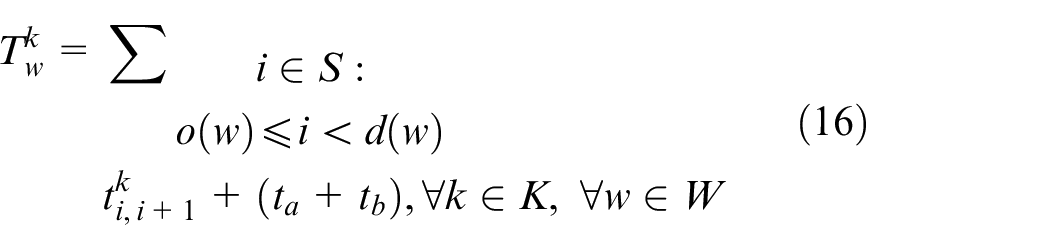
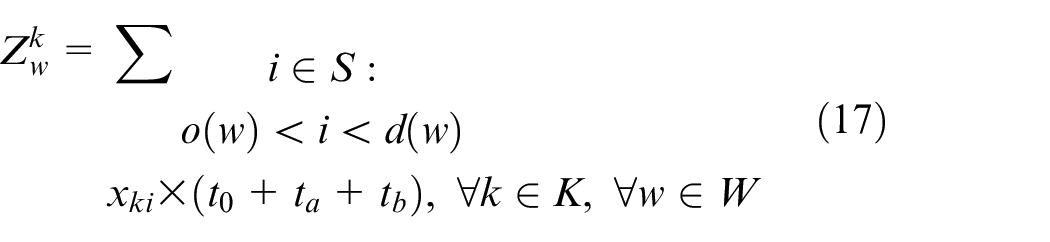
Equations (16) and (17) are used to calculate the total travel time in sections and the total dwelling time of train
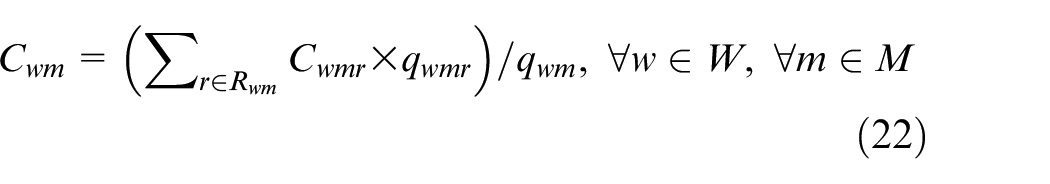
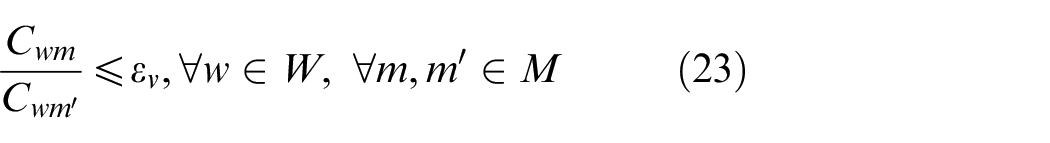
Equity performance constraints
Based on equations (4) and (5), the equity performance constraints are:
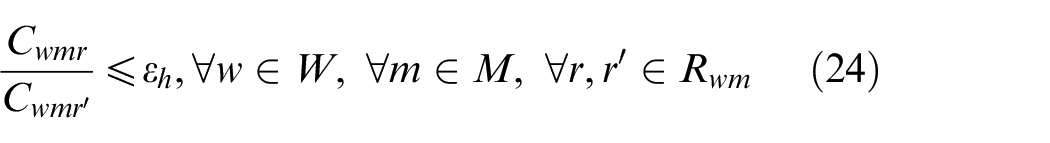
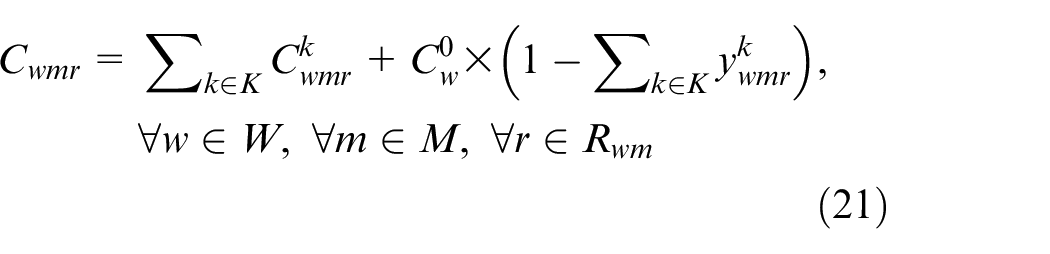
Revenue constraints
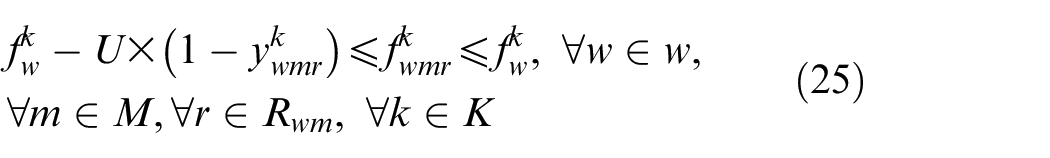
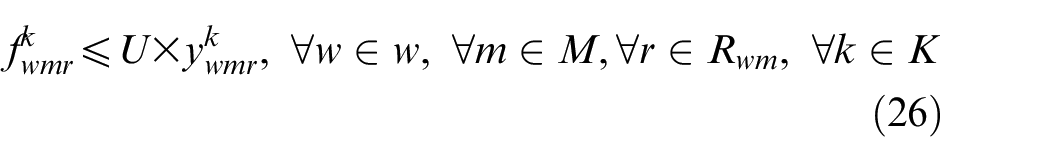
As mentioned in Section 3.2, equations (25) and (26) are formulated to linearize equation (7).
Bounding constraints

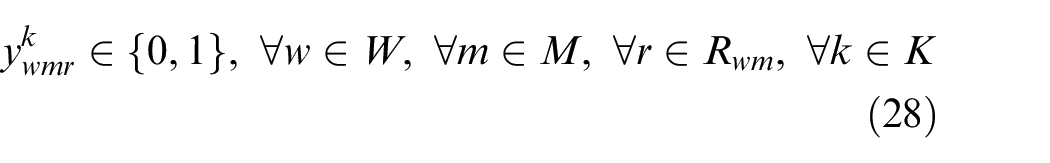

Equations (27)–(29) define the domain of the decision variables.
Model complexity
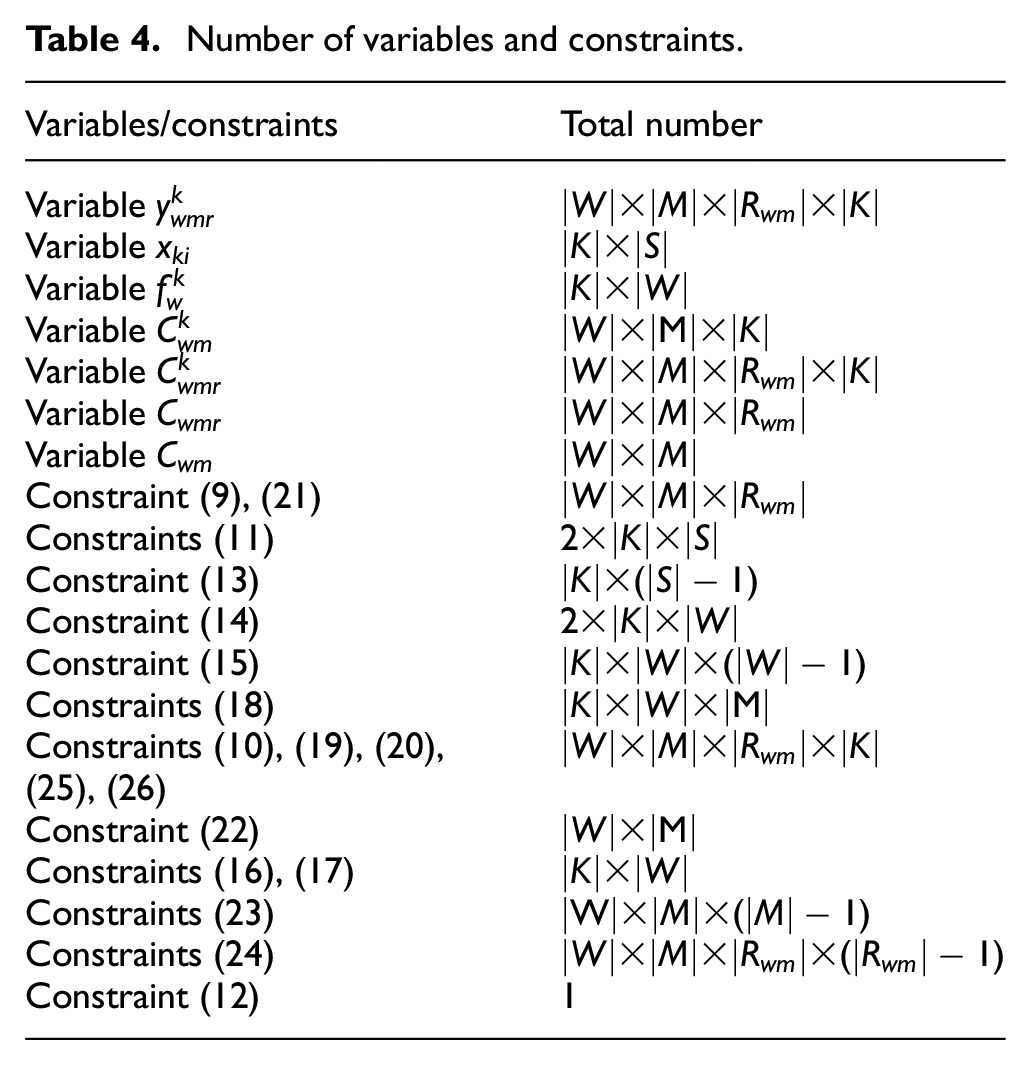
The proposed model is a typical mixed-integer linear programming model and can be proven to be an NP-hard problem. The complexity of the proposed model relies heavily on the number of stations, trains, and passenger groups. The total number of variables and constraints is listed in Table 4. With increasing scale of faced cases, the number of variables and constraints sharply grow, which makes the model more difficult to solve.
Number of variables and constraints.
Numerical experiments
This section provides numerical experiments on a simple railway line to prove the effectiveness and efficiency of the proposed approach. Because the formulated model is a mixed-integer linear programming model, the Python language is adopted to encode the model, and the CPLEX solver is employed to produce the solutions. All experiments are tested on a Core i5-8265U personal PC with 1.80 GHz and 8 GB RAM.
Input data
Consider a hypothetical railway line, which comprises four stations and three sections. The stations are denoted as A, B, C, and D, respectively. The distance of each section is 100 km. In our planning horizon, the maximum number of passengers who want to travel by HSR in each group is listed in Table 5. Evidently, there are six OD pairs. The passengers in each OD pair are first classified into three groups based on their income levels, and each group is further divided into several maximum affordable price-based passenger groups, leading to 45 passenger groups. The numbers 1, 2, and 3 denote high-, medium-, and low-income levels, respectively. The values of parameters
Passenger demands.
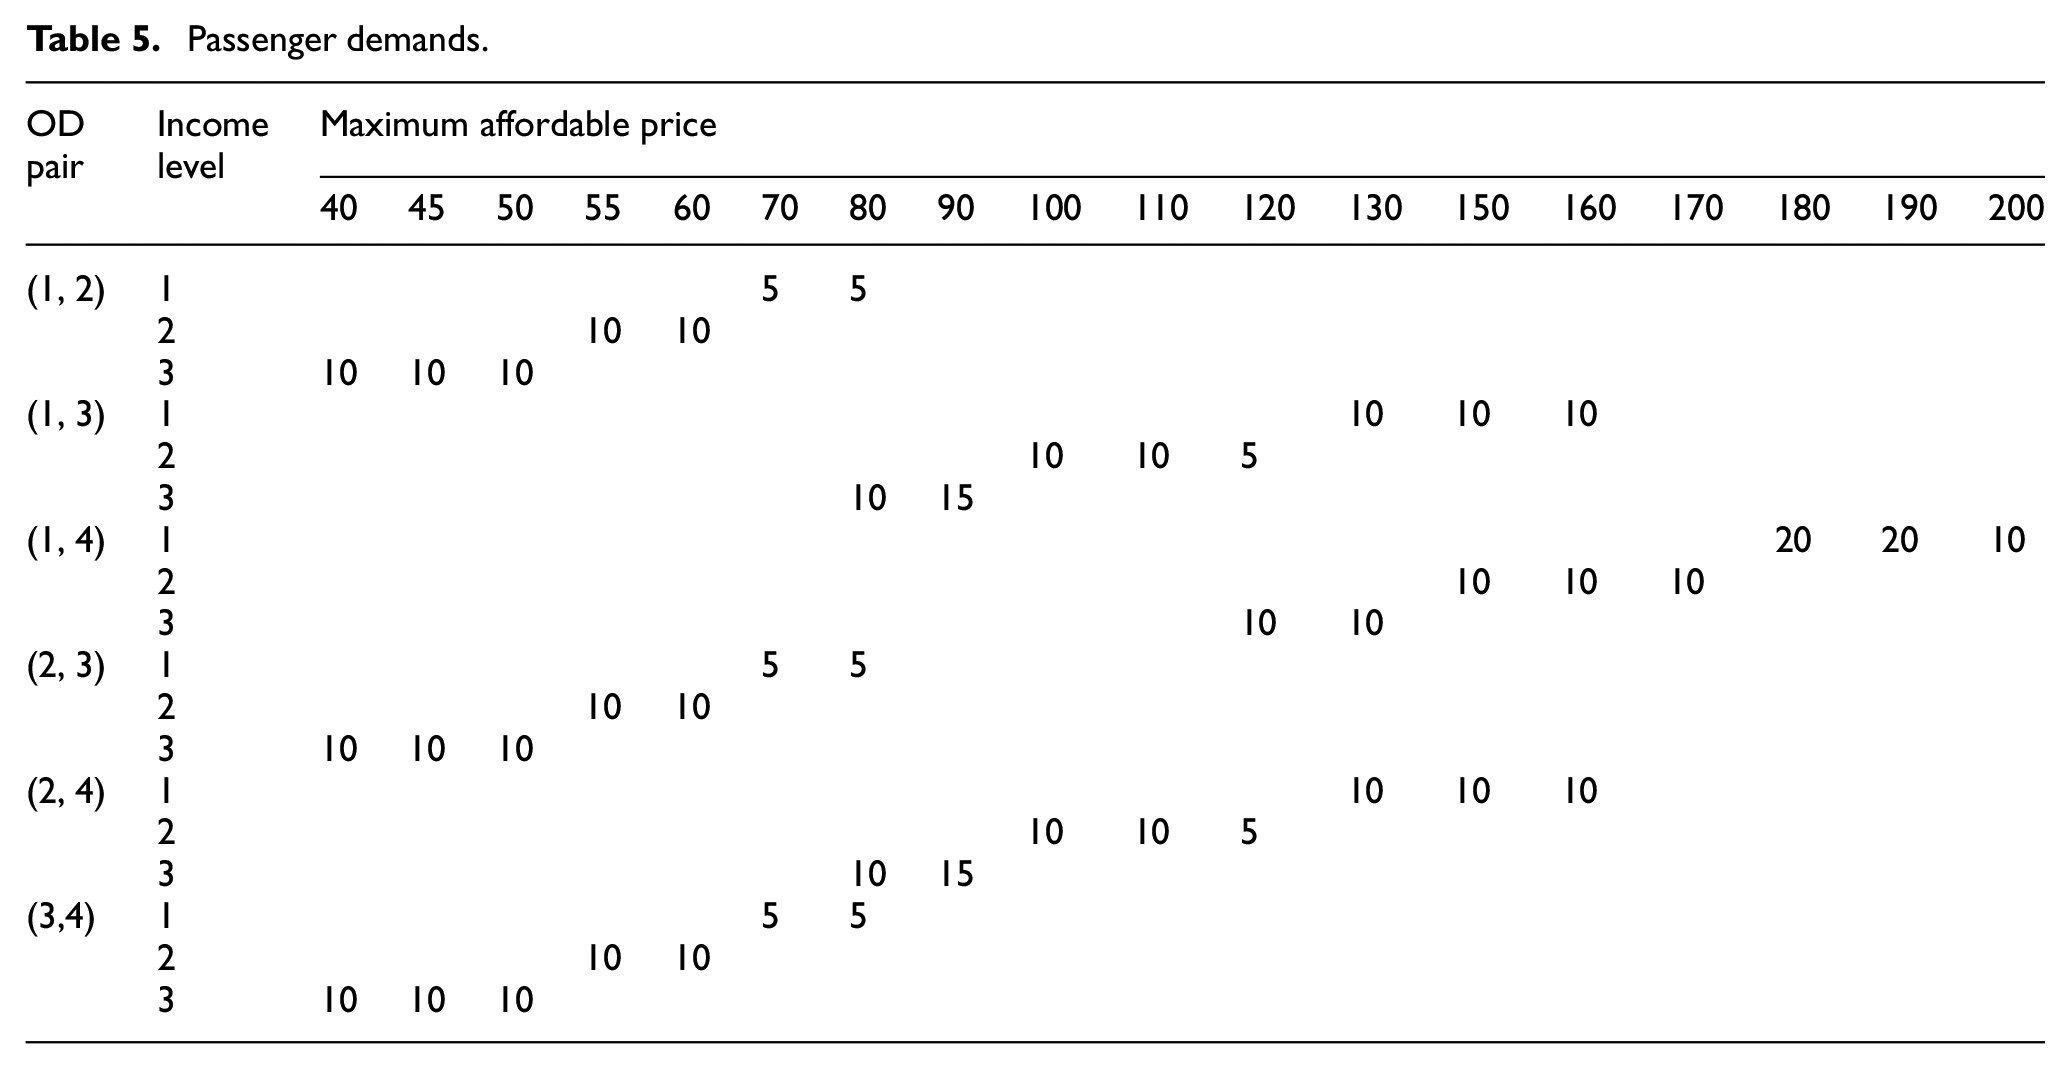
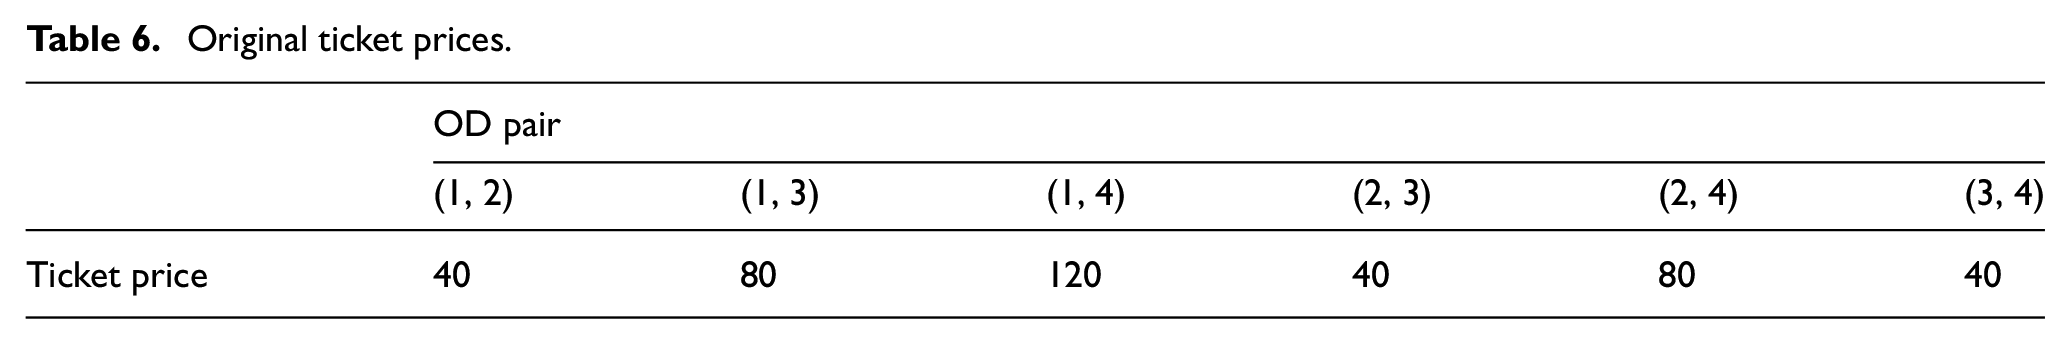
To transport all passengers, four trains, represented by T1, T2, T3, and T4, should operate on this corridor with the loading capacity of each train being 100. The running time in each section of the four trains is the same, that is, 20 min. The assumed dwell time of each train at each station that the train is required to stop at is 3 min. The additional running time for the acceleration and deceleration owing to a train stop is 2 and 3 min, respectively. The original ticket prices of different trains for the same OD pair are identical, and the prices for each OD pair are presented in Table 6. In this case study, the ticket prices range from 50% to 150% of the original prices. For example, the ticket price for OD pair (1, 2) can range from 20 to 60 yuan. The travel cost of the competing transportation mode is assumed to be 300 min for OD pair (1, 2), (2, 3) and (3, 4), 400 min for OD pair (1, 3) and (2, 4), and 500 min for OD pair (1, 4), respectively. Both
Original ticket prices.
Initial experiment
After a computational time of 678 s, an objective value of 41,500 is obtained with a relative gap of 0%, meaning the generated solutions are optimal. The detailed stop plan and passenger distribution plan for each train are displayed in Figure 2, and the optimized ticket prices are listed in Table 7.
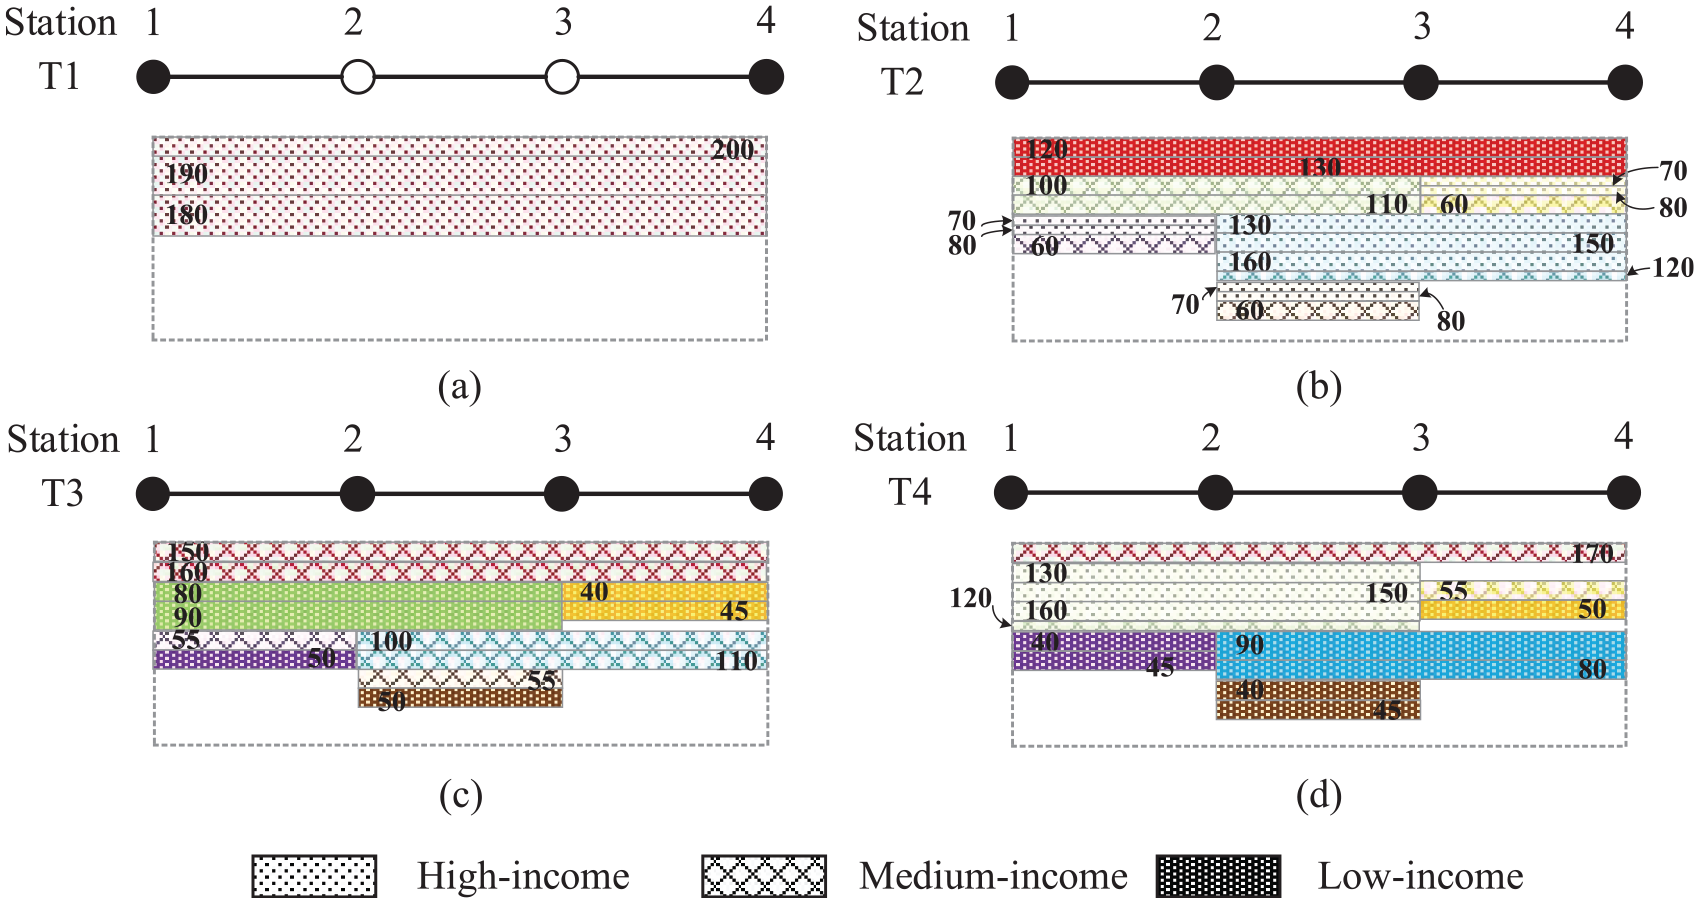
Detailed stop plan and passenger distribution plan for each train when the vertical and horizontal equity levels are 2.0.
Optimized ticket prices when vertical and horizontal equity level are 2.0.
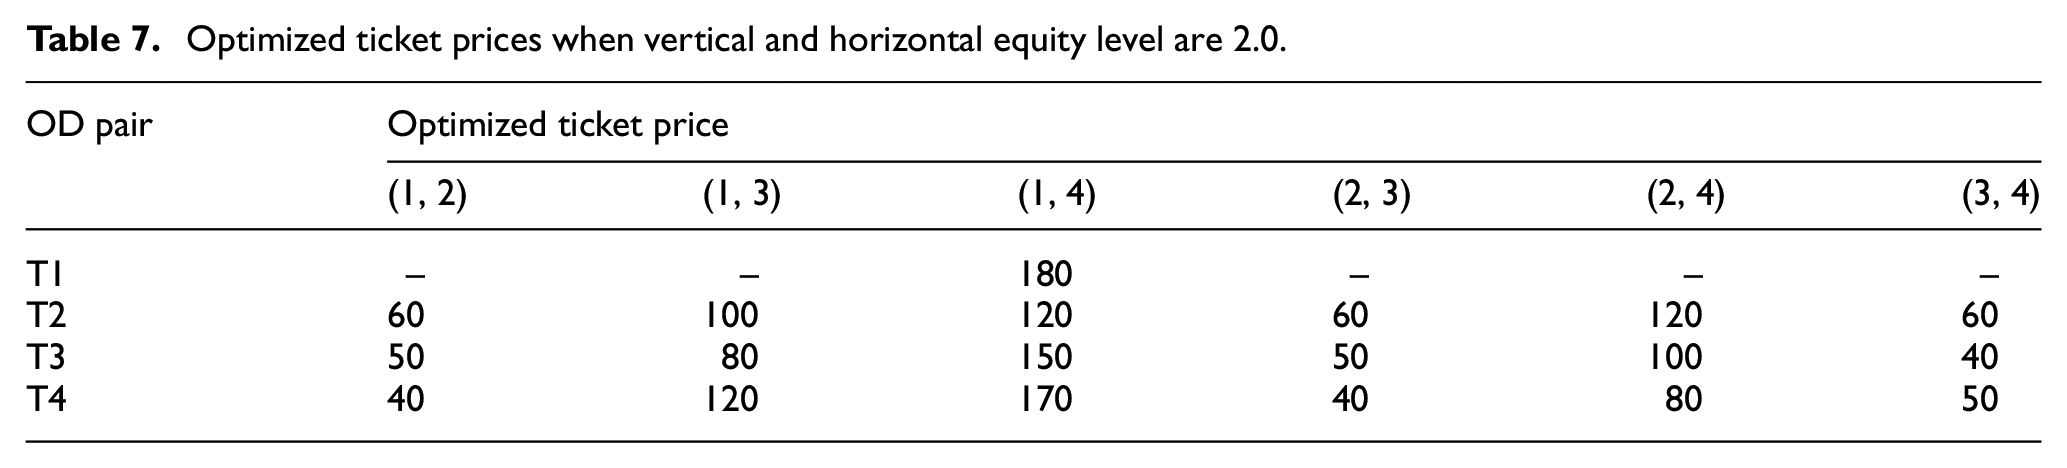
When a train is not required to stop at a station, no service will be provided to the passengers who depart from or arrive at this station. In other words, related tickets will not be sold to passengers. Therefore, the ticket prices are not presented in Table 7. In Figure 2, a solid dot indicates that the train should stop at the station, whereas a hollow dot indicates that a stop at the station is unnecessary for the train. Clearly, train T1 is a through train without stopping at any intermediate station, whereas trains T2, T3, and T4 stop at all the intermediate stations to ensure that the passenger demands can be satisfied. The total number of train stops is 14, which is consistent with the requirements.
To show the detailed passenger-to-assignment, an outer rectangle is used to characterize the train OD and train loading capacity, and various rectangles with different colors, patterns, and numbers are used to represent the passenger groups. The color shows the OD pair; the pattern represents the income level, and the number in a rectangle is the maximum affordable price of the passenger group. For example, 10 high-income passengers in OD pair (1, 4) with a maximum affordable price of 200 yuan are transported by train T1 in this experiment. It should be noted that the blank area in each outer rectangle indicates the wasted train capacity during the transportation process. Obviously, T1 has the lowest capacity utilization rate. Two reasons contributed to this case. First, only passengers in OD pair (1, 4) can travel by this train; second, the price for train T1 is 180 yuan, which is beyond the maximum affordable prices of the medium- and low-income passengers and accordingly, causes them to choose other trains. Furthermore, it can be observed that no passenger group is excluded from the HSR service because of the scientifically determined ticket prices. For instance, 20 low-income passengers in OD pair (1, 3) select train T3 for their journey because they cannot afford the ticket price of trains T2 and T4. Although 10 passengers among them can barely pay 90 yuan to travel, the ticket price is still set to 80 yuan to avoid the exclusion of the remaining 10 passengers from HSRs. In addition, from Table 7 and Figure 2, it can be easily seen that the ticket prices for high-income passengers are higher than for low-income passengers because they are less price-sensitive. Finally, we focus on medium-income passengers in OD pair (2, 3). Although 10 passengers with a maximum affordable price of 60 yuan are assigned to train T2 to generate more revenue, the required horizontal equity level of 2.0, can be ensured.
Additional experiments
Revenue and equity
This study aims to maximize the total ticket revenue of railway companies. However, the requirement for equity (
Results corresponding to different required equity levels.
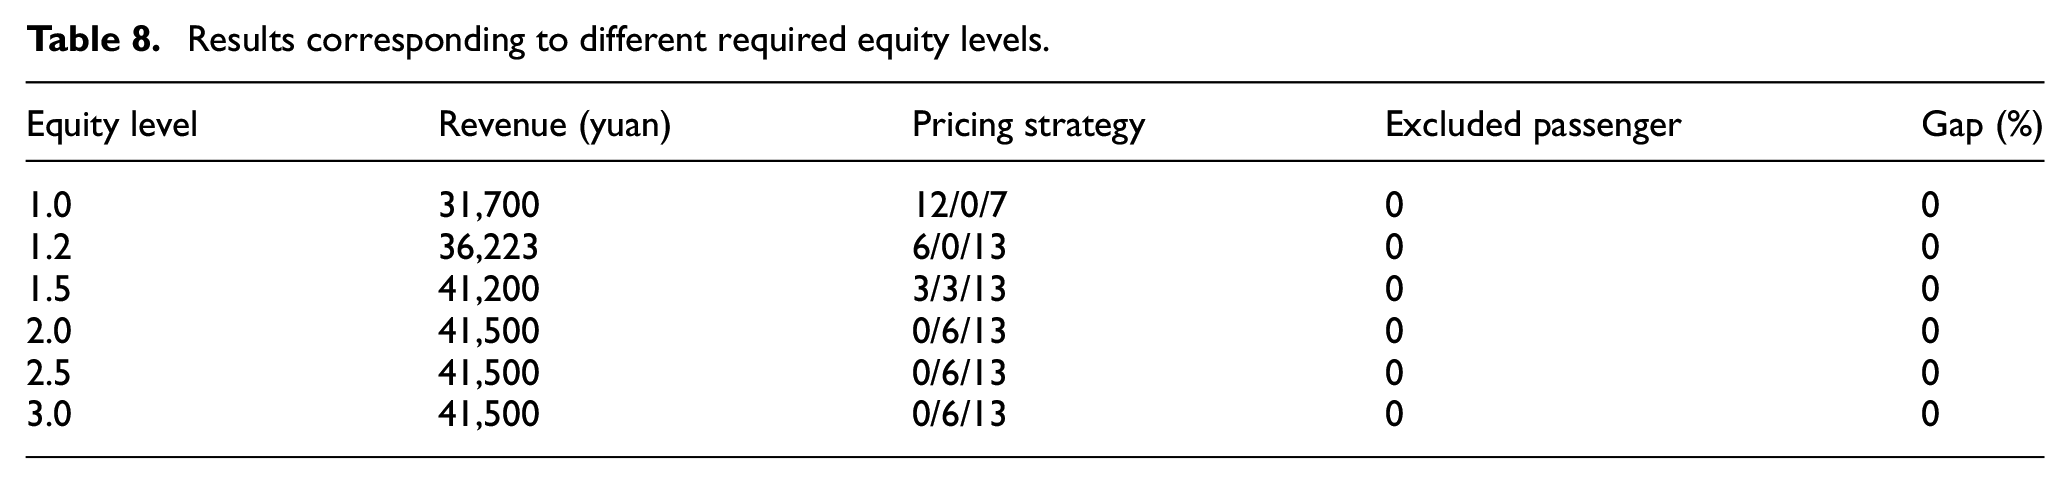
In Table 8, the first column represents the required equity levels. The second column shows the generated ticket revenue (i.e. the objective value). Owing to space limitations, the detailed ticket prices are not listed in Table 8. However, the pricing strategy is used to represent the changes in ticket prices implicitly. In the third column, the first number is the number of times the price-reducing strategies is applied, whereas the second and third numbers represent the applied times of the no-change and price-rising strategies, respectively. The fourth column represents the number of passengers excluded. The last column shows the relative gap between the obtained solution and the best possible solution.
The first and second columns in Table 8 are considered. As observed, the total ticket revenue remains at 41,500 yuan when the equity level changes from 3.0 to 2.0. This occurs because the ticket prices are optimized based on the maximum affordable price of each passenger group. Because the maximum affordable price is normally lower for low-income passengers, system-wide equity can be maintained at least at a level of 2.0. However, when the required equity level further decreases, the revenue also decreases because of the need for more frequent use of price-reducing strategies to improve equity performance, as indicated in the third column. Obviously, a trade-off between revenue and equity levels should be achieved. Furthermore, it can be found that no passengers would be excluded from HSR no matter what level the equity is required to be kept, when the total number of train stops is less than 14. The last column indicates that the optimal solutions are obtained.
Revenue and train stop
The train stop constraints are proposed to ensure the service quality. In this section, two additional sets of experiments are conducted to test the influence of parameter
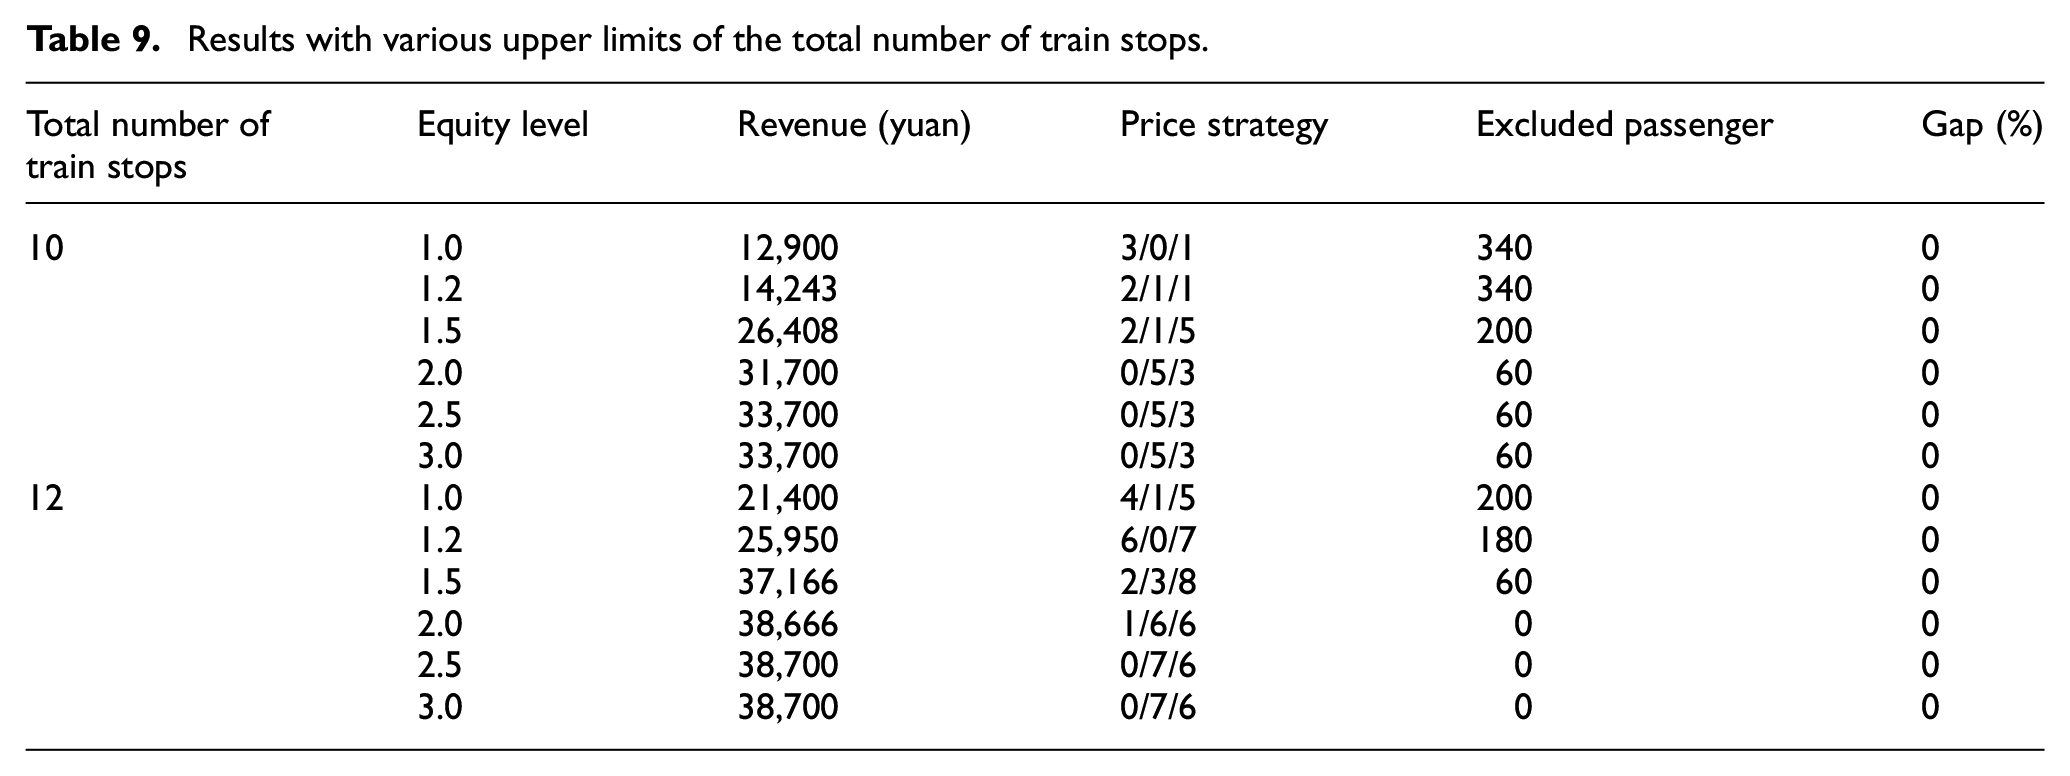
Results with various upper limits of the total number of train stops.
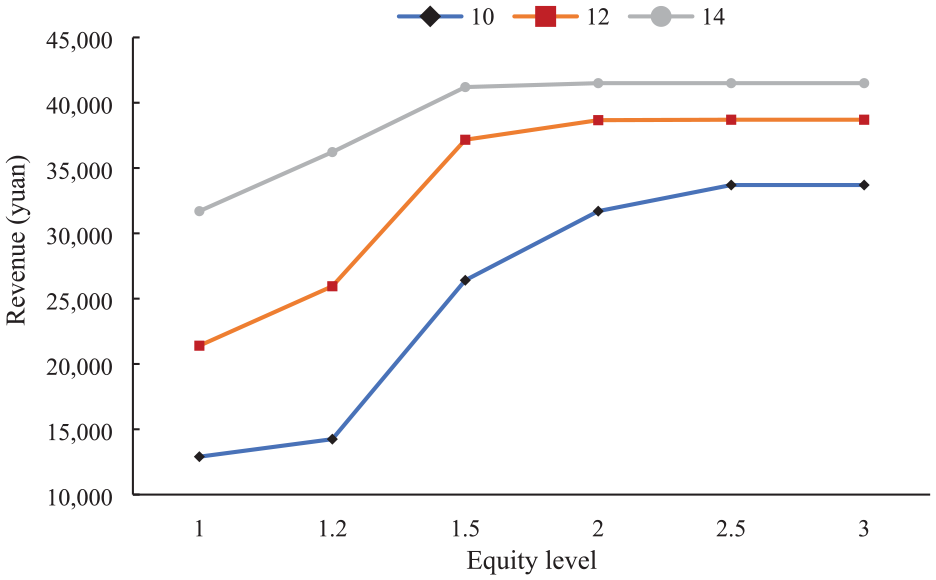
Relationships between revenue and equity level under different upper limits of the total number of train stops.
In Table 9 and Figure 3, it is clear that the revenue is positively correlated with the equity level under different requirements for the total number of train stops, meaning the railway company has to sacrifice its economic benefits to improve equity performance. At a specific equity level, revenue would also decrease with the decreasing upper limit of the total number of train stops. This is mainly a result of limited transportation accessibility. When the total number of train stops is strictly constrained, on the one hand, the passengers in some OD pairs would have to switch to other transportation modes because these OD pairs are served by no trains; conversely, the service frequency of some pairs would decrease and part of high-income and low-income passengers need to be assigned to the same train. From the “Excluded passenger” column, it can be concluded that the number of excluded passengers would increase with decreasing
Travel cost of different passenger groups
In this study, the equity performance is evaluated based on the average travel cost of different passenger groups. In this subsection, we track the travel cost of passengers in OD pairs (2, 4) under the required total number of train stops of 12 and 14, respectively.
First, vertical equity is examined. As shown in Figure 4, when the parameter
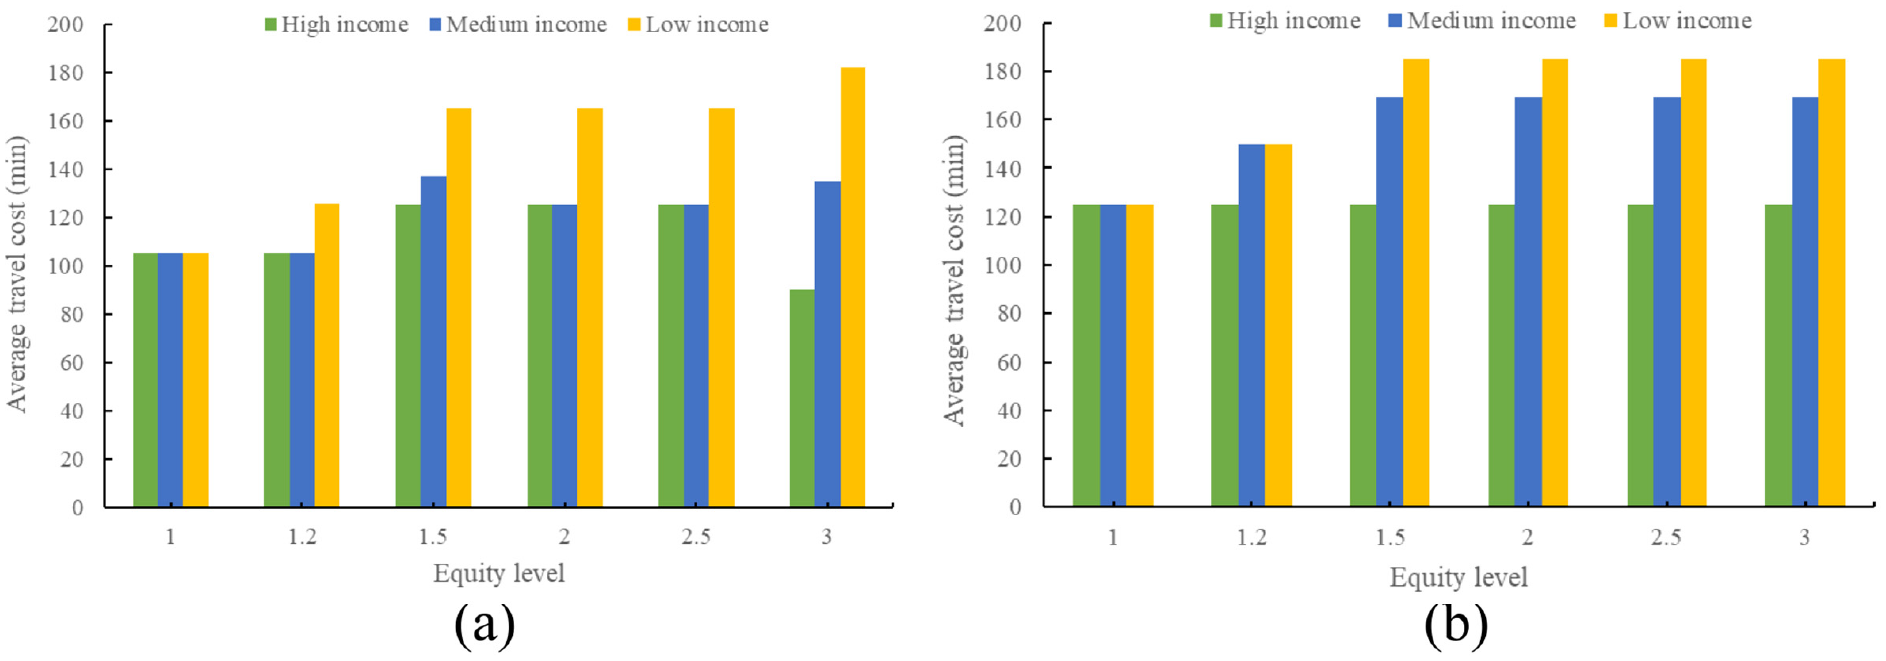
Average travel cost of passengers in OD pair (2, 4) at different income levels with the parameter
Horizontal equity is then examined. In Figure 5, the maximum and minimum travel costs of passenger groups with different maximum affordable prices are illustrated. It can be discovered that horizontal equity has stable performance. Obviously, when passenger groups in the same OD pair and at the same income level are assigned to the same train, they will have the same travel cost. When they are assigned to different trains, there will be a small gap between the ticket prices for them because they have similar maximum affordable prices.
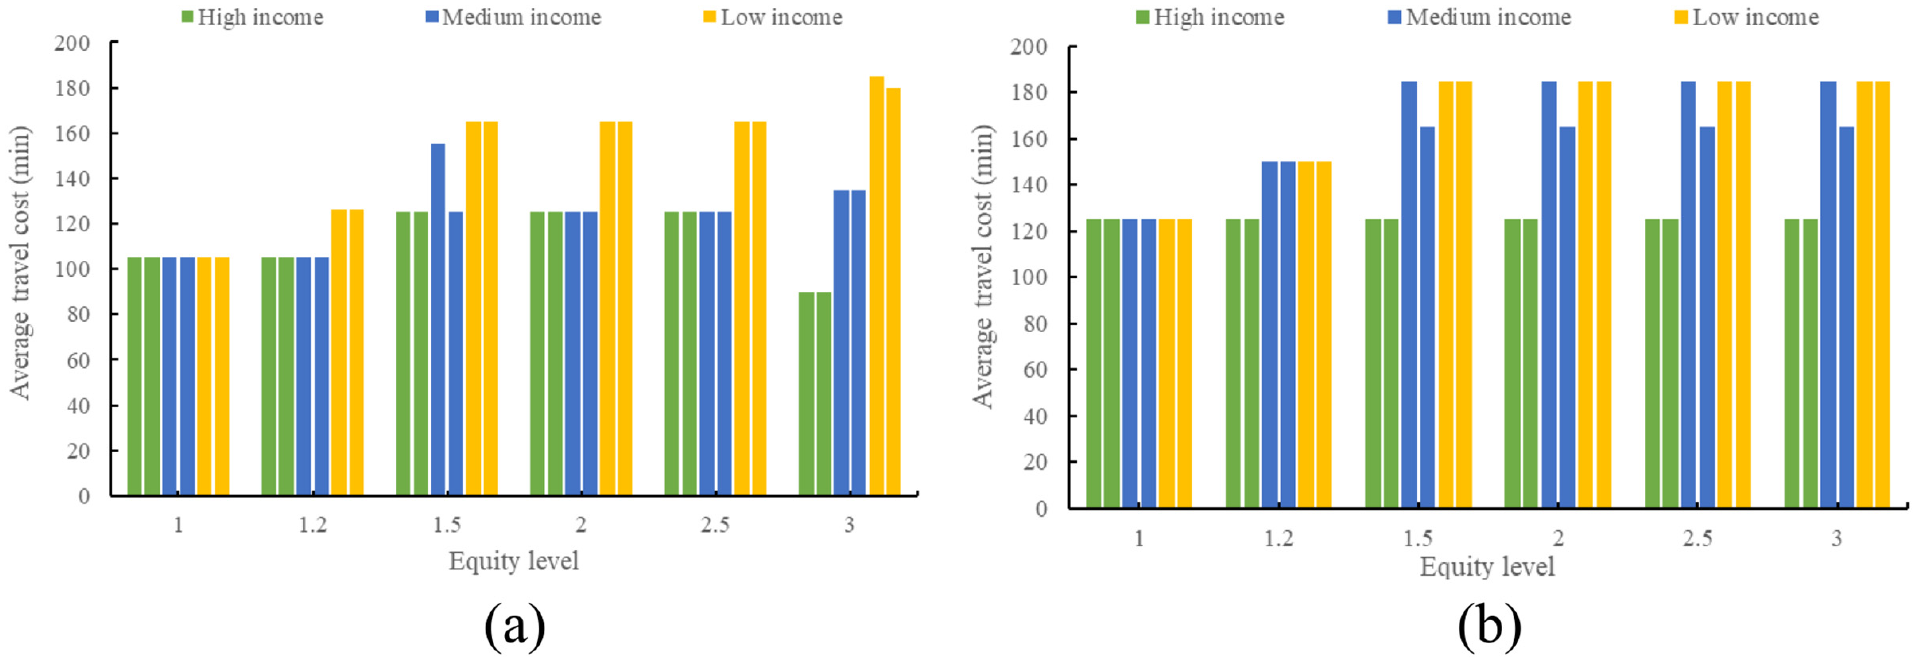
Travel cost of different passenger groups in OD pair (2, 4) with the parameter
Fare rates of different passenger groups
Passenger heterogeneity is considered in this study. Specifically, passengers are sensitive to ticket prices at different levels. Therefore, a set of experiments is also implemented to investigate the fare rates for passengers belonging to different economic classes when the total number of train stops is required to be less than 14. Six equity levels are considered in each set of experiments, which are the same as those in former experiments. The results are listed in Table 10. The third column represents the total revenue generated from passengers at different income levels, whereas the fourth column represents the average ticket price per person and kilometer for different types of passengers.
Ticket pricing for passengers at different income levels.
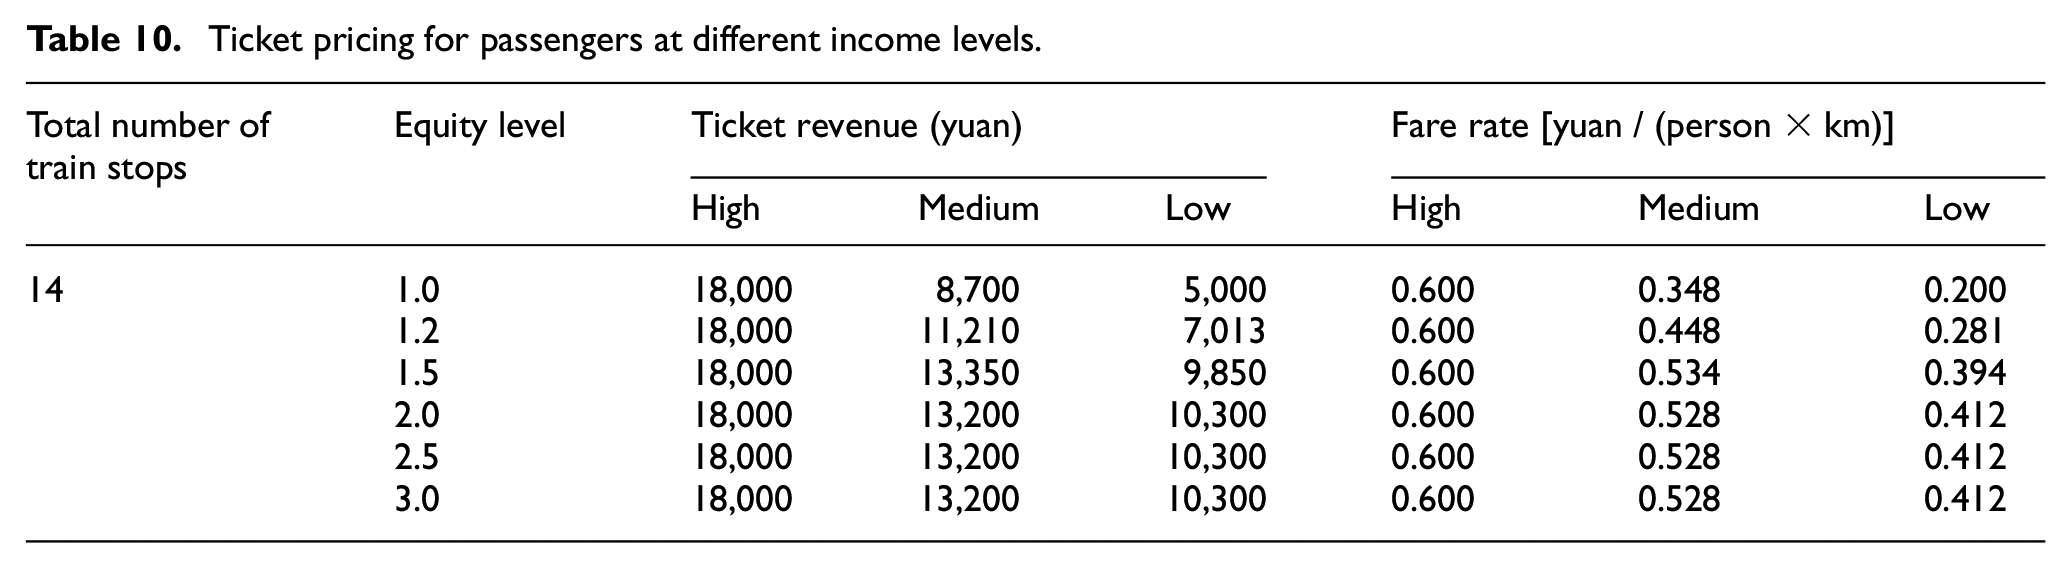
In Table 10, it is apparent that the fare rate for high-income passengers is much larger than that for medium- and low-income passengers. Accordingly, high-income passengers generate the highest revenue. With stricter requirements for equity, the fare rate for low-income passengers shows a decreasing trend, and the difference between the fare rates for high-income and low-income passengers gradually increases, as illustrated in Figure 6. This indicates that the tickets are priced with consideration of the income of passengers. Specifically, a low-pricing strategy is adopted for low-income passengers to decrease their travel cost and thus improving equity, whereas high-income passengers contribute to increased revenue owing to their low sensitivity to price.
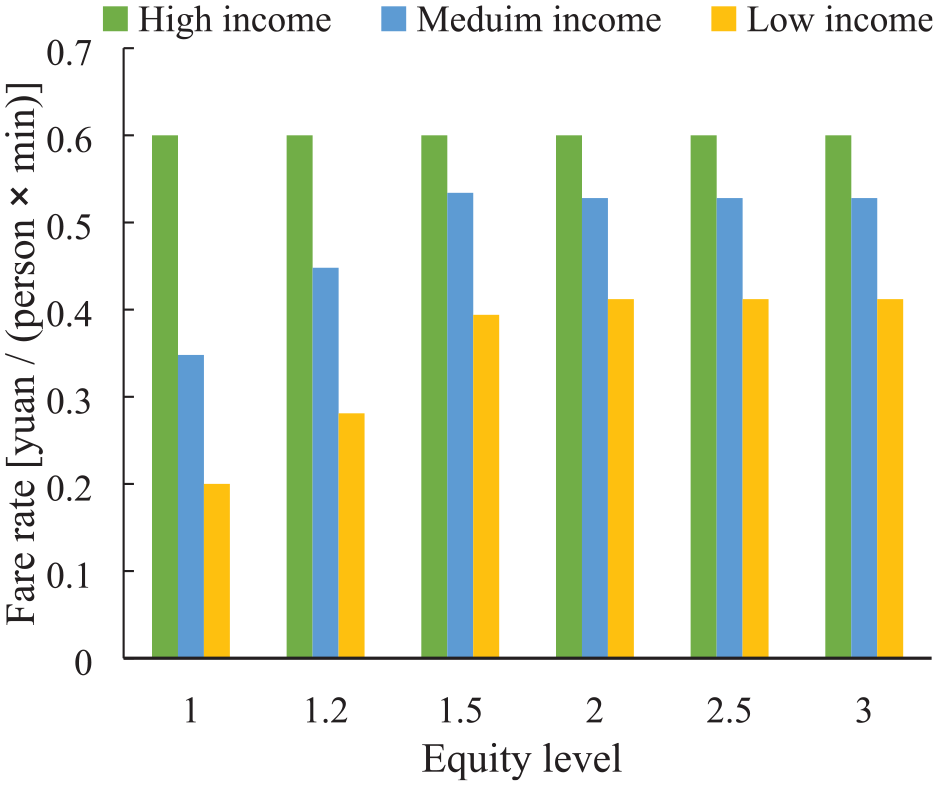
Fare rates for different types of passengers with the parameter
A real-world experiment
To further test the application of the developed model, a real-world experiment on the Zhengzhou-Xi’an HSR corridor is implemented in this section.
Case introduction and data preparation
To conduct the experiments, the basic input data related to this corridor are prepared. As shown in Figure 7, there are 10 stations and nine sections on the Zhengzhou-Xi’an HSR corridor with a total length of 523 km. The lengths of each section are shown in Figure 7. Because the Zhengzhou East and Zhengzhou West stations are both in the same city, the Zhengzhou West station is not considered in this study. Note that this study considered the direction from Zhengzhou East to Xi’an North only.
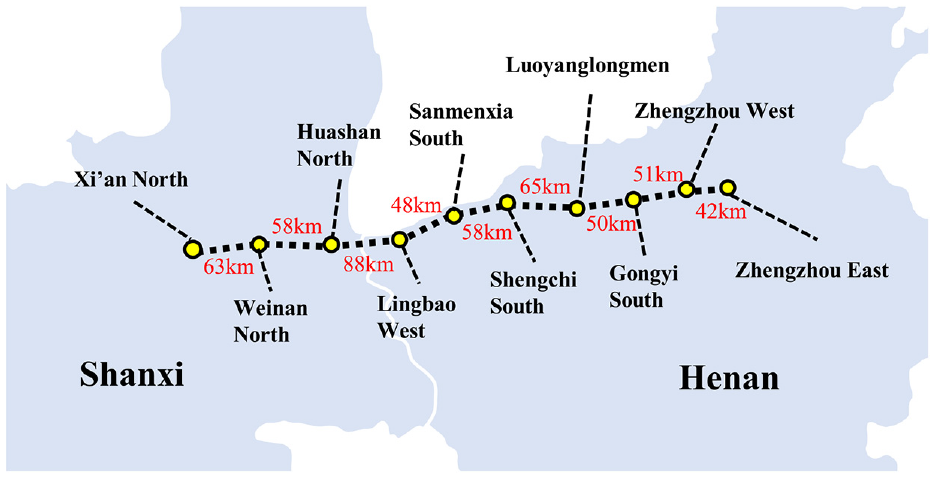
Map of the Zhengzhou-Xi’an HSR corridor.
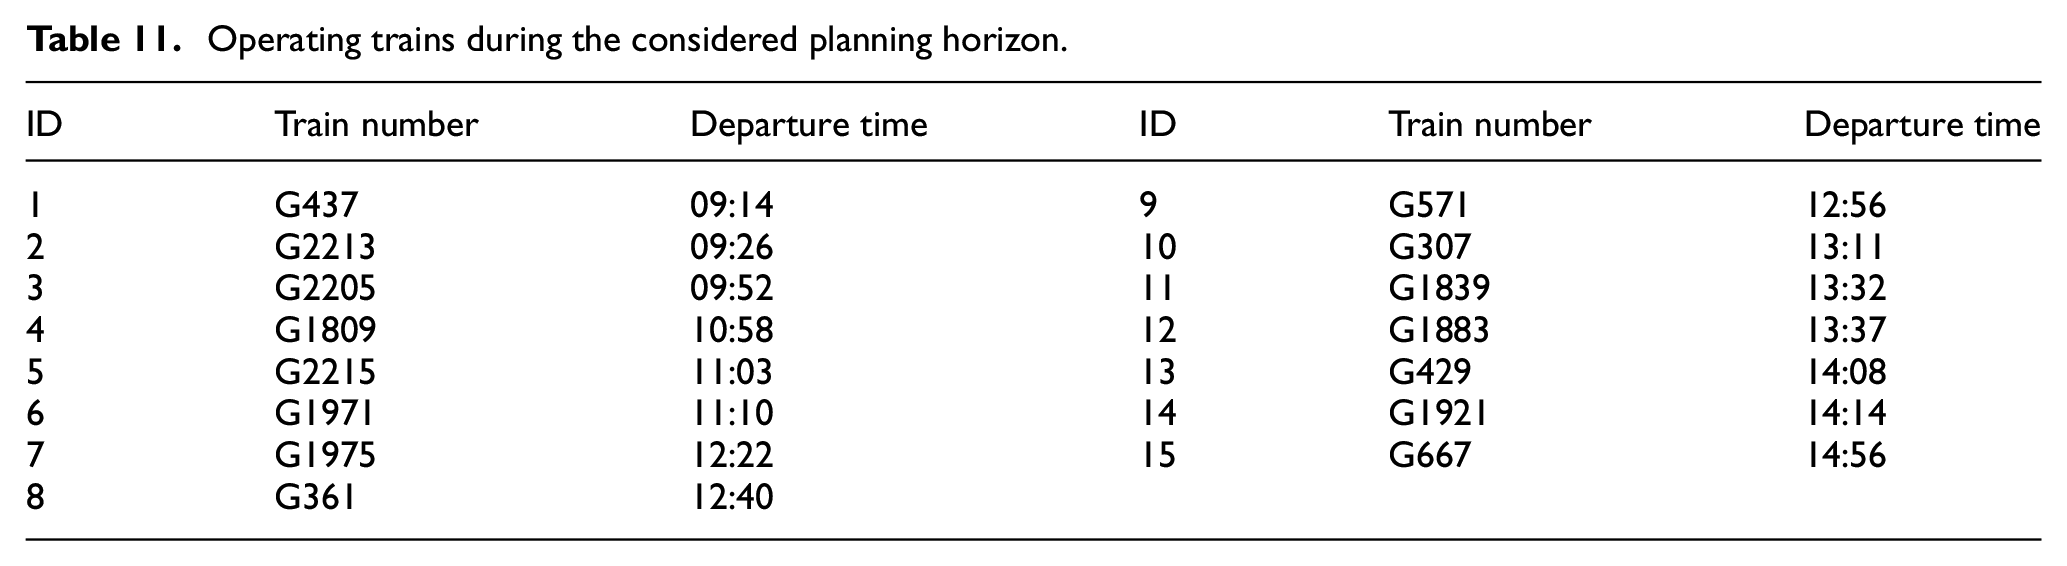
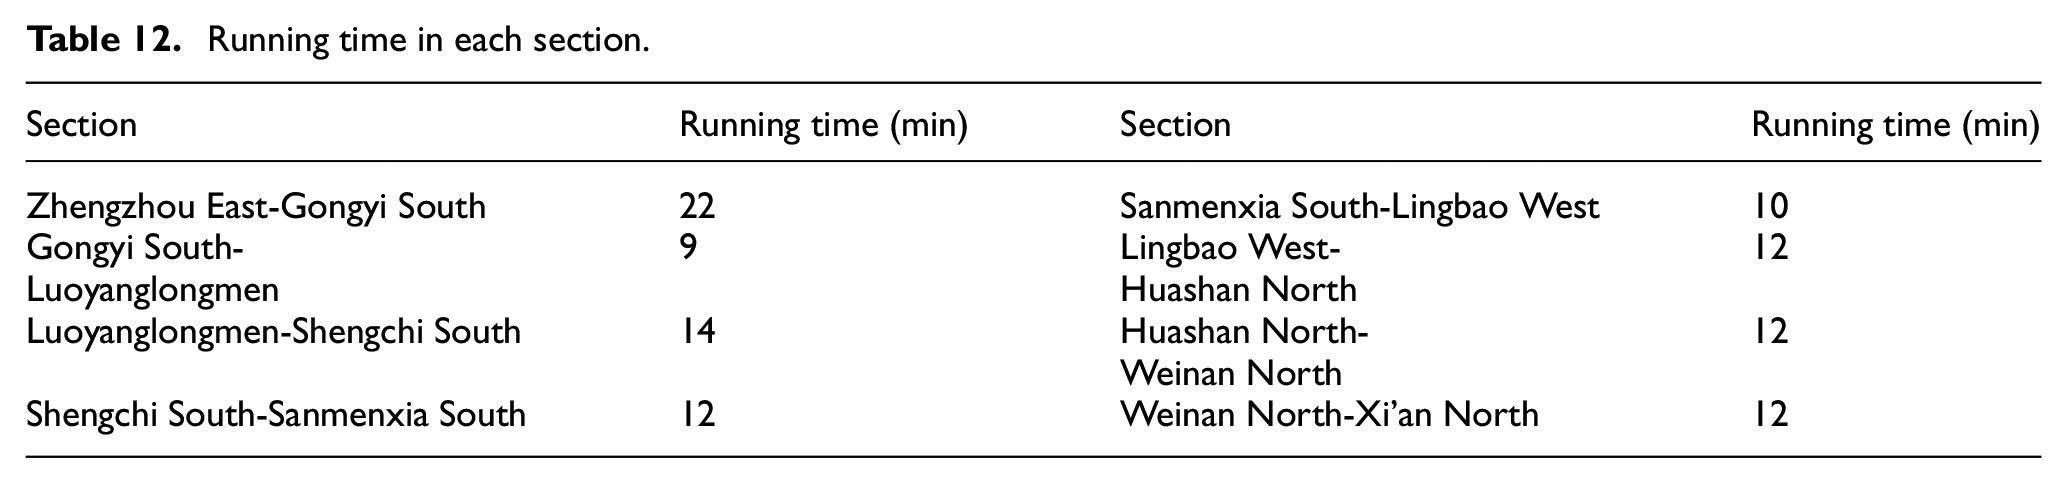
A planning horizon of 6 h, from 09:00 a.m. to 03:00 p.m. is considered in this study. Because the trains operating during the period are close in departure time, the effect of deviation between preferred and actual departure time on passenger travel cost can be dismissed. Based on the timetable of February 2021, 15 trains are in operation during this period, which are listed in Table 11. These trains operate at a speed of 300 km/h, and the running time in each section is listed in Table 12. The additional running time for the acceleration and deceleration owing to a train stop is set to 2 and 3 min, respectively. The dwell time of each train at each station in which the train is required to stop at is assumed to be 3 min. The train capacity is 610.
Operating trains during the considered planning horizon.
Running time in each section.
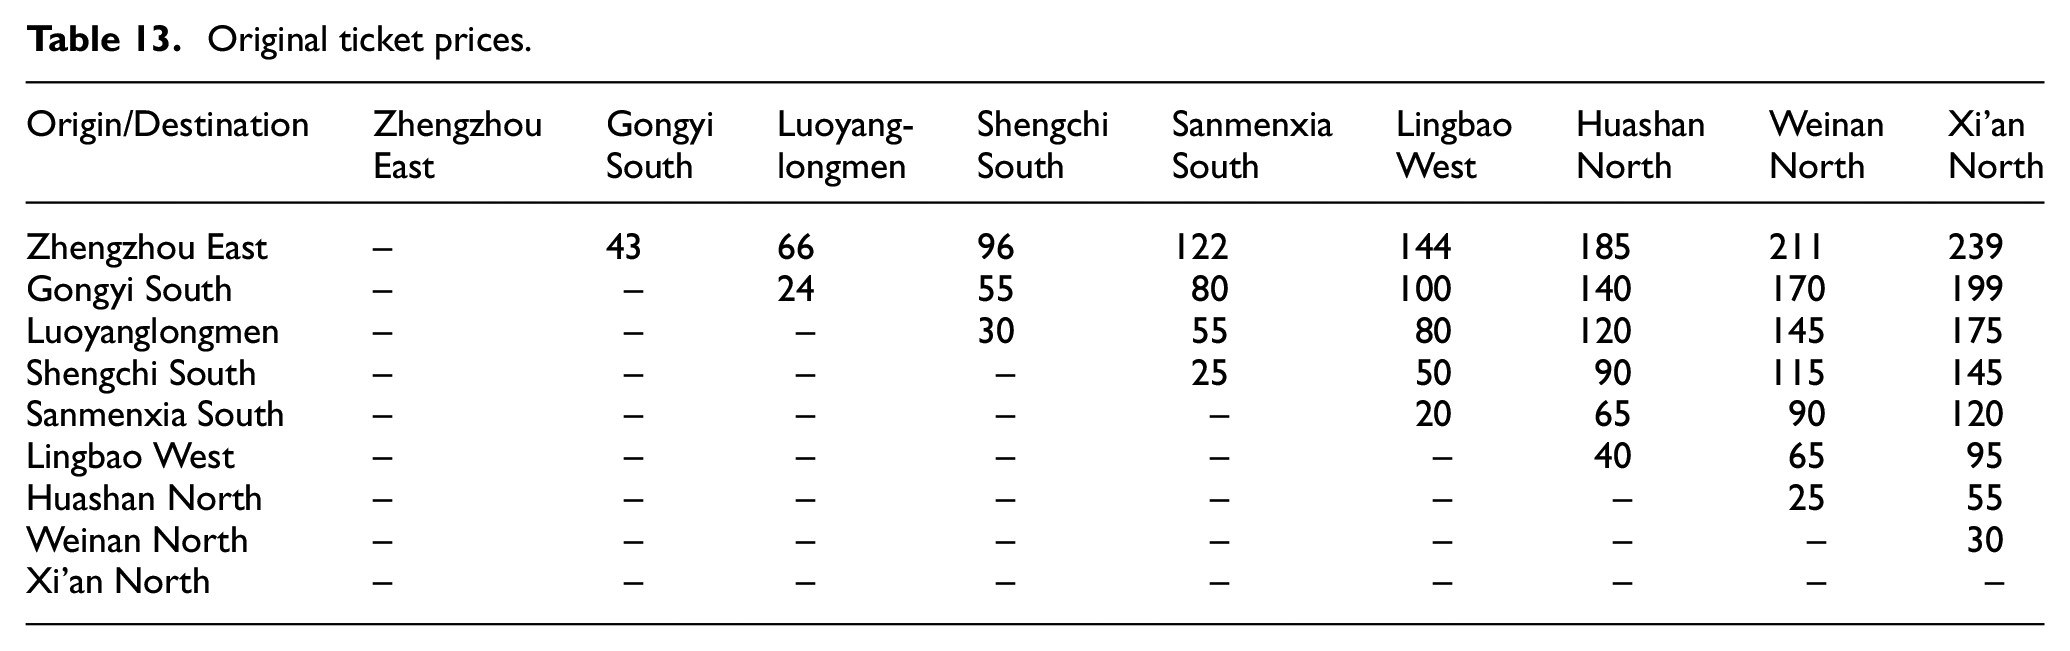
Similar to the small case study, the values of parameter
Original ticket prices.
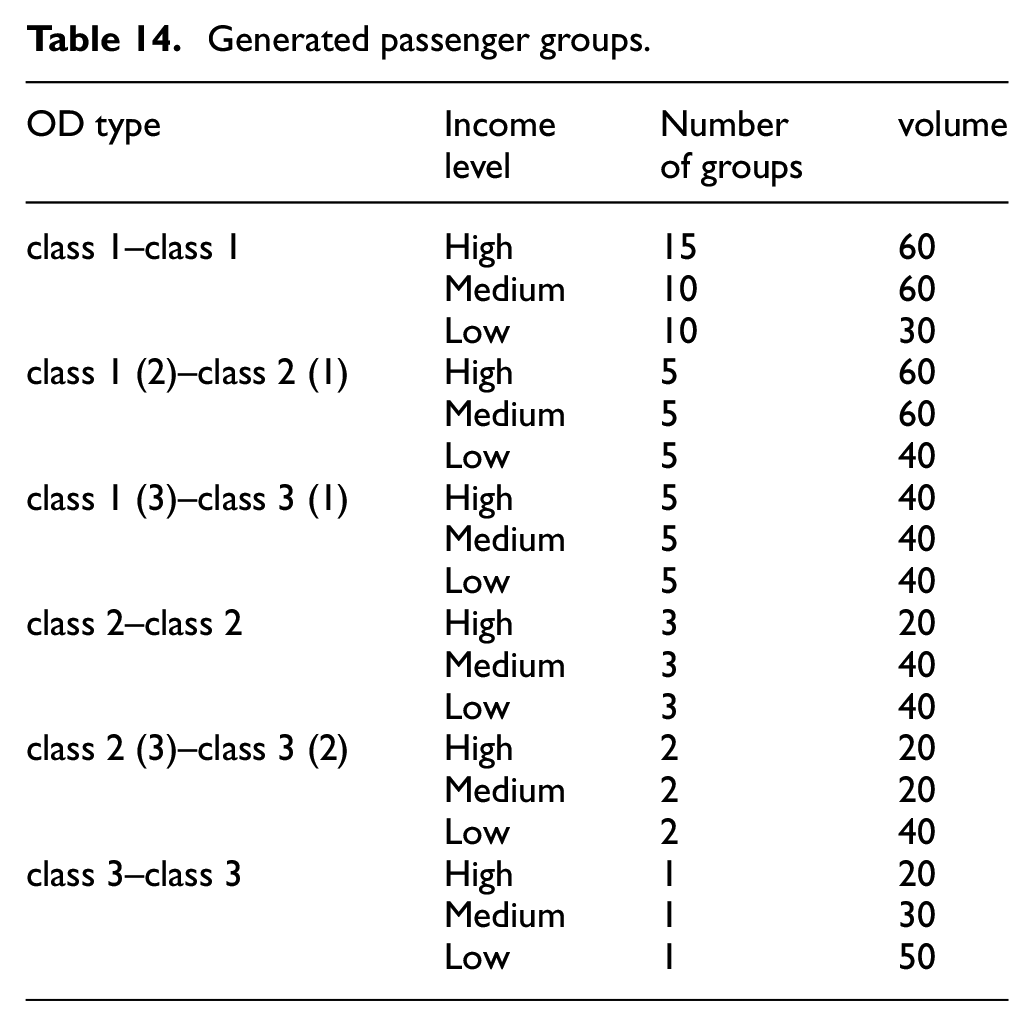
To implement the experiment, passenger demands in the considered planning horizon are required. However, given that actual passenger demands are difficult to be obtained, the artificial values are used in the sets of experiments. First, the stations along the HSR corridor are classified into three groups (i.e. class 1, class 2, and class 3) based on the population of the cities where the stations are located. The Zhengzhou East and Xi’an North stations belong to the class 1 group; Luoyanglongmen, Sanmenxia South, and Huashan North belong to the class 2 group, whereas the remaining stations belong to the class 3 group. Next, the OD-based passenger demands are generated based on the station class. Finally, the passengers are divided into 362 groups based on the OD pair, income level, and maximum affordable price. Detailed information about the passenger groups is presented in Table 14. Although passenger demands are not completely precise, these data can demonstrate that our approach is practical.
Generated passenger groups.
Computational results
To test our approach on the real-world HSR corridor, the parameter
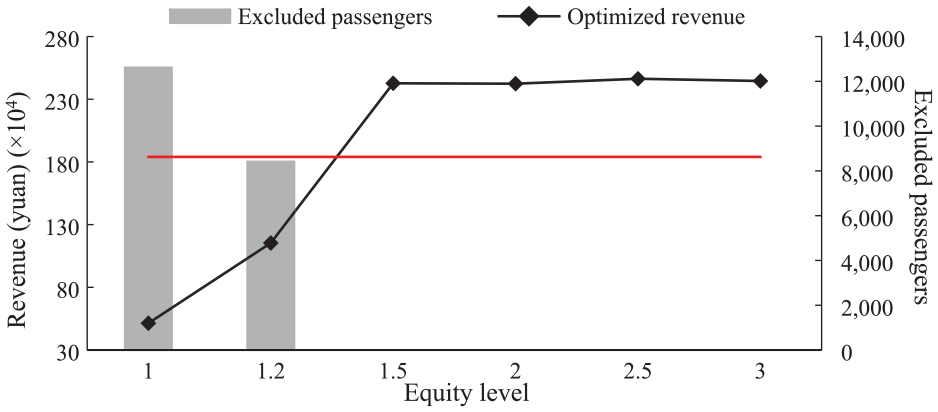
Total ticket revenue and number of excluded passengers with different equity levels when
With the original ticket prices, the total revenue is calculated as 1,840,140 yuan, as indicated by the red line in Figure 8. Applying our approach, the optimized ticket revenue substantially increases when
Because the requirement for the total number of train stops also exerts a significant influence on the results, another set of experiments are conducted by changing the values of parameter
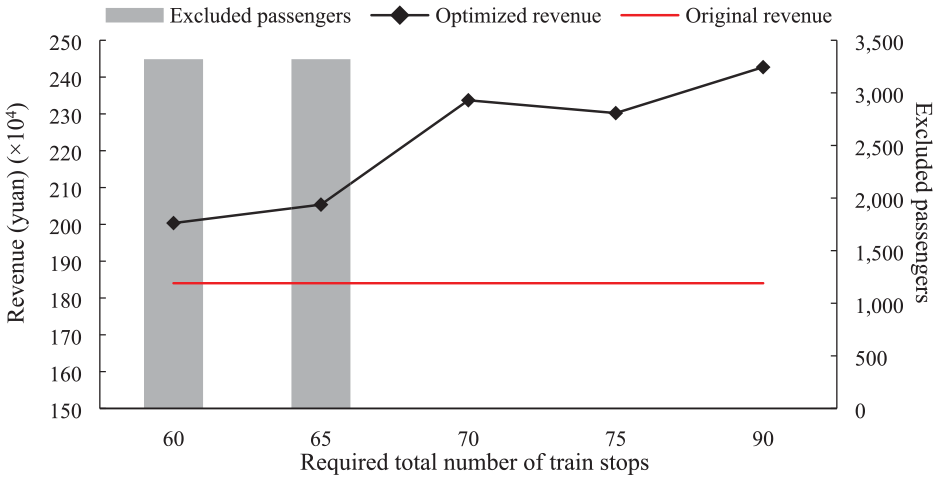
Total ticket revenue and number of excluded passengers with different requirements for the total number of train stops when
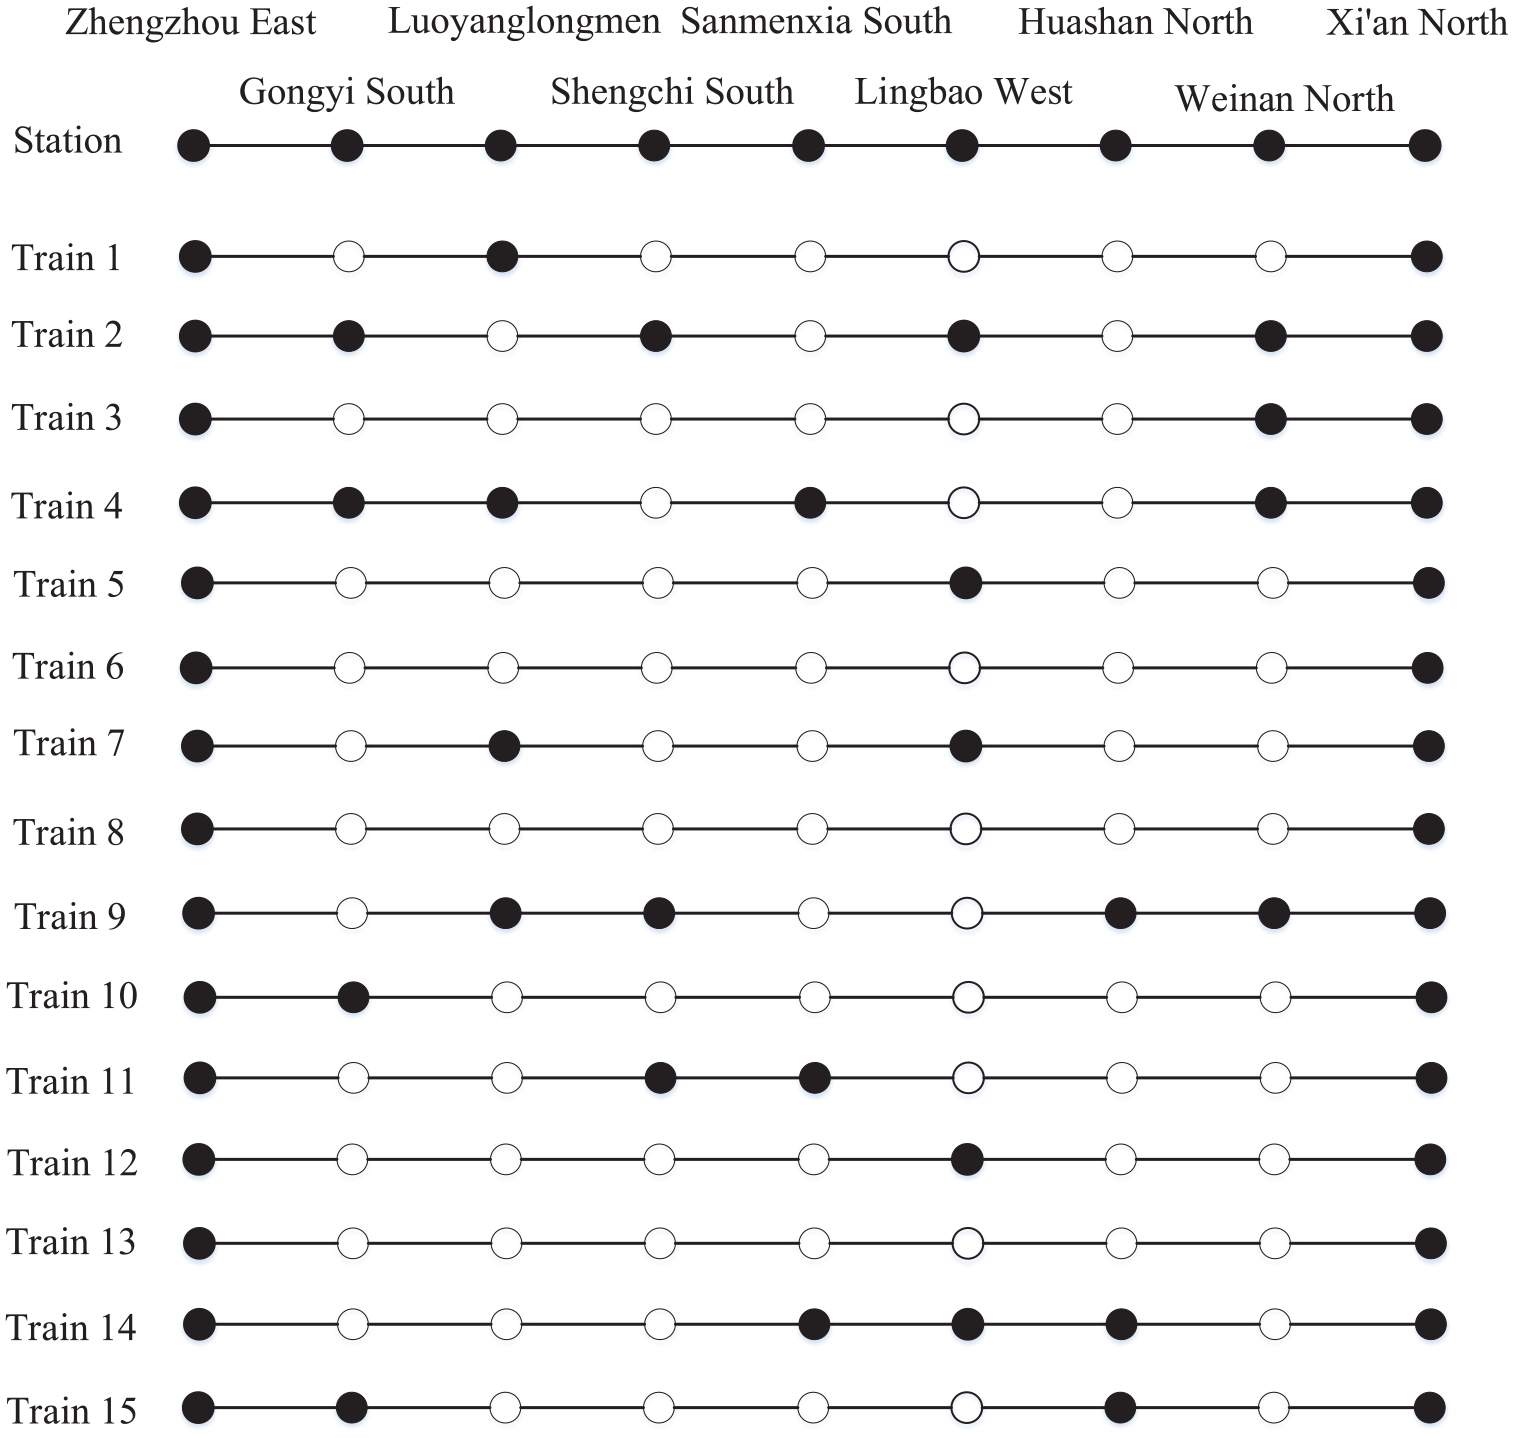
The detailed stop plan for each train when
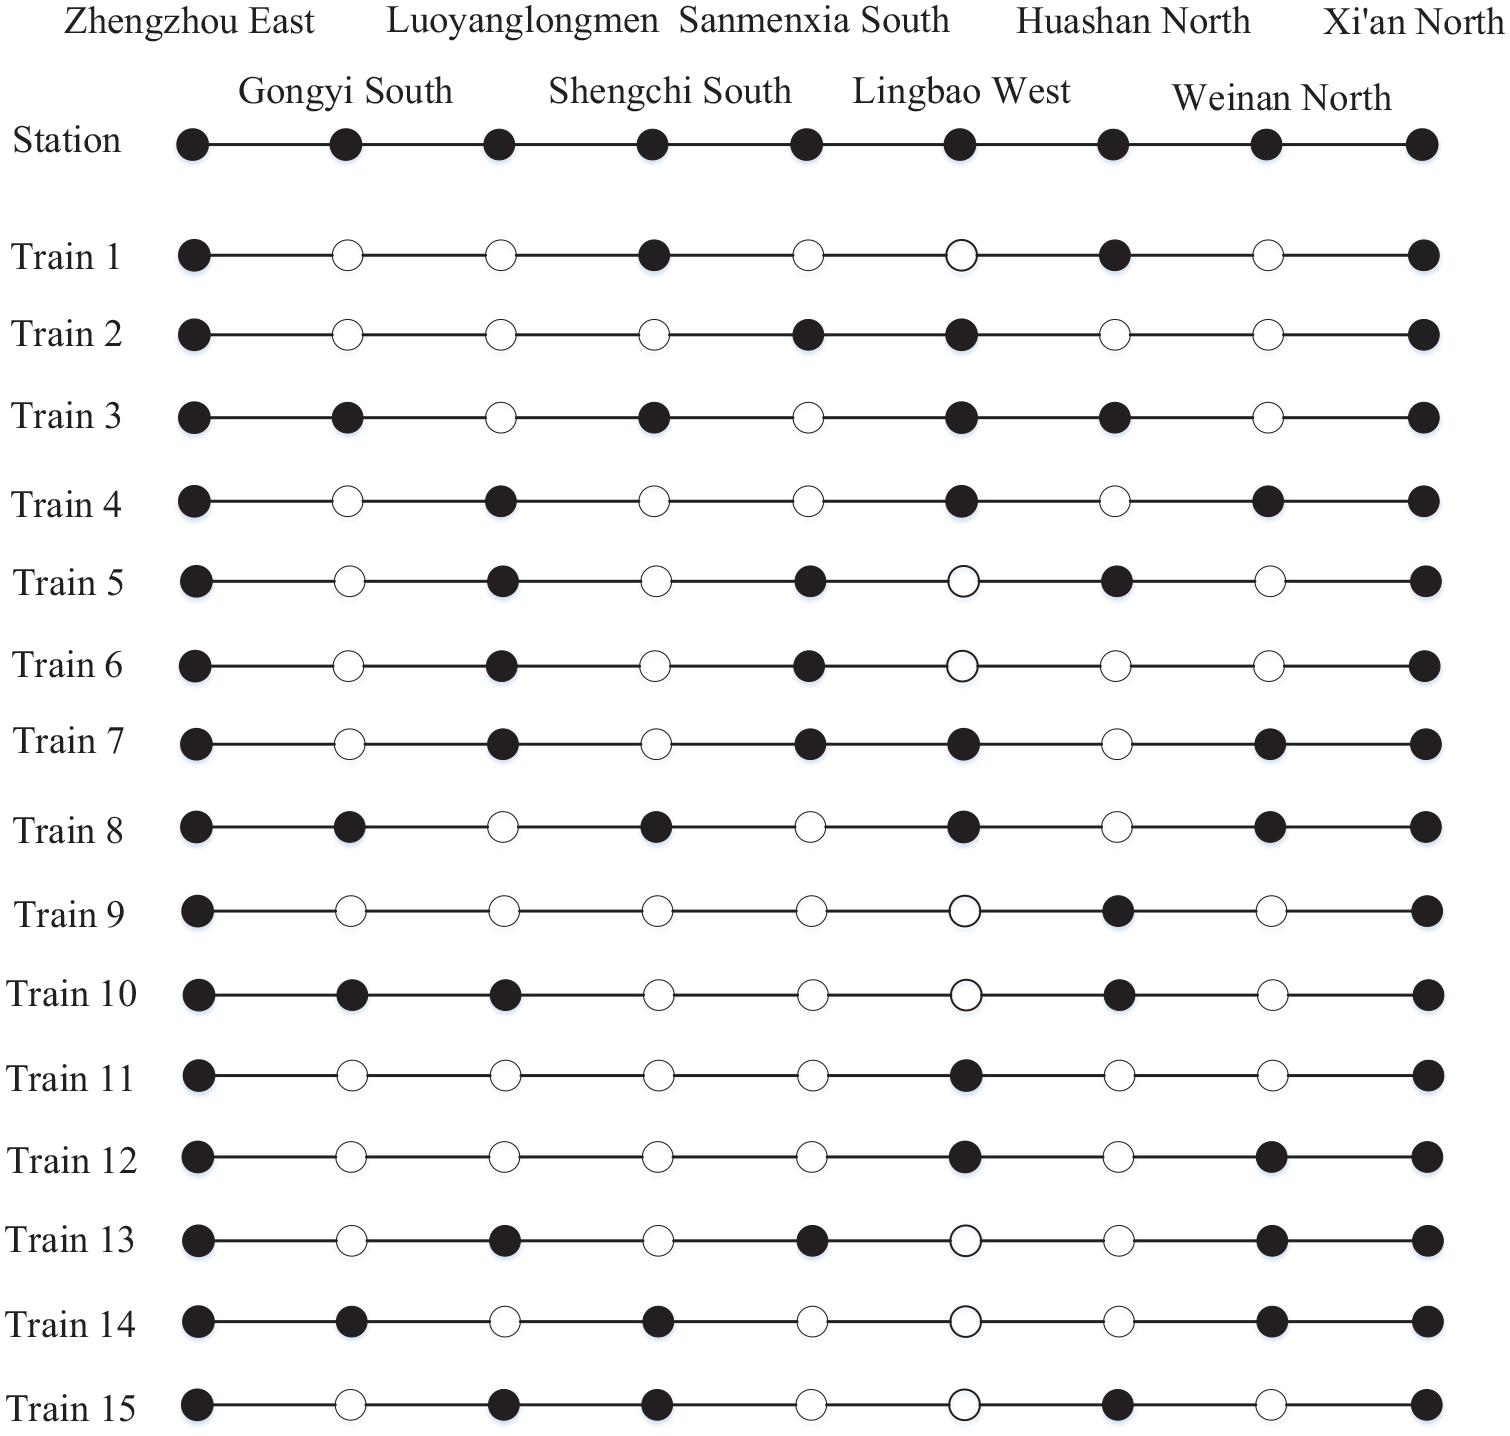
Obtained stop plans when
Furthermore, it is essential to compare our integrated approach with the conventional train stop planning method (see Appendix A). The parameter
Obtained stop plans with the conventional method.
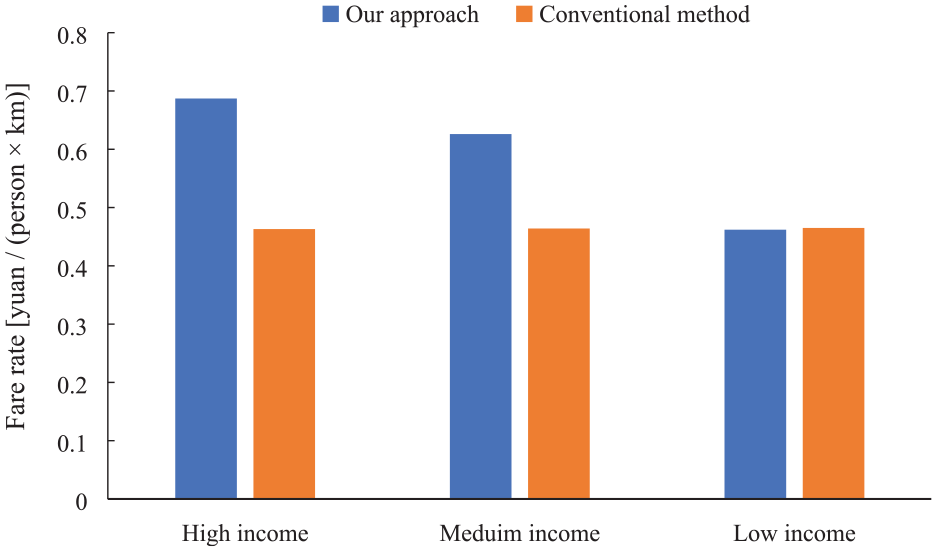
Fare rates for the passengers at different income levels with our and conventional method.
Conclusions and future research
To the best of our knowledge, this is the first study to solve the integrated train stop planning and ticket pricing problem for HSR corridors. The considered problem is modeled as a mixed-integer linear programming problem to maximize the total ticket revenue, whereas the service quality and equity performance is ensured by adding related constraints. Numerical experiments are implemented on a sample railway line and the Zhengzhou-Xi’an HSR corridor to demonstrate the application of our approach. The results indicate that: (1) Total revenue and equity levels conflict. (2) The total number of train stops also exerts a negative influence on revenue. (3) Some passengers would be excluded from HSR when the requirements for the equity level and total number of train stops are stringent. (4) The fare rate for low-income passengers is lower than that for high-income passengers to ensure the equity level. (5) Compared to the conventional train stop planning method, our approach may produce more train stops; however, it is conducive to increasing the revenue, as well as ensuring equity performance.
However, this study has several limitations, which can be the research directions in the future. (1) The maximum numbers of passengers that want to travel by HSRs are treated as fixed values, which means the uncertainties (for instance see Altan et al., 26 Karasu and Altan 27 ) in passenger demands are not considered. Therefore, the stochastic optimization methods (for instance see Mohamed et al., 28 Zou et al. 29 ) can be used to deal with the uncertainties in the future. (2) The computational efficiency is limited. For larger real-world cases (i.e. the number of stations increases to 20), the solutions with a relative gap smaller than 10% cannot be found within 6h. A more efficient algorithm should be designed to search for solutions for future studies. (3) The passenger travel cost is also affected by the train departure time, which is ignored in this study. If it deviates far from the passengers’ expected departure time, the cost would increase sharply. Therefore, it is necessary to incorporate train timetabling into our problem.
Footnotes
Appendix A
Declaration of conflicting interests
The author(s) declared no potential conflicts of interest with respect to the research, authorship, and/or publication of this article.
Funding
The author(s) disclosed receipt of the following financial support for the research, authorship, and/or publication of this article: This work is supported by the Technology Research and Development Plan of China State Railway Group [grant number: 2020F016]. The work presented in this paper remains the sole responsibility of the authors.