
Abstract
One of the main important issues in Data Envelopment Analysis (DEA) is to recognize the set of anchor points which is the subset of the extreme efficient points of the production possibility set (PPS). An anchor point is an extreme efficient point which is located on the intersection of the strong efficient frontier and the weak efficient frontier. In the other word, each anchor point delineate the strong efficient frontier from the weak efficient frontier. So, if a decision making unit (DMU) is an anchor point, then there is at least one supporting hyperplane whose the gradient vector has some of zero components, and so some input\output factor does not play any role in the performance of the unit under evaluation. The concept of anchor point was used in DEA for the generation of unobserved DMUs in order to extend the DEA efficient frontier and so, this concept plays a critical role in the DEA theory and its applications. Given the importance of the anchor pints in the DEA literature, this study focuses on finding the anchor points and presents a new method to search the anchor points of the PPS under the variable returns to scale (VRS) assumption. For this purpose, we use the definition of the anchor points and present an approach to find the anchor points of the PPS. The proposed method is based on finding the weak and strong defining supporting hyperplanes passing through the unit under evaluation. The main advantage of the proposed method is that it exactly uses the definition of the anchor points to provide the approach and it is very simple to use and the anchor points can be easily identified by solving two simple models. In addition, the proposed approach is such that in addition to determining the anchor points, it also finds two important defining supporting hyperplanes on the PPS, which can be used in many problems in DEA. The potentially of the proposed method is illustrated by some numerical examples, reported in the literature to compare the proposed method with the existing methods.
Keywords
Introduction
Data envelopment analysis is a non-parametric mathematical method to assess the efficiency of decision making units (DMUs) with multiple inputs and outputs. For more studies, see Refs.1–4 DEA models assign an efficiency score between 0 and 1 to each DMU. A DMU, which has the larger the efficiency measure, shows the better performance. If the efficiency score of a unit is equal to 1, then this unit is efficient, otherwise, it is inefficient. DEA models use some axioms of the production technology to build a set, namely the production possibility set (PPS) to estimate the production function. For more details, see Refs.5–13
One of the most important subset of the extreme efficient units in each PPS is the set of the anchor points. An anchor point is an extreme efficient unit which its inputs can be increased and its outputs can be decreased without entering the PPS. In the other word, an anchor point is an extreme efficient unit which is located on the intersection of the strong efficient frontier and the weak efficient frontier. In fact, for anchor points, there is at least one supporting hyperplane whose the gradient vector has some components equal to zero, and so some input\output factor does not play any role in the performance of the unit under evaluation. It should be noted that the anchor points play an essential role in DEA theory and its applications. For this reason, determining the anchor points in the PPS have attracted the attentions of many scholars in the DEA literature. For example, Jayekumar and Nagarajan 14 introduced the anchor points and applied them to define the unobserved units and to extend the efficiency frontier.
Bougnol and Dulá 15 proposed a method to find the anchor points based on the geometric properties of the anchor points. Their algorithm it is very expensive from the computational point of view. Regarding this drawback of their algorithm, Hosseinzadeh Lotfi et al. 16 proposed an algorithm which identifies a main part of anchor points without solving any model and the remaining anchor points can be determined only by solving one model. Hosseinzadeh Saljooghi and Elahi Moghaddam 17 proposed identifying algorithms for the anchor points and then by using their characteristics, they presented some methods to identify the anchor points.
Mostafaee and Soleimani-Damaneh 18 presented an approach to identify the anchor points by using the sensitivity analysis techniques. Soleimani-Damaneh and Mostafaee 19 introduced the extreme efficient units and the anchor points in a non-convex production technology and suggested an algorithm to find the anchor points in FDH model. Krivonozhko et al. 20 introduced the notion of terminal units. Moreover, some relationships were established between terminal units and other sets of units that were proposed for improving envelopment. They developed an algorithm for improving the frontier. The construction of algorithm has been based on the notion of terminal units. Jahanshahloo et al. 21 proposed an innovative distance and energy aware optimized routing (DEA-OR) algorithm for wireless sensor nodes. Considering distance as the base factor, DEA-OR algorithm gives solution for energy efficient transmission and route failure recovery. The process is of two stages: weight based neighbor selection for routing and cost-confined greedy method for route failure recovery.
Zemtsov and Kotsemir
22
applied DEA to assess the relationship between the results of patenting and resources of a regional innovation system (RIS). They used the DEA method over a long period, comparing regions to one another and over time. Mostafaee and Sohraiee
23
made use of the concept of supporting hyperplanes to provide a basic definition for exterior units and present a careful model for discovering exterior units. Also, based on the concept of supporting hyperplanes, they presented different definitions of anchor units. Also, they demonstrated the relationship between the sets of exterior, terminal, and anchor units. Koushki and Soleimani-Damaneh
24
introduced the concept of anchor points for the multi-objective optimization problems. They presented two approaches to recognize whether a given feasible point is an anchor point or not. Akbarian
25
used a variant of super-efficiency model to characterize all extreme efficient decision making units and anchor points of the PPS with the free disposability postulate. Shadab et al.
26
developed an algorithm to show the connection between the anchor points and the concept of congestion by using the S-shape form of the production function and the geometric features of the anchor points. Because of the set of anchor points is a subset of the set of extreme efficient DMUs, so finding the extreme efficient units is a useful method to find the anchor points. Hence, there are several algorithms to find the extreme efficient points in the literature of DEA. For more studies see Charnes et al.,
27
Dulá and López.
28
Bani et al.
29
presented a method to find anchor points of the
Also, in the recent years, one of the attractive problems in optimization theory is presenting the forecasting models which many scholars in the different areas of operation research (OR), such as DEA, have been attracted to them. For example, in the DEA literature, measuring forecasting performance is a crucial issue. Karasu et al. 30 proposed a model based on support vector regression SVR with a wrapper-based feature selection using multi-objective particle swarm optimization (MOPSO). Their proposed model can capture the nonlinear properties and they determined the effect of MOPSO on model by comparing it with PSO. Karasu and Altan 31 used a logistic chaotic map-based optimization algorithm to develop a method to predict the crude oil price with high accuracy. Their proposed model can capture the nonlinear dynamics in crude oil time series and the complexity of their model is less than the existing models such as PSO-LSTM model. Altan et al. 32 proposed a combined model which significantly improves the forecasting accuracy. They tested the effectiveness of their model on data from the wind farm in five regions. Their proposed model can capture non-linear features of the wind speed time series. For more studies about the forecasting models, see Lim, 33 Fontalvo et al., 34 An and Zhai, 35 and Kafi et al. 36
The concept of anchor point was used in DEA for the generation of unobserved DMUs in order to extend the DEA efficient frontier and so, this concept plays a critical role in the DEA theory and its applications. Hence, this study focuses on finding the anchor points in the different production possibility sets. For this purpose, we consider the production possibility set under the variable returns to scale (VRS) assumption and propose a new approach to identify the anchor points of this PPS. However, the proposed method can be easily developed to the different production possibility sets. The proposed method exactly uses the definition of the anchor points to provide the approach and so, it is based on finding the weak and strong defining supporting hyperplanes passing through the unit under evaluation. The use of the proposed approach is very simple and the anchor points can be easily identified by solving two simple models. In addition, the proposed approach is such that in addition to determining the anchor points, it also finds two important defining supporting hyperplanes on the PPS, which can be used in many problems in DEA, and this is the main contribution of the proposed method compared to the existing methods such as Bani et al. 29 Regarding the definition of the anchor points, if there are a weak and a strong defining supporting hyperplanes which the DMU under evaluation is located on them, then this DMU is an anchor point.
The rest of the paper is organized as follows: Section “Preliminaries and basic definitions” contains some preliminaries. Section “The proposed method for finding the anchor points” proposes an approach to determine the anchor points. A numerical example is provided in Section “Case study”. Section “Conclusion” concludes the paper.
Preliminaries and basic definitions
Consider a system of
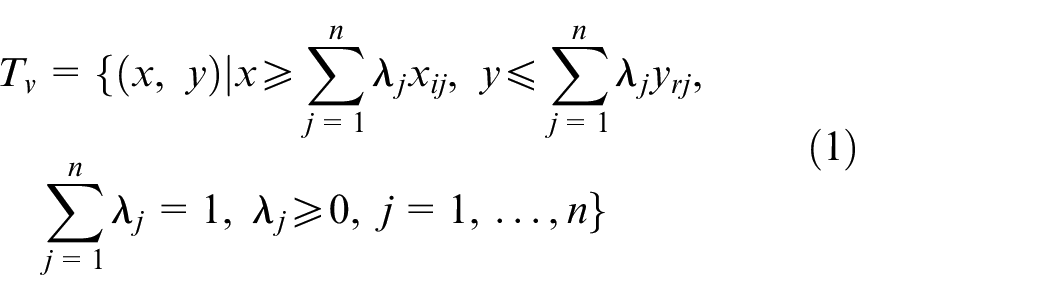
Banker et al. 2 introduced the following PPS under the variable returns to scale (VRS):
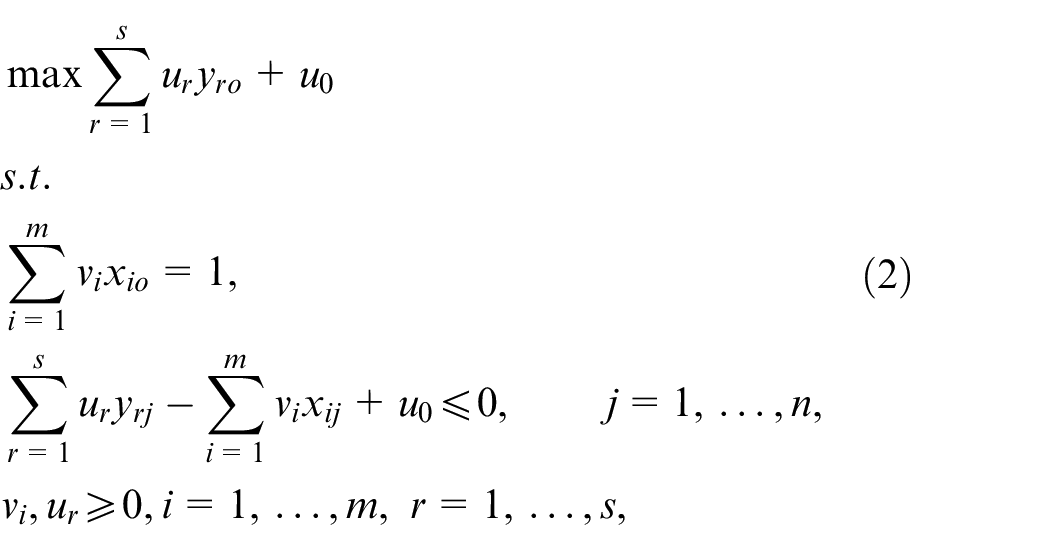
They formulated the multiplier form of BCC model to assess the efficiency score of DMUs as follows:
where,
(i) The optimal value of model (2) is equal to 1.
(ii) There is at least an optimal solution for model (2), for example,
In the following, we review some basic definitions about the hyperplanes in the DEA literature.

and

Also,
A hyperplane
Dulá and López
28
proved the following relation between the optimal solution of model (2) and the supporting hyperplanes of
Dulá and Bougnol
28
introduced the anchor points of
The set of anchor points is a subset of the extreme efficient units in
The next section proposes a new method to recognize the set of anchor points in
The proposed method for finding the anchor points
As we said in the previous section, the concept of anchor point was used in DEA for the generation of unobserved DMUs in order to extend the DEA efficient frontier and so, this concept plays a critical role in the DEA theory and its applications. Hence, this section focuses on proposing a new method for finding the anchor points of
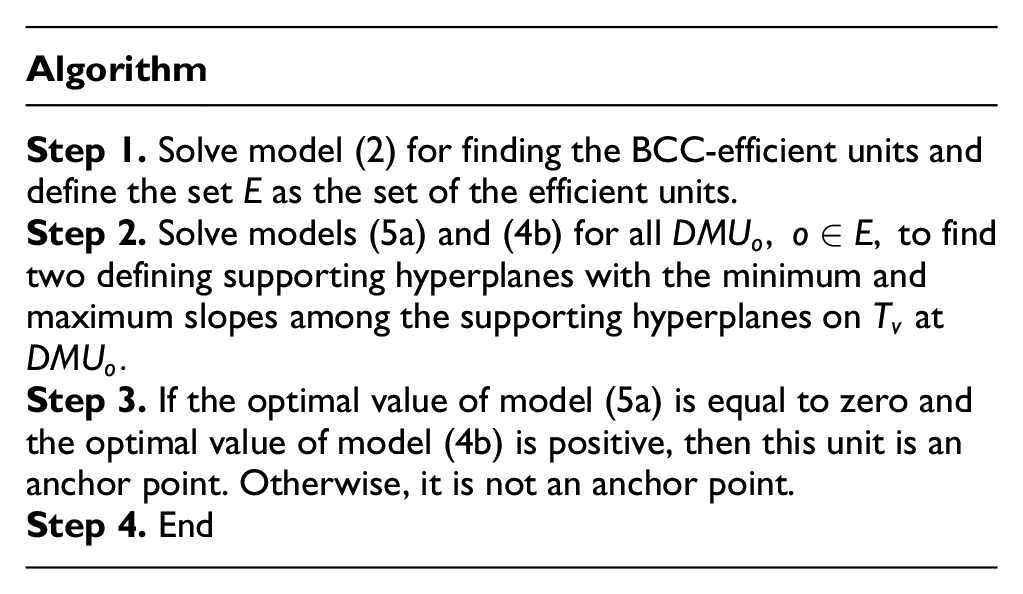
Given that, each anchor point is an extreme efficient unit, so, at the first step of the proposed method, we should determine the BCC-efficient DMUs. For this purpose, we solve model (2) and define the set
The weak and strong defining supporting hyperplanes.
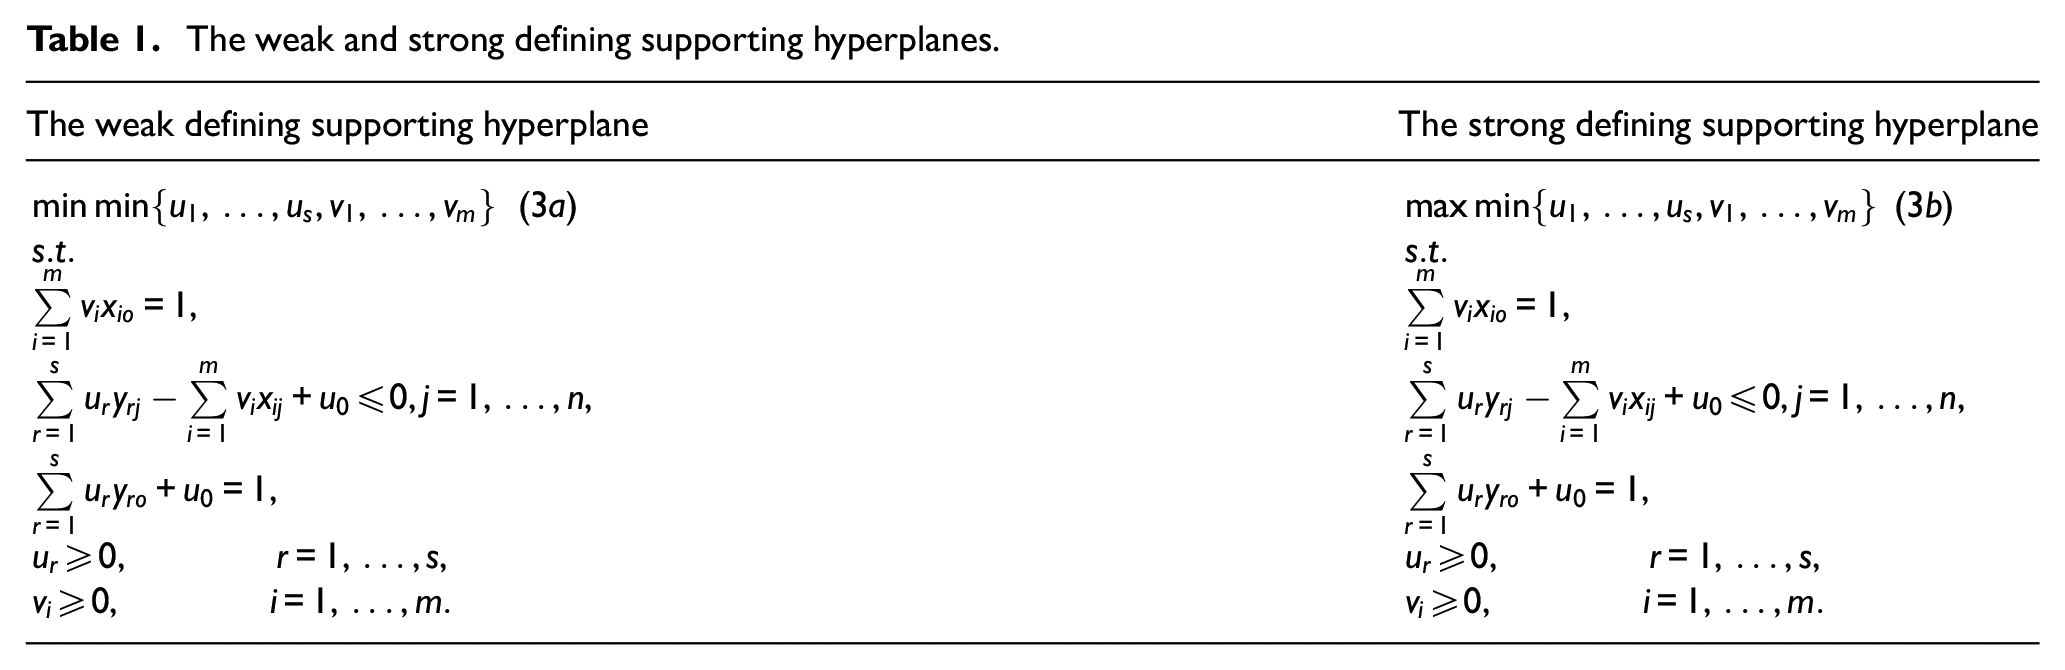
Given that, the weak defining supporting hyperplane has the minimum slope among all the weak supporting hyperplanes on
Similarly, regarding the strong defining supporting hyperplane has the maximum slope among all the strong supporting hyperplanes on
Models (3a) and (3b) are multi-objective programming problems. Given that, there is no optimal solution for multi-objective problems, hence, we try to convert these models into the single objective models. So, we define the non-negative variable
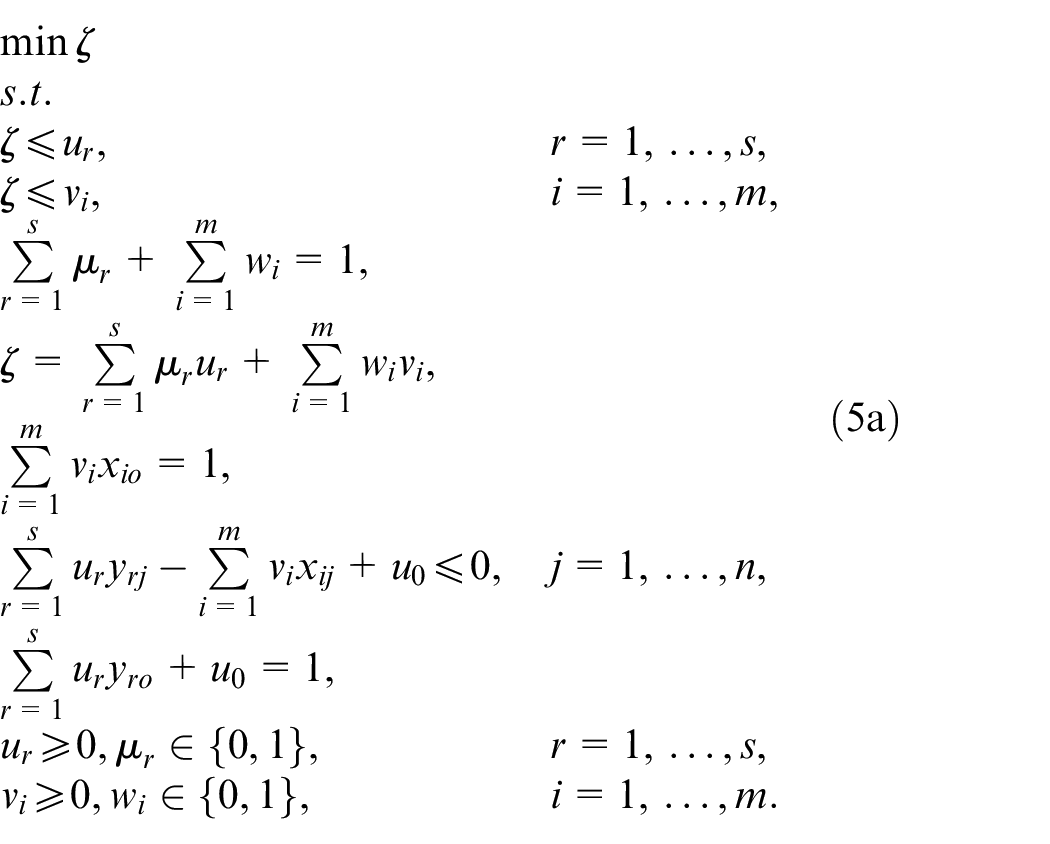
The single objective equivalent forms of models (3a) and (3b).
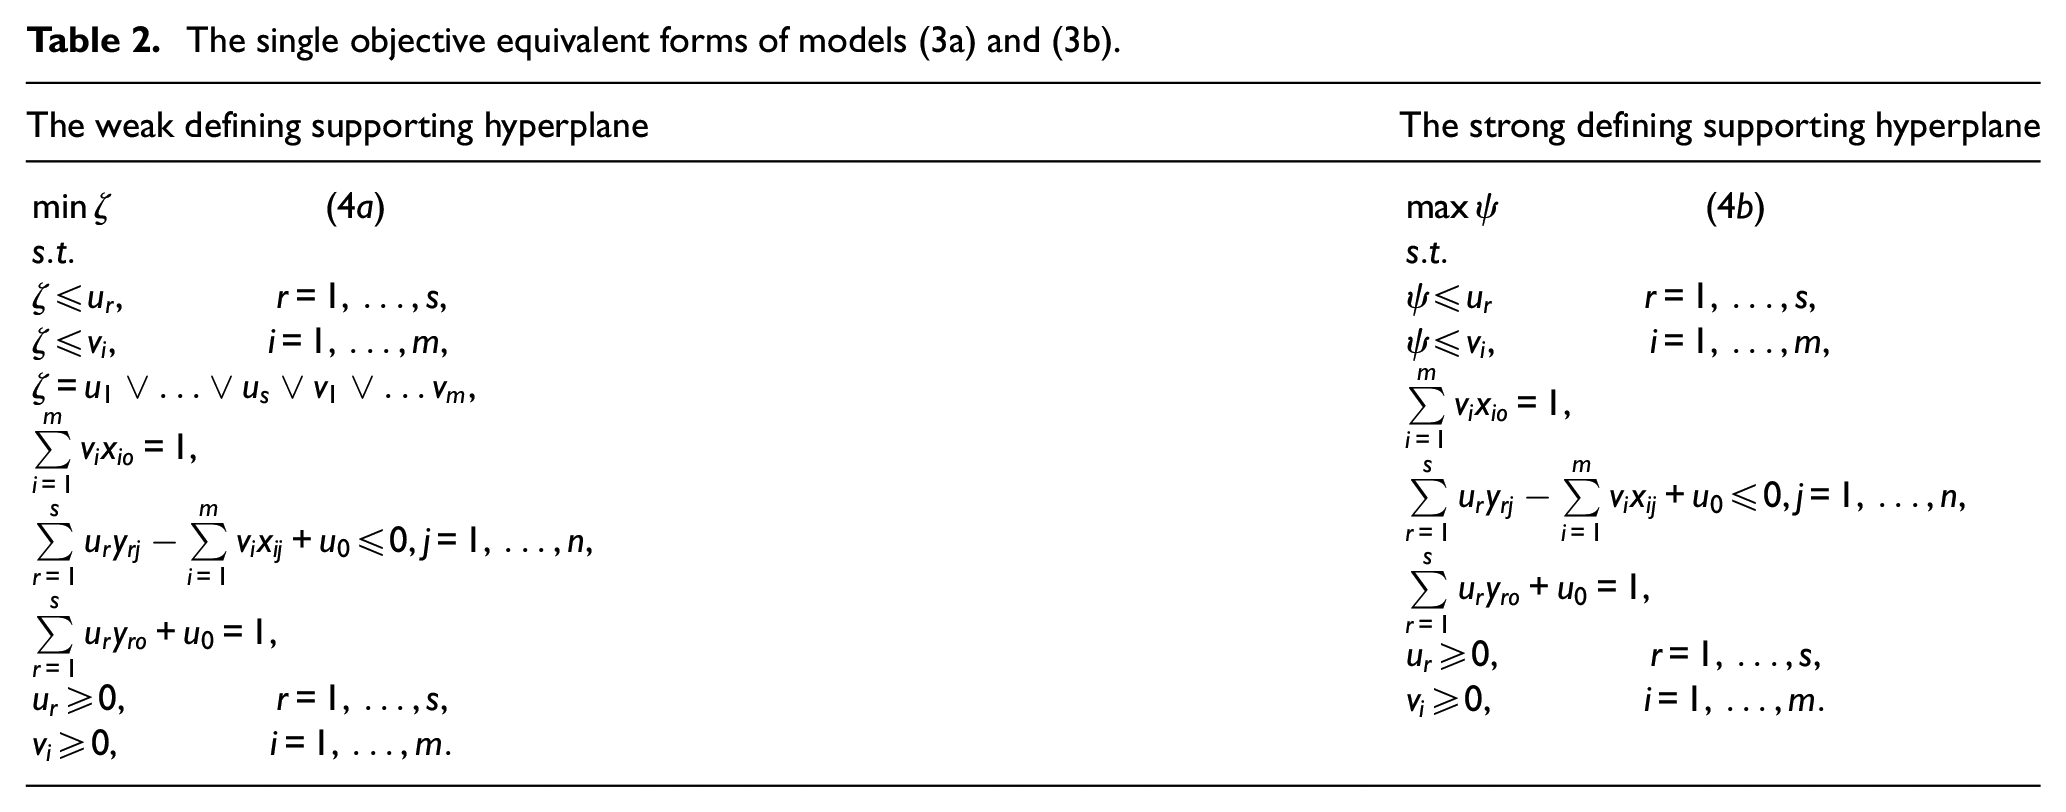
According to the above discussion, models (5a) and (4b) determine two defining supporting hyperplanes which
In summary, in this section, a new method for finding the anchor points of
In the following, we summarize the proposed method in an algorithm for more clarity.
The next section uses two case studies, reported in Soleimani-Damaneh and Mostafaee 19 and Bani et al. 29 to illustrate the proposed method and to compare it with the existing methods.
Case study
In this section, we apply our proposed method for two datasets, reported in Bani et al. 29 and Soleimani-Damaneh and Mostafaee, 19 to show the potentially of the proposed method and to compare the proposed method with the existing methods.
The data of Iranian banks.
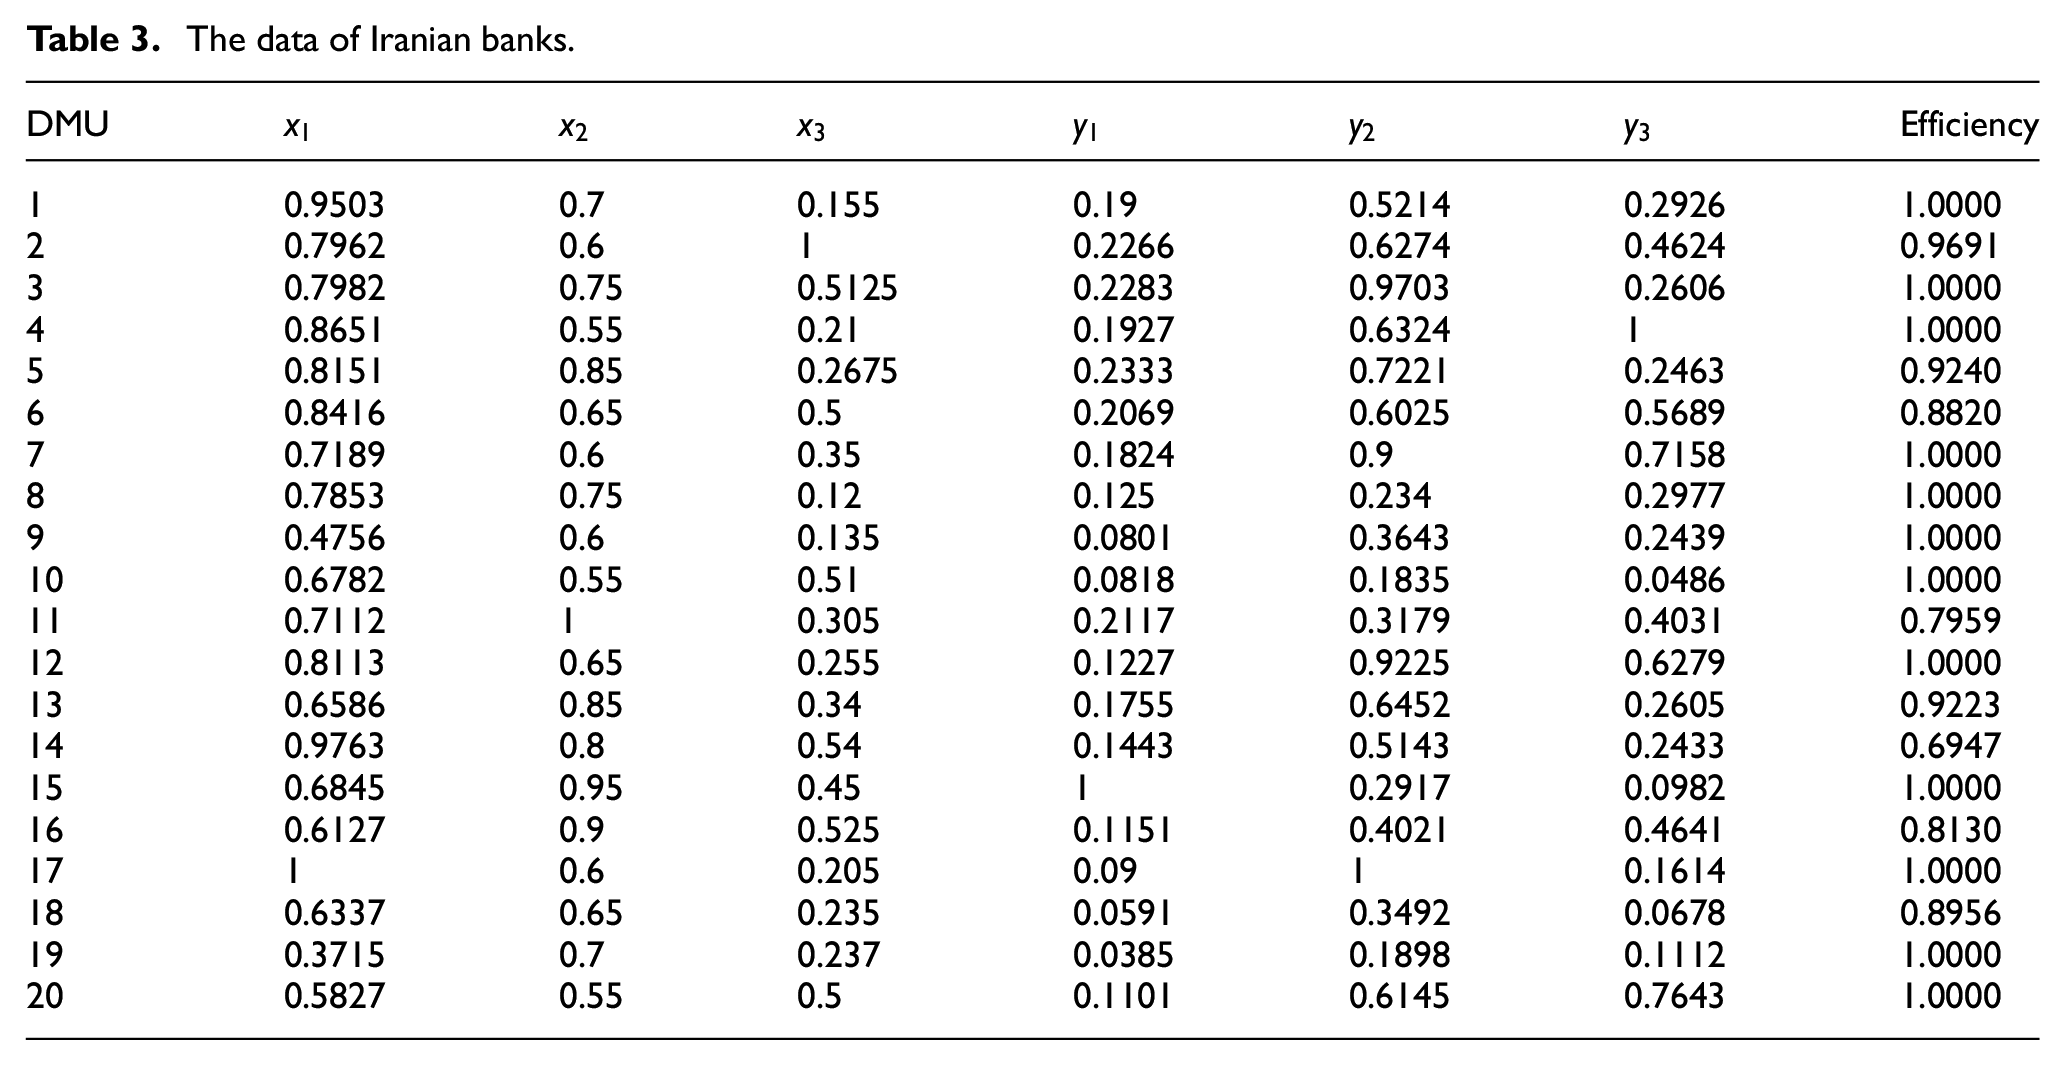
The first step of the proposed method determines the efficiency score of units by solving model (2). The results are reported in the last column of Table 3. As can be seen in Table 4, the set of efficient units is
The optimal value of models (5a) and (4b).
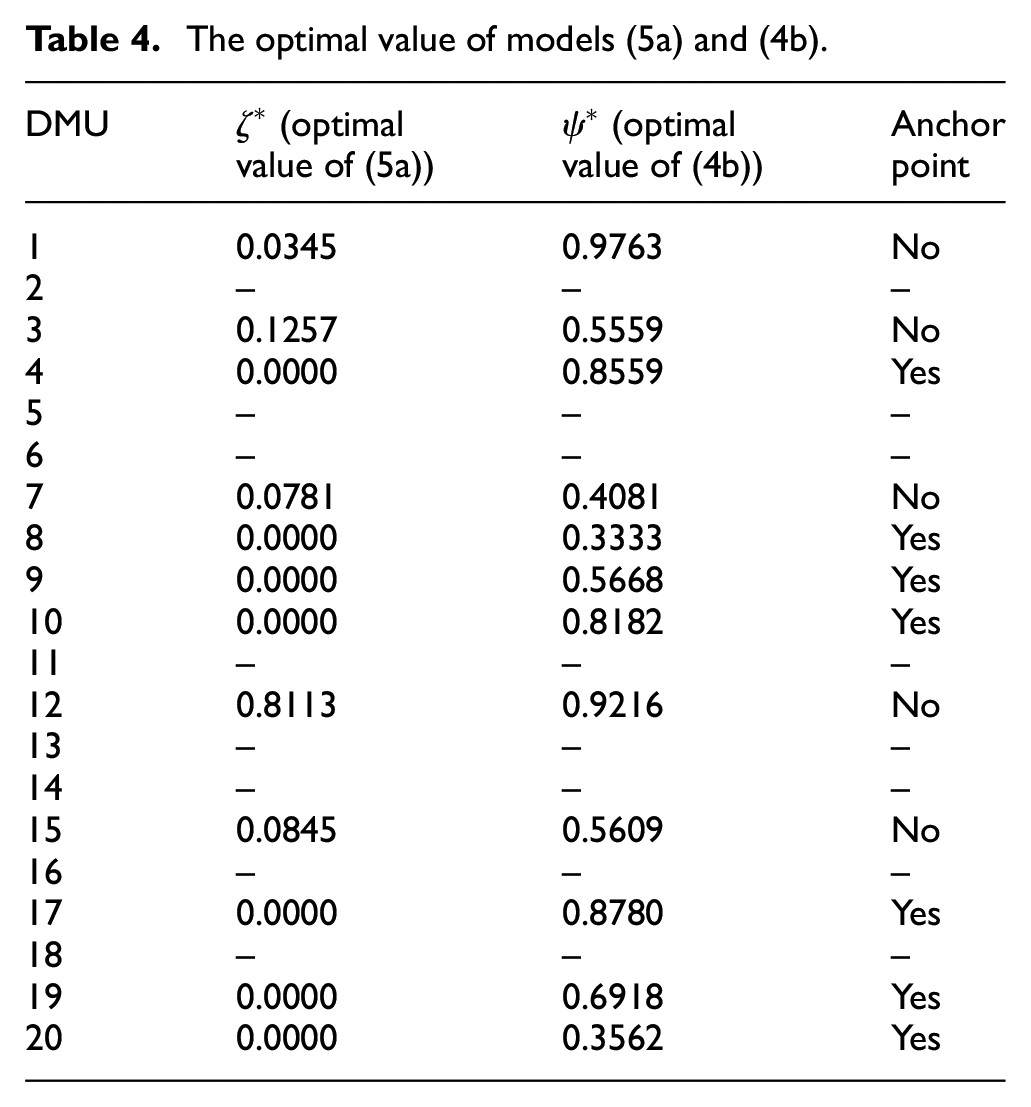
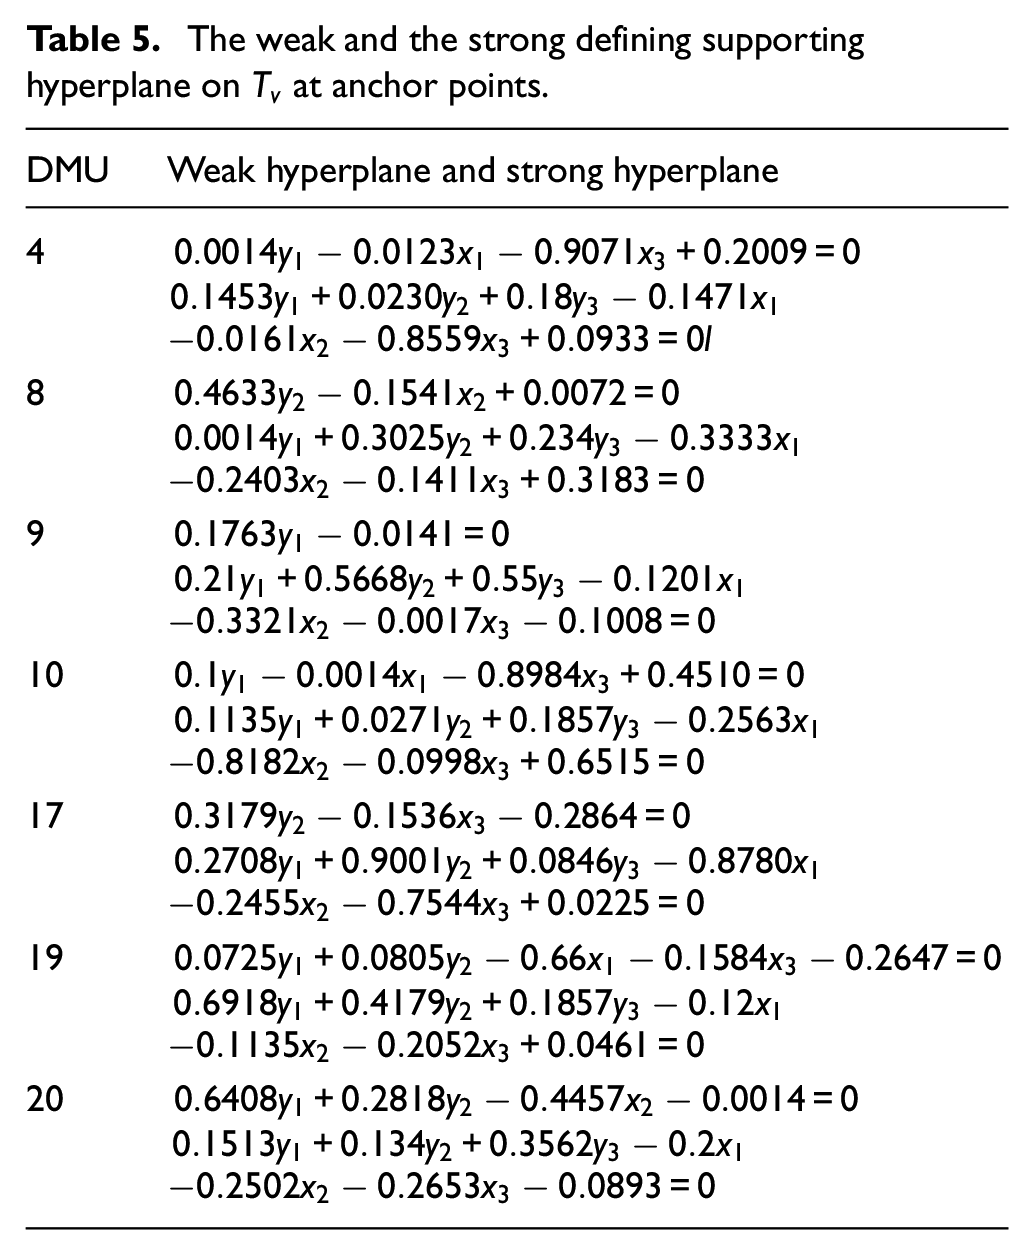
Therefore, the anchor points are the units 4, 8, 9, 10, 17, 19, and 20. Given that each anchor point is located on weak and strong defining supporting hyperplanes, hence, we can report the hyperplanes which at least one anchor point is located on them and this is one of the main advantages of the proposed method in this paper, compared to the existing methods in the DEA literature. Given that, we obtain the input and output weights by solving models (5a) and (4b), so, we can easily specify the corresponding hyperplanes. Therefore, the weak and strong defining hyperplanes, determined by models (5a) and (4b), are summarized in Table 5. In each row, the first hyperplane is the weak defining supporting hyperplane (some input or output weights are equal to zero) on
The weak and the strong defining supporting hyperplane on
The data of units in Example 2.
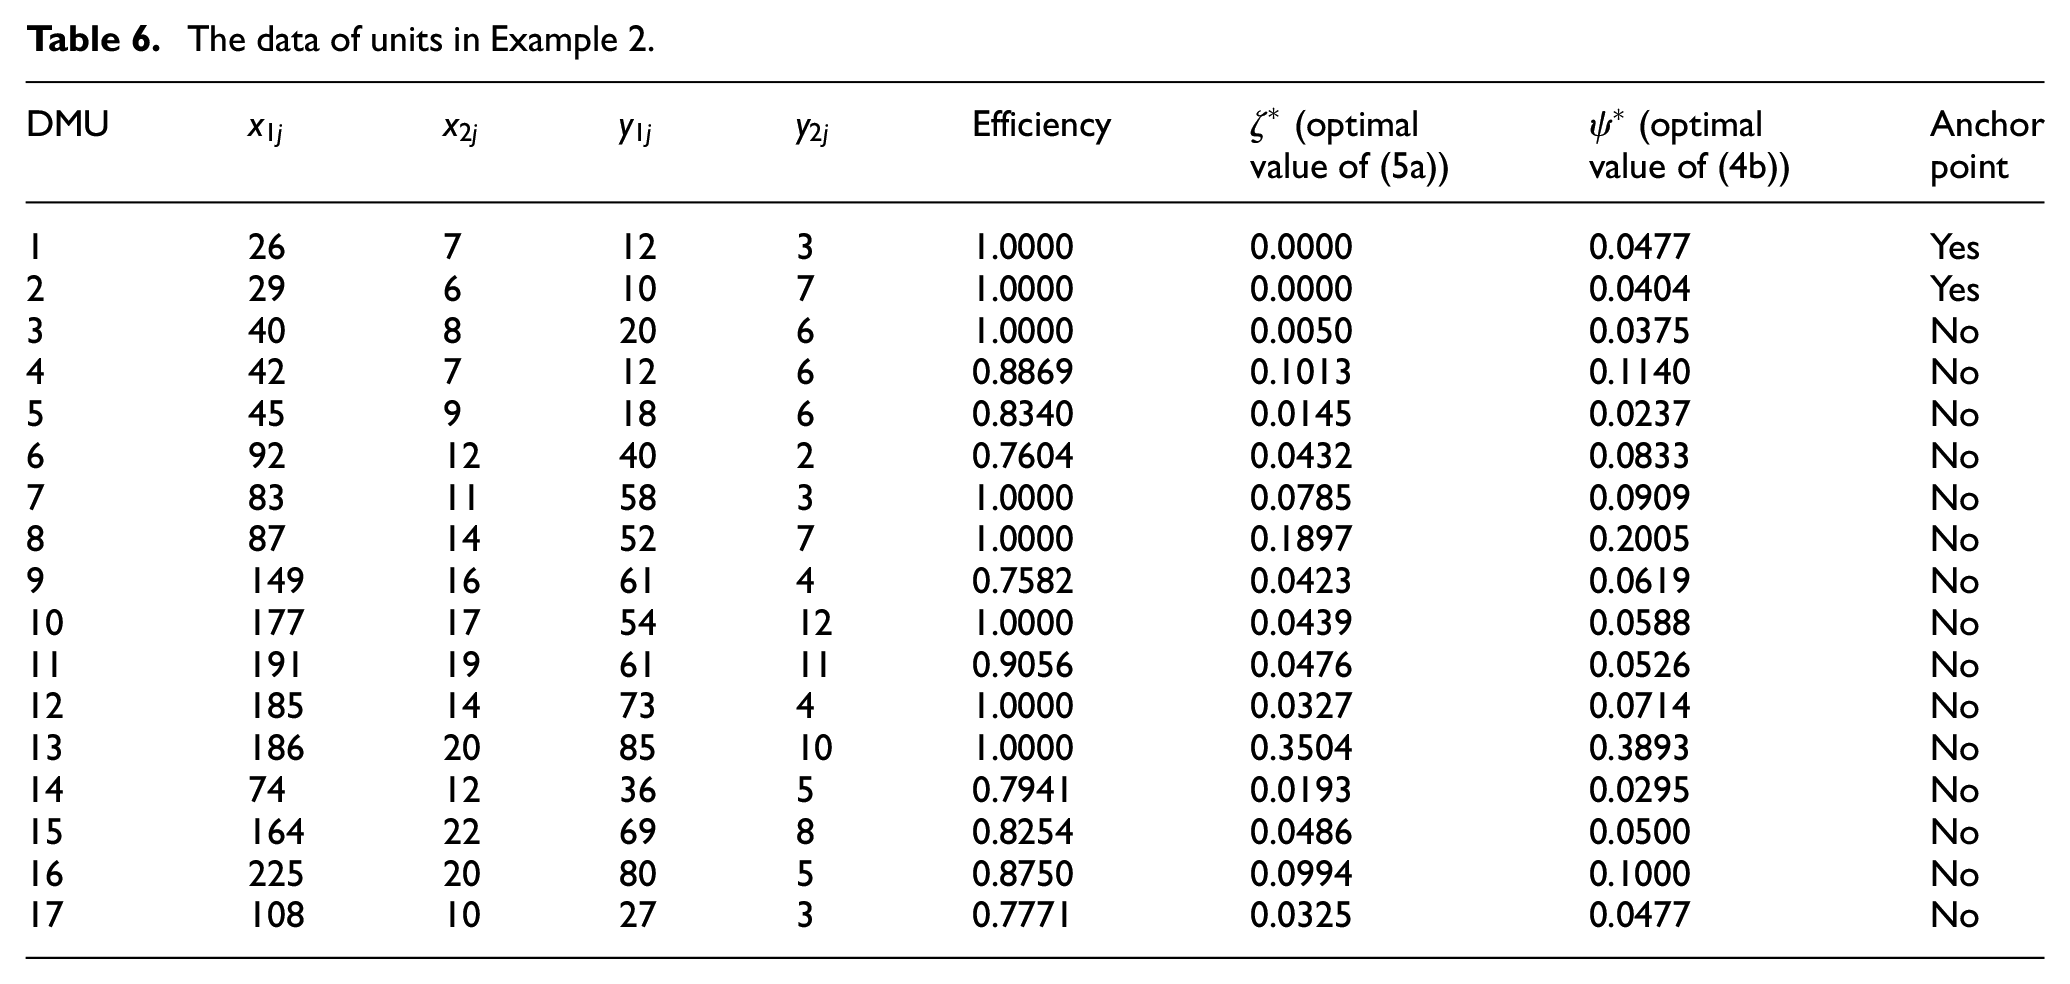
The first step of the proposed method determines the efficiency score of units by solving model (2). The results are reported in the last column of Table 6. As can be seen in Table 4, the set of efficient units is
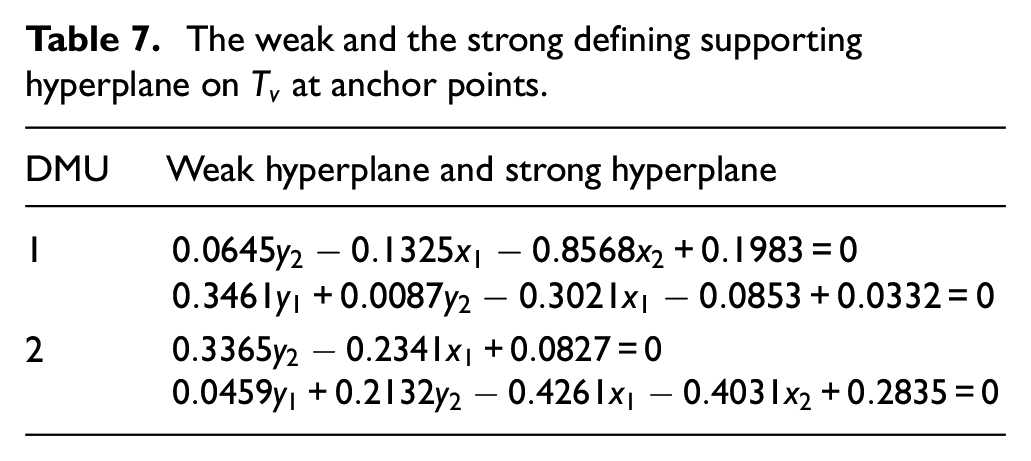
Therefore, the anchor points are the units 1 and 20. The weak and strong defining hyperplanes, determined by models (5a) and (4b), are summarized in Table 7. In each row, the first hyperplane is the weak defining supporting hyperplane on
The weak and the strong defining supporting hyperplane on
In summary, the proposed approach in this study finds the anchor points in the PPS by searching both weak and strong defining supporting hyperplanes on the PPS at the unit under evaluation. The idea of finding both weak and strong defining supporting hyperplanes on the PPS for determining the anchor points has been first introduced in this paper. As we saw in the examples, the proposed approach can easily find all anchor points by solving two models and also, it can determine two of the most important defining supporting hyperplanes which are very useful to extend the efficient frontier of the PPS.
Conclusion
The concept of anchor point was used in DEA for the generation of unobserved DMUs in order to extend the DEA efficient frontier and so they play an essential role in data envelopment analysis theory and its applications. This study focused on recognizing the anchor points in the PPS under the variable returns to scale assumption and presented a new method to find the anchor points which used the definition of the anchor points to ensure that it finds all that units. So, for the first time, we focused on finding the anchor points by searching both weak and strong defining supporting hyperplanes in the DEA literature. For this purpose, we proposed two models for determining the supporting hyperplanes with the minimum and maximum slopes among the supporting hyperplanes on the PPS at the unit under assessment. The main advantage of the proposed method is that it exactly uses the definition of the anchor points to provide the approach and it is very simple to use and the anchor points can be easily identified by solving two simple models. Also, the proposed approach is such that in addition to find the anchor points, two of the most important defining supporting hyperplanes can be found, which can be used in the different problems in the DEA literature. The potentially of the proposed method was illustrated by a numerical example, reported in the DEA literature to compare the proposed method with the existing methods.
Footnotes
Declaration of conflicting interests
The author(s) declared no potential conflicts of interest with respect to the research, authorship, and/or publication of this article.
Funding
The author(s) received no financial support for the research, authorship, and/or publication of this article.