
Abstract
The co-existence of bounded data and unbounded data gives a great challenge for the traditional single and inflexible data processing in smart cities. The wide promotion of the internet of things (IoT) makes the data amount rapidly increase. This leads to the further raise of the requirement for data processing in smart cities, especially the demand for low latency and abundant data in real-time video services. To solve this problem, a load balance oriented data processing mechanism for bounded and unbounded data in smart cities is proposed. A smart city framework is introduced to explicit the role of data processing in smart cities. A load-balanced data processing mechanism is proposed. Based on the mathematical model for data processing in smart cities, the load-balanced data processing is abstracted into an optimization problem. Aiming to obtain the minimum load balance ratio (LBR), an LBR algorithm is presented. Through simulation and experiment, the superiority and feasibility of our work are validated via numerical simulation and prototype implementation, respectively.
Introduction
Smart cities play a significant role in human’s modern life. 1 It has penetrated into all aspects of society, such as traffic, communications, city maintenance, and so on. With the development of technologies, especially information communications technology (ICT) and the internet of things (IoT), the city is becoming smarter. Smart devices like smart meters, smart vehicles, and other sensors, mostly replace their counterparts. Technologies greatly extended the management vision to cities’ every corner. 2
A smart city is an intelligent electrical complex that includes a variety of operations, energy, measures, etc. Smart cities are constructed on an integrated high-speed network, to ensure information transport efficiency. A smart city is economic, safe, and environment-friendly. The key issue in smart cities is the application of data processing and acceleration of information transport. 3
A smart city can be seen as an application of IoT in a modern city’s coverage. 4 In the past, the collection of traffic situations, city monitoring, power consumption, resident account balance, device log, etc., depends on workers’ manual operations. Via IoT, the interaction of humans is largely reduced, which makes smart cities work smoothly and effectively. As a result of this, IoT is enjoying high favor. In 2016, the value of the IoT market was 157 billion USD. It is expected to a market cap, 771 USD, by 2026. 5 With As the deployment of fourth generation communication technologies, the addition of smart sensors, smart meters, smart vehicles, and other devices greatly increases the complexity and uncertainty of smart cities. It can be foreseen that the data in smart cities would sharply increase with the full commercial application of the fifth-generation (5G) communications technologies for IoT sensors. According to the prediction report of Cisco, 500 billion objects like mobiles, sensor, etc., will access to the Internet. 6
Big data in smart cities is an attractive and meaningful topic. On one hand, high volume and velocity data from smart cities’ different components should be collected, cleaned, integrated, and analyzed. Through this, a view of the whole city can be grasped. Note that, the message queuing telemetry transport (MQTT) protocol, HyperText Transfer Protocol (HTTP), or javascript object notation (JSON) based wireless data transport between sensors and smart gateways gives an easy, ubiquitous, and continuous data collection. 7 On the other hand, the results of data analysis are the basis of smart city management strategy making. Therefore, data processing in smart cities is crucial.
Any kind of data is produced as a stream of events. In a smart city, the data can be classified into bounded data and unbounded data. Bounded data, also called batch data, has a defined start and end. Meanwhile, unbound data, also called stream data, has a start but no end. Usually, users’ account information, personal information, and other relatively stable information are bounded data. Users’ consumption information, sensor measurements, machine logs, and so on are unbounded data. Bounded data is infrequently changing and can be processed by ingesting all data before performing any computations. Ordered ingestion is not necessary for bounded data processing because a bounded data set can always be sorted. Unbounded data is dynamic, frequently changing, and scrappy. And must be continuously processed, that is, unbounded data must be promptly handled after it has been ingested. It is impossible to wait for all input data to arrive because the input has no end and will not be completed at any time. In unbounded data processing, the ingested data in a specific order is required, such as the order in which data generated, to be able to reason about result completeness.
As an important part of data science, several data processing frameworks are designed and applied for investigating the pattern of data. Apache Hadoop is only used for bounded data processing. Apache Storm and Samza are only used for unbounded data processing. Apache Spark and Flink are not only used for bounded data processing but also unbounded data processing. The core of Spark is using multiple micro-batches to simulate a stream. In spark, unbounded data or a stream is treated as special bounded data. Unbounded data is seen as the composition of a lot of bounded data. Unbounded data or a stream is split into an ordered series of micro-batches or bounded data. On the contrary, in Flink, bounded data is treated as a special situation of unbounded data. Bounded data is seen as a fixed-sized data stream. Via precise control of time, Flink can handle any data, no matter bounded data or unbounded data.
In smart Cities, any operation upon data or information would consume resources, including CPU, bandwidth, frequency, storage space, and so on. Considering the cost and the construction period, the resource in smart cities is limited and relative deficiency. In the running of a smart city, the realization of a specific service is step-wise. An operation upon data is normally executed after its previous one or more operations’ completion. Service systems are normally distributed and do not have a centralized controller. This means that there are multiple paths for the realization of a specific service, from this service’s source to sink. The data distribution upon these multiple paths is random, without any intervention. This leads to the situation that some paths hold more data than their capability, while other paths are idle. It is also called unbalanced load distribution. Because each operation upon data is accomplished by specific nodes and nodes have their limited computing resource like buffer, the nodes would discard exceeded data or require re-transmission. Both actions would make data transmission latency grow. Therefore, unbalanced load distribution will make an operation spend more time to waiting for all its previous operations’ completion, compared to balanced load distribution. And then the latency of the corresponding service increases. Besides, balanced load distribution will reduce the resource occupancy ratio of entire smart cities.
With intervention, the load among multiple paths can be evenly distributed. Load balance is a multi-commodity flow issue. Through distributing the load evenly upon multiple paths, one or some effects are achieved. These effects include high performance, high scalability, high stability, and low energy consumption. Depending on different situations, such as pursuing lowest latency, one or several indicators would be selected and composed as the objective function in multi-commodity flow issues.
Currently, the big data in smart cities has been used on the base of Hadoop and Spark. Hadoop is a framework that allows for the distributed processing of large data sets across clusters of computers using simple programing models. Sensors, like smart meters, report the user’s power data every 15 min. With the advance of technologies and the requirement of the city’s refined management, the interval between two reports may be decreased to second-level. Correspondingly, the data volume would explosive increase. For example, for 10,000 smart meters, the data volume will increase from 32.61 Gb to 114.6 TB. In a big city, there are millions of residents. Considering the co-existence, separated processing, and rapidly increased data amount, for bounded data, and unbounded data, this is a great challenge for load-balanced data processing in smart cities.
To cope with unbalanced load in big data with explosive volume, Flink is chosen to realize real-time data processing for smart grids, as a basic framework. The contribution of our work are listed as follows:
A smart city framework is introduced, to explicit the role of data processing in smart cities. The layers, data processing workflow, and data operation in a smart city are explained in detail. Especially, under a general workflow, unbounded data is treated as a data stream, and bounded is treated as a data set, to bridge the gap between the data processing for bounded data and that for unbounded data.
A load-balanced data processing mechanism is proposed. The basic concepts of load-balanced data processing are defined. Load-balanced data processing in smart cities is formulated into an optimization problem. The load balance ratio (LBR) is used to demonstrate the load distribution situation upon the entire data processing network. To obtain the minimum LBR, an LBR algorithm is presented. And the time complexity of the LBR algorithm is analyzed.
Via simulation and experiment, the superiority and feasibility of our work are validated respectively, in the aspect of average resource occupancy rate (ROR) for nodes, average ROR for edges, the number of accepted flow request, and the testbed system.
The rest of this paper is organized as follows: Section II reviews the related works. The smart cities framework is introduced in Section III. In Section IV, the load-balanced data processing mechanism is modeled. Numerical evaluations and experiments are given in Section V and Section VI, respectively. Section VII concludes this paper.
Relate work
Flink is an open-source framework that is supported by the Apache software foundation and designed as a distributed stream data processing engine. 8 Havers et al. built a Flink-based prototype to evaluate their proposed DRIVEN framework. The DRIVEN framework was used to cope with a common problem in vehicular networks’ application, that is, the conflict between the limited communication bandwidth and data transmission’s costs. 9 The engineering implementations of distributed stream processing frameworks for data processing in smart cities were examined and these frameworks’ adoption and maturity among IoT applications were analyzed by Nasiri et al. Apache Storm, Apache Flink, Apache Spark, Apache Heron, Samza, and Akka were selected as distributed stream processing frameworks. 10 An open-source benchmark for the emerging frameworks, structured streaming, Kafka streams, Spark streaming, Flink and its extensive analysis was proposed by van Dongen and Van den Poel. The relationships among between latency, throughput, and resource consumption were discussed. The performance impact of adding different common operations to the pipeline was also measured. 11 Antaris and Rafailidis proposed an approximate indexing mechanism to index and store massive image collections with varying incoming image rates. Flink was used to appraising the proposed mechanism, comparing it to a baseline with a disk-based processing strategy. 12 A stream processing was seen as a Directed Acyclic Graph (DAG), but a mathematical elaboration was missing. To improve computational ability, Chen et al. introduced a GFlink architecture, extending the original Flink from Central Processing Unit (CPU) clusters to heterogeneous CPU-Graphic Processing Unit (GPU) clusters. 13 They further raised a novel parallel hierarchical extreme learning machine (H-ELM) algorithm based on Flink and GPUs, to accelerate Flink for big data. CPUs and GPUs cooperated to fulfill the works assigned to them, thus achieving a better acceleration than previous work. 14 Espinosa et al. 15 suggested a property-based testing tool for Apache Flink. It used a bounded temporal logic to guide how random streams were generated and to define the properties. Xu et al. 16 established fault-tolerant mechanisms for graph and machine learning analytics that ran on a Flink based distributed dataflow system. Isah et al. 17 presented a comprehensive study of distributed data stream processing, and analytics frameworks, and gave a critical. Kaitoua et al. developed a GenoMetric Query Language (GMQL) to operate on heterogeneous genomic datasets. Flink was used for data computation and management in gene territory. 18 Katragadda et al. suggested a neighborhood-centric graph processing approach to handle graphs. This approach exploits the locality, parallelism, and incremental computation of existing distributed frameworks to calculate graph features with exact results. Graph stream processing in link prediction was executed on the base of Flink. 19 Zacheilas et al. provided a novel approach that enables the execution of top-k join queries over sliding windows. They reduced the amount of data that need to be analyzed by the stream processing operators. Flink combined with Kafka was applied in experiment evaluation to prove the proposed approach’s superiority. 20 Li et al. put forward a Flow-network based auto rescale strategy for Flink in, 21 to solve the problem that a load of big data stream computing platform was increasing with fluctuation while the cluster was not able to rescale efficiently. However, the change of data transfer rate brought by Flink’s operators was ignored.
Smart cities framework
Architecture
As a complex system, smart cities are hierarchical. From bottom to top, as shown in Figure 1, there are infrastructure layer, control layer, and application layer.
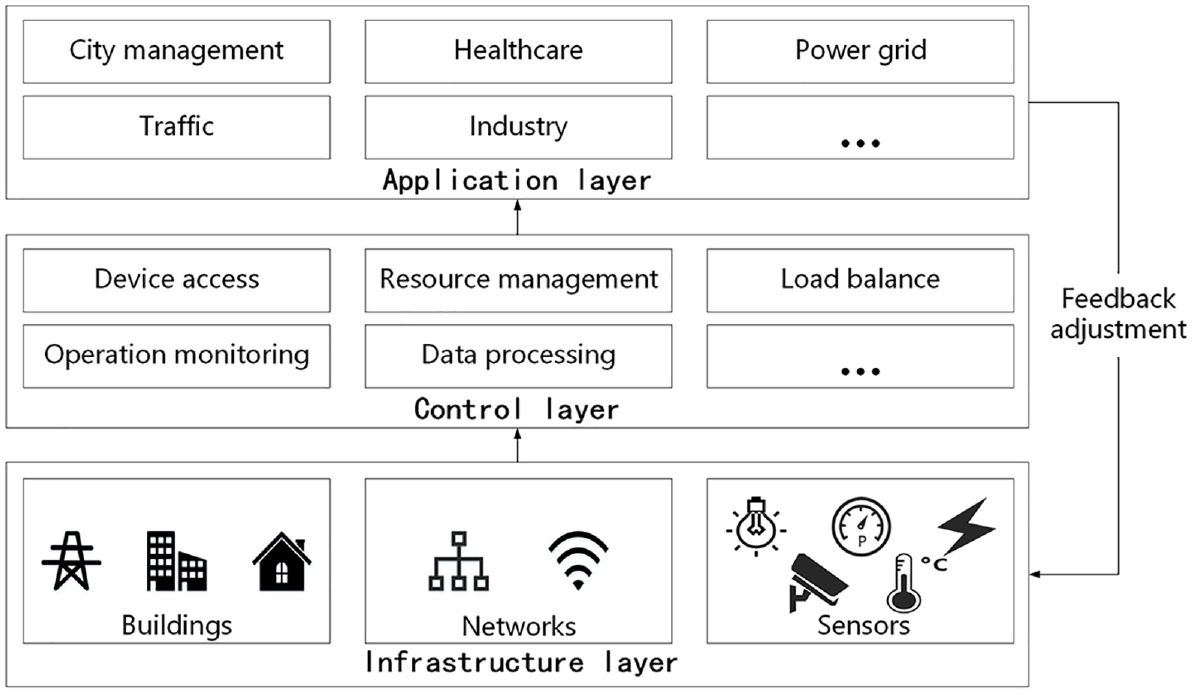
Smart cities architecture.
In smart cities, each component is relatively independent and pervasively connected with other components. As the middle layer, the control layer is a bridge between the infrastructure and the application layer. On one hand, the control layer gives an operation-based infrastructure layer’s devices, information, and data. On the other hand, the output of the control layer provides the basis of different areas in the application layer. Besides, the effect of multiple components in application layers conversely is the base of feedback adjustment upon the infrastructure layer.
Workflow
With the help of other components, data processing deals with a large amount of collected data from the infrastructure layer and outcomes processed results for different kinds of smart city applications. The workflow of data processing is shown in Figure 2.
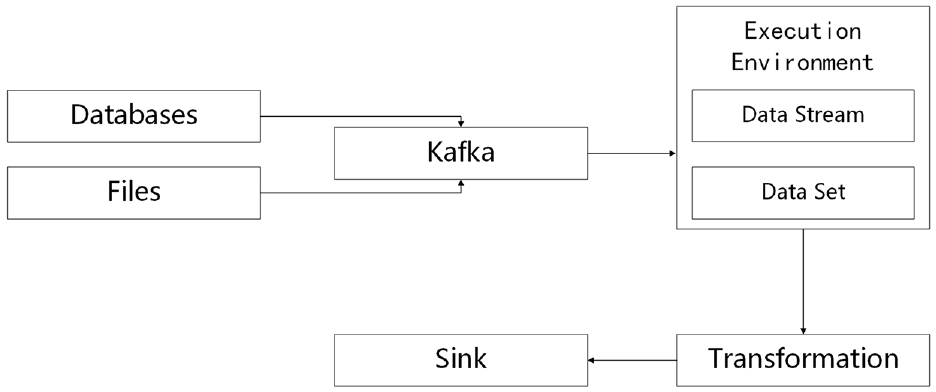
The workflow of data processing.
In data processing, the data in databases or files are first entered into Kafka. For databases, the data can be ingested into Kafka in a real-time way, by the monitor of databases’ log. For files, the data is ingested into Kafka at one time, by file read. Kafka is a distributed event streaming component for high-performance data pipelines and data integration. Through Kafka, data automatically gets into the execution environment. For bounded data, such as the data from files, it is treated as a data set. And for unbounded data, such as the data from databases, it is treated as a data stream. In the transformation module, several operations are carried out on the combination of different operators like Map, FlatMap, Filter, KeyBy, Reduce, and so on, to obtain the pattern hidden in a large amount of data. At last, the calculated results are restored in the sink module, as the basis of the UI dashboard.
The data from databases or files to sink is the process of separating the wheat from the chaff, according to a service’s specific requirement. For example, in a company, a manager would like to check employees’ work efficiency, to decide the department adjustment program. The data in internal office system logs can be ingested into this workflow. Via search, splitting, filtering, and statistics, the manager can see each employee’s volume of work, work efficiency, and the statistical data by department. According to these results of the workflow, the manager can make his mind to promote an employee or not, to expand a department or not. Note that, the data set realizes the processing of inventory data, meanwhile, the data stream realizes the processing of incremental data. Essentially, the workflow of the data process is implemented by Java. The data stream is the inheritance and extension of the stream in Java, without an end. The data set is the inheritance and extension of the stream in Java, with an end.
Data operation
In data processing, the operation of data is mostly completed in the transformation module, in the form of transformation operators in the data processing script program. Common transformation operators are Map, FlatMap, Filter, KeyBy, Reduce, etc. Note that for a transformation node, the data transfer rate for input flow and that for output flow are different, as shown in Figure 3. In Figure 3, N is the ratio of data transfer rate for output flow to that for input flow.
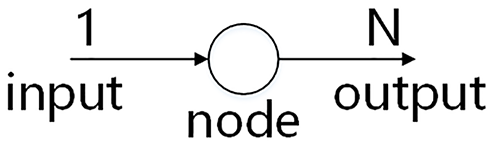
The input and output of a node.
From Flink’s official website, we can see that operator Map takes one element and produces one element. This means that for operator Map, N is equal to 1. Operator FlatMap takes one element and produces zero, one, or more elements. For operator FlatMap, N is greater than 1. Operator Reduce takes a “rolling” reduce on a keyed data flow. For operator Reduce, N is smaller than 1.
Load balanced data processing mechanism
Basic concepts
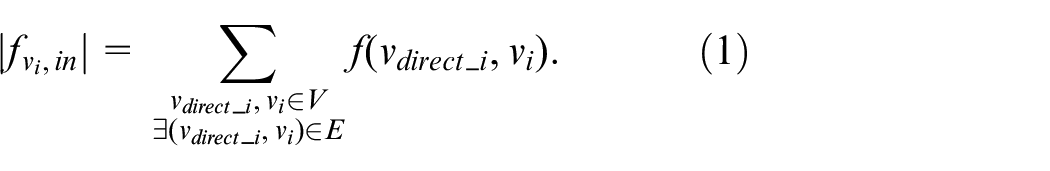
The sum of vi’s input data transfer rate from its directed connected nodes to vi is called vi’s input flow and is denoted as
The sum of vi’s output data transfer rate from vi to its directed connected nodes is called vi’s output flow and is denoted as
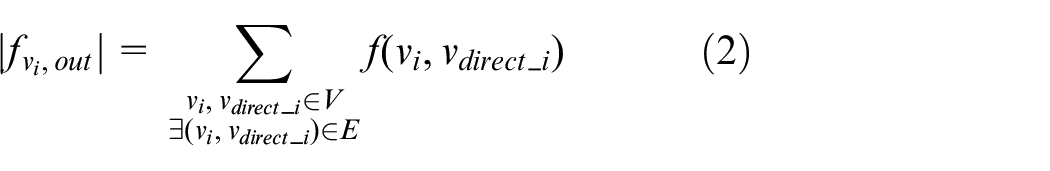
where the node that directly connected to vi is denoted as vdirect_i, vdirect_i∈V. In G, the unit of capacity and flow are both tuple/s and 0≤f(vi, vj) ≤c(vi, vj). G is denoted as a non-symmetric matrix.
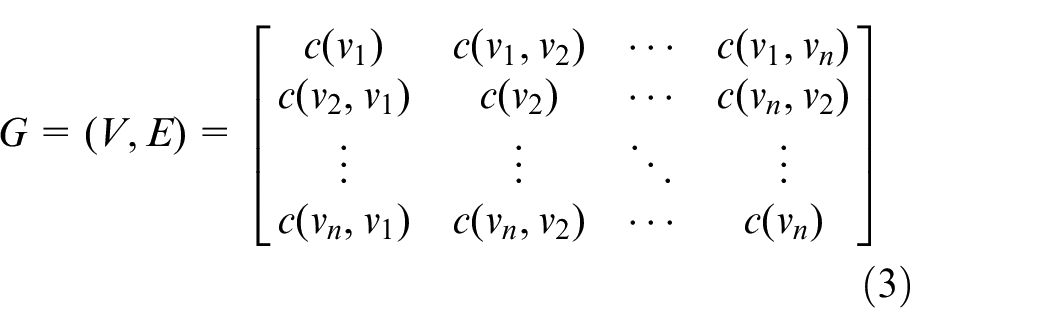
In Equation (3), because that G is a DAG, there is one non-zero value between c(vi, vj) and c(vj, vi), and the other one is zero. When i = j, the corresponding value in the matrix is c(vi).
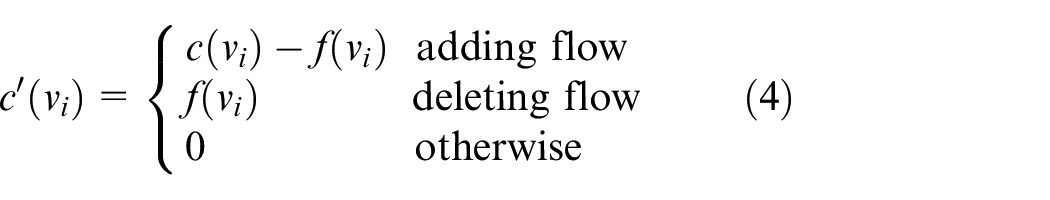
where c(vi) is the capacity of node vi in G, f(vi) is the occupied resource by existing flow f in node vi. ∀
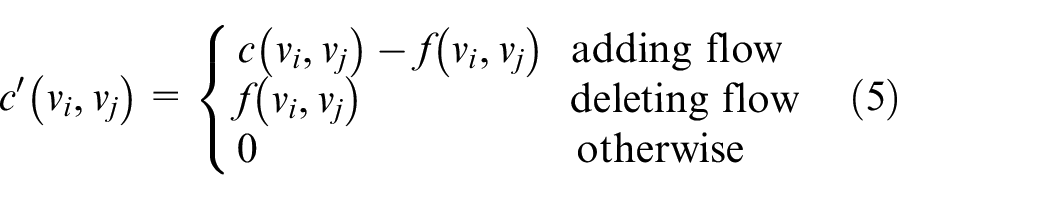
where c(vi, vj) is the capacity of edge (vi, vj) in G, f(vi, vj) is the occupied resource by existing flow f in edge (vi, vj).
The augment network G’ is the variable space of G at the current juncture. Therefore, in
In a path, there are edges and nodes.
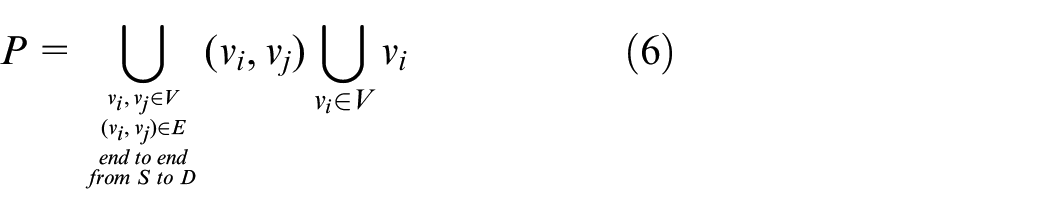
The data transfer rate of path P is
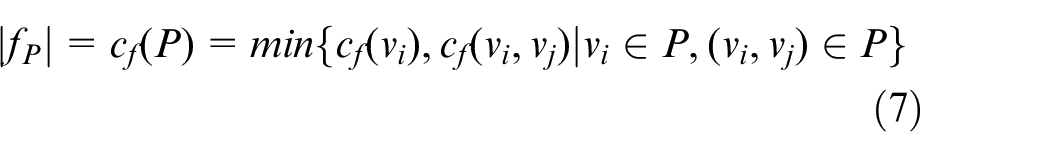
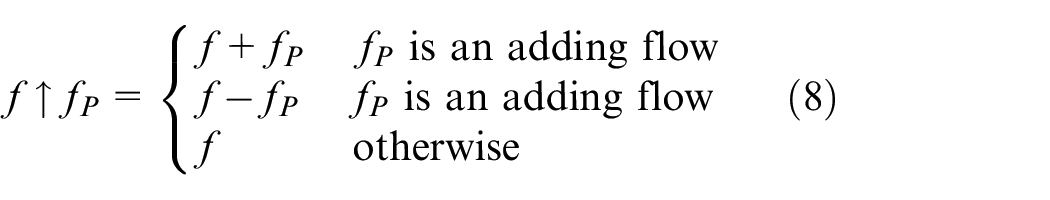
fP is an augment flow of the existing flow f. After the appearance of fP, flow f will change and is denoted as f ↑ fP.
Model formulation
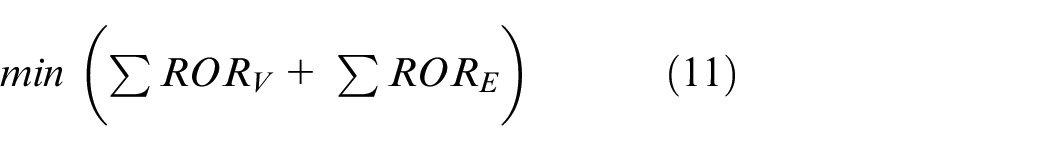
The goal of our model is to obtain the minimum LBR in the entire network. The goal is

Where
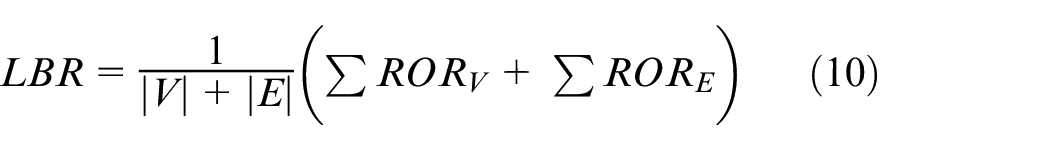
In equation (10), RORV is the resource occupancy rate of a node in G and RORE is the resource occupancy rate of an edge in G. ROR is the ratio of occupied resource and capacity, no matter nodes or edges. Because that G is fixed, V and E are both constant values. Equation (9) becomes
The constraint conditions are

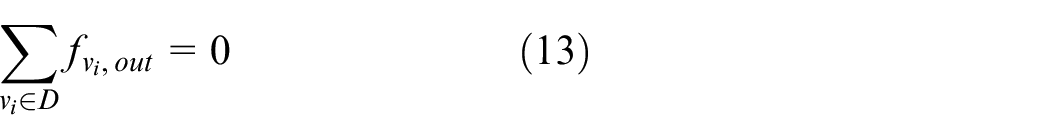


where equation (12) means that for each node in S there is no input data flow. Equation (13) means that for each node in D there is no output data flow. Equation (14) means that for each node in G the data transfer rate must be smaller than or equal to this node’s capacity. Equation (15) means that for each edge in G the data transfer rate must be smaller than or equal to this edge’s capacity. Equation (16) means that for each node in G, its data transfer rate for output flow is N times of that for input flow.
LBR algorithm
In the running of smart cities, services’ flow loads are evenly distributed upon the entire G, via
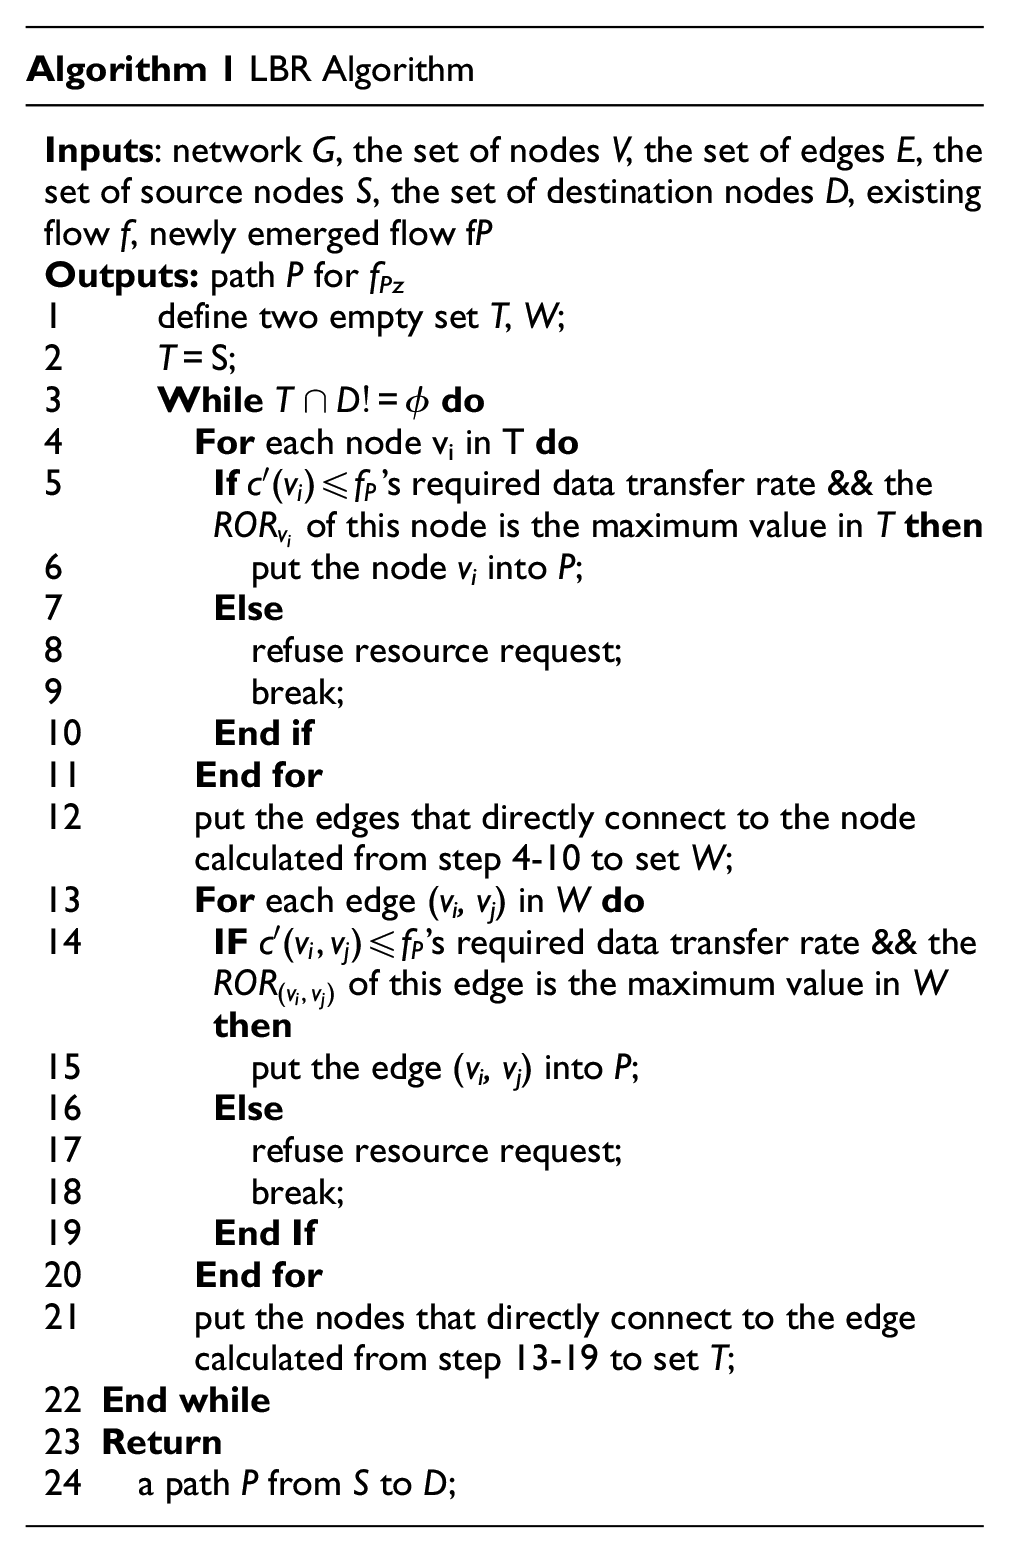
Algorithm analysis
Before the analysis of Algorithm 1, the concept of the hop is necessary. The hop for path P in this paper is the number of passing nodes from S to D. From the definition, we can know that the source node and the destination node are not included in the hop. For Algorithm 1, the maximum loop number is the product of G’s maximum hop and the sum of |V| and |E|. The time complexity of Algorithm 1, T(n) is

Algorithm 1 is a kind of distributed parallel algorithms. Its procedures are executed on different nodes. The communications between these nodes are coordinated by Zookeeper. The computing is normally simple and depends on the amount of input data and the construction of G.
Simulation
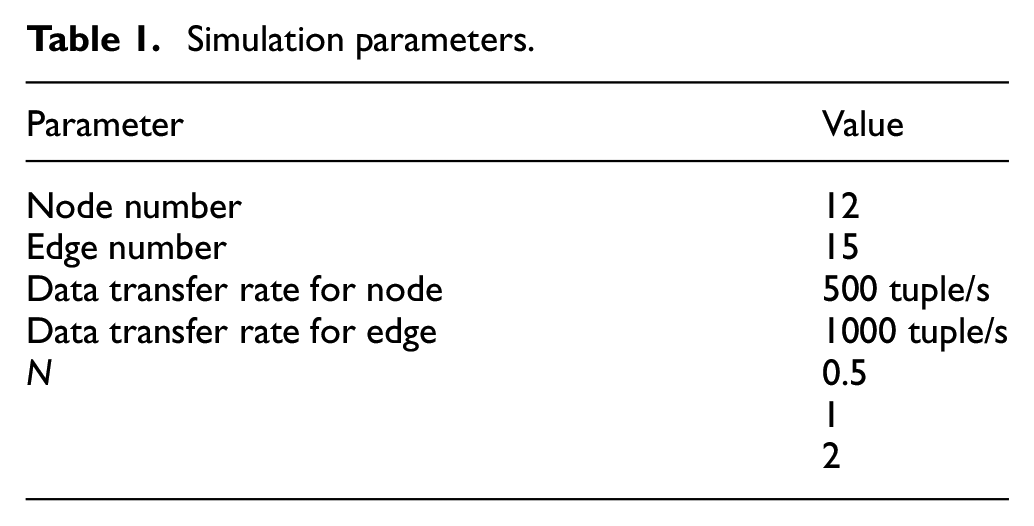
In this section, numerical results are achieved to analyze the performance of the proposed model, through the simulation using MATLAB. Unless explicitly stated otherwise, the simulation parameters shown in Table 1 are used. In our simulation, there are three values for N. The work of Li et al. in 21 is selected as a comparison group which is the situation of N = 1.
Simulation parameters.
The simulated data processing network is shown in Figure 4 and generated randomly. We can see that S = {v1, v2, v3, v4, v5}, D = {v24,v25}. For each flow, a path from S to D should be selected. If an appropriate path cannot be got, the flow transport request would be declined. To have an insight into the entire G, average ROR for nodes and edges, the number of accepted flow requests are selected as evaluation indicators.
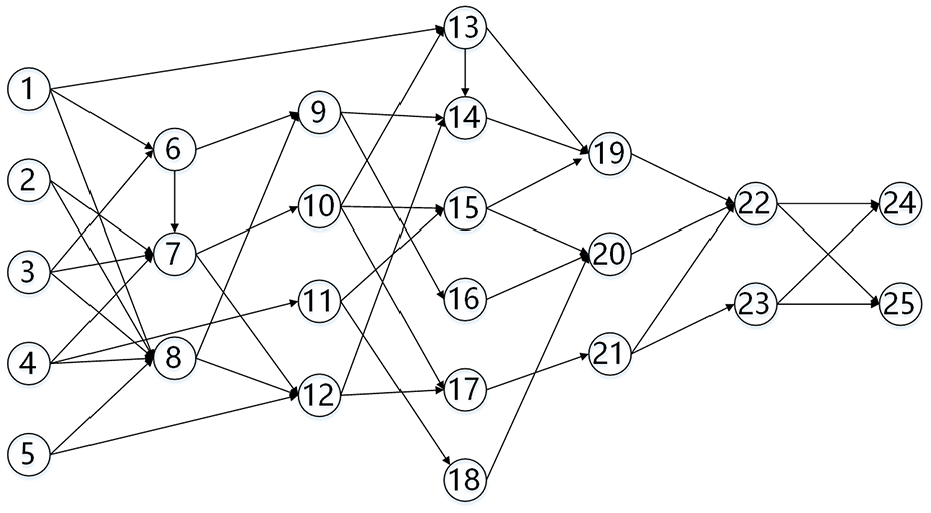
Simulated data flow processing network.
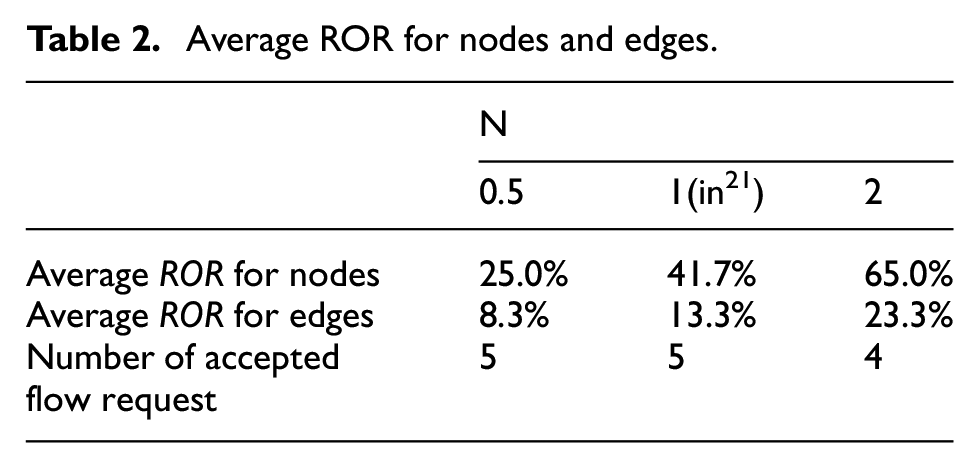
The results are shown in Table 2. With the increase of N, the average ROR for nodes and edges both increase. No matter nodes or edges, the increase of average ROR is not in proportion to the increase of N. The reason for this phenomenon is that nodes and edges are both involved in the path calculation. Once the available resource is not enough for supporting a flow path, flow requests would be declined. When N = 2, the number of accepted flow requests is 4, not like that of N = 0.5 and N = 1. Because the data transfer rate in node v12 exceeds its capacity.
Average ROR for nodes and edges.
Experiment
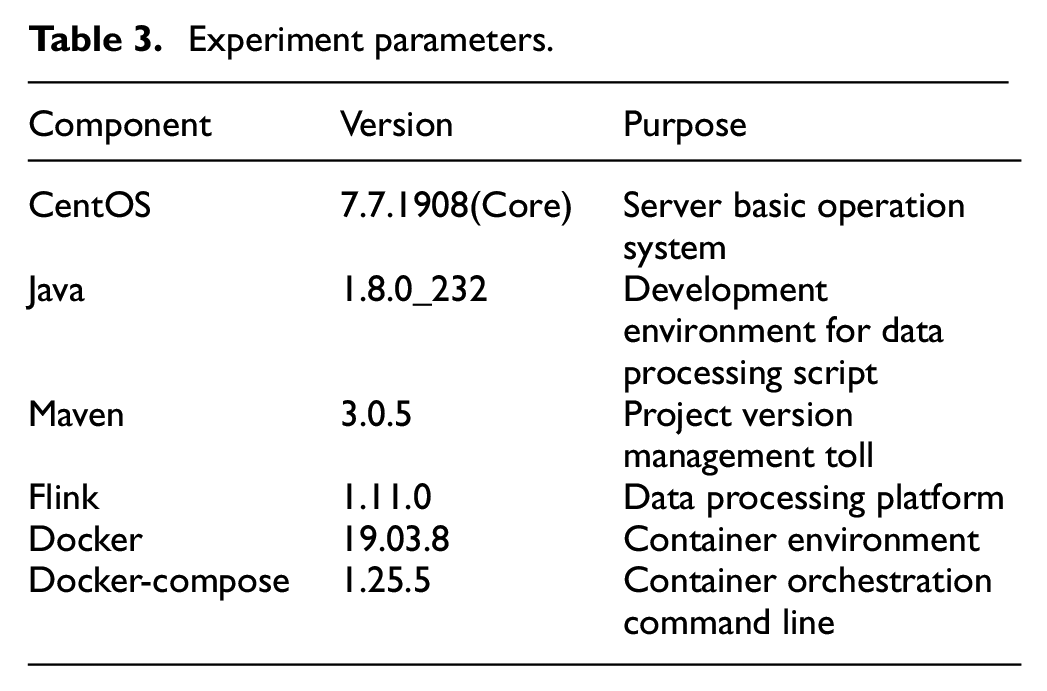
To verify the feasibility of our model, we experimented in the real world. The experiment corresponding components’ purposes are listed in Table 3. Note that this experiment was executed on a server with 2.60 GHz CPU, 16 G memory, and 1 TB hard disk.
Experiment parameters.
In Figure 5, a Flink cluster was started up in the form of multiple containers. Each container completes a task in data processing, on its own. At the same time, the status of multiple containers is also shown in Figure 5, with the information of communication ports.
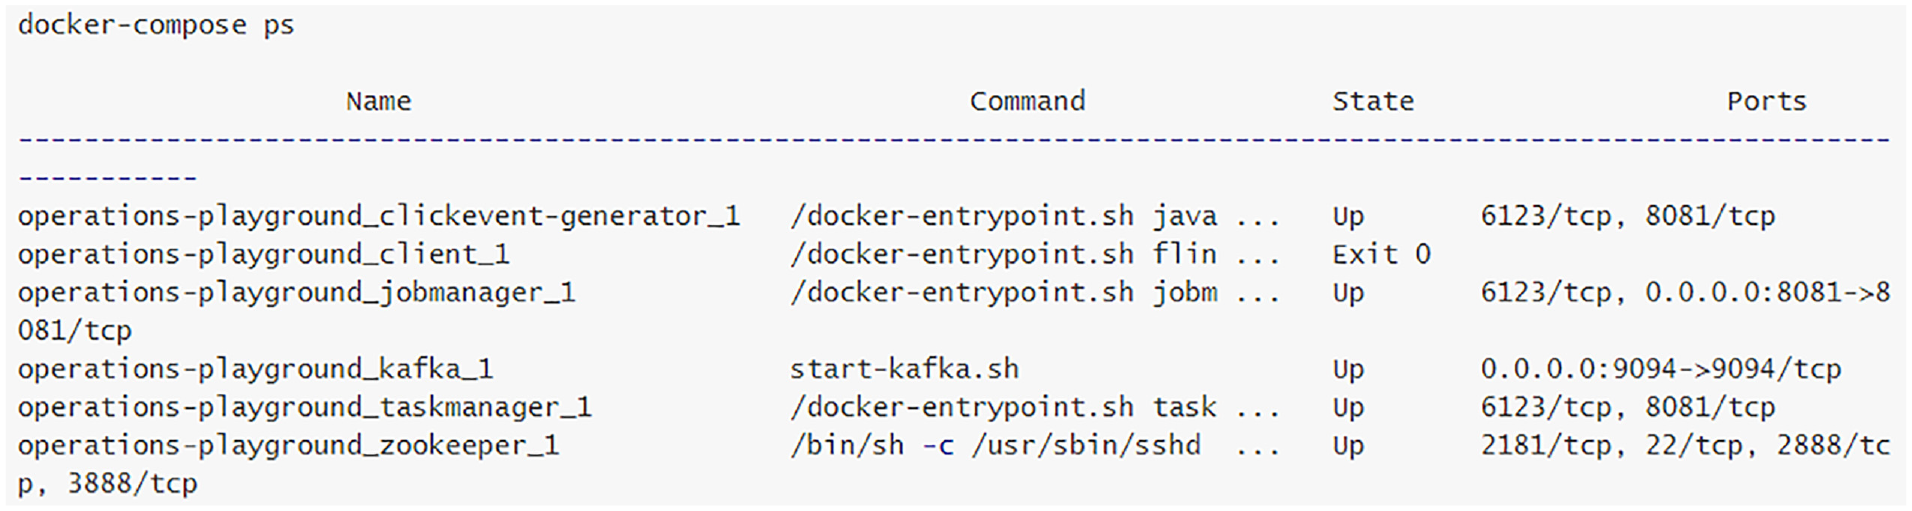
Successful startup of multiple containers.
In Figure 6, the workflow of a data processing task is displayed. A window word count task was executed on the base of the Flink platform. The specific task ID, start time, duration, status, received, and sent Bytes can also be seen.
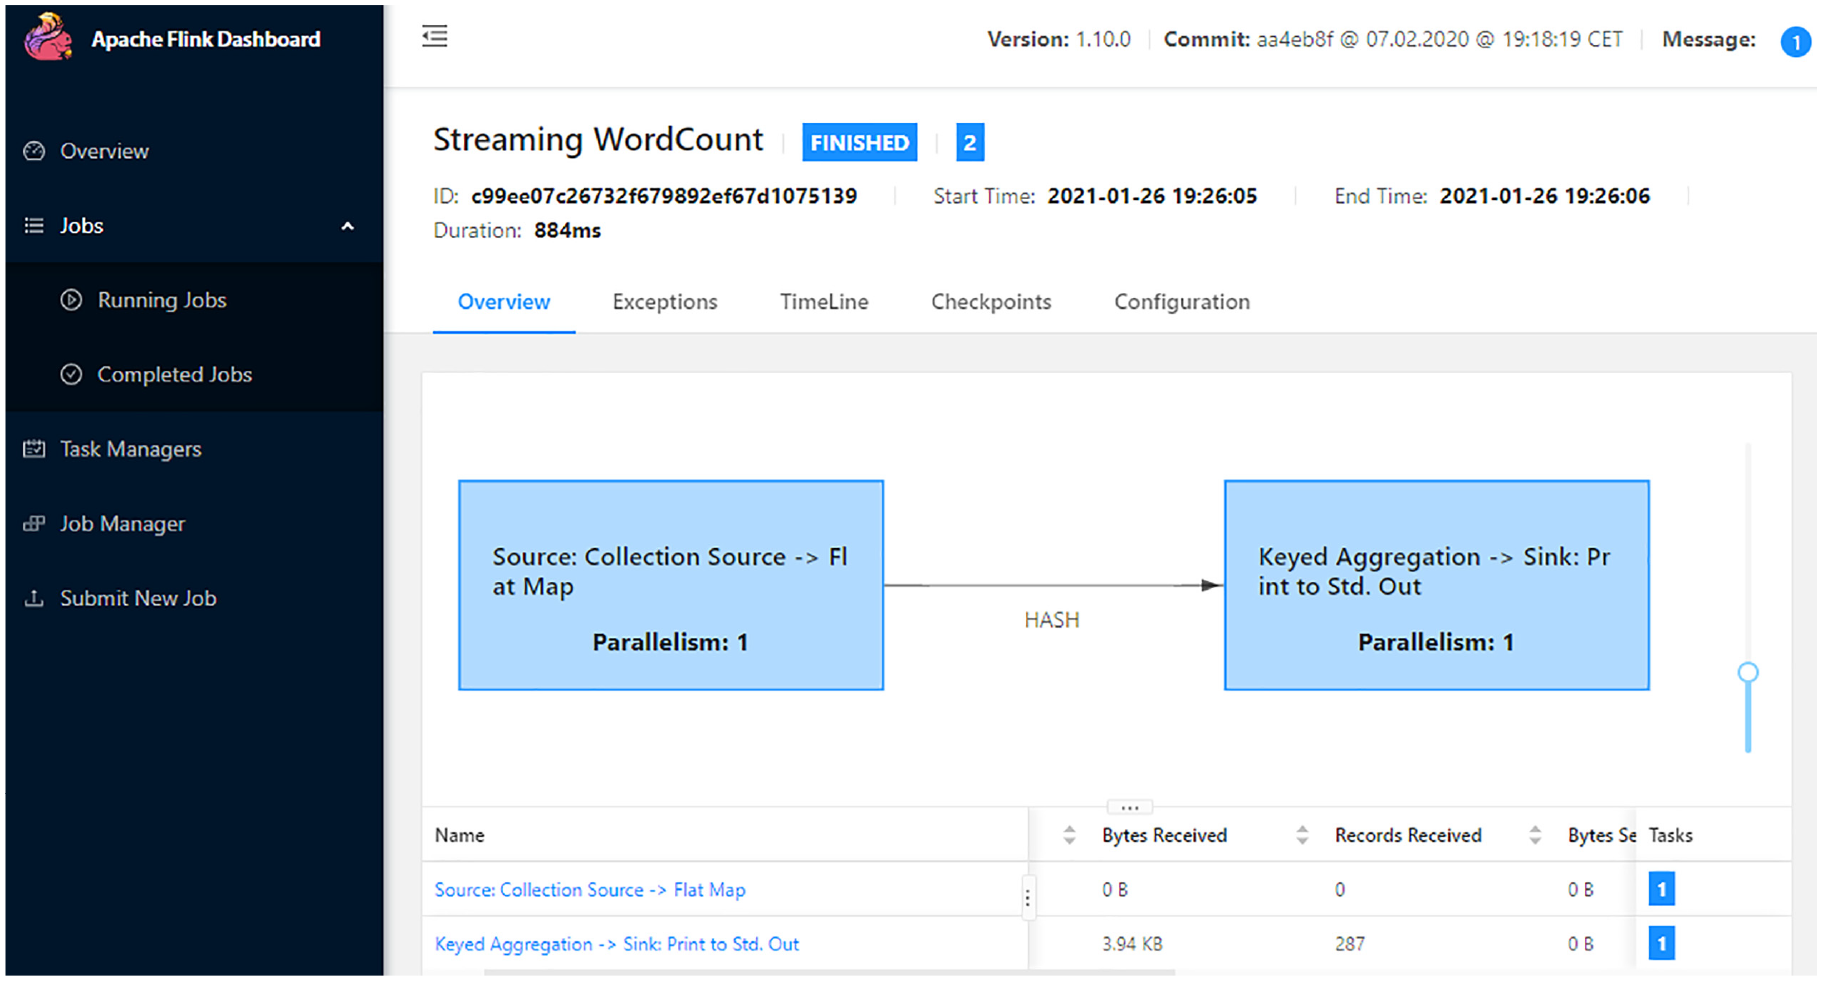
The workflow of a data processing task.
Conclusion
To solve the problem of data scale explosive growth and services’ increasing requirement, we proposed a load balance oriented data processing mechanism for bounded and unbounded data in smart cities. The position, function, and workflow of data processing were introduced in a smart city framework. Base on defined basic concepts, a load-balanced data processing mechanism, including LBR algorithm, was proposed to get the path with the minimum resource occupancy ratio. Through the numerical simulation and the experiment, the superiority and feasibility of our work had been proved. In our future work, further research on the handle, migration, and optimization of data processing in smart cities will go on.
Footnotes
Author’s note
Jianwu Li is now newly affilated to Beijing Institute of Technology, Advanced Research Institute of Multidiscipliary Science, Beijing, China.
Declaration of conflicting interests
The author(s) declared no potential conflicts of interest with respect to the research, authorship, and/or publication of this article.
Funding
The author(s) disclosed receipt of the following financial support for the research, authorship, and/or publication of this article: This work is supported by R&D Program of Beijing Municipal Education Commission (Research on Optical and Wireless converged Access Network Networking Technology in Smart Traffic, No. KM202111417010), China Computer Federation (CCF) Opening Project of Information System (Research on Massive Event Flow oriented Stream Computing Framework, No. CCFIS2019-01-01). And thanks to Ms. Li.