
Abstract
To enhance the detection performance of electronic nose (e-nose), a recognition method of gas feature based on a global extended extreme learning machine (GEELM) is proposed, which combines the expansion factor and global balance coefficient to expand and balance the difference between categories, and improve the classification performance. Then this method is applied to identify the quality of tea. Firstly, the dragging factor and following matrix are introduced to increase the distance between classes. Secondly, the global identification coefficient is introduced further to increase the feature differences among different types of tea, and improve the classification stability. Finally, under different feature sets, the classification performance of multi-pattern recognition methods is compared to prove the effectiveness of GEELM in e-nose gas feature recognition. The results show that GEELM has the best classification accuracy of 98.20%, F1-score of 0.9871, and Kappa coefficient of 0.9775. In conclusion, GEELM can be an effective technique to identify gas features, and it also provides a new method for tea quality measurement.
Keywords
Introduction
Tea is rich in various chemical components with nutritional value and health functions and is one of the most popular beverages worldwide. It is very common for low-grade tea to pretend to be high-quality tea. 1 At present, the inspection method of tea quality mainly relies on artificial sensory evaluation, but the method has the disadvantages of strong subjectivity and poor reproducibility. 2 Meanwhile, gas chromatography, 3 liquid chromatography, 4 near-infrared spectroscopy, 5 and other technologies can qualitatively analyze the chemical composition of tea. However, the detection of a single chemical component cannot show the overall quality of the tea. In the tea market, the smell of tea is an essential factor that affects consumers’ preferences, and the smell of tea of different qualities is different. Therefore, it is important to realize the effective identification of tea quality combined with a fast measurement method.
Electronic nose (e-nose) uses the gas array of cross sensitive to realize the classification decision of samples. It can reflect the overall gas information of the tested sample, and then reflect the overall quality. 6 It has the advantages of simple operation, good reproducibility, and high detection accuracy. Therefore, this paper is based on the e-nose technology to detect the gas information reflecting the overall quality of tea. In using the e-nose technology to realize the gas identification of the sample, an effective gas classification method is an important factor in improving the detection performance of the e-nose. Therefore, an effective pattern recognition algorithm directly determines the detection performance of e-nose. In the study of pattern recognition methods, Sun et al. applied the integrated learning algorithm of support vector machines (SVM), random forest (RF), and linear discriminant analysis to identify gas information of Chinese herbal, it showed that the classification effect of integrated learning was better than that of single classifier. 7 Qiao et al. 8 used the tree parzen estimator method to optimize the light gradient boosting machine algorithm to identify the gas information of wine. Jiang et al. 9 proposed an algorithm based on the voting committee to realize intelligent classification of indoor pollutant gas. Luo et al. 10 proposed a recognition algorithm of quantum particle swarm optimization to improve the performance of e-nose detection. Jia et al. 11 proposed a multi-core support vector machine algorithm to identify the pollutant gas based on e-nose technology. Shi et al. 12 tracked the origin of rice based on the multi-recognition technology, and the difference of gas features was visualized. Wang et al. 13 proposed a transfer learning method combined with e-nose to identify the xihu longjing tea. Zhang et al. 14 proposed a cross-domain discriminative subspace learning method to identify the gas information for multiple e-nose systems. In previous studies, researchers have proposed various pattern recognition methods to identify the gas features. However, Due to the existence of certain nonlinearity and correlation between gas features, this requires high classification performance of the pattern recognition algorithm. The poor classification stability, slow training speed, and low classification stability are still shortcomings.
Extreme learning machine (ELM) is a supervised pattern recognition algorithm with simple structure, fast running speed, and strong classification performance, 15 which was proposed by Guangbin Huang, professor of Nanyang University of technology in Singapore. It is a single hidden layer feedforward neural network, and classification can only be achieved by determining the connection weight between the hidden and output layers. 15 ELM has been successfully applied in many fields. Janakiraman and Deva Priya 16 used ELM to identify human DNA sequences and obtained better classification accuracy. Men et al. intelligently identified the fusion features of e-nose and electronic tongue based on the ELM algorithm to realize the classification of beer flavor information. Compared to SVM and RF, ELM obtained the best classification performance. 15 Shi et al. 12 obtained the gas information of rice from different origins based on the e-nose technology and traced the origin of the gas information of the rice based on the ELM algorithm. Lahoura et al. obtained online data of breast cancer based on cloud technology and combined it with ELM for online identification. Compared to other diagnostic technologies, ELM achieved the best classification performance. 17 Yaseen et al. 18 used the ELM algorithm to predict the drought index nonlinearly and provided an effective technical method for preventing drought. However, although ELM has achieved a good classification result, it still has the disadvantage of low classification stability because it is a kind of neural network. In the previous research, the research on the improved algorithm of ELM. Li et al. 19 proposed radial basis function-extreme learning machine (RBF-ELM), combined the density peak clustering algorithm to select the center of RBF adaptively, and then realized the effective identification of mixed data. Zeng et al. 20 combined ELM and dictionary learning to enhance the consistency of the data within the class, added the maximum margin standard regularization method to avoid over-fitting, and finally realized image classification. Diker et al. combined the differential evolution algorithm (DEA) and ELM to classify the EEG features extracted by the convolutional neural network. Compared with other pattern recognition algorithms, DEA-ELM achieved the best classification performance. 21 Turkoglu 22 proposed a multi-core ELM machine combined with a deep learning method to realize the detection of new coronaviruses in CT scan images. Hasani and Shabanlou 23 proposed a weighted regularized (ELM) to estimate the side channel flow coefficient and compared it with the traditional ELM to prove its effectiveness. Zhao et al. 24 proposed a weighted discriminative ELM to solve the classification problem of sample imbalance to realize the diagnosis of lung cancer gas. Wang et al. 25 proposed an unsupervised discriminative domain reconstruction based on ELM to improve the detection performance of e-nose. Shi et al. 26 proposed a novel L1 regularized ELM for soft-sensing of an industrial process. However, the neural network algorithms generally have the disadvantage of low classification stability. Still, most of them have not improved the structure of ELM itself, which will not essentially improve the classification stability of ELM. A small amount of research has improved the ELM itself, but the stability of the ELM has not been significantly improved. Meanwhile, the data differences between classes have not been effectively balanced. Therefore, this paper proposes a global extended extreme learning machine (GEELM) to enhance classification stability and performance. Meanwhile, compared with traditional ELM and other classical pattern recognition algorithms, the effectiveness of GEELM is verified in gas feature recognition of tea.
To improve the classification performance of the e-nose gas features, provide an effective detection method for the quality supervision of the tea market, this paper proposes a GEELM combined with e-nose for identifying tea gas information. In the GEELM, the dragging factor and following matrix are introduced to increase the distance between classes. Meanwhile, the global identification coefficient is introduced to increase the feature differences among different types of tea and improve the classification stability of ELM. The identification process of gas features based on GEELM is discussed in detail.
Methods
ELM
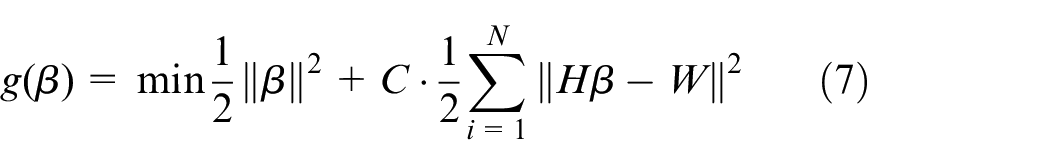
ELM randomly initializes the connection weight between the hidden and the output layers. When regularization learning rules are introduced to enhance the classification performance, the ELM optimization problem can be transformed into the form of Formula (1) 27 :
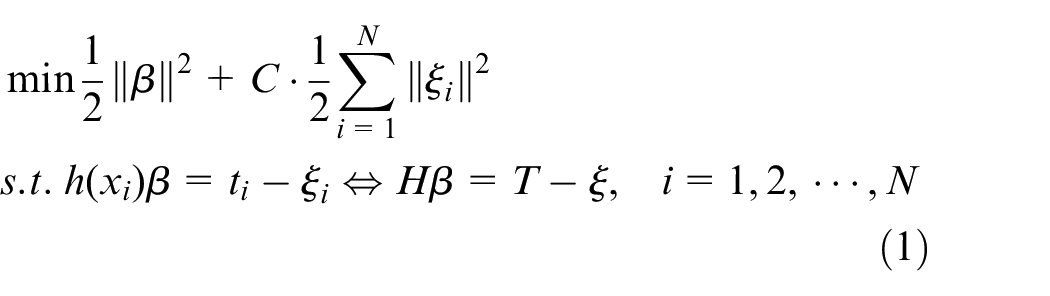
where
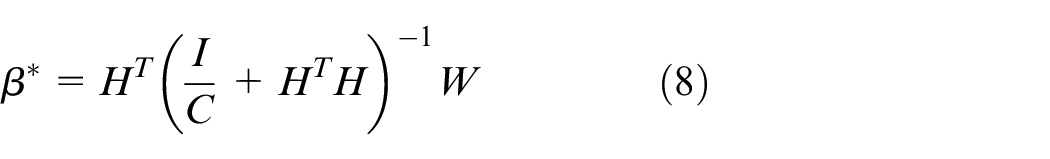
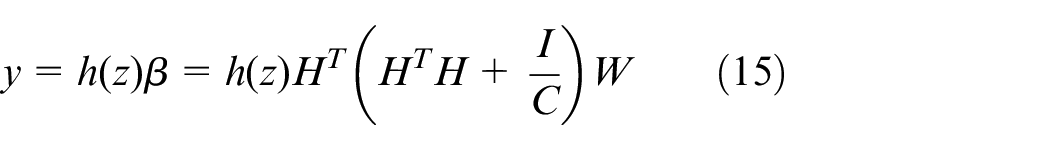
Category 1: when there are few training samples, the output function can be expressed as 28 :
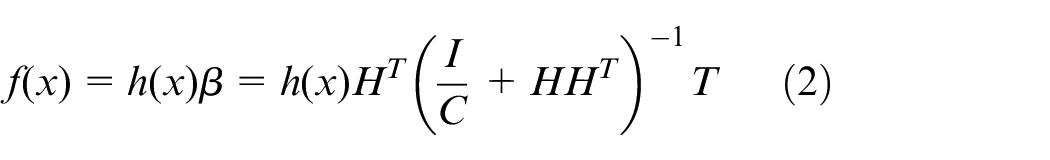
where I is the identity matrix.
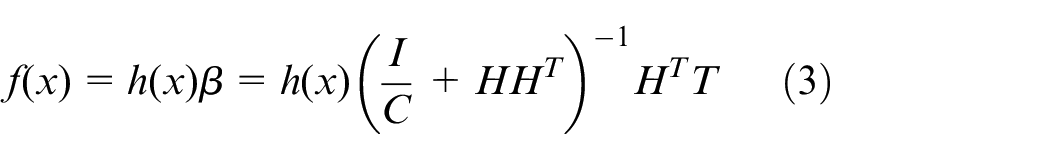
Category 2: when the number of training samples is too large, which is greater than the number of features, the output function can be expressed as 28 :
GEELM
Figure 1 shows the algorithm flow chart of GEELM. The improvement process of GEELM to ELM is as follows:
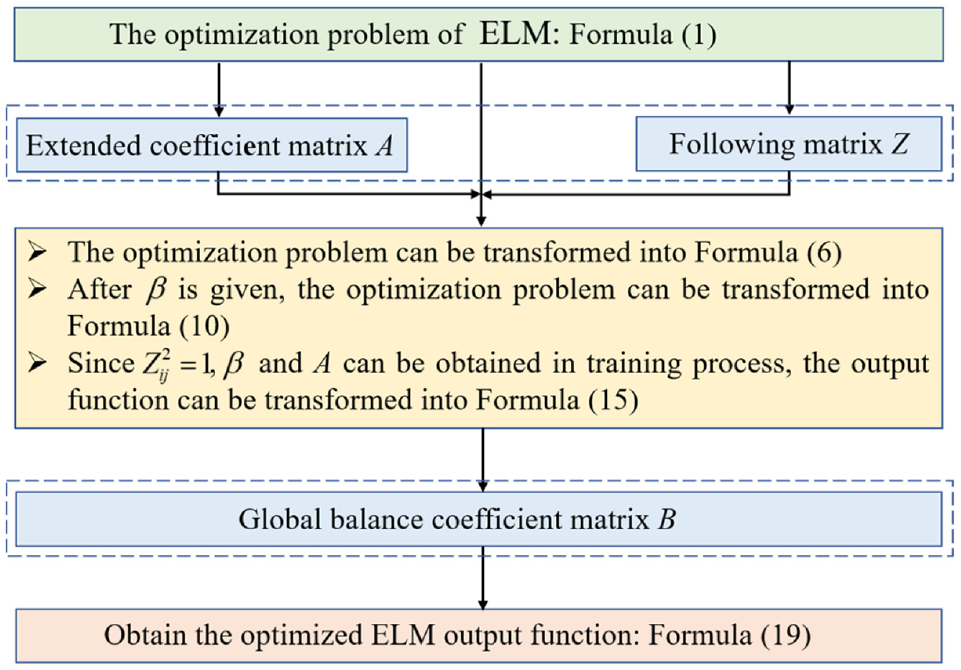
The algorithm flow chart of GEELM.
Set the output labels of different types of samples as
The extended forms of GEELM.
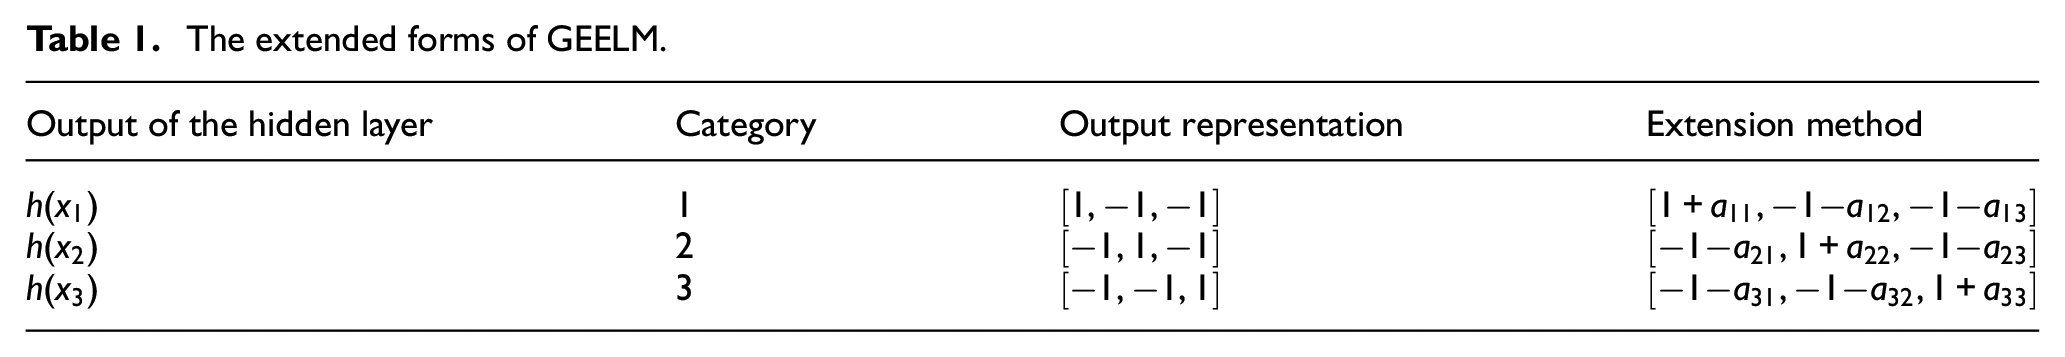
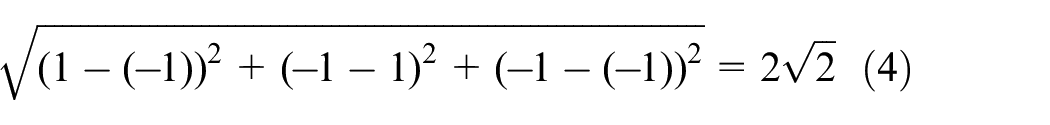
For the first two categories output calculation, when the expansion coefficient matrix A is not introduced, the distance between the output categories can be expressed by Formula (4):
After adding expansion coefficient matrix A, the distance between output classes of the hidden layer can be expressed by Formula (5):

Figure 2 shows the extended form.
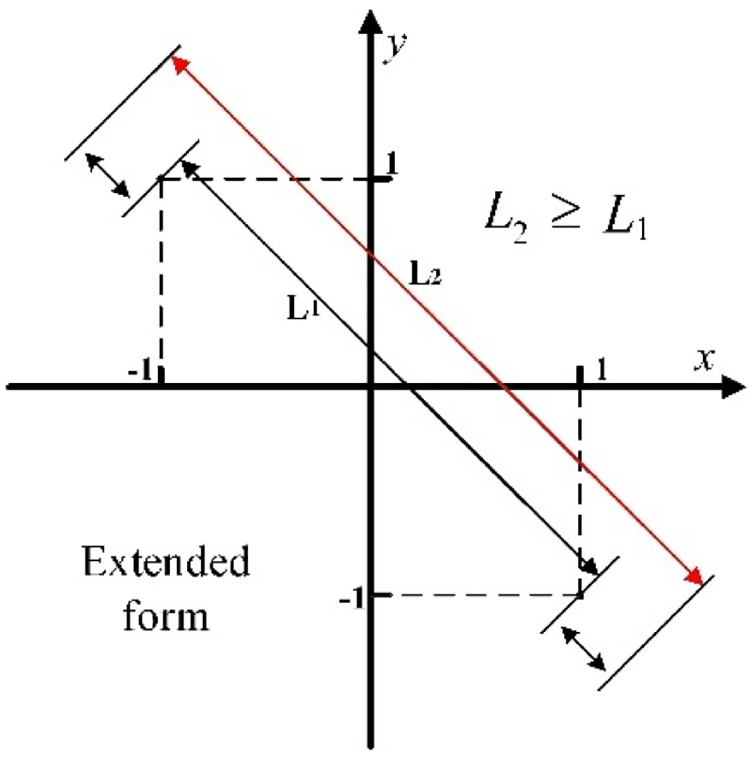
The extended form of GEELM.
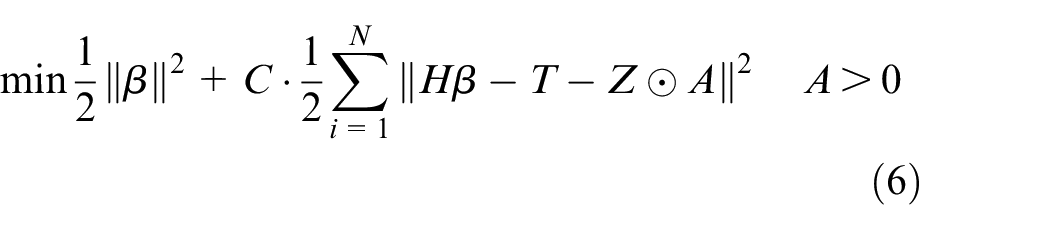
In this way, solving the problem can be expressed by the following Formula:
Set
Because
After
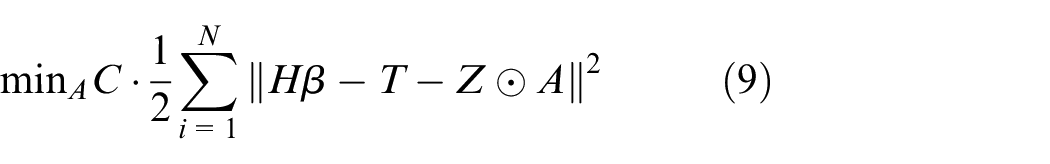
Set
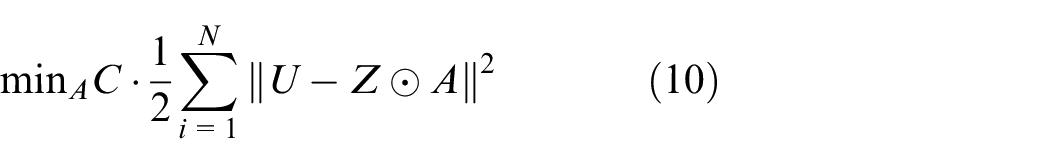
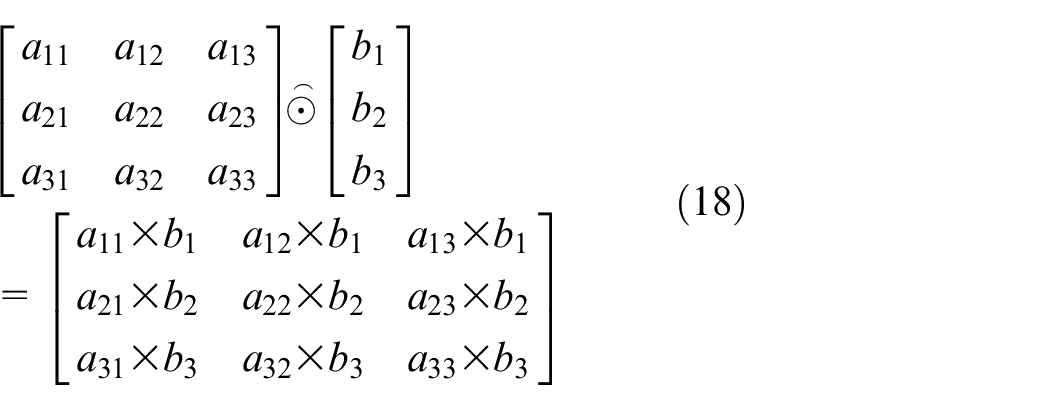
Because of the calculation form of Hadamard product, Formula (10) can transform the multiplication form of elements, which can be expressed as:

Since

The optimization problem is further transformed into:

Since Aij > 0, the following results are obtained:

In the training process, the
To obtain the optimal

The optimal parameters are obtained. Where k is the number of iterations, and the maximum is 50. Meanwhile, the global balance coefficient matrix B = bi is proposed to increase the difference between categories, thereby improving the classification stability of ELM.

where
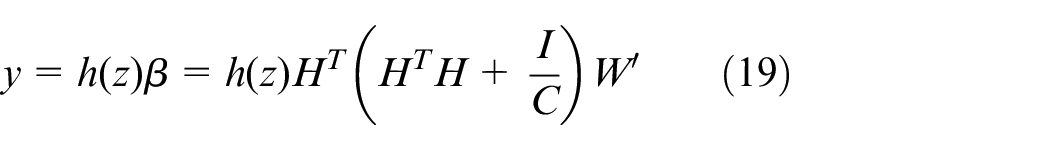
Further, W is transformed to
In this study, the Sigmoid is used as the transfer function. To pre-adjust the parameters for the best classification performance, the penalty factor C is 0.02 after training and optimization, and the number of hidden layer neurons is 500.
Feature processing
Feature processing includes feature dimensionality reduction and feature selection. Feature dimensionality reduction is data linearly reconstruction on the original features to obtain some linearly independent feature vectors to represent the original detection data, which makes the features independent of each other. Feature dimensionality reduction is not a specific feature but new features after linear transformation of the original features. Feature selection is to delete some features that affect the classification performance from the original features to improve the classification ability of classifier.
There is an obvious correlation between the original detection features of e-nose, which will reduce the decision-making performance of the classifier. We used the feature dimensionality reduction method to process the original detection features to remove the correlation between the features. Principal component analysis (PCA), kernel principal component analysis (KPCA), and kernel entropy component analysis (KECA) were introduced to transform the original gas features. PCA transforms the original features into several linearly independent principal components by linear transformation. 6 However, the extracted features had strong nonlinearity because the sensor array of cross sensitive. Therefore, KPCA first maps features to high-dimensional space based on the kernel function to reduce the nonlinear relationship between features and reduce the dimension of features in high-dimensional space. 29 The radial basis kernel function was applied in this work, and the kernel function parameter was 10. KECA does not use eigenvalues to retain effective information. It uses Renyi entropy to represent the feature structure of input space, ensure the minimum information loss in dimension reduction, and retain the maximum information entropy of features.12,30 KECA is more conducive to finding the feature direction after dimensionality reduction.
In this work, to obtain the overall information of the e-nose detection feature, after pre-adjusting the cumulative variance contribution rate, we took the principal components with the cumulative method contribution rate of more than 90% to form the dimensionality reduction feature set.
Meanwhile, to compare with the feature dimensionality reduction method, based on the feature selection methods, the recursive feature elimination (RFE), maximum information coefficient (MIC), and maximum relevance minimum redundancy (MRMR) were applied to obtain the optimized feature set. The feature selection method sequentially accumulated the features according to their importance to obtain multiple feature sets. The optimized feature set was obtained when the classifier obtained the best classification accuracy.
Process of gas identification
In this work, GEELM was proposed and combined with e-nose technology to realize intelligent identification of gas information of different grades of tea. The main steps were as follows:
Obtain the gas information of different grades of tea based on PEN3 e-nose;
Feature extraction was carried out according to the characteristics of the detection signal of the e-nose;
The feature dimensionality reduction and feature selection methods were used to obtain the feature set after feature processing;
Different feature sets were identified based on GEELM and other multi-pattern recognition methods to verify the effectiveness of GEELM.
Experiment and discussion
Samples
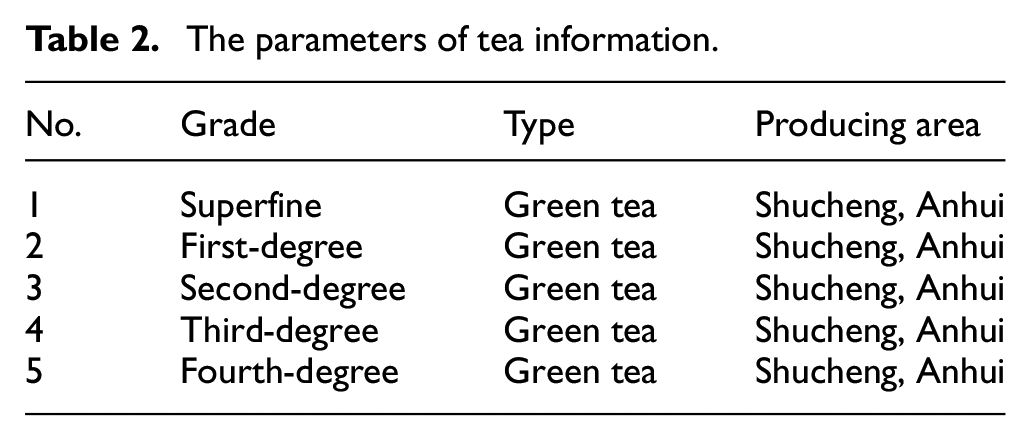
Five different grades of Shucheng little orchid tea were used as experimental samples. The grade, type, and producing area of tea are shown in Table 2. Five grams of Shucheng little orchid tea were placed into a 200 ml beaker, 150 ml boiling distilled water was added, and covered with a surface plate. After soaking for 5 min, the tea leaves were filtered, and the tea soup was cooled to room temperature for analysis. Meanwhile, sufficient tea soup was prepared during the experiment.
The parameters of tea information.
E-nose
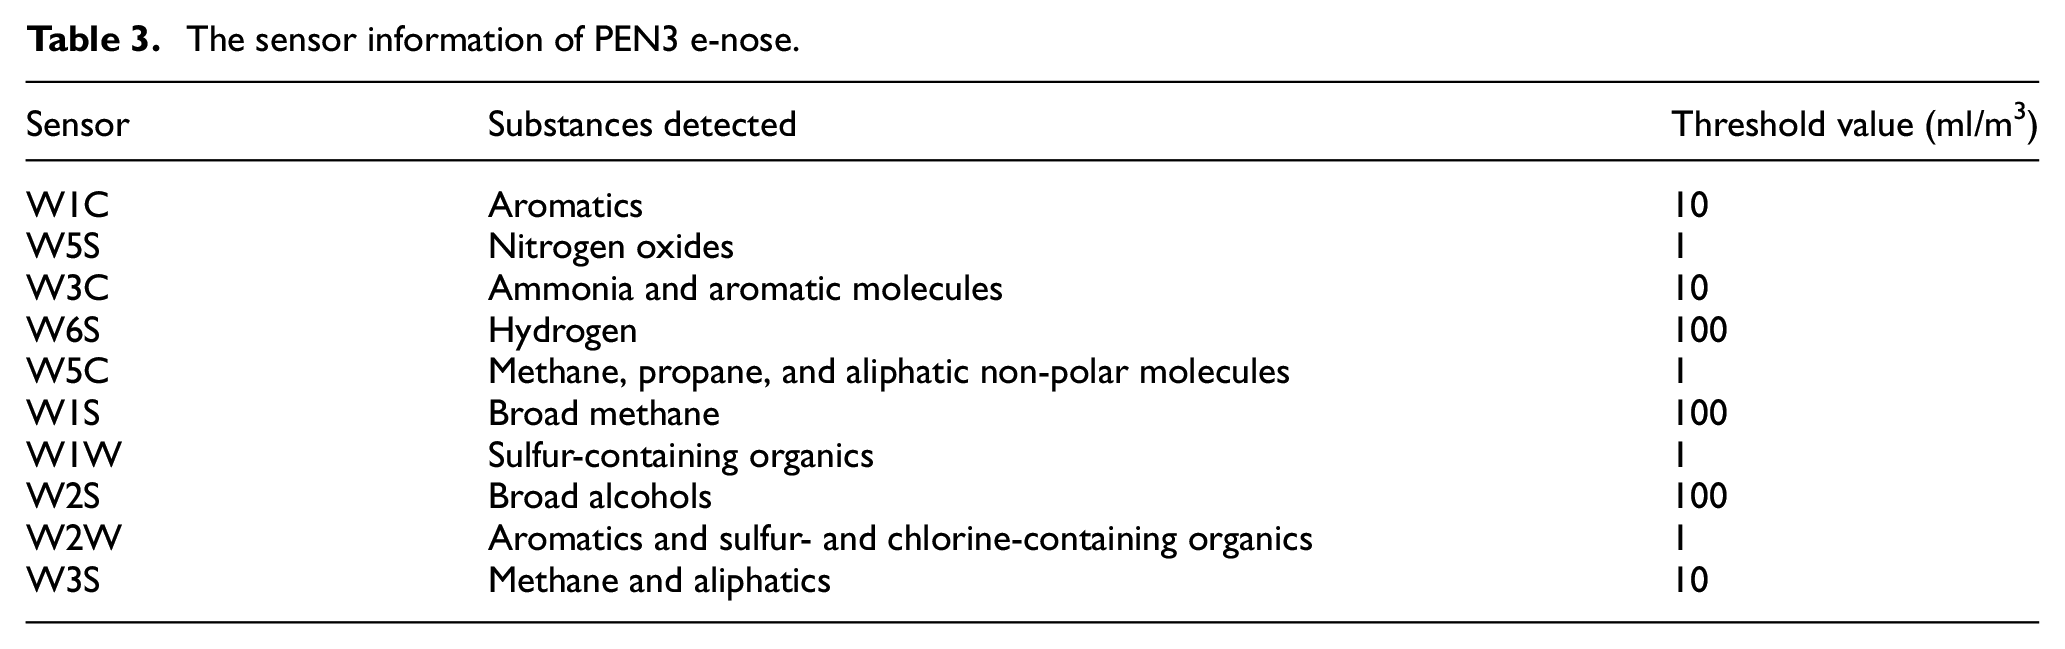
The PEN3 e-nose developed by German Airsense company was used to detect the volatile gas of tea. The e-nose system comprises a gas acquisition device, gas detection unit, and air purification device. The system structure is shown in Figure 3. The detection unit includes a sensor array and pattern recognition analysis system. The gas sensor array includes 10 metal oxide sensors, which can realize the gas information detection of cross sensitive. Its working principle is that the gas and the active material on the sensor’s surface undergo an oxidation-reduction reaction to produce a conductivity value. The response value of the sensor is defined as G/G0, where G is the sensor’s conductivity when the measured gas enters the sensor chamber, and G0 is the conductivity of the sensor when the pure air enters the gas chamber. The parameters of each sensor are shown in Table 3.
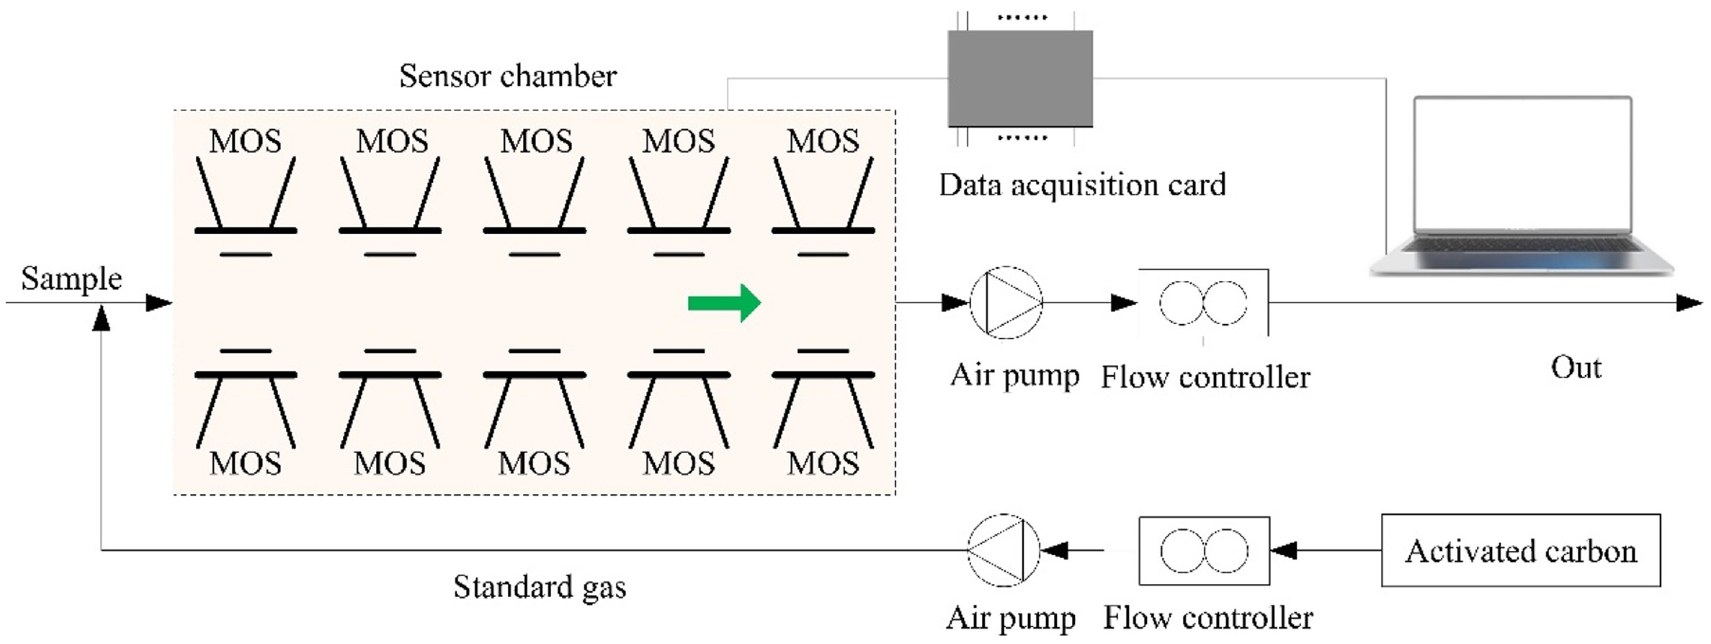
The structure diagram of e-nose system.
The sensor information of PEN3 e-nose.
Experimental process
The ambient temperature for e-nose gas test was 25 ± 5°C. The experimental parameters and steps determined by pre-experiment were as follows:
Take 50 ml of tea sample into 200 ml volumetric flask, seal it with preservative film and stand still for 20 min to ensure sufficient headspace air.
Clean air with a 300 ml/min flow rate treated by activated carbon was introduced into the sensor chamber for 60 s to clean the sensor chamber.
After cleaning and calibrating the sensors array, the volatile gas of tea was detected. Based on the detection method of dynamic headspace, a single sample was detected for 80 s, and the frequency of obtaining gas information was 1 Hz.
To avoid losing generality, 30 groups of parallel samples were prepared for tea of each grade, and 150 groups of data were obtained from five different grades of tea.
Figure 4 shows the sensor response curve of the e-nose in the process of gas detection. The x-axis is the detection time, and the y-axis is the response value of the sensors.
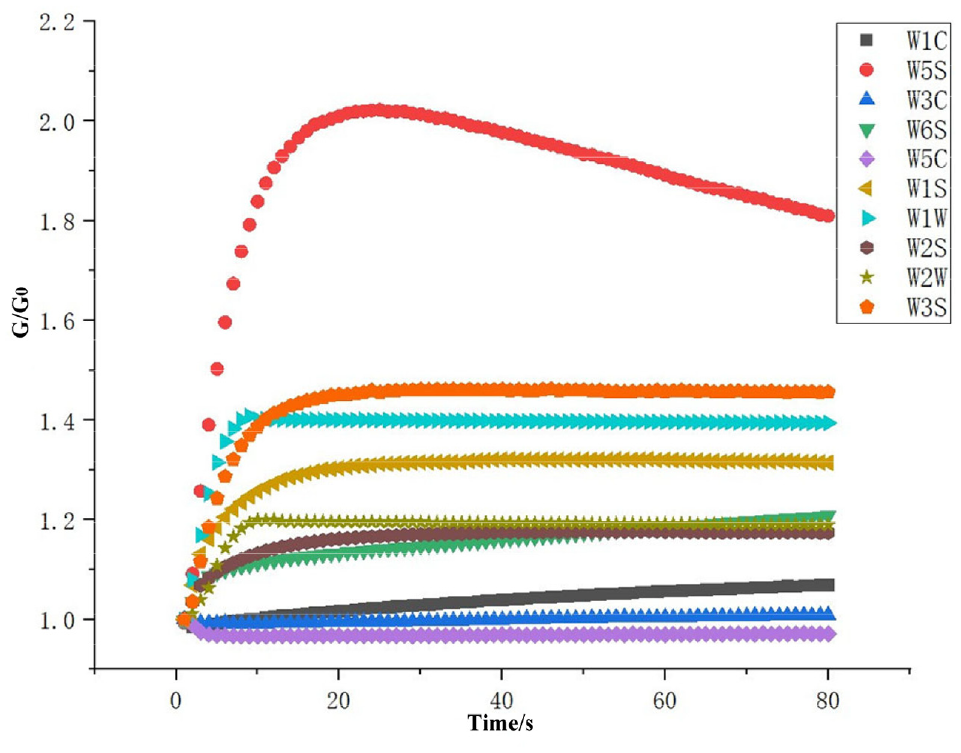
The response curve of e-nose sensor.
Feature extraction
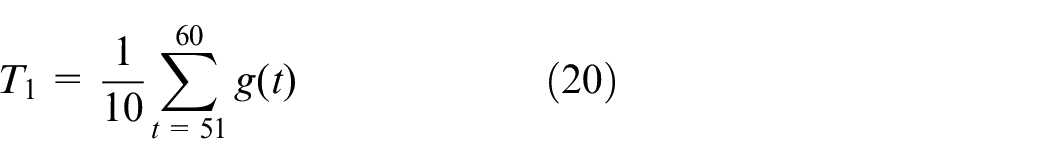
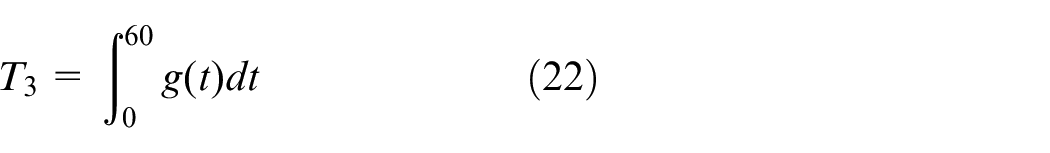
Figure 5 shows the response radar chart of gas information of different grades of tea in 60 s, and the overall trend of the gas response was similar. The original detection signal contained a lot of redundant information. If the data was directly input to the pattern recognition algorithm, it would increase the classification difficulty of the classifier. Therefore, it was necessary to extract the features that could represent the overall characteristics of gas information. Figure 5 shows that W5S had the largest feature response, but it cannot be used for pattern recognition with the response features of a single sensor, which would cause overfitting of the model. Meanwhile, the high or low of sensor response information could not be used to judge the effectiveness of its features. Therefore, we extracted the different features to represent the overall properties of the original signal, including the steady-state mean value of 51–60 s, the maximum value, and the integral value of 0–60 s. Because the detection signal was stable, the time-frequency feature was not selected. The steady-state mean value represented the dynamic balance of gas volatilization and air intake in the stable detection state. The maximum value represented the peak value of gas volatilization concentration. The integral value was the dynamic feature of gas volatilization degree in the whole detection process. Formulas (20)–(22) shows the calculation method of features. To accelerate the convergence speed of model, the 30 features contained in 10 sensors were normalized to the interval (0, 1).

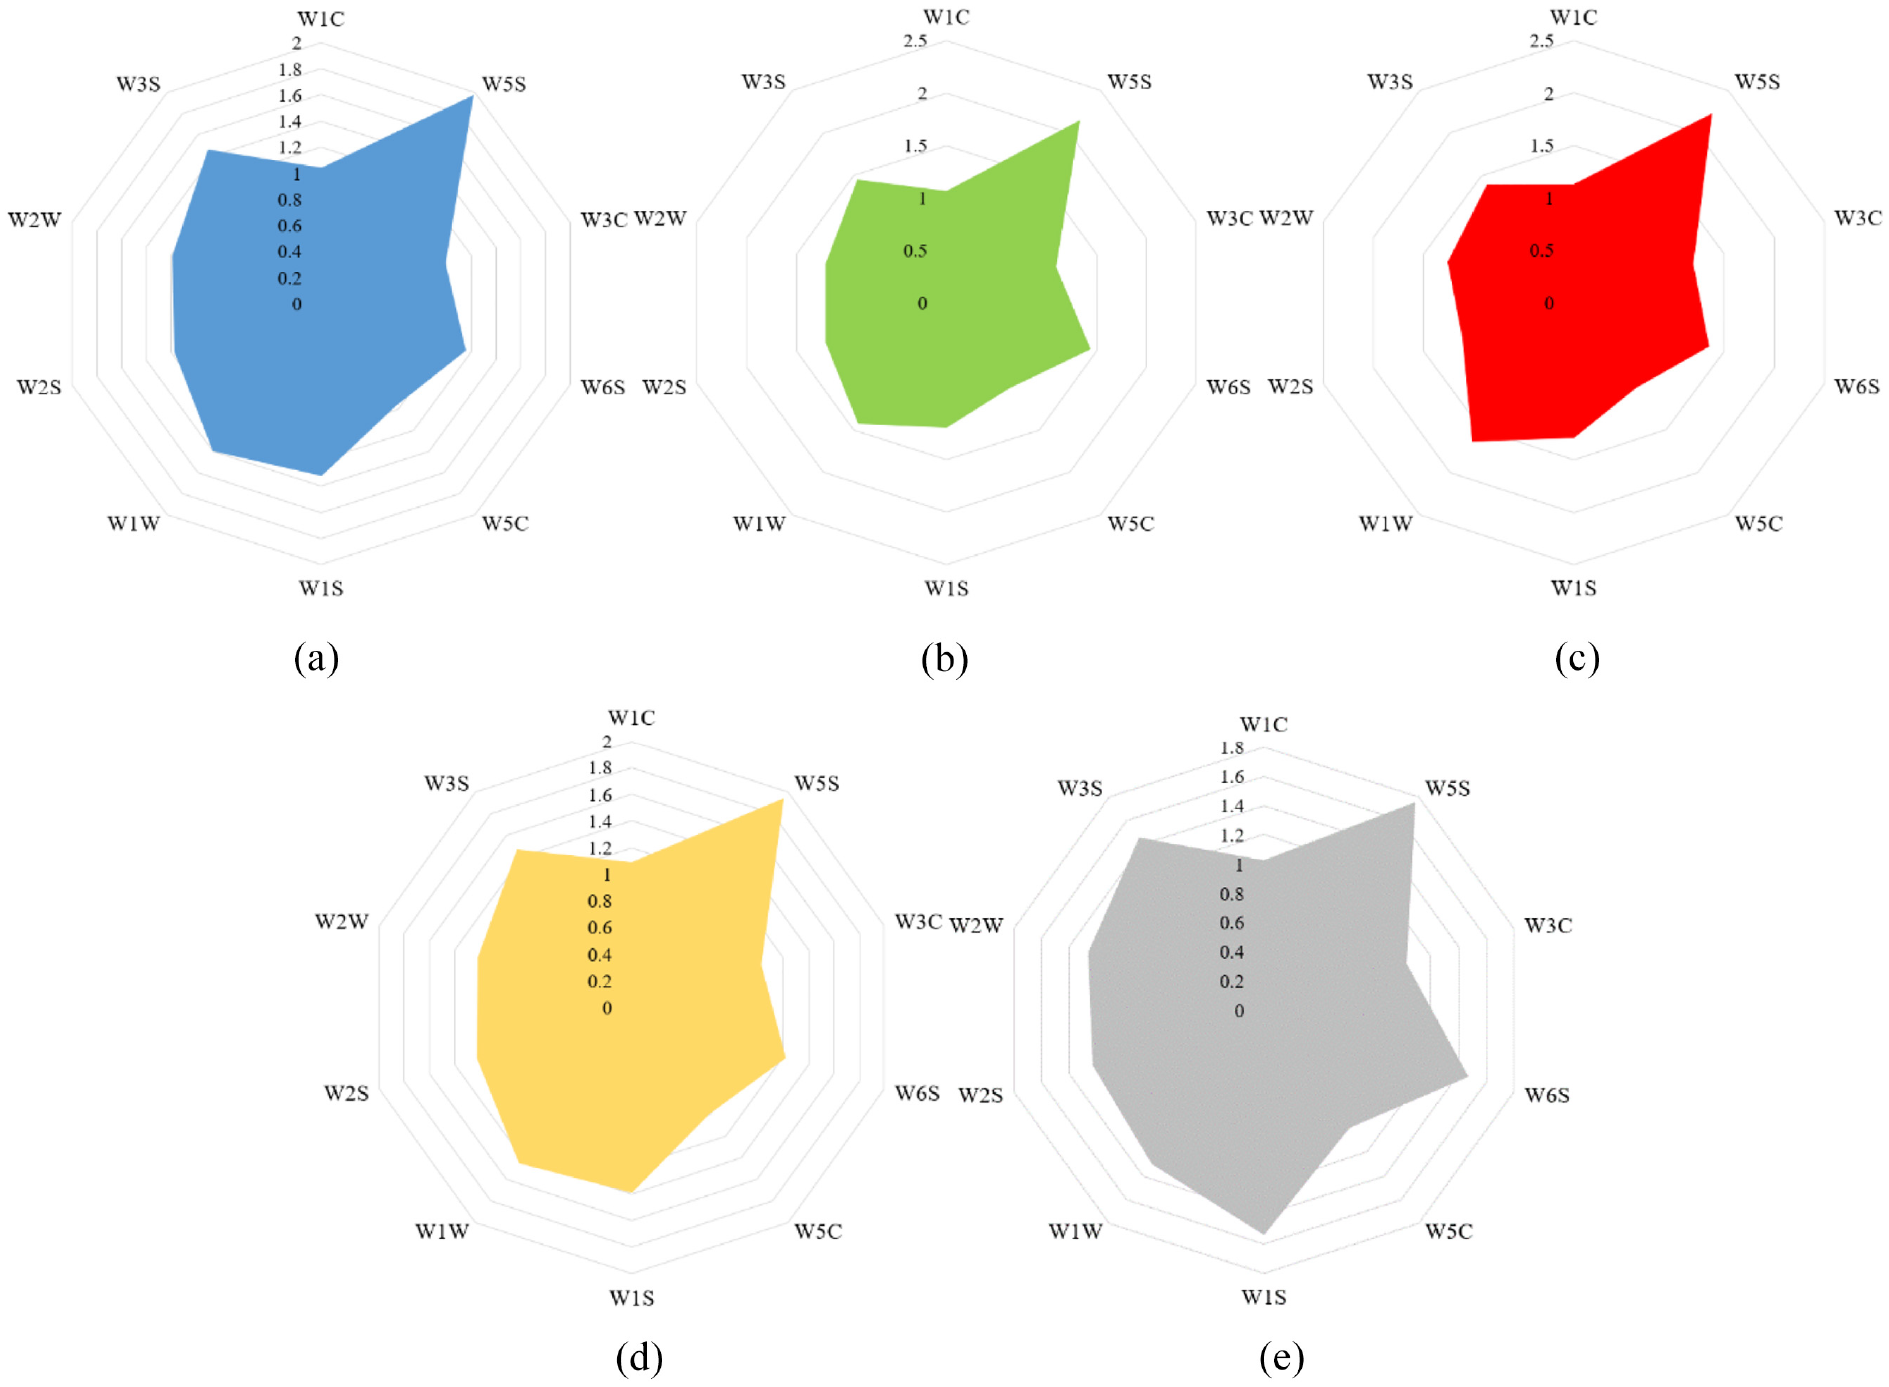
The radar chart of e-nose response information: (a) superfine, (b) first-degree, (c) second-degree, (d) third-degree, and (e) fourth-degree.
where g(t) represents the response value at time t, and T1–T3 represents the steady-state mean value of 51–60 s, the maximum value, and the integral value of 0–60 s.
Feature processing
Ten sensors contained a total of 30-dimensional gas features. If there were strong correlation between the features, it would increase the classification difficulty of the pattern recognition method. Based on the calculation method of Pearson correlation, Figure 6 shows the correlation heat map of 30-dimensional gas features. The correlation value range was (−1,1), and the value close to 1 indicated that the two features have a strong positive correlation. A value close to −1 meant a strong negative correlation between the two features. It can be seen that there were positive and negative correlations between different features. Therefore, feature preprocessing methods were applied to obtain the optimal feature set of e-nose gas features.
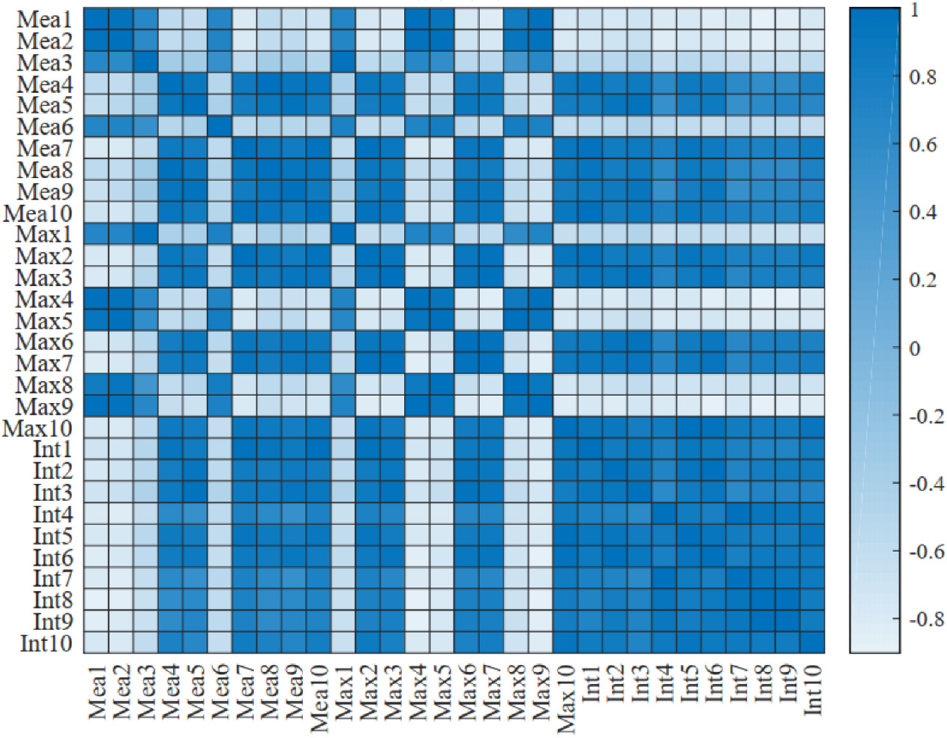
The heat map of correlation between features.
For the feature dimensionality reduction, PCA, KPCA, and KECA were introduced to transform the original gas features to reduce the correlation between input features. Figure 7 shows the effect of feature dimension reduction. The cumulative contribution rate of PCA’s first two principal components was 68.91%, KPCA was 74.81%, KECA was 84.75%. Obviously, after PCA dimensionality reduction, there were more overlapping samples between classes, KPCA had obvious dimensionality reduction effect, and KECA had the best dimensionality reduction effect. In this work, for the three feature dimensionality reduction methods, the feature vectors corresponding to the feature values whose cumulative principal component reached more than 90% were used for pattern recognition. Finally, when the cumulative principal component reached more than 90%, the number of principal components obtained by PCA, KPCA, and KECA were 8, 8, 5, respectively.
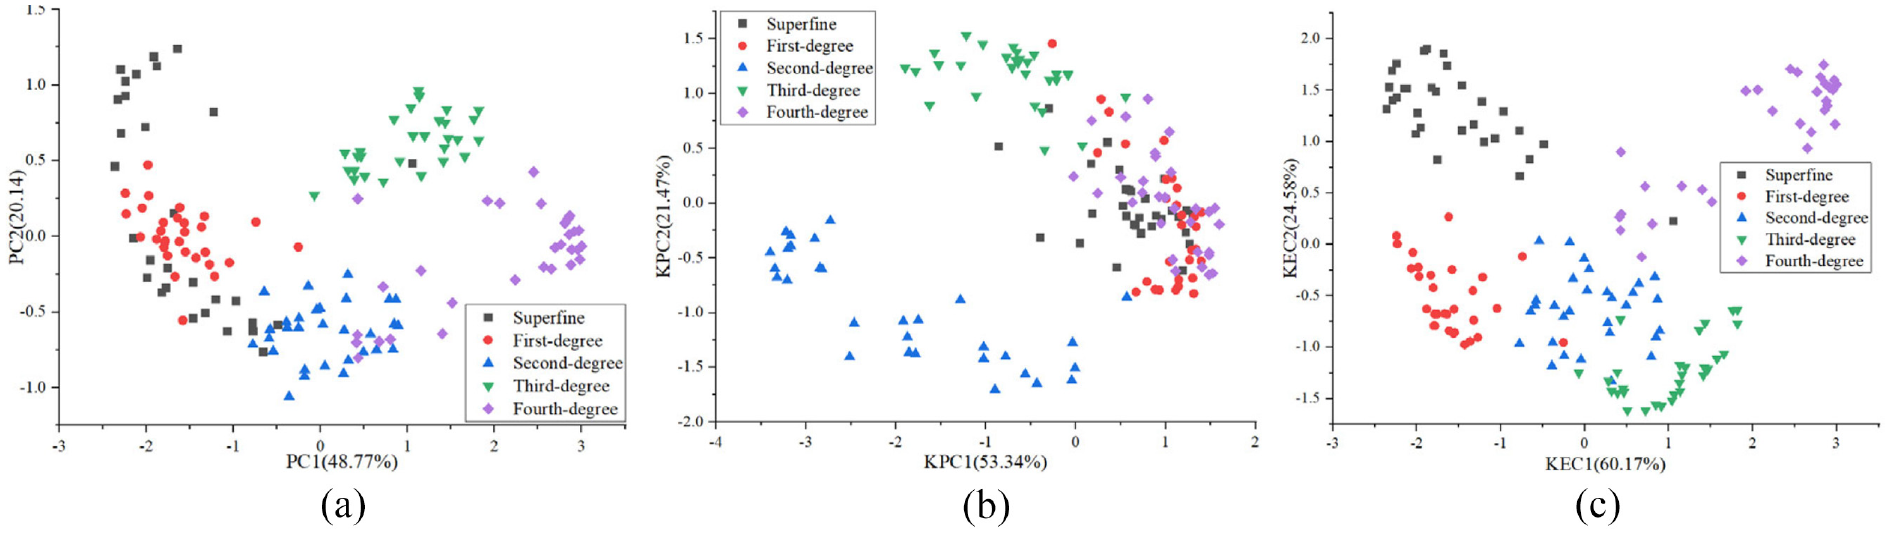
The feature dimension reduction effect: (a) PCA, (b) KPCA, and (c) KECA.
For the feature selection methods, the RFE, MIC, and MRMR were applied to obtain the optimized feature set. The feature selection method sequentially accumulated the features according to their importance to obtain multiple feature sets. The optimized feature set was obtained when the classifier obtained the best classification accuracy.
Classification results
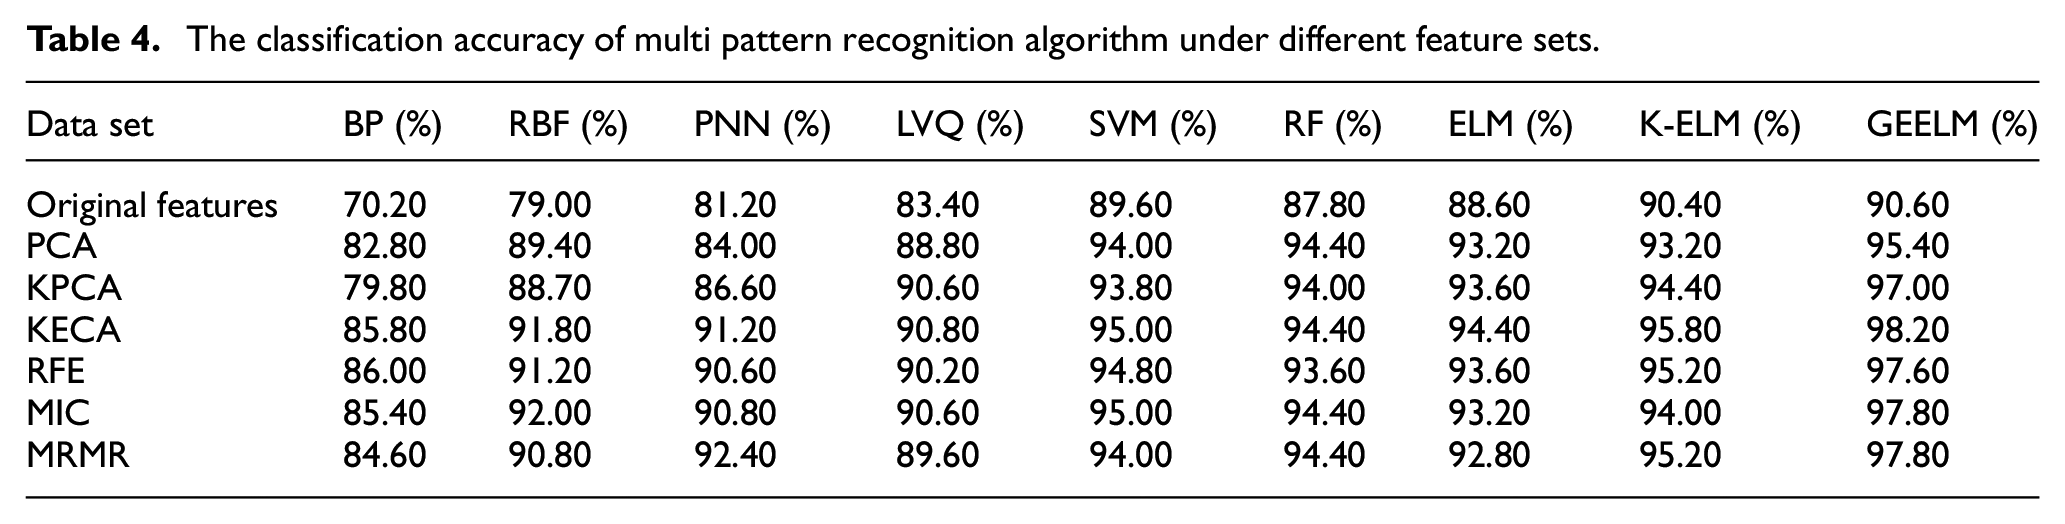
Each grade of tea contained 30 samples. Based on the Kennard stone (KS) method, 20 samples were selected as the training set, and 10 samples were selected as the testing set. Then the training set contained 100 samples, and the testing set contained 50 samples. KS could make the sample distribution more extensive, which is conducive to strengthening the generalization ability of the model. 31 The original fusion feature contained 30 dimensions. To highlight the classification effectiveness of GEELM, the backpropagation neural network (BP), radial basis function neural network (RBF), probabilistic neural network (PNN), learning vector quantization neural network (LVQ), SVM, RF, ELM, and kernel extreme learning machine (KELM) under different feature sets were compared and analyzed. After training and parameter tuning, and Table 4 shows the average accuracy of each algorithm for 10 runs. Overall, the accuracy of the feature set formed by KECA was better than other feature sets, which showed the effectiveness of the KECA feature processing method. BP had the lowest classification performance in the performance comparison of each classification method. BP is a classic neural network algorithm with many trainable parameters, which requires many samples for training. The detection data of the e-nose had the characteristic of a few samples. Therefore, BP had over-fitted, and the classification performance was poor. Compared with BP, other algorithms had better classification performance because of their fewer trainable parameters. Importantly, GEELM achieved better classification performance in each feature set, and 98.20% accuracy was obtained in the KECA feature set, which was better than the traditional ELM and KELM method.
The classification accuracy of multi pattern recognition algorithm under different feature sets.
When a high classification accuracy is obtained, the classifier should have a good stability. To visualize classification stability, we selected the box diagram to show the classification stability of multi-classifiers. Figure 8 shows the visualization diagram of classification stability of ELM, KELM, and GEELM under different feature sets. In the 10 calculation results, the maximum classification accuracy value was indicated by the upper boundary of the box plot. The lower boundary indicated the minimum value, the black line indicated the median value, and the singular point was outside the box diagram. The traditional ELM classification stability was poor, and the singular point appeared in the original features. Compared with ELM and KELM, GEELM had obtained better classification stability under each feature set, which showed that the algorithm improved classification accuracy and enhanced the classification stability.
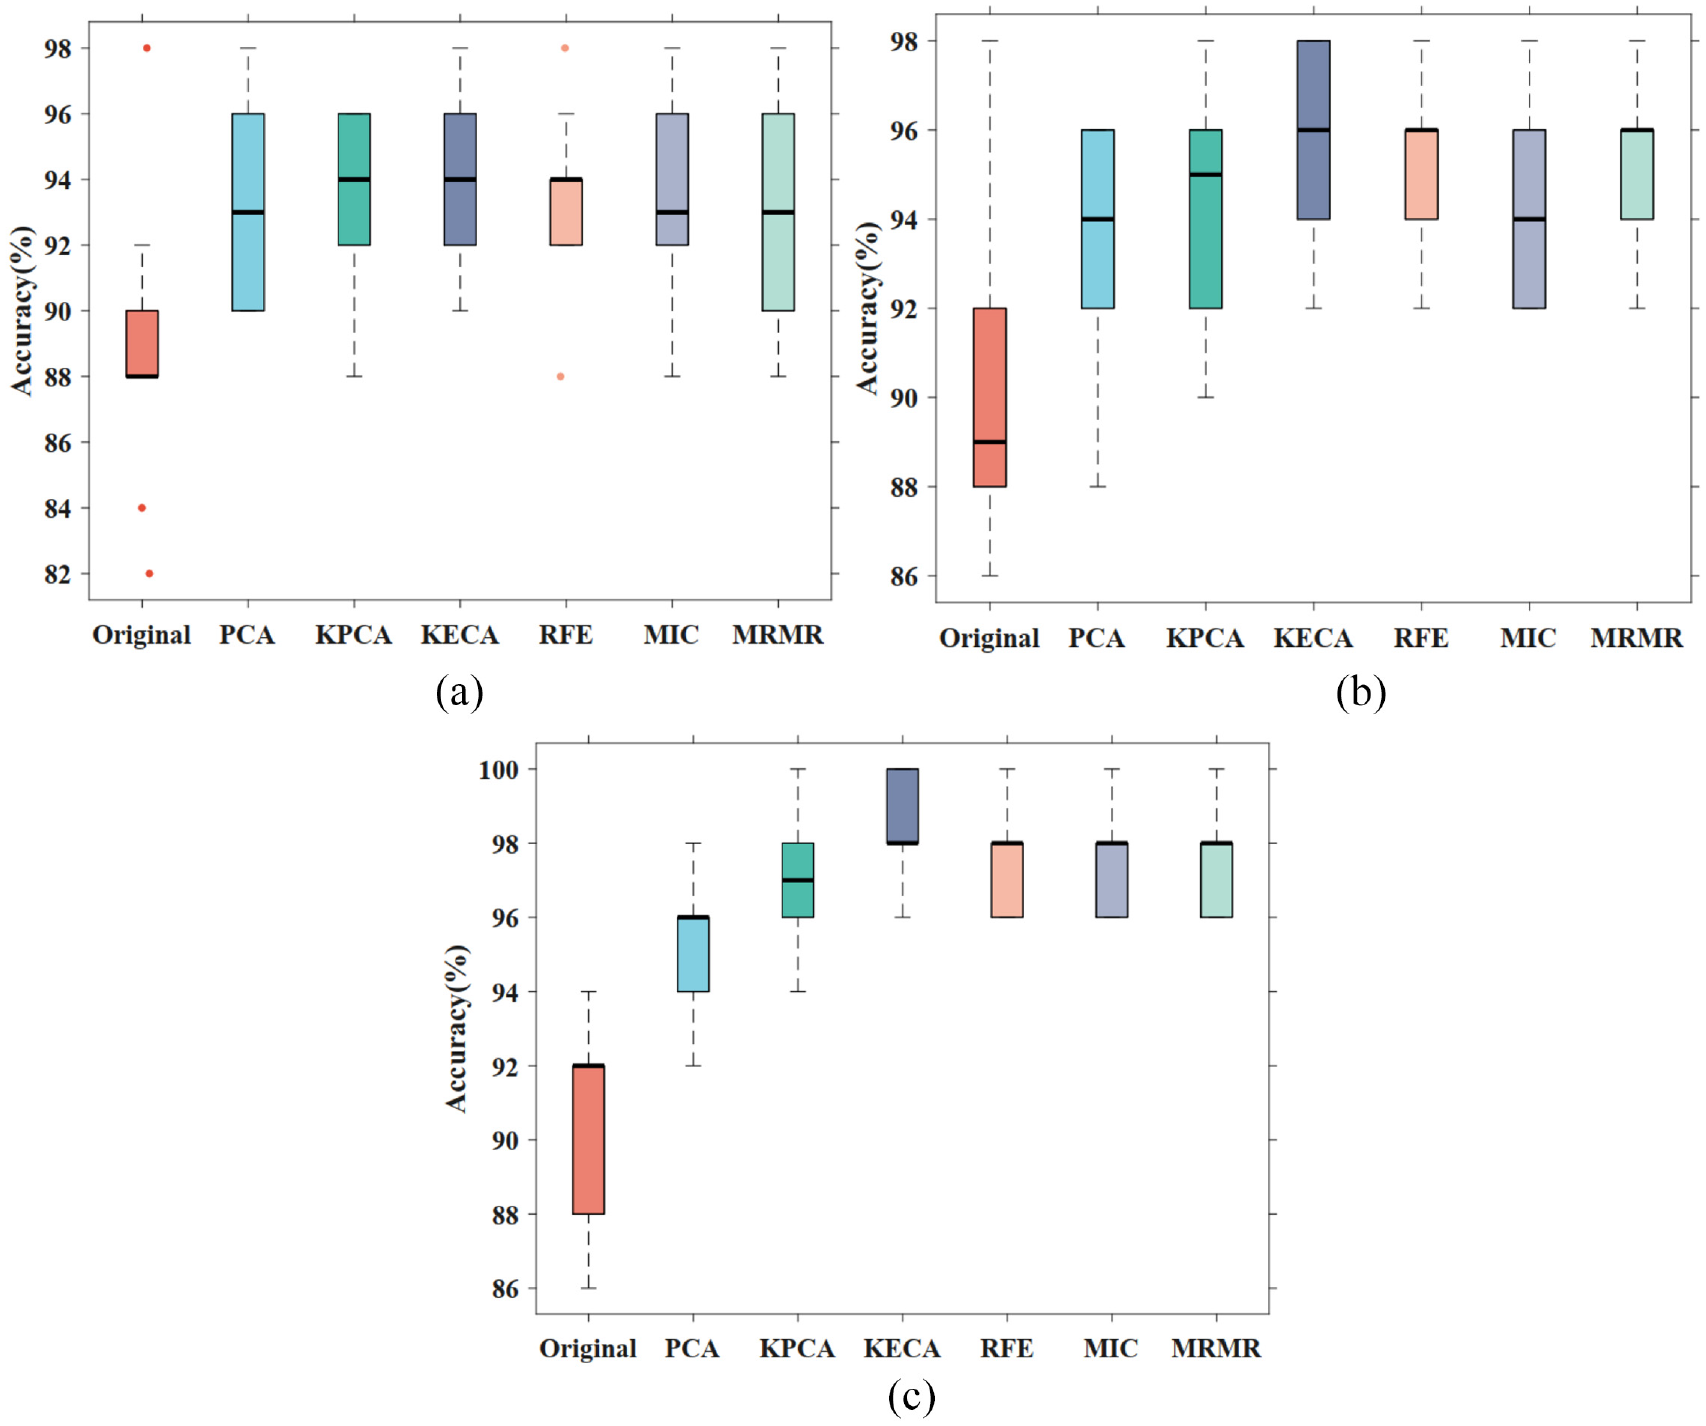
The box diagram of classification stability: (a) ELM, (b) KELM, and (c) GEELM.
To evaluate the classification performance of the classifier under multi-indexes, this paper introduced the evaluation methods of F1-score and Kappa coefficient. The F1-score value is close to 1, which shows that the classifier has strong comprehensive classification ability. The Kappa coefficient is close to 1, indicating that the actual and predicted output is consistent. Figure 9 shows each classifier’s best F1-score and Kappa coefficient under different feature sets. After calculation, all algorithms got the best parameter values in the KECA feature set. Compared with other multi-classifiers, GEELM had obtained the best F1-score of 0.9871 and Kappa coefficient of 0.9775.
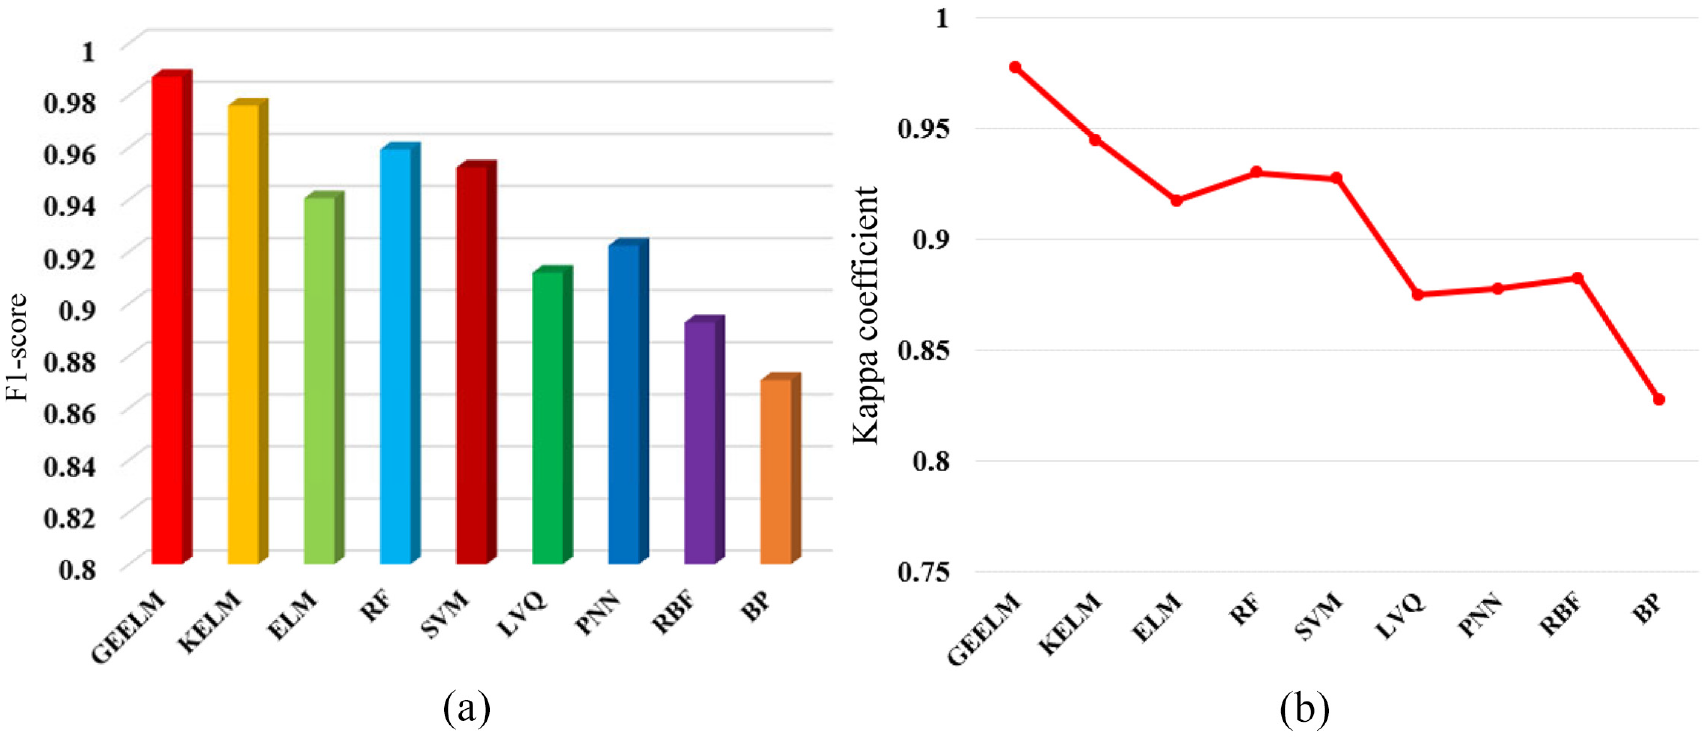
The multi-index performance evaluation results: (a) F1-score and (b) Kappa coefficient.
Conclusion
To identify the gas information of different grades of tea and improve the detection performance of thee-nose. The main contributions and conclusions are as follows:
An improved ELM algorithm (GEELM) is proposed, which improves the ELM optimization problem. It combines the extended coefficient matrix and global identification factor to improve the accuracy and stability of e-nose feature recognition.
In multiple feature sets, the classification performance of multi-pattern recognition algorithm is compared and analyzed. GEELM achieves the highest classification accuracy of 98.20%, the best F1-score of 0.9871, and the best Kappa coefficient of 0.9775.
Based on the visualization results of the box plot, GEELM has the best classification stability.
In conclusion, GEELM provides an effective pattern recognition method to identify the detection information of the e-nose. Moreover, it also provides a method for monitoring the quality of tea grades. In future research, the generalization ability of ELM can be further studied. In the case of noisy input, ELM can also effectively identify key information.
Footnotes
Declaration of conflicting interests
The author(s) declared no potential conflicts of interest with respect to the research, authorship, and/or publication of this article.
Funding
The author(s) disclosed receipt of the following financial support for the research, authorship, and/or publication of this article: This work was supported by the Pre-Research Project of General Armaments Department (41419070201).