
Abstract
An extended measurement model anomaly detection algorithm for atomic clocks is proposed based on the p-step Kalman-like iterative Unbiased finite impulse response (UFIR) algorithm. The novel of the proposed algorithm is that it breaks the disadvantage of initializing the noise matrix in the traditional Kalman filter improved algorithms. By accumulating the prediction residuals generated by the process of p-step Kalman-like iterative, the detection statistics are constructed to realize the weaker phase and frequency jump detection of atomic clocks. Simulation results show the effectiveness of the proposed algorithm, and Monte-Carlo (M-C) experiment is used to verify the theoretical calculation of detection probability. We also analyze the measured data of a cesium atomic clock in our timekeeping laboratory, and the results show that the new method is more sensitive to weak frequency jump than the improved algorithm based on the Kalman filter.
Introduction
Atomic clocks have been widely used in many fields such as wireless communication, satellite navigation, aerospace, astronomical observation, and time-frequency measurement, providing stable and reliable high-precision time-frequency reference, and becoming one of the important devices to ensure the stable operation of the system. Perhaps the most famous application of atomic clocks is satellite navigation. In Global Navigation Satellite Systems (GNSS), such as GPS, GLONASS, BeiDou, or Galileo, atomic clocks are used in both onboard and ground stations, which make it possible for users to obtain accurate location and time information. 1 However, it is subject to various factors, especially in the space station. Abnormalities in atomic clocks will seriously damage the stability and reliability of the system’s output signals, and ultimately the users will suffer. Although the time error up to 10 ns will lead to a positioning error of more than 3 m, so it is very important and worthy of research to quickly and accurately identify atomic clock anomalies.
Anomaly detection of atomic clocks is a continuous research direction for scientists. Riley 2 proposed three simple frequency jump detection techniques, they are BLKAVG, SEQAVG, and CUSUM. Subsequently, the Generalized Likelihood Ratio Test (GLRT) was gradually widely used in the detection of atomic clock frequency anomalies.3–7 However, as a statistical method, it could not accurately obtain the relationship between the degree of anomalies and the parameters to be set. Dynamic Allan Variance (DAVAR) and spectrogram are also used to monitor the stability of atomic clocks. 8 INRIM has developed clock analysis tools for monitoring atomic clocks in space, including the DAVAR and Dynamic Hadamard Deviation (DHDEV). 9 Since Galleani and Tavella proposed using the Kalman filter to detect the abnormal frequency of atomic clocks in 2012, improved algorithms based on the Kalman filter have been continuously proposed to detect abnormal frequency of atomic clocks,10–14 including one-step prediction, N-step prediction, adaptive Kalman filter, etc. Huang et al. 15 proposed an algorithm for GNSS satellite atomic clock integrity monitoring based on the parity transformation.
However, some improved algorithms based on Kalman can detect atomic clock anomalies better, but they rely on the initialization of the noise matrix and error matrix. Once the state noise matrix cannot be initialized accurately, the Kalman algorithm will introduce large errors and even lead to non-convergence of the algorithm, which is unacceptable to engineers.16,17
In this paper, a new detection algorithm is proposed. Its innovation is that it can ignore the initialization of the noise matrix and detect weak atomic clock anomalies. This is a point that all previous algorithms based on the Kalman filter cannot achieve. It does not depend on the initialization of the noise matrix on the premise of high detection probability and real-time detection, which is beneficial to the realization of engineering. The p-step UFIR prediction algorithm has been applied in GPS time synchronization and timekeeping technology as early as 2006, achieving higher accuracy than Kalman prediction.18–20 This is the first time that it has been extended to anomaly detection in atomic clocks. The p-step Kalman-like UFIR detection algorithm can effectively postpone the influence of observed outliers, increase the difference between the predicted value and observed value at an abnormal time, and thus increase the anomaly detection statistics, which is more conducive to detection. Please refer to Appendix B for a detailed description. The detection statistics are constructed by using the residual generated in the process of the Kalman-like iteration. The detection statistics in several epochs are accumulated to increases the non-centrality parameter of the chi-square distribution. The results show that the method can effectively detect the phase or frequency jumps of the atomic clock by analyzing the abnormal data of the simulated cesium atomic clock and measured the cesium atomic clock in our laboratory.
The paper is organized as follows. In Section 2, the extended model of the p-step FIR filter is described in detail. In Section 3, an integrity detecting algorithm based on p-step Kalman-like UFIR is proposed and the option of the horizon is also discussed. In Section 4, the theoretical simulation results under different phase and frequency jumps of a cesium atomic clock are given and verified by the M-C test. In Section 5, we apply the new method and the improved detection algorithm based on the Kalman filter to the analysis of the measured cesium atomic clock anomaly data. The conclusion is in Section 6.
The extended model of the p-step FIR filter
The clock time-invariant state and observation equations can be respectively expressed as:


where
The p-step FIR prediction algorithm estimates the clock state at n + p (p > 0) with N measurements on a horizon from m = n − N + 1 to n, as shown in Figure 1.
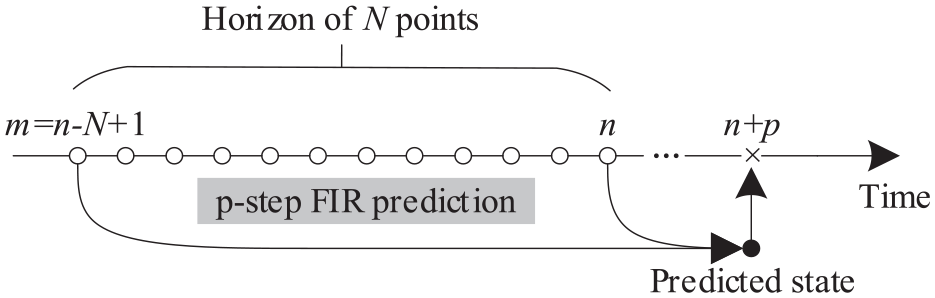
Clock prediction problem solved with p-step FIR structure.
Therefore, (1) and (2) need to be extended on [m, n]. That can be done if to use the recursively computed solutions and write


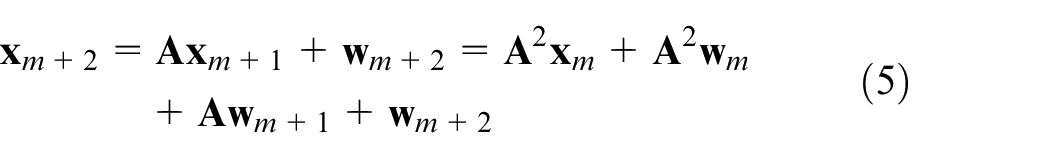
At the initial horizon point, equation (3) implies that the initial state must be known in advance or estimated optimally. 22 Equation (7) can be obtained through the recursively computed solutions from equations (3) to (6).

where the extended vectors are
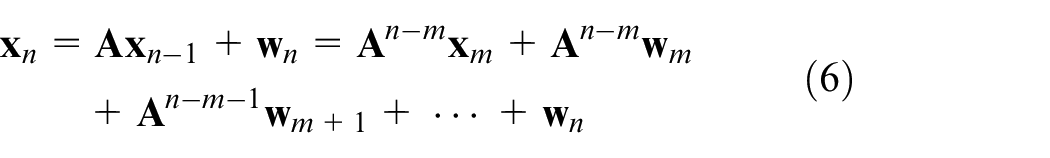
Similarly, extend the observation equation (2) and write

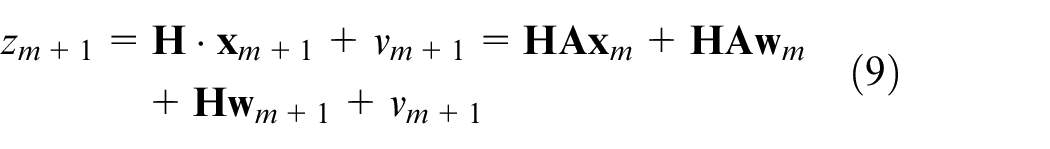
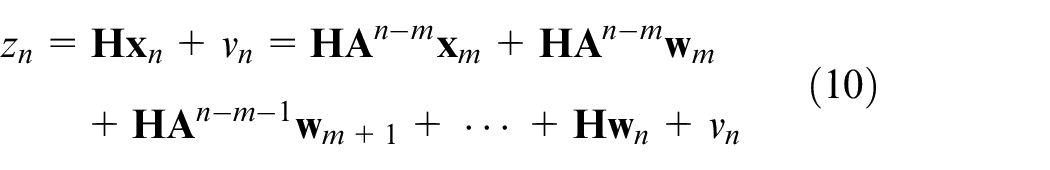
Therefore, the extended observation vector

where the extended vectors are
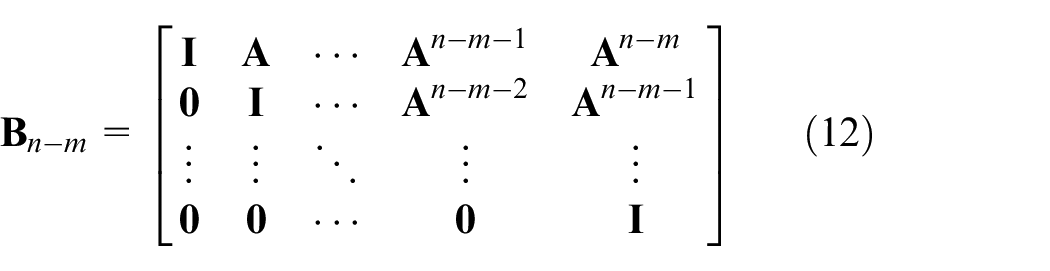
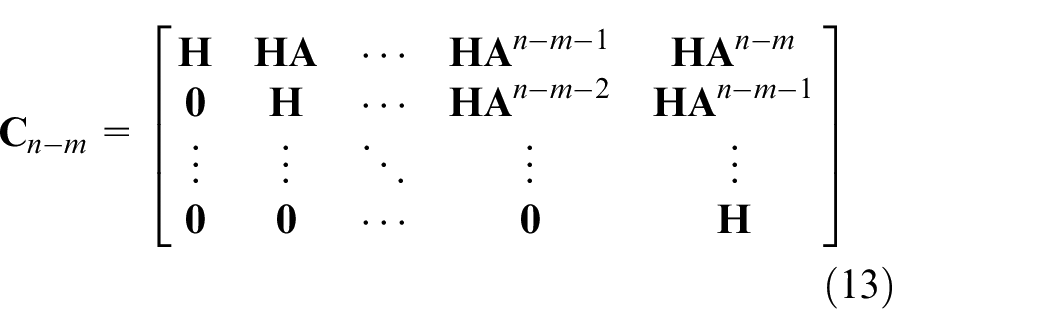
where
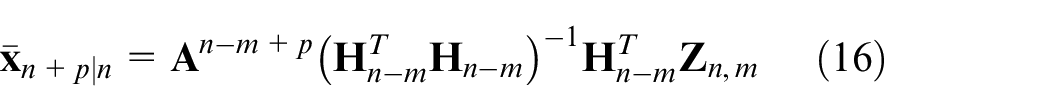
Assuming that the p-step prediction is
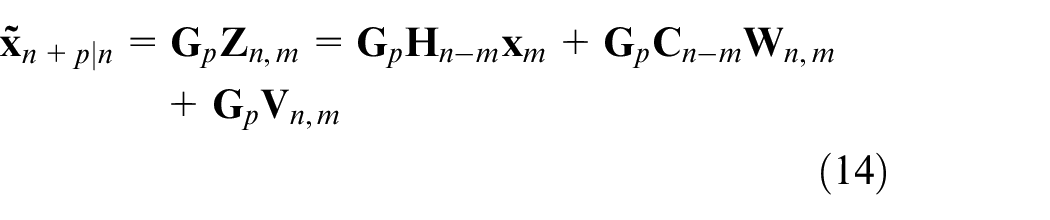
where
UFIR filter means to ensure the unbiased estimation, as shown in equation (15), but cannot guarantee the minimum mean square error (MSE).23,24

It has been shown in Ibarra-Manzano 16 that the unbiasedness constraint for linear FIR filters is equal to the deadbeat constraint associated with noiseless both system and measurement.
The estimated value of p-step UFIR can be expressed as follow:
The specific derivation process can be referred to the references.25,26
The integrity detecting algorithm
Although Section 2 presents a batch form of p-step UFIR estimators based on convolution rules, when N is large, all matrix and vector dimensions are large, which will cause computational problems. For fast computation, the unbiased estimator for batch processing can be expressed in the form of a Kalman-like recursion. 27
P-step Kalman-like UFIR algorithm
The principle of p-step Kalman-like UFIR iterative is shown in Figure 2. One can observe that the iterative computation starts at m + v with v = K and finishes at v = N − 1. The true estimate is taken at each v = N − 1 and the procedure is repeated recursively.
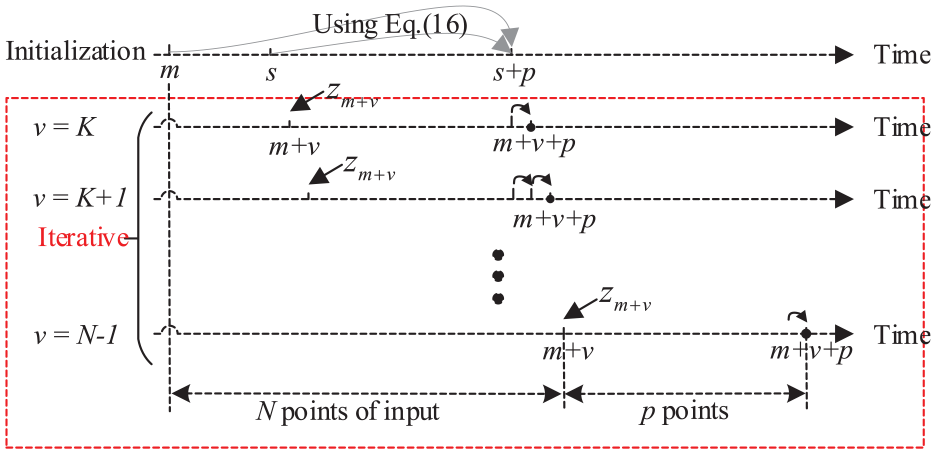
Operational principles of the p-step Kalman-like UFIR.
The predicted vector of the atomic clock state
The detailed algorithm process is described as follows16,27 :
Number of atomic clock states K = 3, The horizon N as input. The algorithm starts at n = N.
Set the intermediate variables


Set auxiliary matrices

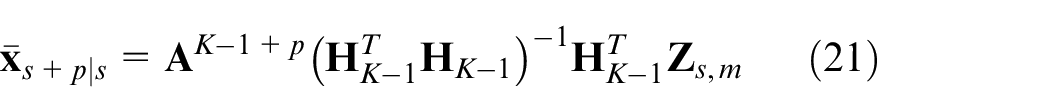
According to the observations in the range of [m,s], the predicted vector
The iterative starts with v = K and ends with v = N − 1.
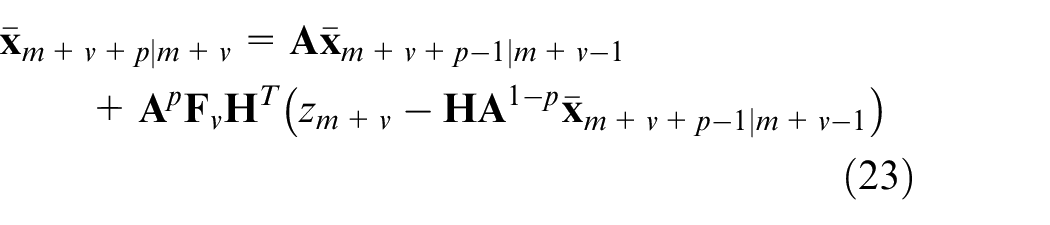
Note that (23) is the Kalman-like estimate with the bias correction gain
The p-step UFIR estimation error can be evaluated using the following expression
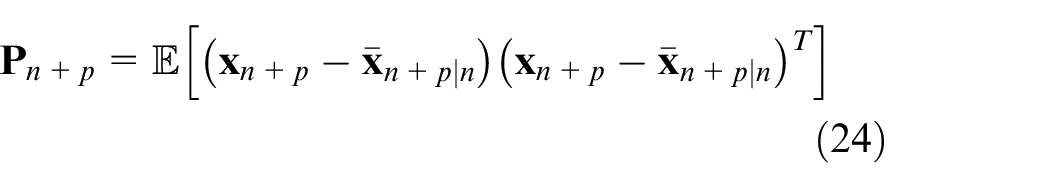
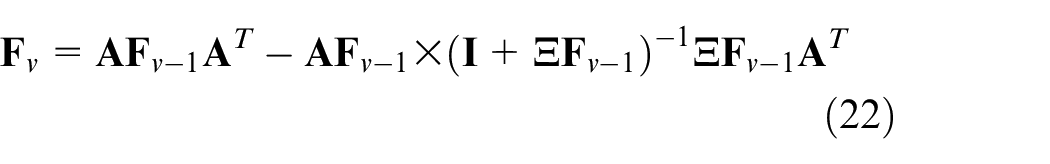
According to equations (6) and (24), the error matrix of the p-step Kalman-like UFIR algorithm can be deduced as follows:
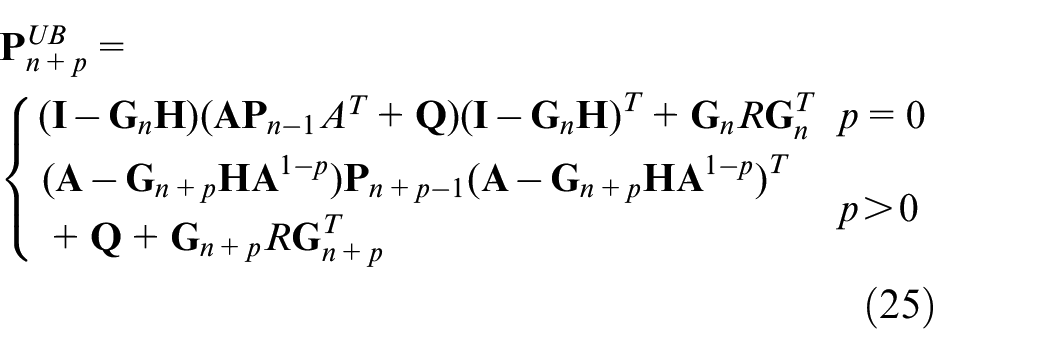
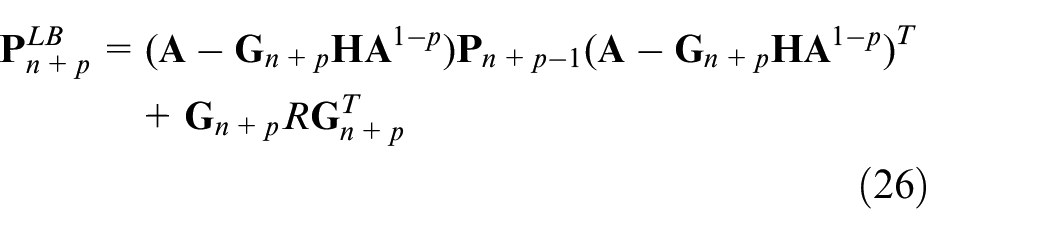
So far, we also get the Kalman-like iteration form of the error matrix, including upper bound and lower bound.
The problem with (25) arises instantly when the noise behavior is unknown as it usually is. We explore an effective method for detecting anomalies of atomic clocks when the system noise matrix is unknown. We use the lower bound of the error matrix as the error matrix in the whole detection algorithm to further realize the anomaly detection of the atomic clock.
Innovative construction of p-step UFIR abnormal detection statistics
The predicted residual is expressed as:

When there is no anomaly, the residual nearly follows a Gaussian distribution with a mean of zero, which satisfies:

where
When the anomaly occurs, the mean of the residual will not be equal to zero, which satisfies:

where
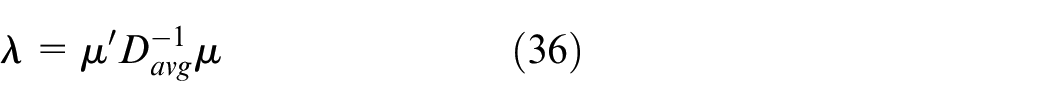
For the iterative process, we can construct:


where
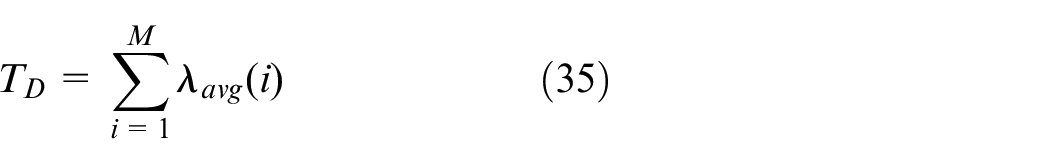
According to the residuals generated by the iterative process, detection statistics are adopted:
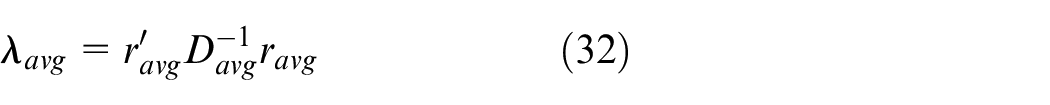
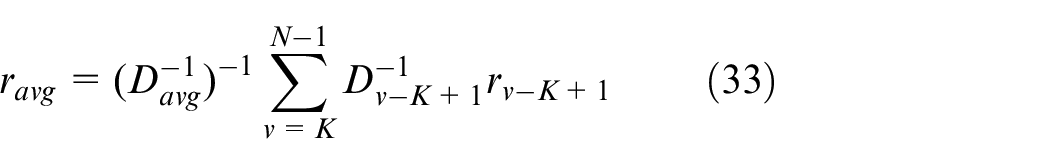
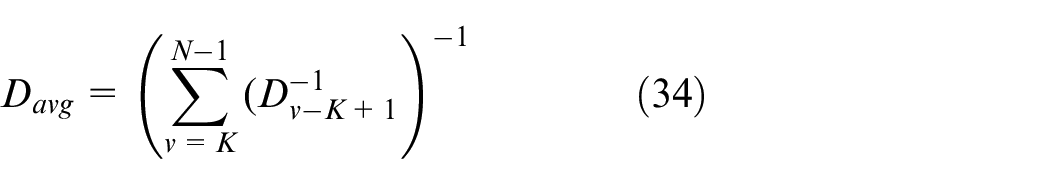
To better detect weak phase or frequency jump, the new detection statistics can be accumulated by M epochs from the value obtained in equation (32):
where
When the observed value is not abnormal, the new statistic
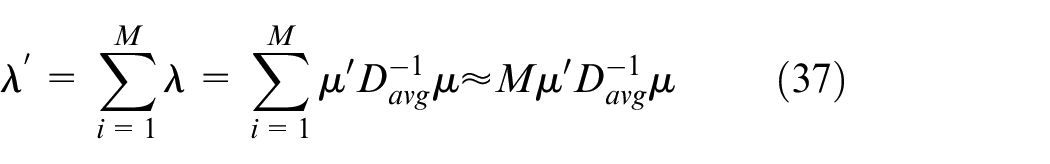
where M stands for accumulated epochs,
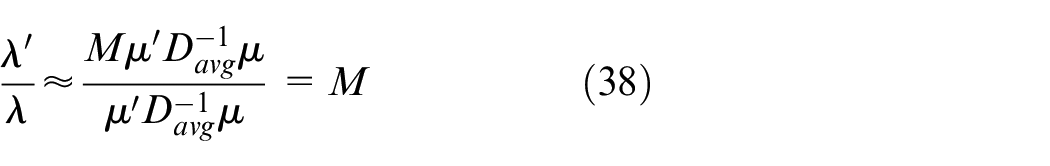
It can be seen from equation (38) that the new detection statistics accumulated by M epochs are about M times larger than that in equation (36). Therefore, compared with the previous detection statistics, the new detection statistics can increase the statistical value of abnormal places and keep the statistic value of no abnormal places, which is beneficial for anomaly detection.
The judgment criterion based on the p-step Kalman-like UFIR algorithm is:


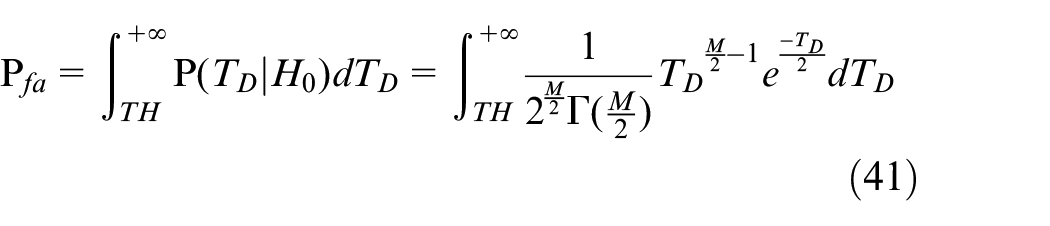
The detection threshold TH can be calculated by the given probability of false alarm. 28
Then, the probability of detection is:
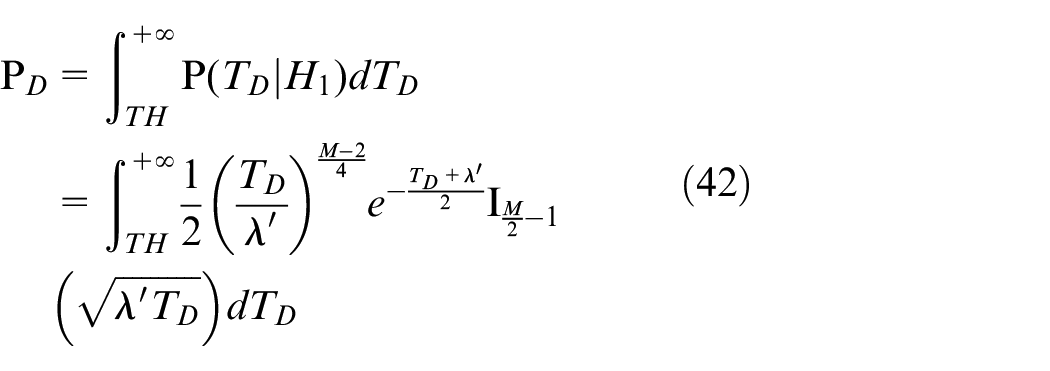
where
The horizon
The error matrix of the p-step Kalman-like UFIR algorithm is related to the length of the horizon N and the number of prediction steps p. Shmaliy and Ibarra-Manzano 29 mentioned that if N is fixed, the prediction error increases with the increase of p. If p is fixed, the prediction error decreases as N increases.
Given
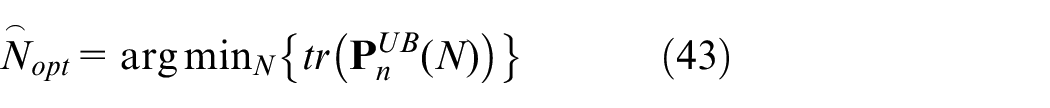
Note that equation (43) is applicable if
The horizon N obtained by this method may not guarantee the minimum estimation error, but for the UFIR algorithm, it is low sensitive to the value of horizon. 31
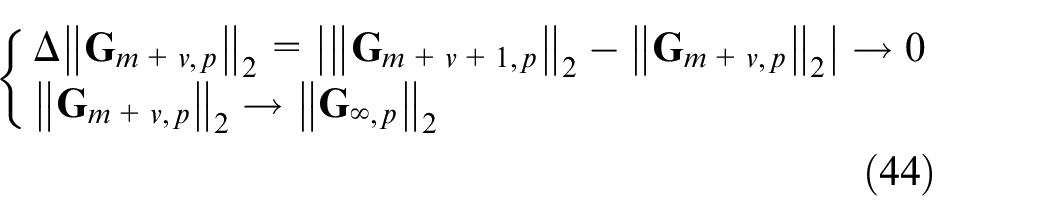
The horizon N is solved for the phase and frequency anomalies, respectively. By comparing the situation that the increment of the bias correction gain changes with the increase of the number of iterations N under different predicted steps, as shown in Figure 3.
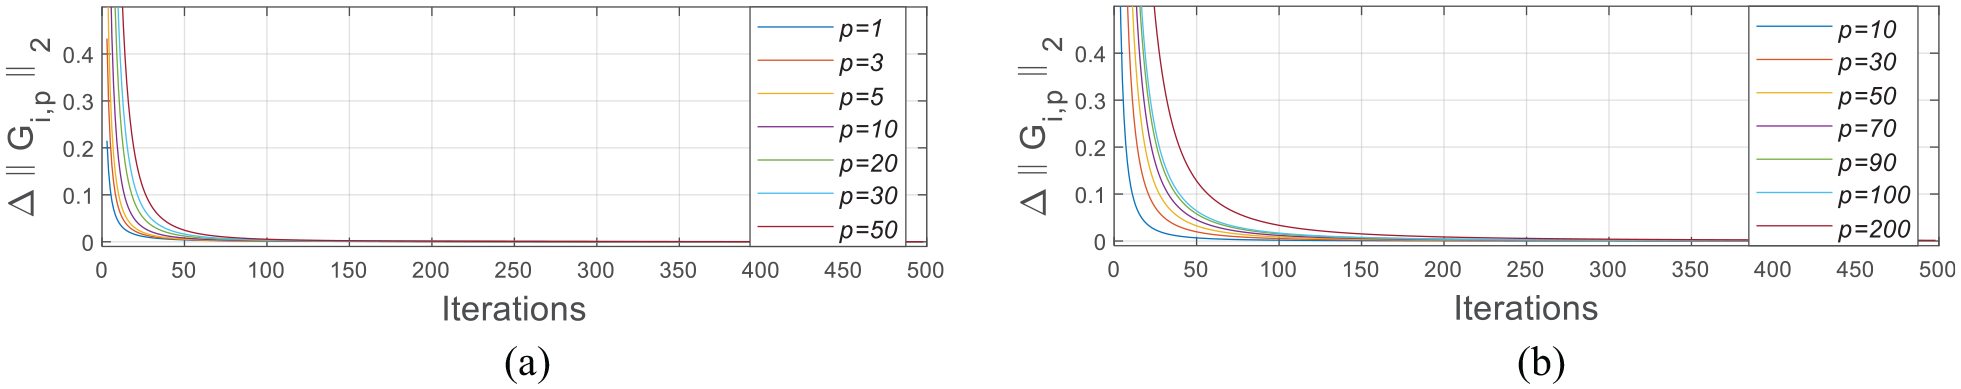
The incremental gain Δ||Gi,p||2 given by (44) as functions of the number of iterations for the phase and frequency detection: (a) phase jump and (b) frequency jump.
As the phase fluctuates greatly in a short time, the predicted step number p should not be too large, as shown in Figure 3(a). Therefore, for phase jump detection, the horizon N = 50.
However, for frequency detection, if the number of predicted steps is too small, the anomaly cannot be distinguished. Therefore, the number of predicted steps should be larger, as shown in Figure 3(b). Therefore, for frequency detection, the horizon N = 100.
In Appendix A, we will explain that there is little difference between the horizon N obtained by satisfying equation (44) and the optimal horizon Nopt for UFIR Kalman-like atomic clock anomaly detection algorithms.
Numerical simulation
To evaluate the performance of the p-step Kalman-like UFIR algorithm in detecting small phase jump and frequency jump, the following numerical simulations are performed. According to the simulation generation method of atomic clock difference provided in the references,32,33 we simulated a cesium atomic clock of 5071A with a clock difference of 10,000 s. The sampling time is 1 s.
Phase jump
Phase jump is one of the typical phase anomalies of atomic clocks. It shows that the mean value of the phase increases or decreases suddenly at a certain moment and lasts for a while. Therefore, it can be modeled as:
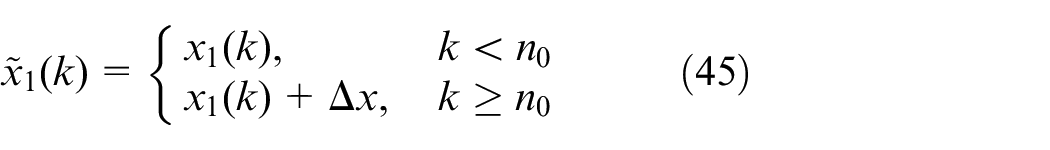
where
Figure 4 shows the phase jump of size
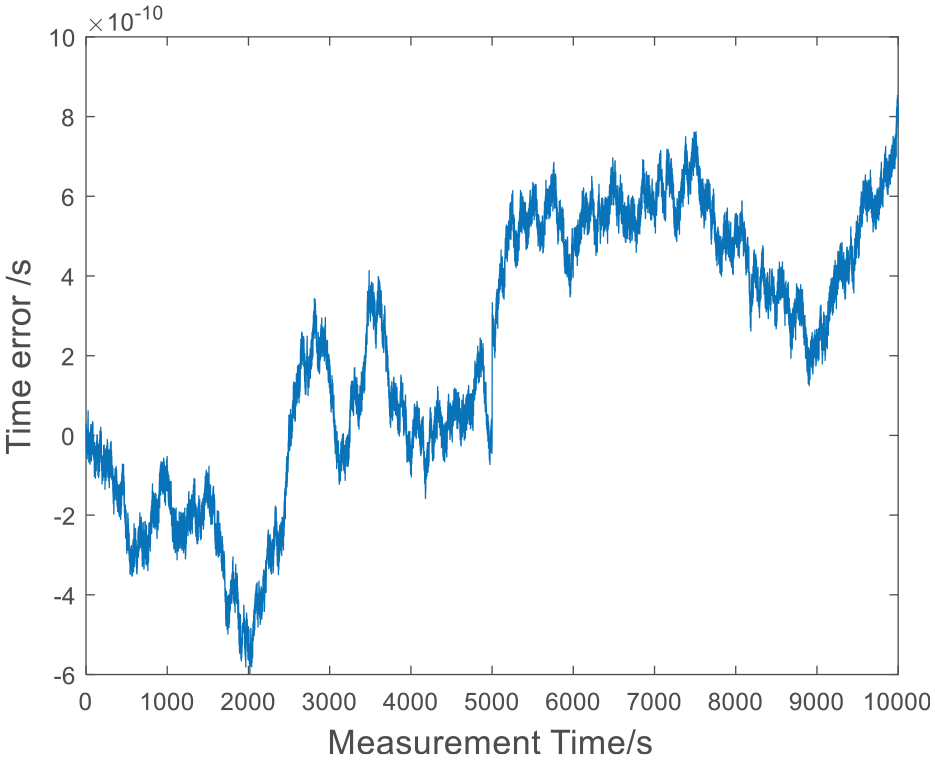
Time error of a time-invariant clock.
Parameter analysis
From equations (32)–(35) and (42), it can be seen that the detection probability is related to the predicted steps and the accumulation numbers. Therefore, given that the probability of false alarm is 10−5 and the accumulated number M = 1, the relationship between the probability of detection (PD) and the predicted steps is shown in Figure 5. The relationship between the time of detection and the predicted steps is shown in Figure 6. The time of abnormal occurrence is 5000 s, and the detection time represents the time when abnormal detection can be carried out normally. For example, if the detection time is 27 s, it means that an abnormity is detected in 5027 s and a warning is given.
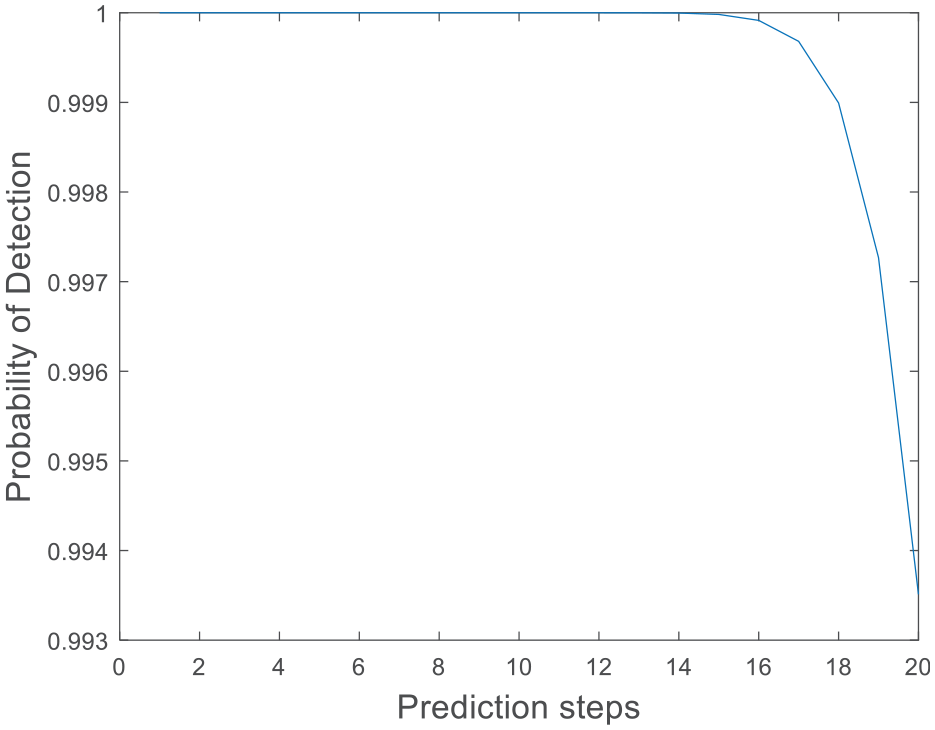
The relationship between detection probability and the number of prediction steps when M = 1.
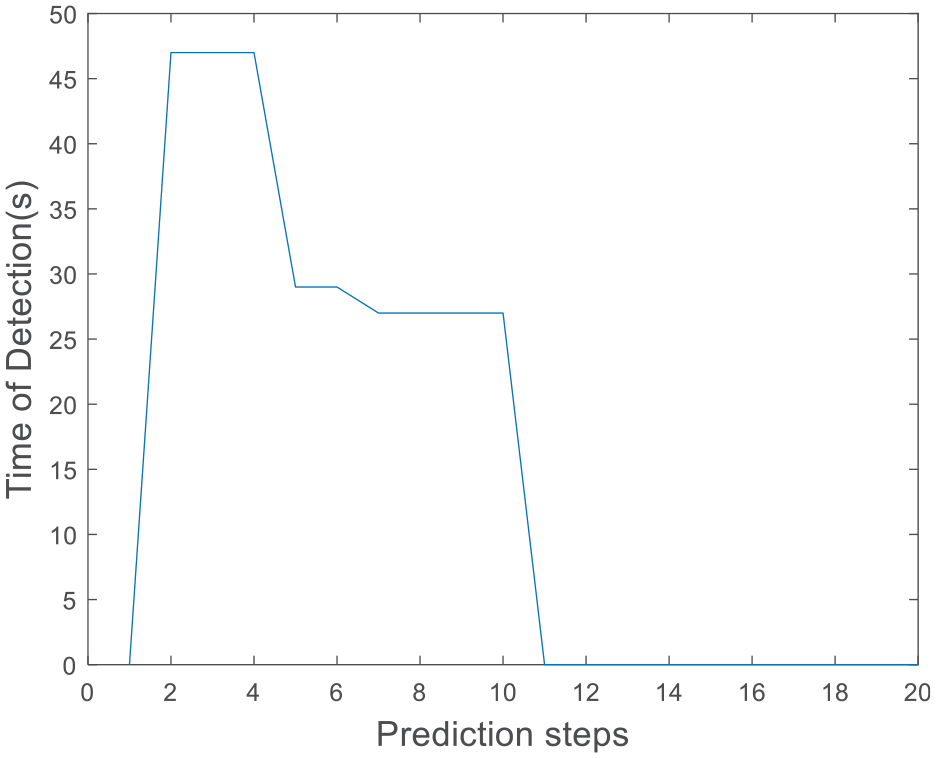
The relationship between detection time and the number of prediction steps when M = 1.
In Figure 5, the detection probability decreases gradually with the increase of the number of predicted steps, indicating that for phase detection, the number of predicted step p should not be too large.
In Figure 6, due to the small number of predicted steps, the anomaly detection statistic fails to reach the detection threshold, and the detection time is 0, indicating that no anomaly is detected. When the number of prediction steps is too large, the overall prediction residual becomes larger, and the abnormal detection statistic is submerged in the non-abnormal detection statistics, which also leads to the detection failure, and the detection time is 0.
Combined with Figures 5 and 6, it can be concluded that under the current conditions, it is appropriate to take the prediction step p = 10. At the same time, it can be seen that when p = 10, the detection probability is close to 1, and there is no need to accumulate epochs. At this time, M = 1 and the detection time is 27 s.
Detection performance
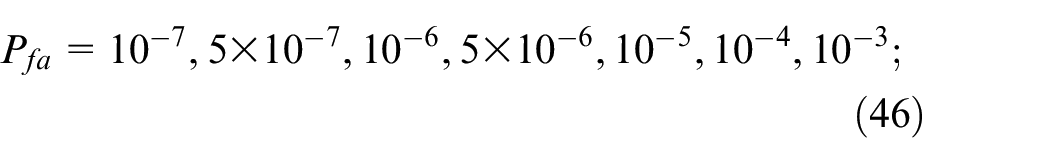
To make the theoretical simulation detection results more convincing, we adopted the M-C test to verify the theoretical detection performance. According to 3.3 and 4.1.1, the horizon is 50, the number of predicted steps is 10, and the number of the accumulated epoch is 1. For a set of different phase jumps, as shown in equation (47), the theoretical detection probabilities under a given set of different P fa , as shown in equation (46), are analyzed. Meanwhile, the statistical results of 100 M-C tests are also shown in Figure 7.

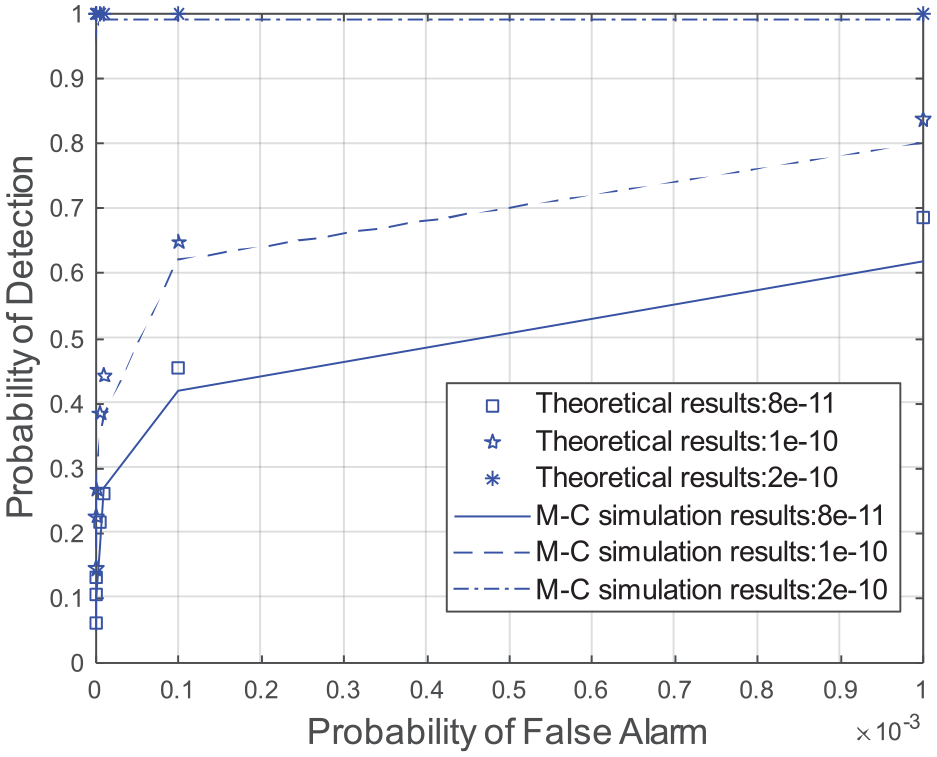
Detection probabilities with given different phase jumps in equation (47).
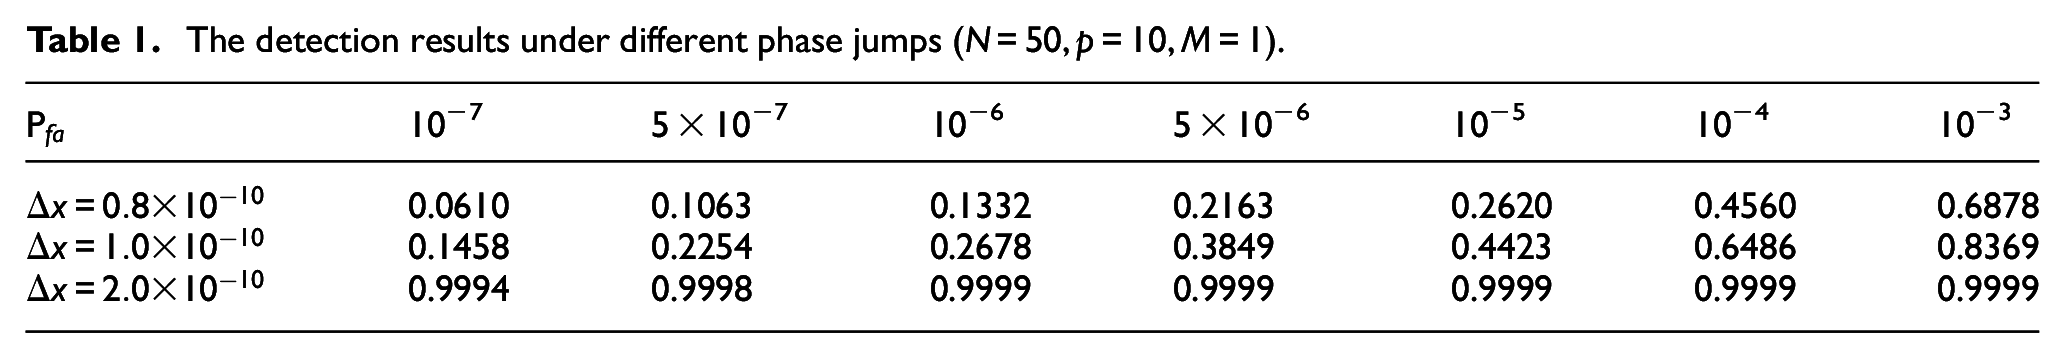
It can be seen from Figure 7 that for a given set of phase jumps, the detection probability increases with the increase of the probability of false alarm. As the size of the phase jump increases, the detection probability also increases, which is consistent with the expected results. At the same time, it can be seen that the statistical results of the M-C test are in good agreement with the theoretical calculation results, which proves the correctness of the theoretical simulation results. Detailed statistical results are presented in Table 1.
The detection results under different phase jumps (
Frequency jump
The frequency jump is one of the typical frequency anomalies of atomic clocks. It shows that the mean value of the normalized frequency deviation increases or decreases suddenly at a certain moment and lasts for a while. It can be modeled as:
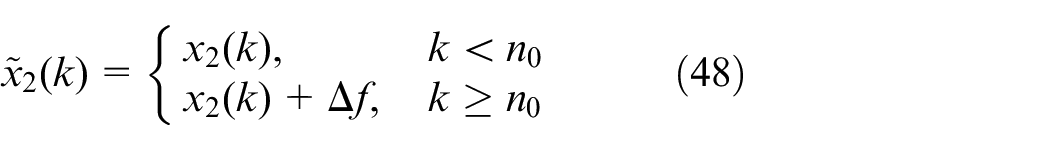
where
Figure 8 shows the normalized frequency deviation jump of size
The normalized frequency deviation of a time-invariant clock.
Parameter analysis
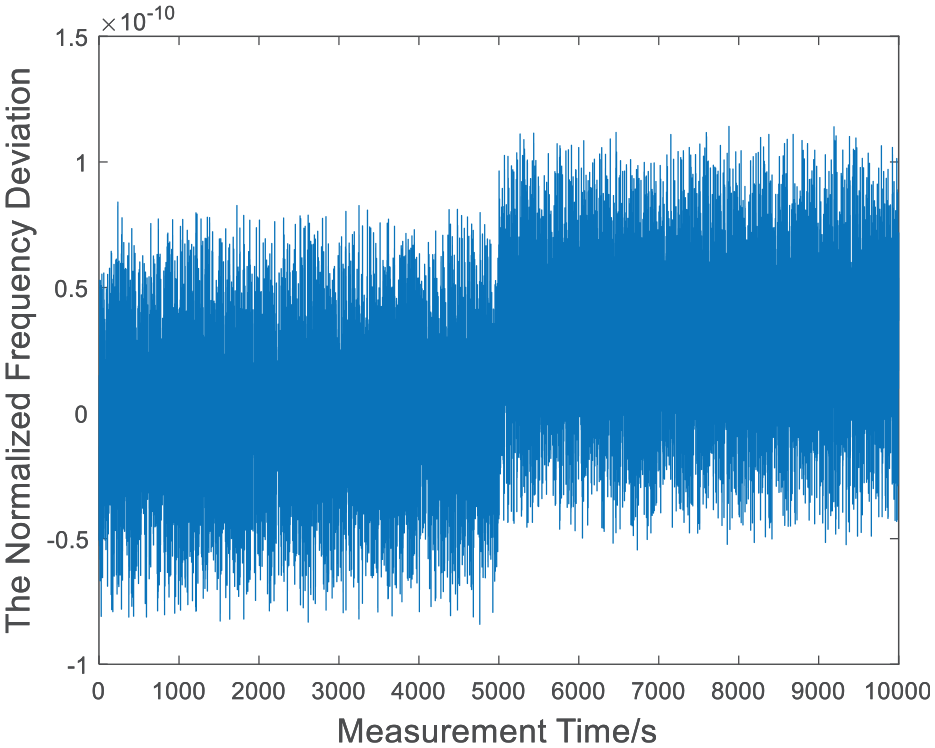
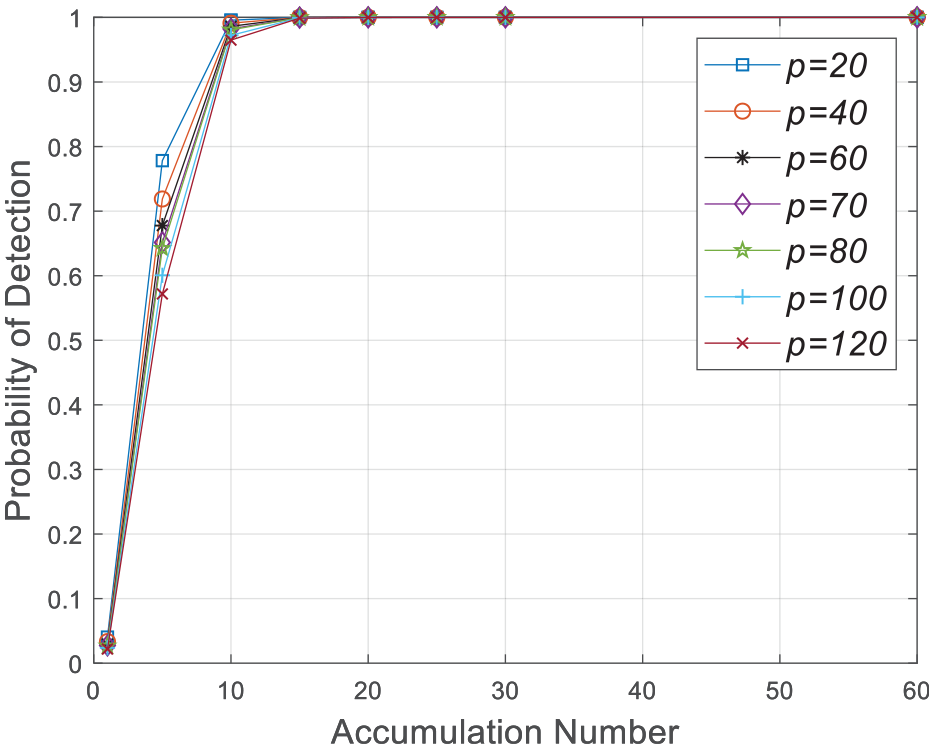
Similar to phase jump, given that the probability of false alarm is 10-5 and the relationship between detection probability and the number of accumulation under different prediction steps is shown in Figure 9. The relationship between detection time and the number of accumulation under different prediction steps is shown in Figure 10.
The relationship between detection probability and the number of accumulation under different prediction steps.
The relationship between detection time and the number of accumulation under different prediction steps.
As can be seen from Figure 9, under the same accumulation number, the larger the predicted step size is, the lower the detection probability is. Because the larger the number of predicted steps, the greater the estimation error. Under the same number of predicted steps, the detection probability increases with the increase of accumulation number. If the multi-epoch accumulation is not carried out like the phase detection, the detection probability is very low and no anomaly can be detected.
In Figure 10, if the number of predicted steps is too small, the abnormal detection statistic is too small to reach the detection threshold, and it is impossible to detect the anomaly by accumulating the epoch, just as p = 20 and the detection time is 0, which means that the detection failed. Therefore, for frequency anomaly detection, the number of predicted steps should be slightly larger. To make the detection time as small as possible and maintain a high detection probability, the predicted step is set as 70, the accumulated number is set as 25, and the detection time is 50 s at this time.
Detection performance
The simulation process is similar to the phase jump. For a set of different frequency jumps, as shown in equation (49), the theoretical detection probabilities under a given set of different P fa , as shown in equation (46), are analyzed. Meanwhile, the statistical results of 100 M-C tests are also shown in Figure 11.

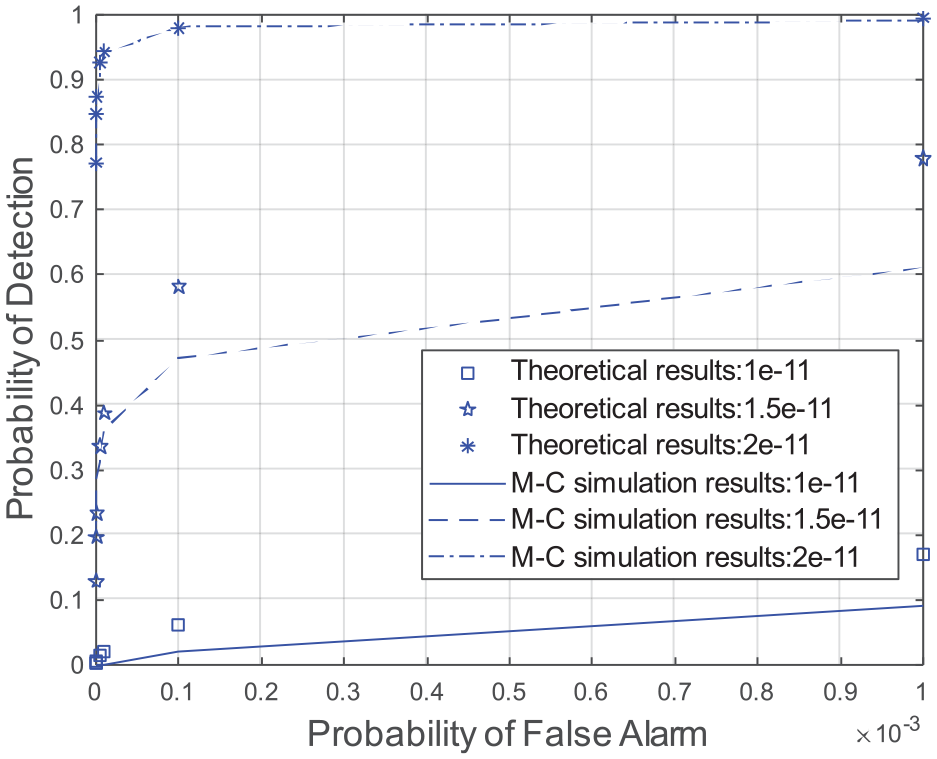
Detection probabilities with given different frequency jumps in equation (49).
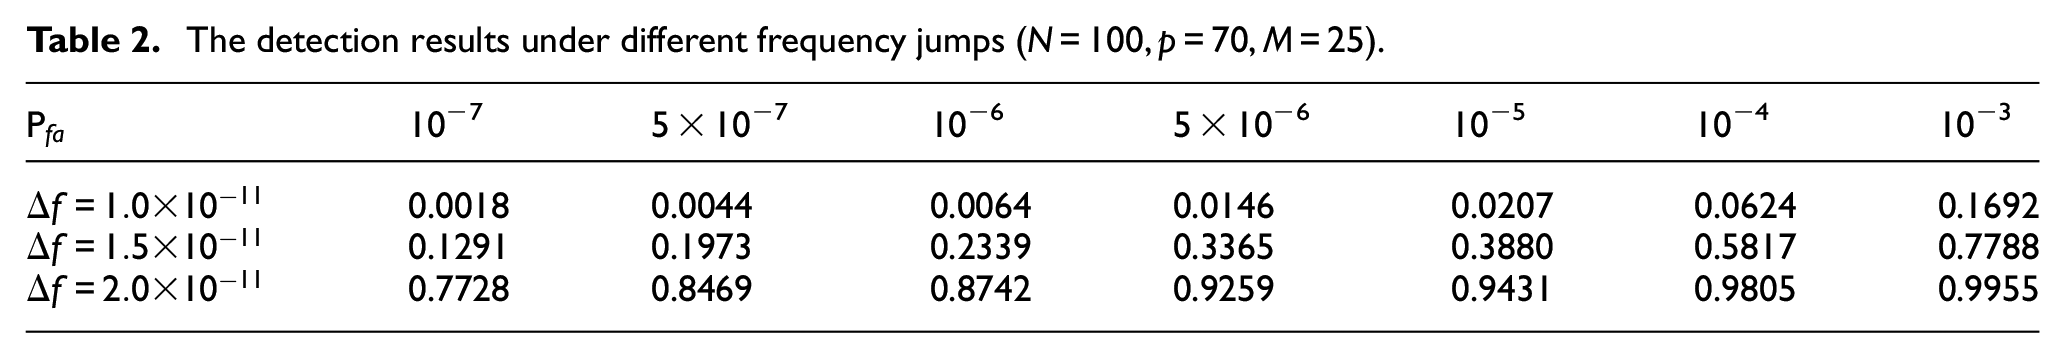
It can be seen that the detection probability calculated by the theoretical formula is close to the statistical probability of 100 M-C experiments, with the same trend, which once again proves the correctness of the detection probability formula calculated by the theoretical formula. Detailed statistical results are presented in Table 2.
The detection results under different frequency jumps (
Real data analysis
To verify the usability of the new method, we set up an experimental platform, and the experimental principle block diagram and part of the tested scenes are shown in Figure 12. The measured data of a cesium atomic clock of 5071A are obtained.
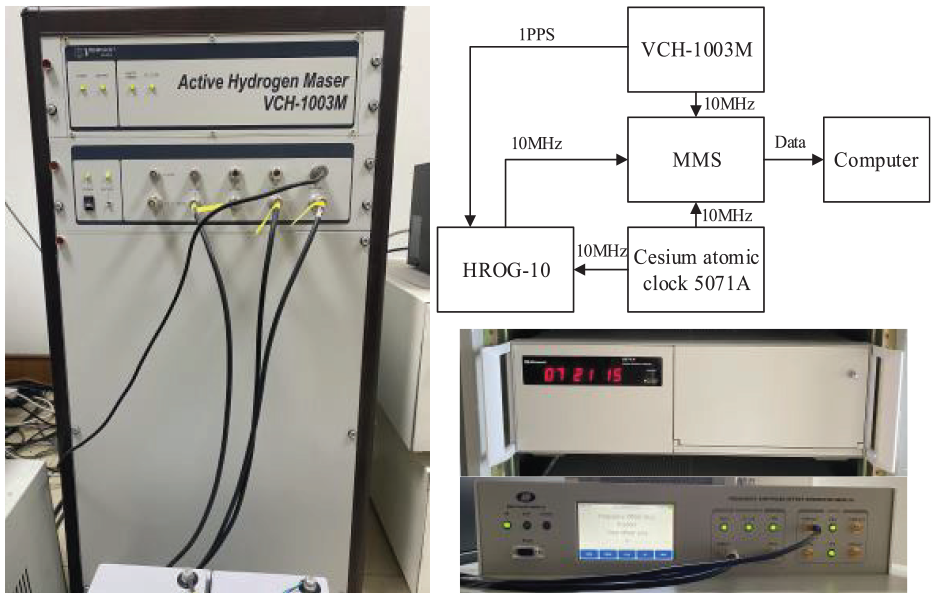
Experimental principle block diagram and part of the tested scenes.
The whole experimental platform is set up in a time-keeping laboratory, and a cesium atomic clock of 5071A is used as the atomic clock to be measured. One of its outputs 10 MHz signal as input to a High-Resolution Phase and Frequency Offset Generator(HROG-10), as a branch to be tested. The other output signal is direct as the input of the Multi-channel Measurement System (MMS). According to the user manual of MMS, its Allan deviation is less than 2.5e−13 at 1 s. Therefore, it is feasible to use it as an accurate measuring device. VCH-1003M is the main clock of the whole timekeeping system. Its 10 MHz output signal serves as the reference signal of MMS, and the 1PPS signal serves as the initial phase synchronization signal of MMS. The Allan deviation analysis of the reference clock and the atomic clock to be measured is given in Figure 13.
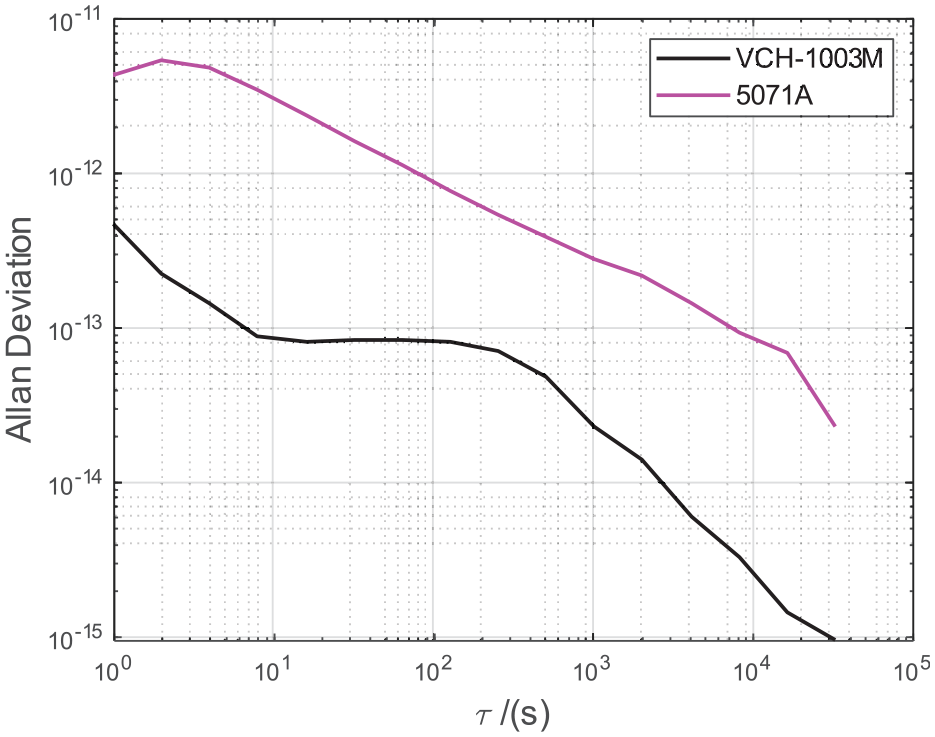
The Allan deviation of the reference and the atomic clock to be measured.
The HROG-10 is a device that can be manually set with different phase or frequency jumps, and the whole experiment is to configure different phase or frequency jumps through it.
Data were collected on December 9, 2020, and different frequency jumps
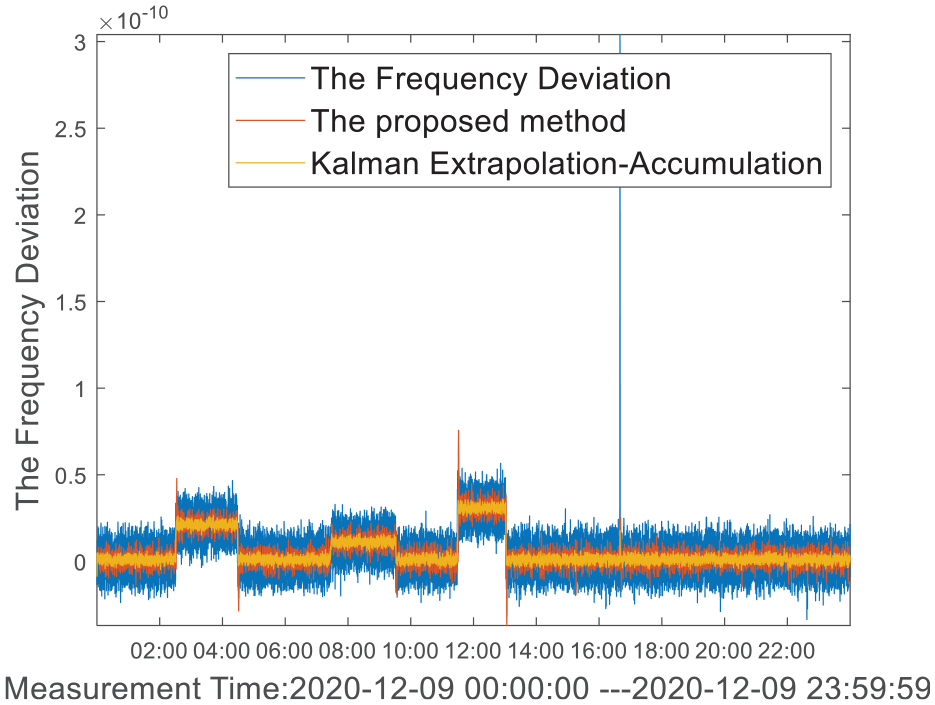
Real data of the normalized frequency deviation with phase and frequency anomalies.
In Figure 14, the blue line describes the abnormal normalized frequency deviation data collected after HROG-10, the red line represents the estimated value of UFIR, and the yellow line is the estimated value using the Kalman extrapolation-accumulation method. 34 As can be seen from the figure, at the time of frequency jump, the estimation error of UFIR is greater than that of Kalman, which is conducive to the construction of anomaly detection statistics. Figure 15 shows the root mean square error (RMSE) of the two methods. The statistical RMSE of the new method is 8.169e−12, and the statistical RMSE of the Kalman method is 6.487e−12. It can be seen that the consistency of the two methods is very good, and the new method is slightly inferior to the Kalman method. Because Kalman algorithm guarantees the minimum root mean square error, but UFIR cannot.
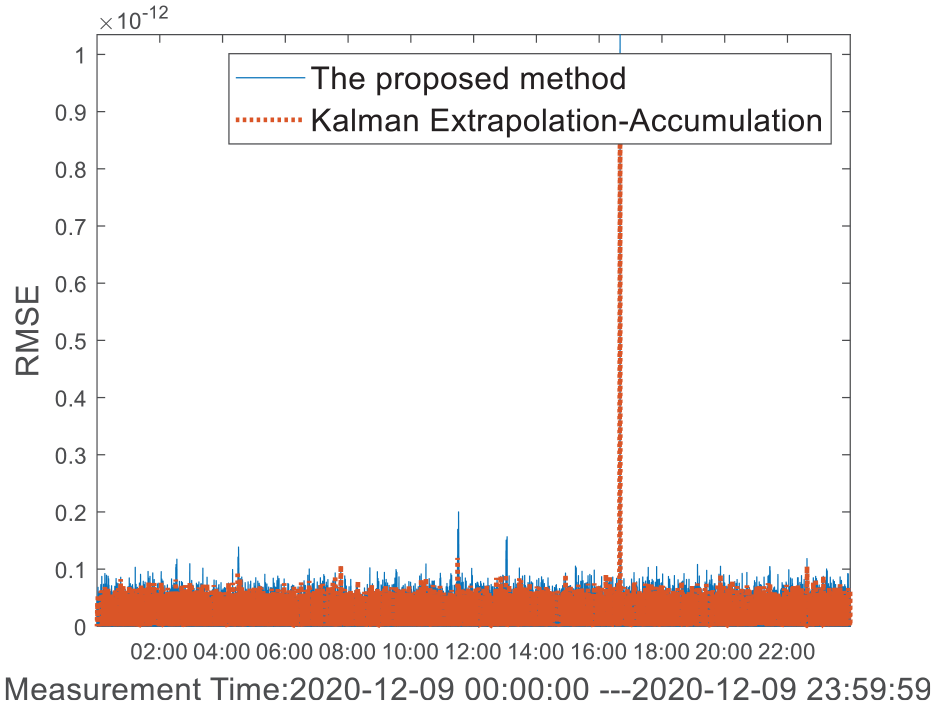
Consistency of the proposed method and Kalman method estimates of real data.
The performance of the new method and the Kalman filter method proposed in Yan et al. 34 are both used for the analysis of measured data.
In Figure 16, the blue line represents the detection statistics calculated by equation (35) of the new method, while the red line represents the detection statistics calculated by the improved the Kalman filter method. For comparison, the measured normalized frequency deviation of the atomic clock multiplied by 5 × 10⁻¹¹ is superimposed on the detection statistics, as described in the purple line.
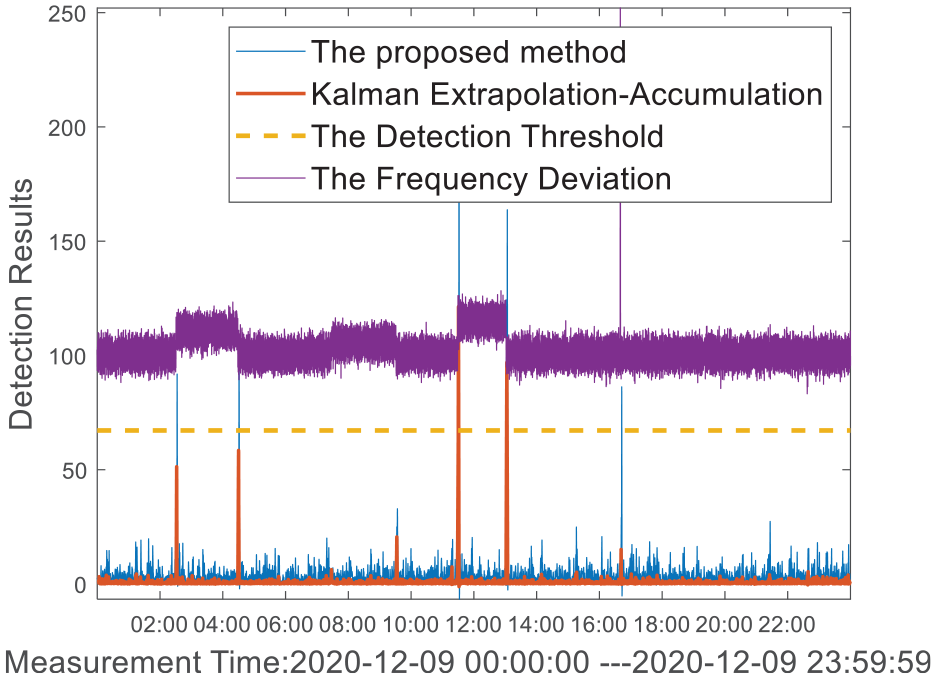
Detection results of real data by the proposed method and Kalman.
The yellow dotted line corresponds to the detection threshold. According to equation (41), the detection threshold is related to P fa and accumulation number M, while the detection threshold of measured data is calculated at Pfa = 10−5 and M = 25.
To compare the effectiveness of the detection, the detection statistics of the normal data without anomalies are plotted in Figure 17. It can be seen that:
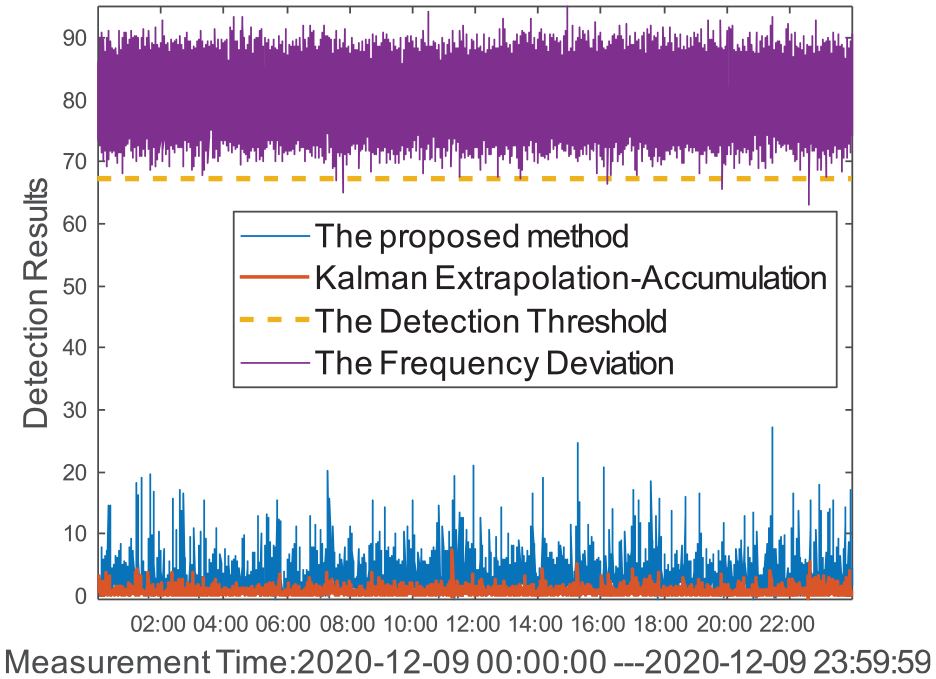
Detection results of normal real data by the proposed method and Kalman filter.
The value of detection statistics increases when the frequency jumps or the phase jumps and exceeds the detection threshold. The results show that the new method can be used for atomic clock anomaly detection.
Both the new method and the improved the Kalman filter method are effective in detecting phase or frequency jumps, but the new method is more sensitive to weak jumps, which is represented by larger detection statistics.
The proposed method can detect both weak frequency and phase jump simultaneously, while the Kalman filter method cannot.
The detection statistics of the new method are larger than that of the Kalman filter method at every time, but the normal time is not greater than the detection threshold, and the abnormal time is far more than the detection threshold. This is beneficial for anomaly detection.
Conclusions
This paper presents a new anomaly detection algorithm for the atomic clock. P-step Kalman-like UFIR algorithm breaks through the shortcomings of the Kalman filter method which relies on accurate initialization of state noise matrix and error matrix. This advantage is very useful for real-world applications. Although it does not guarantee the minimum estimation error as Kalman does, it is very practical. Through the analysis of the simulation data and the measured data, it is proved that the new method can detect the anomaly of the atomic clock accurately and timely.
The correctness of the proposed method is also verified by the M-C simulation experiment.
Footnotes
Appendix A
Appendix B
Declaration of conflicting interests
The author(s) declared no potential conflicts of interest with respect to the research, authorship, and/or publication of this article.
Funding
The author(s) received no financial support for the research, authorship, and/or publication of this article.