
Abstract
A new method based on the innovation of Kalman filter and extrapolation-accumulation is proposed to detect weak frequency anomalies in atomic clocks with short detection time and high detection probability. In this method, the detection statistics of the innovation extrapolation method in several epochs are accumulated. It avoids the influence of outliers, increases the noncentrality parameter of chi-square distribution, and realizes more effective detection of weak frequency anomalies. The simulation results show that compared with the innovation method and the innovation extrapolation method, the new method has a higher detection probability for micro frequency anomalies, and the detection time is shortened. The new method is used to analyze the real data of the cesium atomic clock, and the results are consistent with the simulation results.
Introduction
Atomic clocks are an important part of the Global Navigation Satellite System (GNSS). They are used to generate standard time and frequency signals in both ground stations and satellites so that users can obtain accurate position and time information. It can be found that different numbers of hydrogen, cesium and rubidium atomic clocks have been equipped on the ground stations and satellites of GPS, GLONASS, Beidou, and Galileo.1–4 Even though atomic clocks are ultra-stable oscillators, they are subject to temperature, magnetic fields, radiation and aging, which can cause frequency anomalies. The frequency anomalies of atomic clocks mainly include frequency jump and frequency drift jump. If these anomalies are not detected correctly and timely, it will result in thousands of meters of range error. 5 In Figure 1, the stability of a cesium atomic clock is simulated when it is subjected to a small frequency jump and a frequency drift jump. Stability is deteriorating, and that is not acceptable. Therefore, atomic clock frequency anomaly detection is a key technique in GNSS and time-keeping.
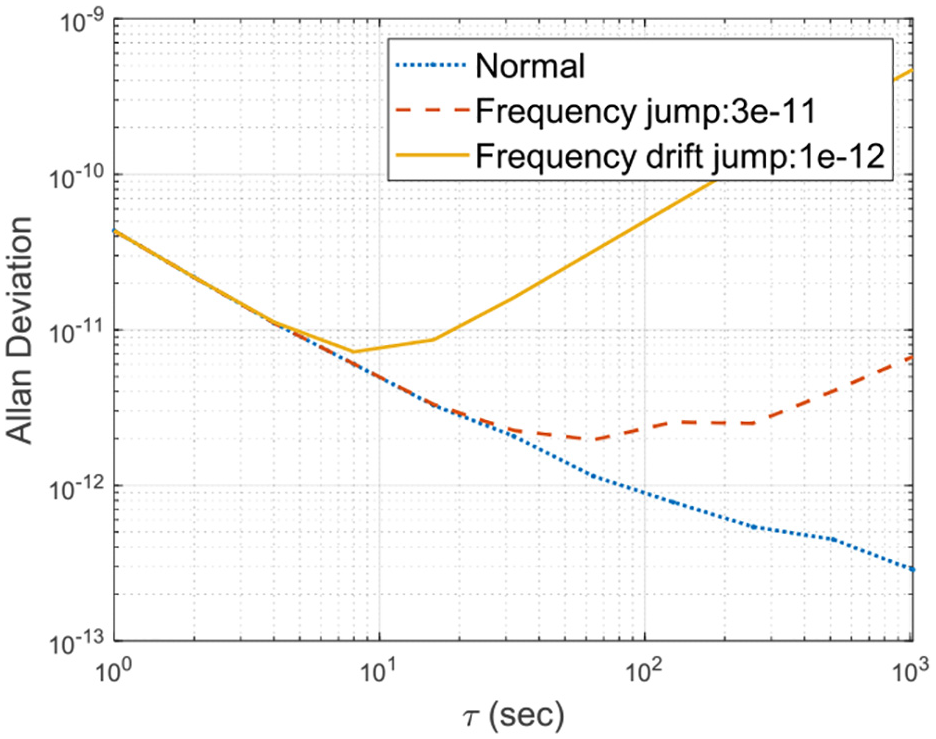
The influence of weak frequency anomalies on the stability of a cesium atomic clock.
In the past few years, some effective methods for detecting frequency anomalies have been proposed. In 2008, Riley 6 proposed some simple frequency anomaly detection methods of BLKAVG, SEQAVG, and CUSUM. Nunzi and Carbone, 7 Galleani, 8 and Galleani and Tavella 9 worked to detect the frequency anomalies with generalized likelihood ratio test (GLRT) and dynamic Allan variance (DAVAR), which could not only detect the anomalies but also determine the types of anomalies. In recent years, Galleani and Tavella 10 and Song et al. 11 proposed innovation based on Kalman, an adaptive Kalman algorithm to detect the anomaly of atomic clock frequency, and both of them achieved good detection results. Since 2014, Huang et al.12–14 have been committed to the detection technology of weak frequency anomalies of atomic clocks and proposed Kalman N-step prediction, parity transformation, and other methods, achieving more significant detection results. However, the detection time is also very important, and none of these papers mentioned the detection time of their algorithms. Higher detection probability and shorter detection time are our goals. We not only analyzed the detection probability but also analyzed the detection time for the first time.
The innovation method based on the Kalman filter has a weak ability to detect small frequency jump and frequency drift jump. When constructing detection statistics, the abnormal frequency value will “pollute” the state estimation of the filter. To improve the detection probability and shorten the detection time, a novel innovation extrapolation-accumulation method based on the Kalman filter is proposed to detect the small frequency jump and frequency drift jump of atomic clocks. In this method, the detection statistics of the innovation extrapolation method in several epochs are accumulated. It avoids the influence of outliers, increases the noncentrality parameter of chi-square distribution, and realizes more effective detection of weak frequency anomalies. The correctness, superiority, and timeliness of the method are verified by simulating the frequency anomaly data of a cesium atomic clock and the measured frequency anomaly data of a cesium atomic clock in our laboratory.
It is worth mentioning that the proposed method is more sensitive to weak frequency jump than other methods under the same conditions. This is good news for some laboratories where atomic clocks work with precision and stability. The new method is not only adapted to detecting anomalies in a local ensemble of clocks but also provides an effective solution to autonomous integrity monitoring of GNSS satellite clocks.
The paper is organized as follows. In section 2, the Kalman filter model of the atomic clock, the innovation extrapolation method and the chi-square detection of multi-epoch accumulation are described in detail. The superiority of the new method is proved mathematically strictly in theory. The implementation of the algorithm is also described. In section 3, the simulation of weak frequency jump and frequency drift jump is carried out. We give the optimal extrapolation number and the optimal accumulation number under certain conditions. In section 4, the new method is applied to the cesium atomic clock frequency data collected in our laboratory. Section 5 is the conclusion.
Innovation extrapolation-accumulation
The Kalman filter model
The three-state clock model is chosen here, which is expressed as follows:

where

where
The frequency measurement model can be expressed as:

where
Innovation extrapolation method
The innovation extrapolation method is an improvement of the innovation method. The innovation extrapolation method is no longer based on state prediction at the previous moment and the observed value at the current moment to get state estimation. Instead, it uses the state estimation before the filter, avoiding the influence of abnormal observations and reducing the “pollution” of the state estimation. The Kalman filter equations are described as follows:


where
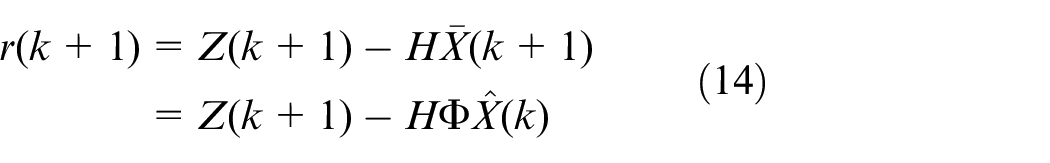
Innovation is defined as:

When there is no frequency anomaly, the innovation follows a Gaussian distribution with a mean of zero, 18 which satisfies:

where

When the frequency anomaly occurs, the mean of the innovation is not zero, which satisfies:

where

where

Where
Chi-square detection of multi-epoch accumulation
According to the innovation extrapolation method, a detection statistic is adopted:
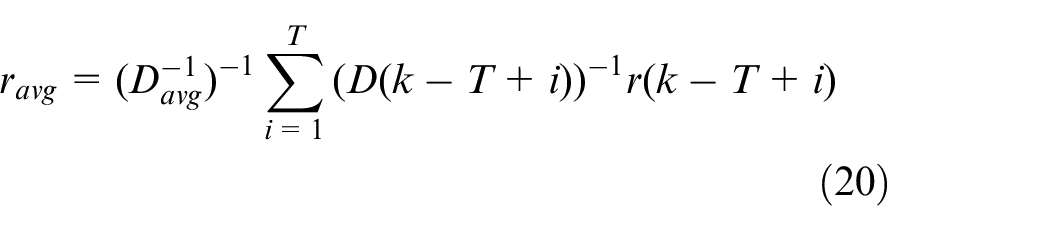
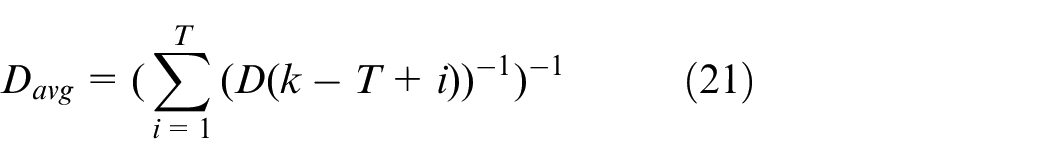
To better detect the small frequency jump and the frequency drift jump, a new detection statistic is constructed by accumulating the extrapolated statistic of N epochs:

where

The new statistic
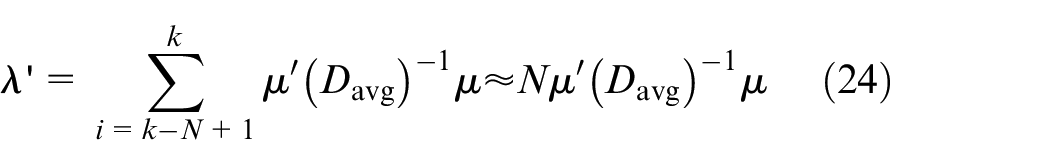
In a short time, we can approximately assume that the innovation covariance matrix remains constant. The ratio between the new detection statistic and the innovation extrapolation detection statistic is:
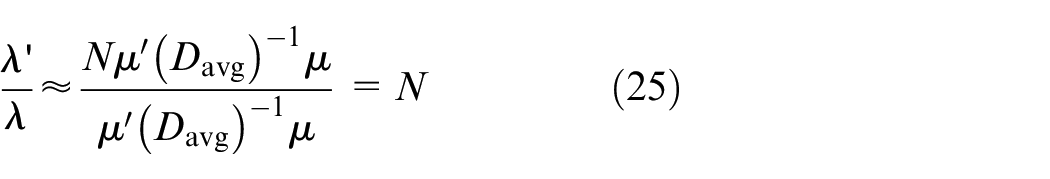
Compared with the innovation extrapolation method, the new detection statistic increases the decentralized parameter by N times. Therefore, the new detection statistic can significantly improve the detection effect of the small frequency jump and the frequency drift jump. In theory, the greater the cumulative epoch number is, the better the detection effect will be. However, with the increase of N, the innovation covariance matrix is no longer approximately unchanged, and the detection time will increase, which is not conducive to detecting anomalies in time.
The judgment criterion based on innovation extrapolation-accumulation is:


The detection threshold TH can be calculated by the given probability of false alarm (PFA).
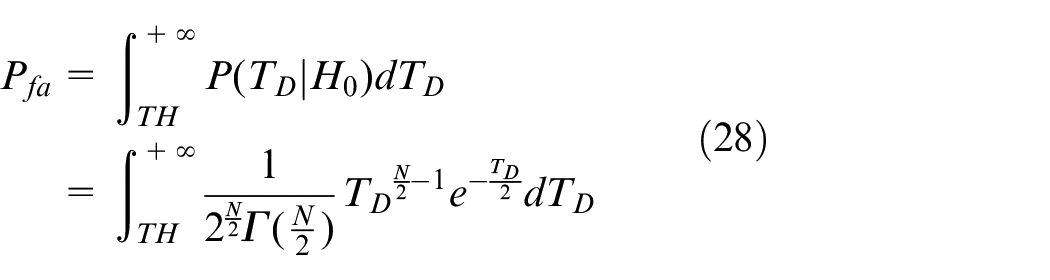
Then, the probability of detection is:
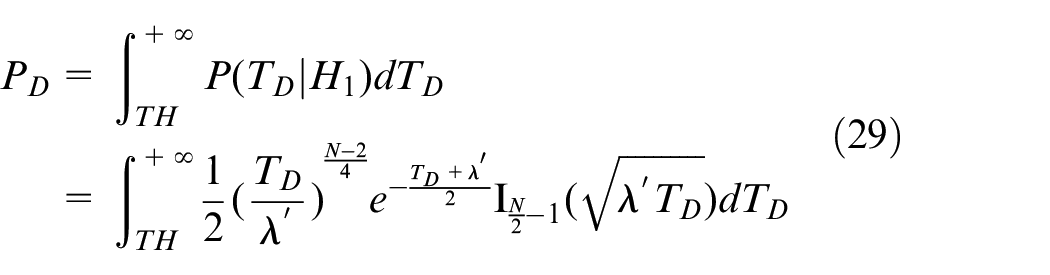
where
Implementation details
The detailed implementation steps of the proposed algorithm can be described as follows:
Step 1: State estimation vector
Step 2: Select the number of extrapolation. It is assumed to be T. We can get
Step 3: The detection statistic
Step 4: Selective accumulation number. It is assumed to be N. The new detection statistic is obtained through equation (22).
Step 5: Each value of the detection statistic is compared with the detection threshold TH, which can be confirmed by equation (28) with a given probability of false alarm. If the value of the detection statistic exceeds the threshold, a frequency anomaly is detected.
The proposed algorithm is illustrated schematically in Figure 2.
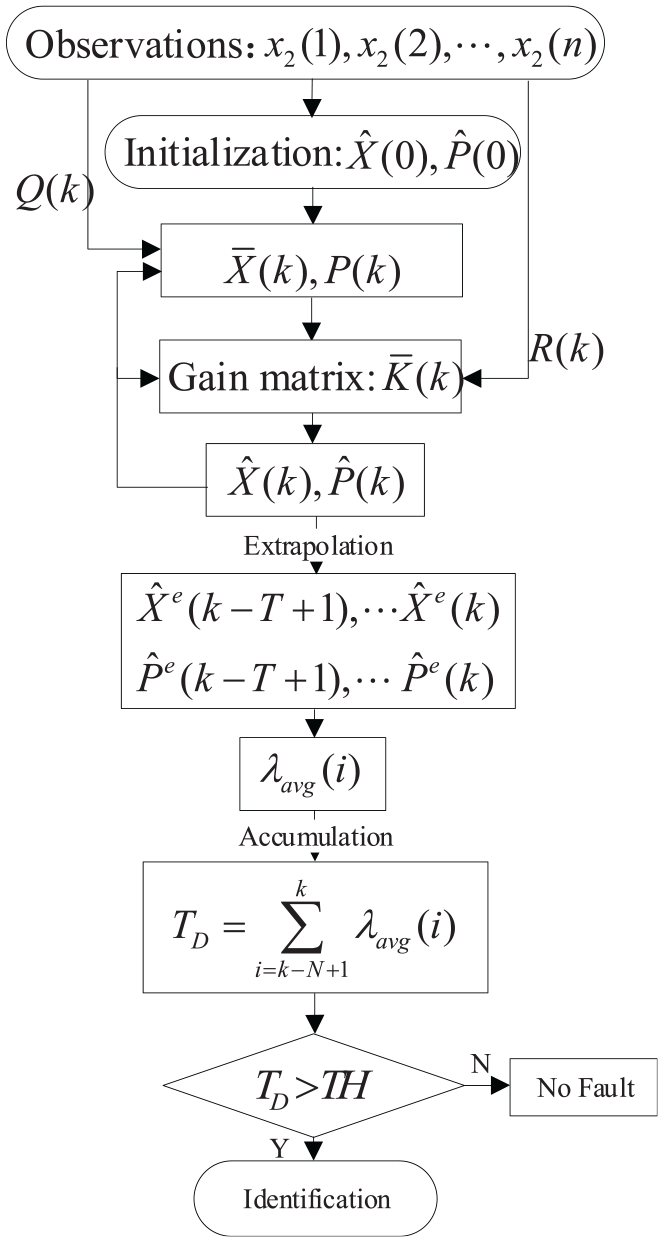
Implementation scheme of the innovation extrapolation-accumulation based on the Kalman filter.
Numerical simulation
To evaluate the performance of the innovation extrapolation-accumulation based on the Kalman filter in detecting small frequency jump and frequency drift jump, the following numerical simulation is carried out. According to the clock difference generation method provided by Xu et al., 19 the numerical simulation produced the clock difference data of 10,000 s duration for a cesium atom clock of a 5071 A, and its frequency data are shown in Figure 3(a). The sampling time is 1 s. The relevant noise parameters are:
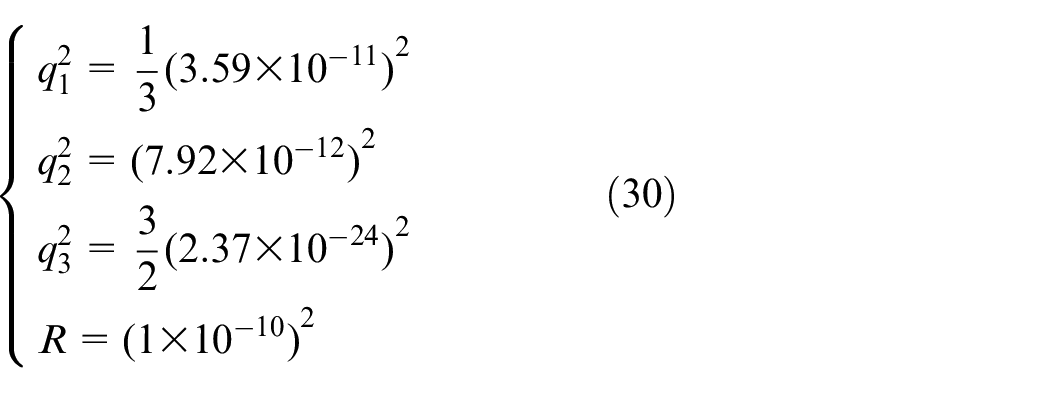
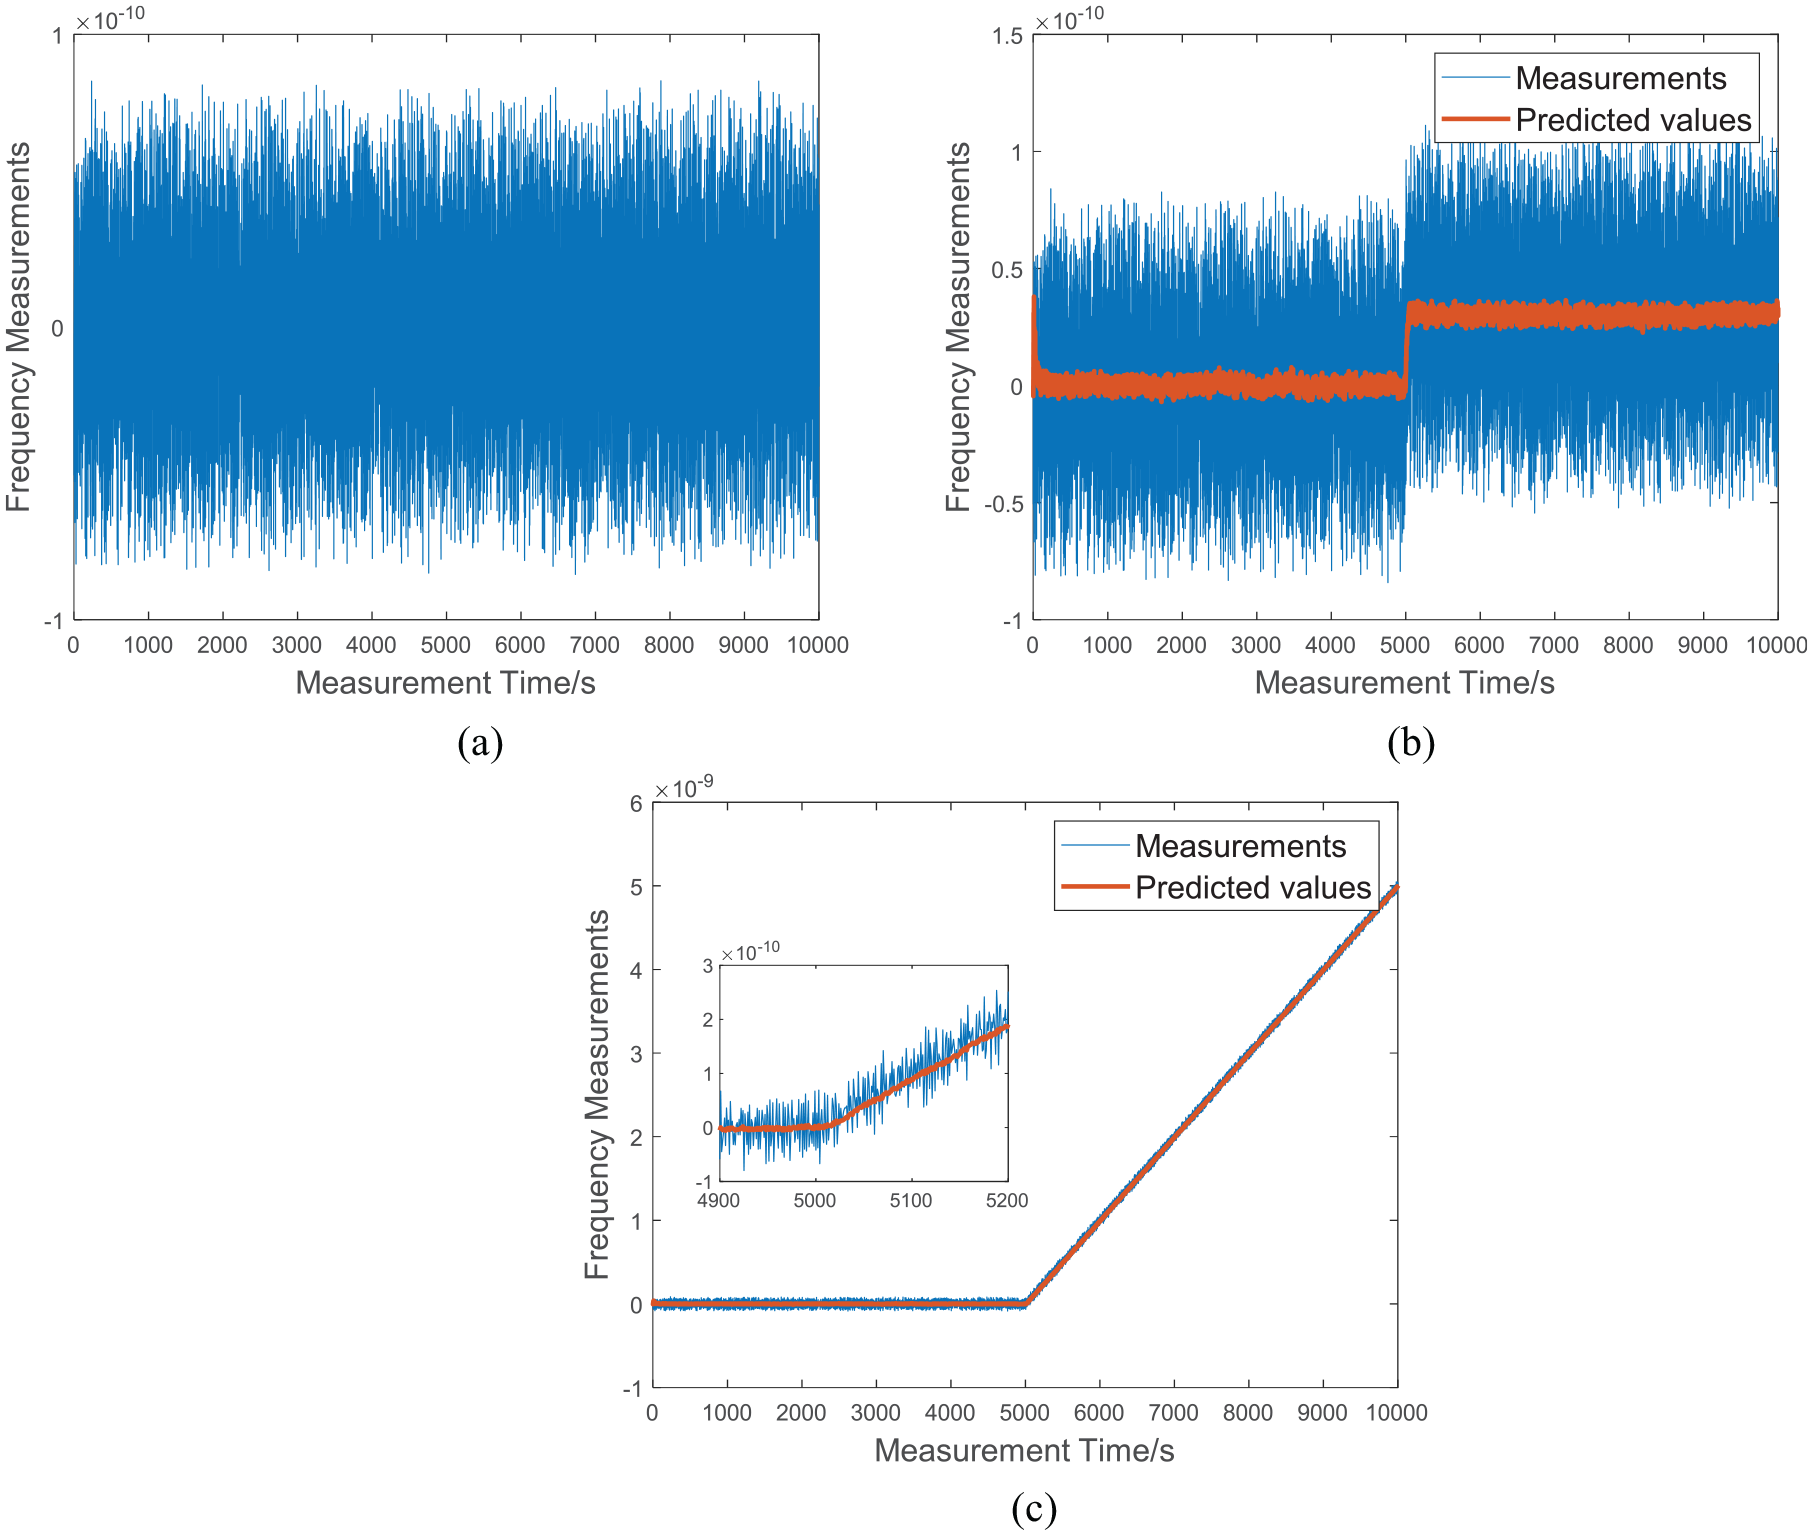
Frequency deviation under different anomalies of numerical simulation: (a) normal, (b) frequency jump, and (c) frequency drift jump.
Frequency jump
Frequency jump is a typical frequency anomaly of atomic clocks. It shows that the mean of frequency deviation suddenly increases or decreases at a certain moment. Therefore, it can be modeled as:
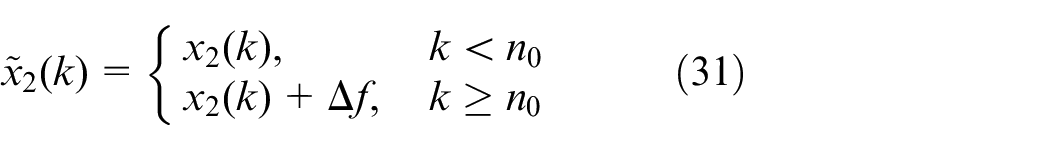
where
Figure 3(b) shows the frequency jump of size
Optimal extrapolation and accumulation number
According to equations (19) to (22) and (29), the detection performance is related to the extrapolation number and the accumulation number. In Figure 4, the relationship between the accumulation number and the probability of detection (PD) under different extrapolation numbers are described in the case of given frequency jump is
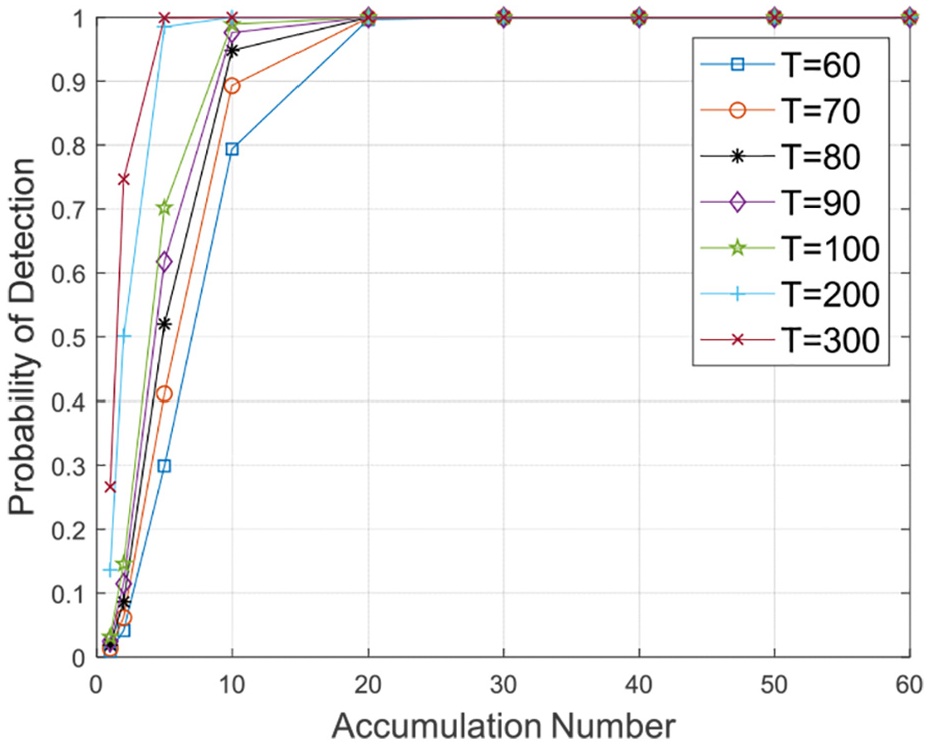
The PD with a given PFA and frequency jump as a function of the accumulation number under different extrapolation numbers.
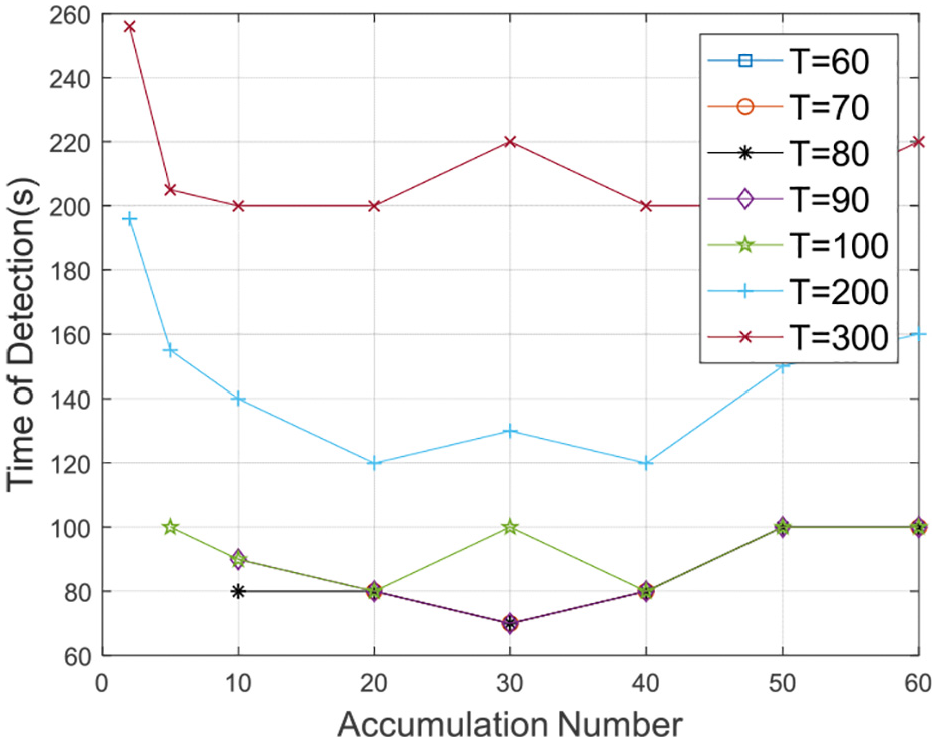
The TD with a given PFA and frequency jump as a function of the accumulation number under different extrapolation numbers.
In Figure 4, it can be seen that under the same extrapolation number, the probability of detection increases with the increase of the accumulation number. Under the same accumulation number, the bigger the extrapolation number is, the higher the probability of detection is.
In Figure 5, we use different marks to correspond to the relationship between the time of detection and the accumulation number under different extrapolation numbers. It can be seen that with the same N, when T is greater than 100, the TD will be longer with the increase of T. When T is less than 100, the TD may be the same in the case of the same N and different T. For example, when T = 70, N = 30; T = 80, N = 30, and T = 90, N = 30, both of which have a detection time of 70 s. In Figure 5, when T is equal to 60, the relationship between different N and TD does not appear. That’s because it was missed detection.
It can be seen that the minimum TD is 70 s, respectively at T = 70, N = 30; T = 70, N = 30, and T = 90, N = 30. Therefore, we plotted the corresponding detection results in these three cases as shown in Figure 6. As can be seen from Figure 6, under the same N, the greater T is, the greater the detection result is, and the easier it is to detect. The detection threshold is 71.59. So we can get the optimal T and N, which are 90 and 30 in the case of a given frequency jump is
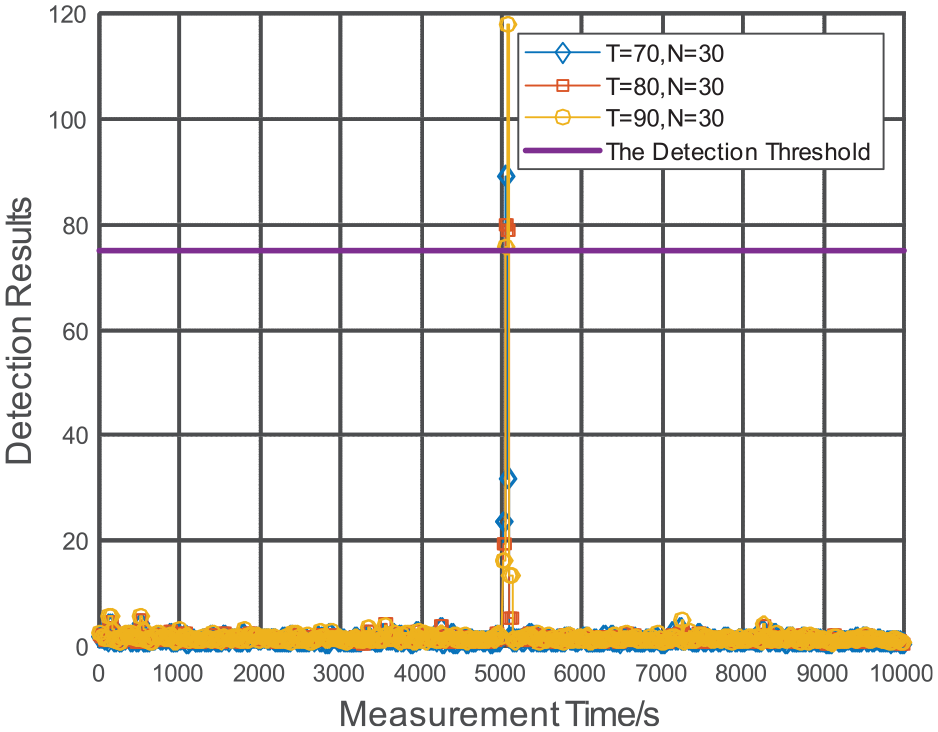
Detection results of frequency jump under the same accumulation number and different extrapolation numbers.
Detection performance
To evaluate the new method, the detection probability of the innovation detection method, the innovation extrapolation method and the innovation extrapolation-accumulation method at given weak frequency jumps are analyzed. The probability of detection for values of PFA given in equation (32), under different frequency jumps with the sizes given in equation (33) are calculated, which are shown in Figure 7. The extrapolation number is 90 and the accumulation number is 30.
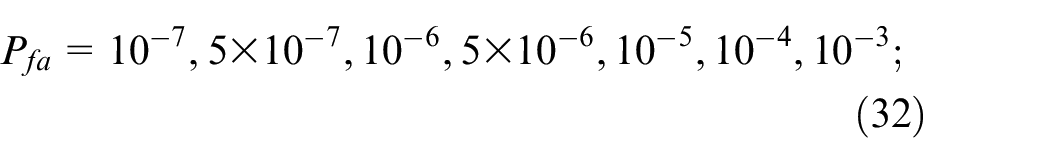

As can be seen from Figure 7, for the same frequency jump value, the innovation extrapolation-accumulation method has the maximum detection probability, followed by the innovation extrapolation method, and the innovation detection method is the worst. The simulation results also presented as expected: for the same method, the bigger the frequency jump value, the easier the detection and the higher the detection probability. Meanwhile, with the increase of PFA, the PD also increases. Detailed statistical results are shown in Table 1.
The receiver operating characteristic (ROC) curves obtained with the frequency jumps are given in (33).
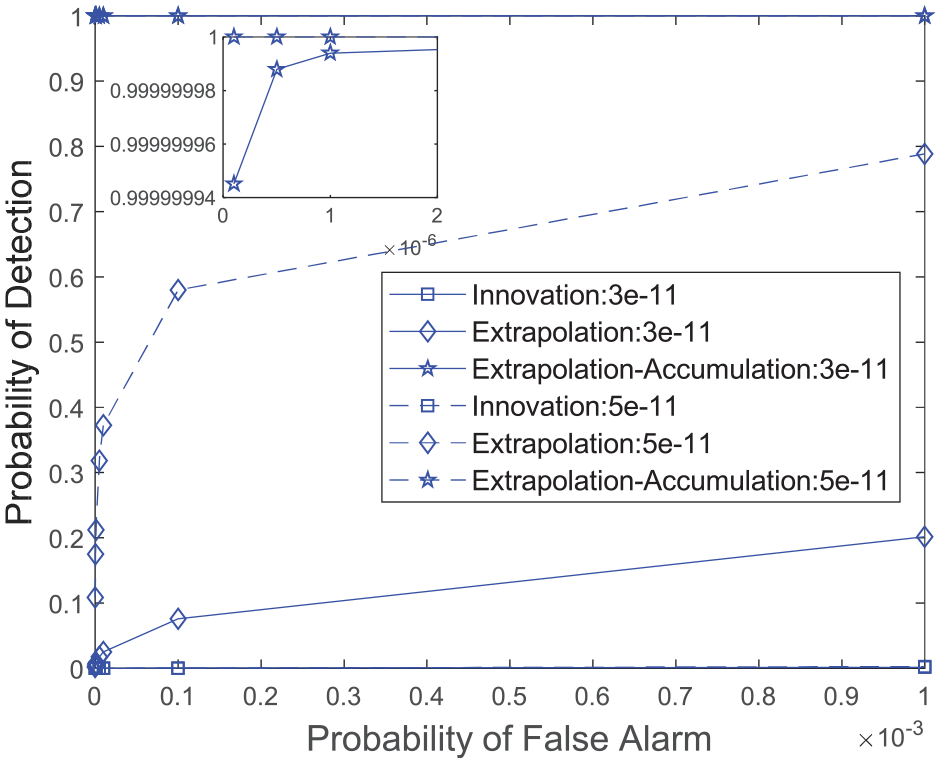
The detection results of the three methods when
It can be seen from Table 1 that when the extrapolation number is equal to 90, the innovation extrapolation-accumulation method can greatly improve the detection probability only by accumulating the detection statistics of 30 epochs. At the same time, we see that both the innovation method and the innovation extrapolation method have a situation of missing alarm. This is because the abnormal detection statistics are too small to be below the detection threshold.
As far as detection time is concerned, the detection time of the innovation extrapolation-accumulation method is about 1 min. The innovation extrapolation-accumulation method can detect frequency anomalies in short detection time and with high detection probability.
Frequency drift jump
The small frequency drift jump is showed as that the mean value of the frequency drift suddenly starts to change from a certain moment and lasts for a certain time. Therefore, it can be modeled as:
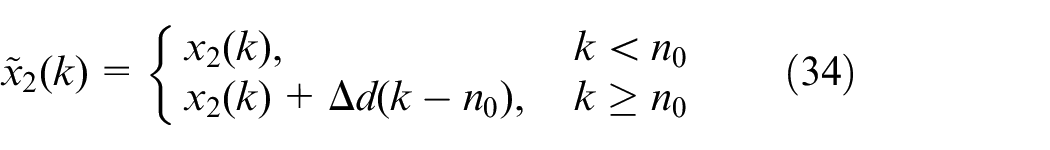
where
Figure 3(c) shows the frequency drift jump with size
Optimal extrapolation and accumulation number
Similar to frequency jump, the relationship between the accumulation number and the probability of detection under different extrapolation numbers are described in Figure 8 when frequency drift jump
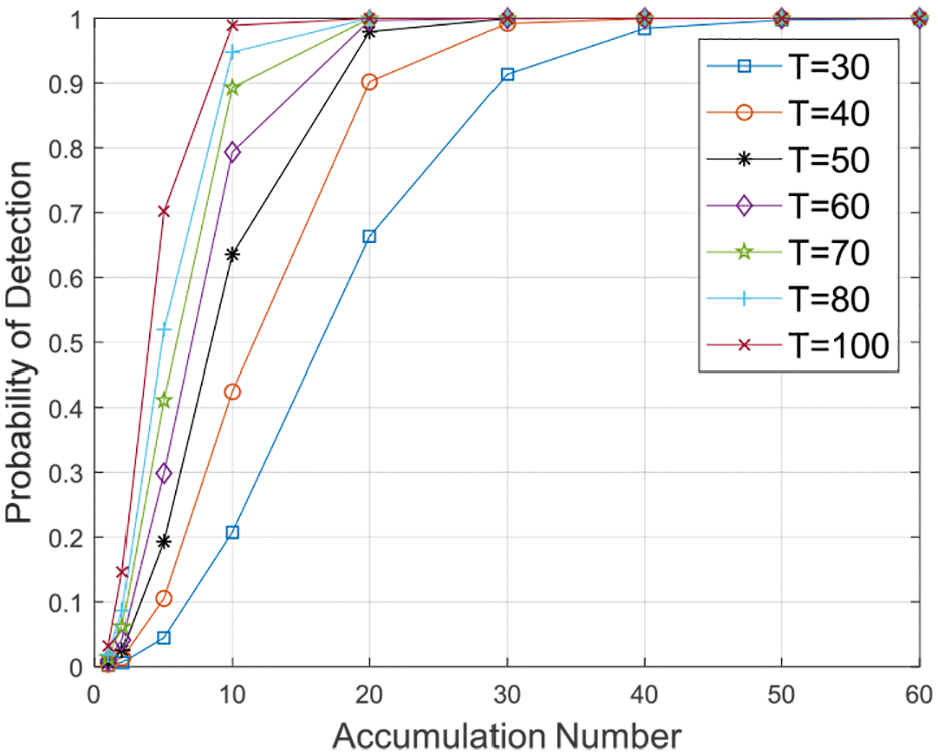
The PD with a given PFA and frequency drift jump as a function of the accumulation number under different extrapolation numbers.
Figure 8 shows a curvilinear trend similar to Figure 4. The relationship between N and TD is plotted in Figure 9, and the other conditions are the same as Figure 8. It can be seen that when N is less than 5, the detection time corresponding to different extrapolation numbers are very small, but combined with Figure 8, their detection probabilities are very low. As N increases, the detection time increases, but for different extrapolation numbers, the detection time is the same.
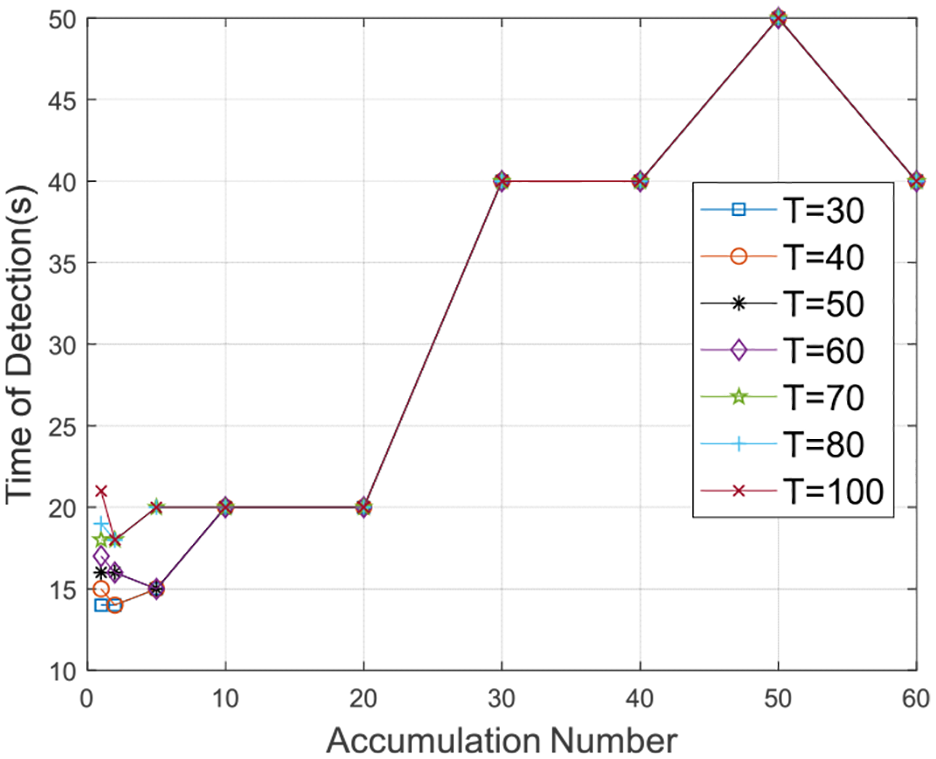
The TD with a given PFA and frequency drift jump as a function of the accumulation number under different extrapolation numbers.
Suppose to ensure that the detection probability exceeds 0.995 and the detection time is as small as possible. Only T = 60, N = 20; T = 70, N = 20; T = 80, N = 20, and T = 100, N = 20 satisfy this assumption. Therefore, we plotted the detection results of these four cases as shown in Figure 10. In Figure 10, when frequency drift jump occurs, the detection results of anomaly will far exceed the threshold value. Even if T = 60, N = 20 corresponding detection results compared to the other three cases are smaller, but it is large enough. This is enough to detect anomalies. At the same time, the smaller T is, the lower the computational complexity is. So we get the optimal extrapolation number and the accumulation number, which are T = 60 and N = 20 in the case of given frequency drift jump is
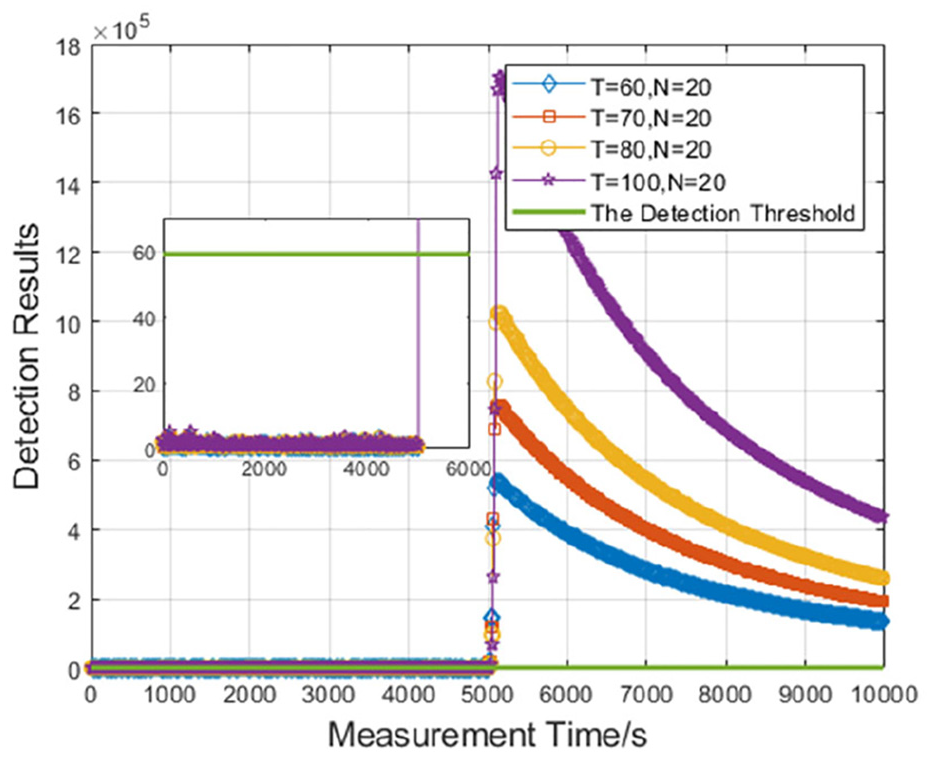
Detection results of frequency drift jump under the accumulation number and different extrapolation numbers.
Detection performance
The simulation process is similar to the frequency jump. The probability of detection for values of PFA given in equation (35), under different frequency drift jumps with the sizes given in equation (36) are calculated, which are shown in Figure 11.

In Figure 11, when frequency drift jump is
The ROC curves obtained with the frequency drift jumps are given in (36).
The detection results of the three methods when
“I” represents the innovation detection method, “II” is the innovation extrapolation detection method, and “III” represents the innovation extrapolation-accumulation detection method. “/” represents a situation of missed detection.
Figure 11 is drawn under the conditions of T = 60 and N = 20. It is the optimal extrapolation number and the accumulation number when
Real data analysis
To obtain the measured data of the frequency jump of atomic clocks, an experimental platform was built. The experimental principle block diagram is shown in Figure 12(a), and part of the measured scenes are shown in Figure 12(b).
Experimental principle block diagram and test environment: (a) principle block diagram and (b) test-site.
In the experiment, a cesium atomic clock 5071 was used as the atomic clock to be measured, and one output signal of 10 MHz was used as the input of a High-Resolution Phase and Frequency Offset Generator (HROG-10), and the other output signal was used as the input of a Multi-channel Measurement System (MMS). The standard 10 MHz frequency signal of NTSC to MMS as a reference, and 1PPS signal to HROG-10 for initial phase synchronization, and finally data acquisition through a computer. The HROG-10 is used to adjust the frequency offset.
Data were collected from September 1, 2020 to September 2, 2020, and weak frequency jumps of ±3 × 10⁻¹¹ were inserted through the HROG-10 on September 2. They correspond to 11015, 25895, 40535, and 54840 s. The duration is about 4 h. The sampling interval is 1 s. The whole test process was conducted in a constant temperature and humidity environment. During the test, the laboratory was closed and equipped with UPS emergency power supply to avoid interference of other factors on the test results.
Figure 13(a) shows the deviation of the normal atomic clock frequency on September 1, and Figure 13(b) shows the deviation on September 2. In the figure, “R” represents the measured frequency deviation value, and “P” represents the Kalman forecast value.
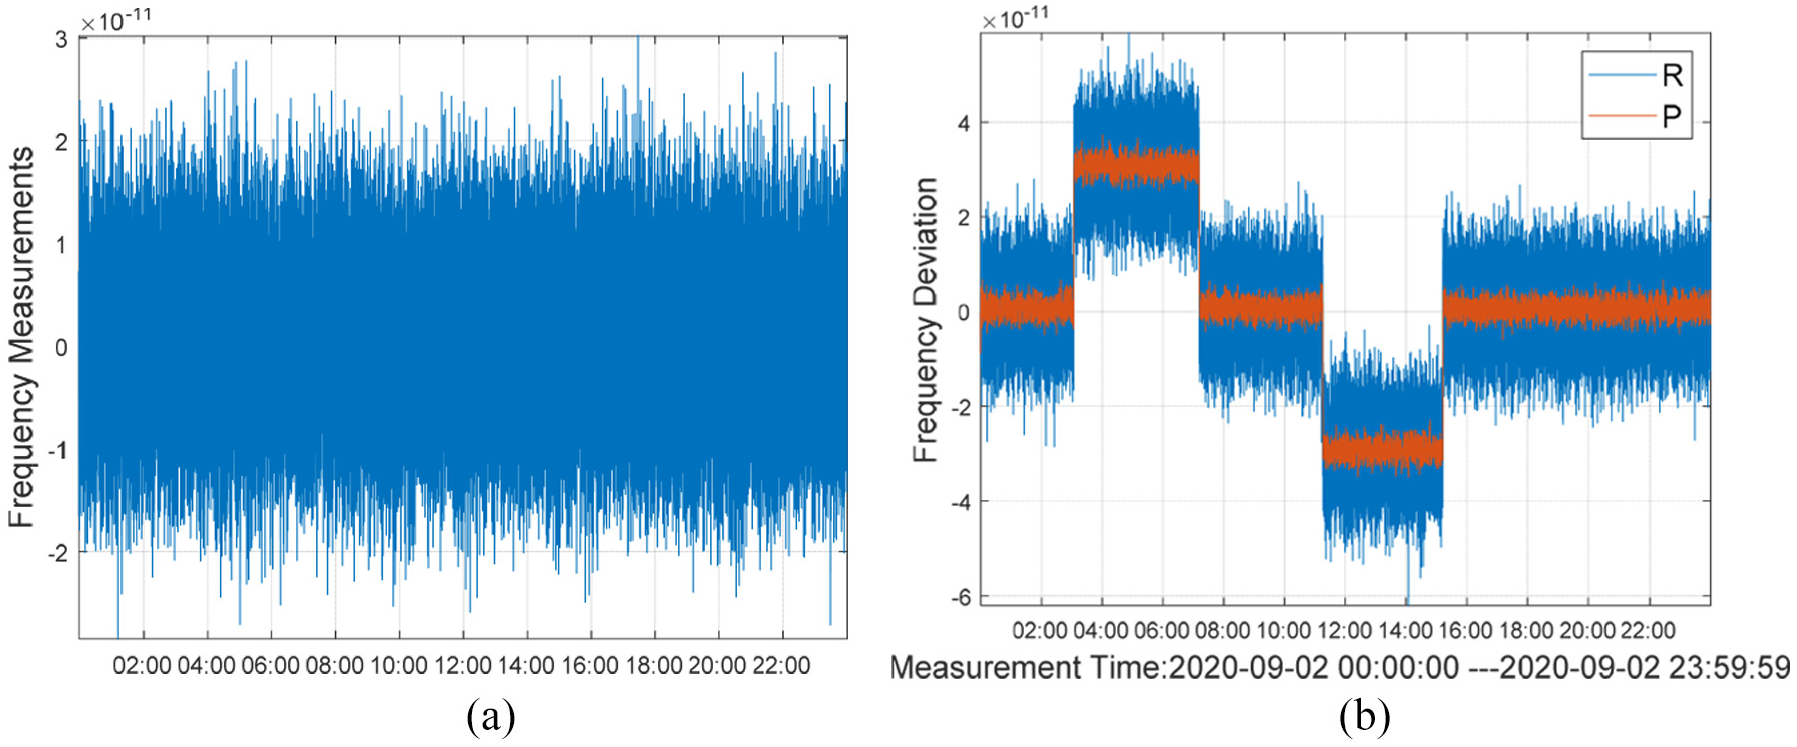
Real data of frequency deviation: (a) normal and (b) frequency jump.
We use normal data to calculate the noise parameters of the atomic clock. The relevant noise parameters are:

So the covariance matrix of the Kalman filter can be initialized well, otherwise, it will cause a large error, and even the algorithm does not converge.
To highlight the advantages of the new method, all the three detection methods mentioned in this paper have been used to test the measured data. According to 3.1.1, for
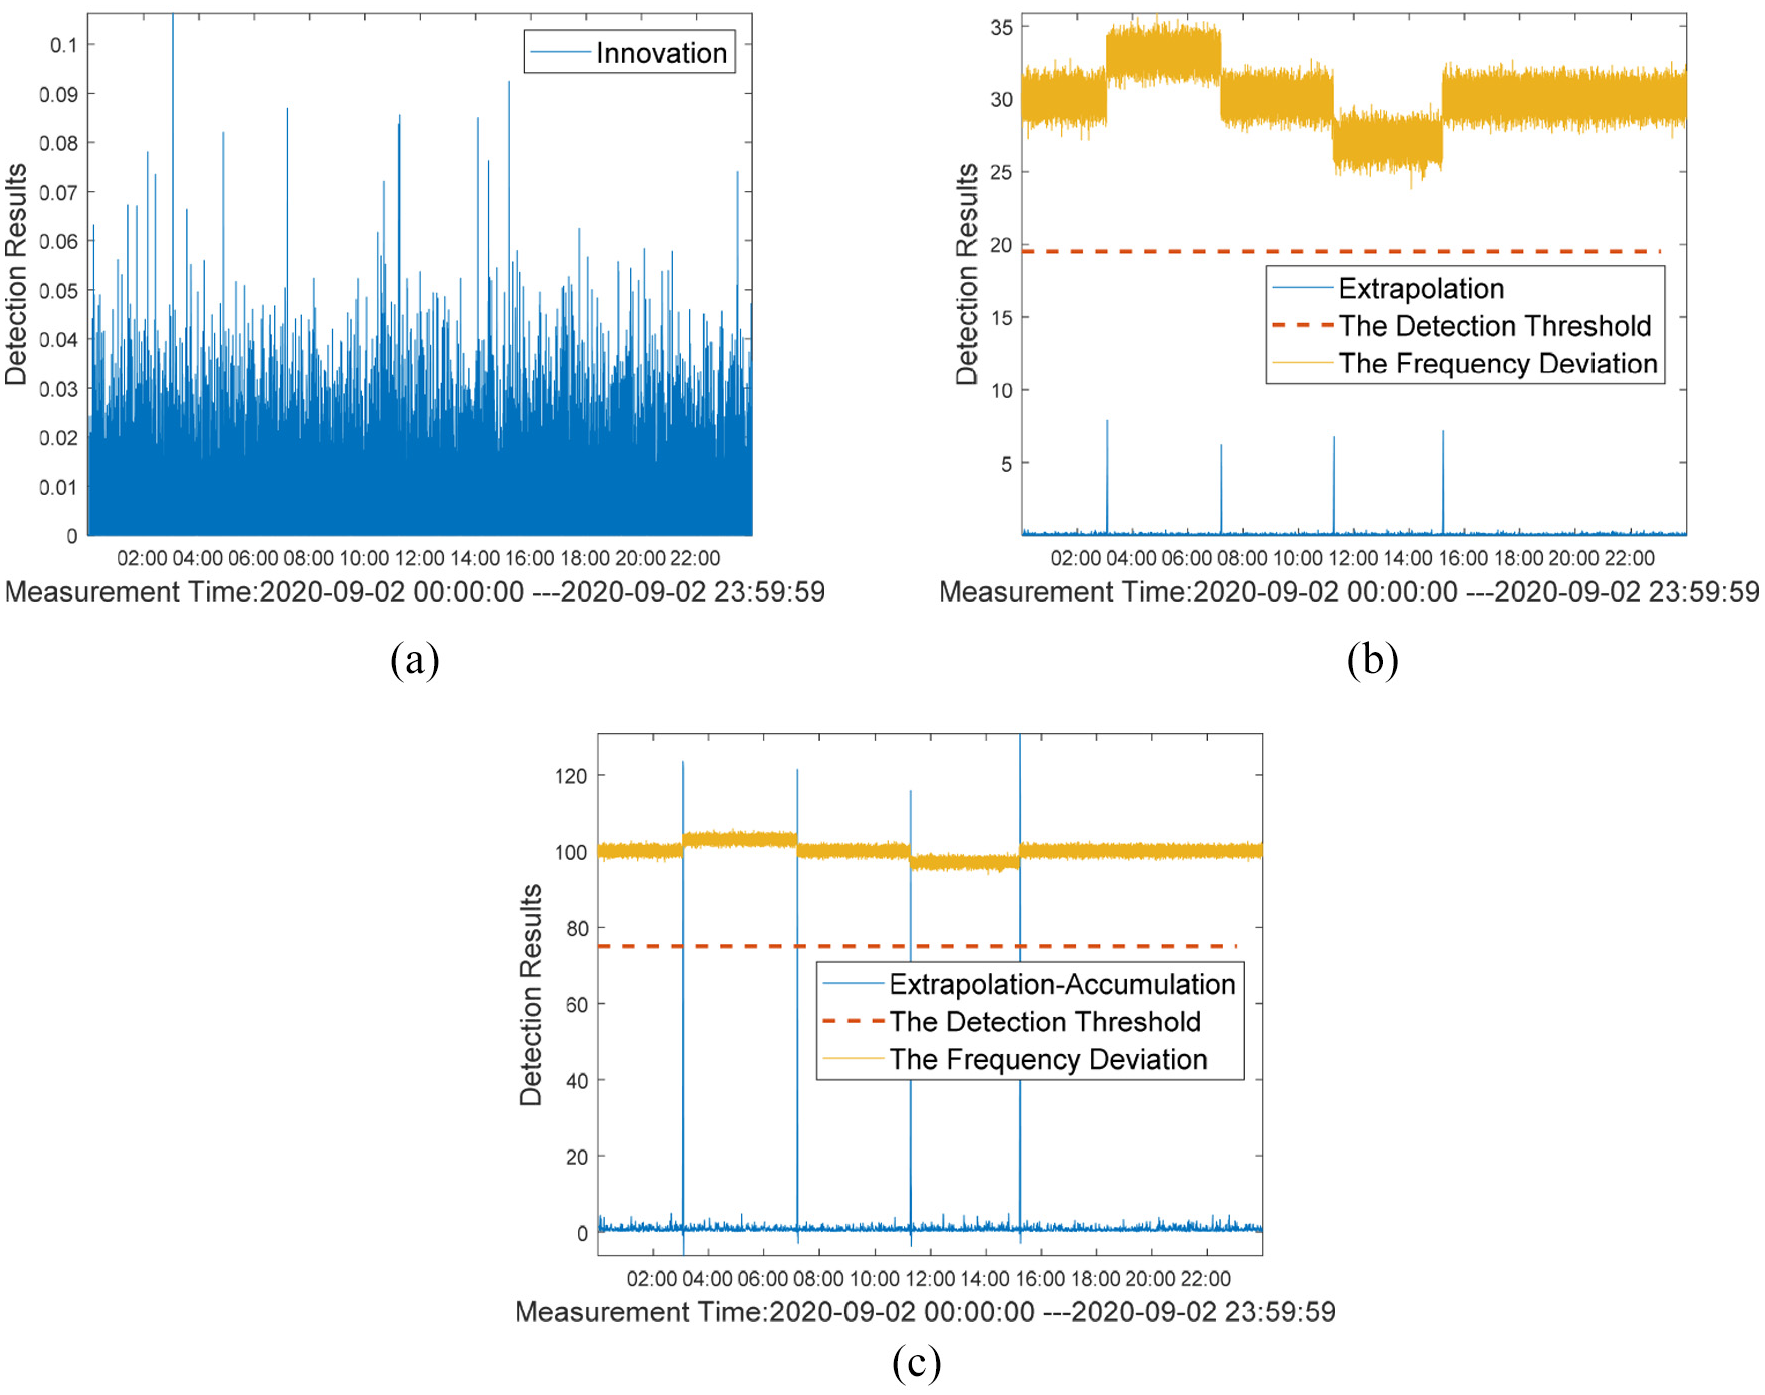
Detection results of real data: (a) innovation, (b) extrapolation, and (c) extrapolation-accumulation.
Figure 14(a) only draws the detection statistics of the innovation detection method. It can be seen from the figure that the detection statistics are very small and the detection threshold is 19.51. It is impossible to distinguish the abnormal detection statistics from the normal detection statistics and cannot identify the anomalies. Because of this, the detection results of the three methods are not drawn together. Otherwise, the detection results of the innovation method are too small to be covered up.
Figure 14(b) shows the detection statistics value of the innovation extrapolation method and its threshold value of 19.51, as well as the frequency deviation value of 1011 times. The detection statistics corresponding to four anomalies are 7.92, 6.24, 6.78, and 7.20. Although there is a difference between the abnormal and the normal, the detection results of the abnormal do not reach the threshold value, so the anomaly identification is still unable to be achieved. This phenomenon is consistent with the results of our simulation.
Figure 14(c) is plotted in a similar way to Figure 14(b), showing the detection results of the innovation extrapolation-accumulation method. The value of the detection statistic increases at the time value corresponding to the frequency jumps. The detection statistics corresponding to four anomalies are 120.08, 120.67, 106.93, and 128.04. The detection threshold of the new method is 71.59, and the detection statistics at the abnormal place are far beyond the threshold, which can be detected well. The detection moments of the four anomalies are 11100, 25980, 40620, and 54840 s, and the detection time is 85 s. From the point of view of detection time, compared with the detection time obtained by simulation, it lags 15 s. This could be due to HROG-10. Because when we put in a frequency offset, the HROG-10 is relatively slow to adjust the frequency offset, rather than suddenly changing the frequency offset. This result is acceptable and understandable to us.
In Figure 14, you can see that the innovation extrapolation-accumulation based on the Kalman filter of the weak frequency anomaly shows sufficient superiority. If the frequency jumps were larger, the second method might also be able to pick up the anomaly, but the advantage of the new method is that it can be more sensitive to weak frequency anomalies as the detection values are larger. The innovation extrapolation-accumulation method can expand the detection statistics of frequency anomalies, while the detection statistics of no anomalies remain unchanged, widening the gap between the detection statistic results and making it easier to detect anomalies, which is consistent with the previous theoretical proof.
Conclusions
In this paper, a new method that innovation extrapolation-accumulation based on the Kalman filter is proposed for the detection of weak frequency anomalies in atomic clocks. The innovation extrapolation-accumulation detection method shows the advantages of high detection probability and short detection time whether it is small frequency jump or frequency drift jump. Both the simulation results and the measured data show that the innovation extrapolation-accumulation detection method is an effective method to detect the small frequency anomalies of atomic clocks, which can realize the real-time and high-performance detection of the small frequency anomalies of atomic clocks.
Our team is committed to the development of a seamless switcher for the main and backup atomic clocks, and it is expected that the new detection algorithm will be applied to it in the future.
Footnotes
Declaration of conflicting interests
The author(s) declared no potential conflicts of interest with respect to the research, authorship, and/or publication of this article.
Funding
The author(s) disclosed receipt of the following financial support for the research, authorship, and/or publication of this article: The authors thank the ZFS Satellite Navigation Test System of China (Grant No. ZFS20001D) funding support.