
Abstract
Leak detection of an oil pipeline can prevent environmental and financial losses. A method for the cyber-physical system of pipeline leak detection is proposed based on the empirical mode decomposition (EMD) and deep belief network (DBN). Experiment data are acquired from an oil pipeline company. The EMD is suitable for noise removal and signal reconstruction from raw pressure signals, and the reconstructed signals are used to establish a DBN model of pipeline leakage. Our proposed method obtains higher-recognition-accuracy results (98% accuracy) and can more effectively identify leak detection than the twin support vector machine (TWSVM), support vector machine (SVM), and back-propagation neural network (BPNN).
Keywords
Introduction
Oil pipeline transport plays an increasingly important role in the national economy. 1 However, pipeline leakage caused by corrosion, weld defect, vibration and scour affects the normal operation of pipeline transport, pollutes the environment and causes fire and explosion accidents.2,3 Therefore, monitoring the operating condition of pipelines is of considerable practical significance.
Due to the gradual development of the Industry 4.0 era, pipeline monitoring has progressively developed from automation and network toward intelligent solutions in recent years. As one of the important strategies of the Industry 4.0 era, the application of a cyber-physical system (CPS) in the area of intelligent manufacturing has attracted considerable attention.4,5 Through the in-depth integration and synergy of the advanced control technology, communication technology and computing technology, CPS realizes that the physical world and the virtual world are interrelated, which provides it with independent judgment, autonomous decision-making and autonomous control capabilities.
To detect and locate the pipeline leakage, hard and software-based methods are adopted. The leakage is checked by a special device in hardware-based methods such as the acoustic leak detection method, thermal infrared imaging, 6 and magnetic flux leakage detection. The model-based and data-driven methods are software-based methods, 7 such as real-time transient modeling, negative pressure wave, and statistical methods.
The collected signals are usually preprocessed with signal-processing techniques; then, the leakage features are extracted and selected before being input into an artificial neural network (ANN). In Bohorquez et al., 8 A novel technique to detect and characterize the occurrence of bursts in pipelines by merging the use of fluid transient waves and artificial neural networks (ANN). Wavelet analysis denoising can denoise the environment interferences in the collected pressure signals at the ends of pipeline, 9 but the environment interferences can be denoised by setting appropriate thresholds in the wavelet coefficients. Moreover, the thresholds are related to the segment lengths of collected pressure signals. To achieve better signal denoising, the segment length of collected pressure signals is selected by an empirical basis according to the features of leak signals. In Xiao et al., 10 a leak detection method is proposed by acoustic signals at the ends of pipeline based on wavelet transform and Support Vector Machine. Moreover, the selected signals by sensors are pre-processed by wavelet transform. The empirical mode decomposition (EMD) is an algorithm to process nonstationary signals, which has been widely applied in power quality event classification and leakage detection systems. 11 In Tao et al., 12 a fault detection method via the EMD based on local characteristic time scales of the analyzed signal. In Lu et al., 13 an improved EMD method is used to recognize leak feature extraction of a fluid pipeline.
Multiple restricted Boltzmann machines (RBMs) are combined into a deep belief network (DBN) 14 and compared with the shallow learning model (e.g. SVM and ANN). DBNs are becoming a serviceable instrument for fault diagnosis in recent years. 15 We usually design a novel deep neural network (DNN)-based machine learning approach to solve the leak identification problem. 16 Based on the characteristics of the deep learning method 17 and shallow learning method, we know that the deep learning method can automatically illustrate18 features from the primordial characteristics set instead of manually choosing characteristics. In Kuremoto et al., 18 the DBN model of particle swarm optimization (PSO) is used to predict the time-domain signal, and the deep learning ability of the DBN model of the original data is used. Thus, the high-precision prediction effect is achieved. In Shao et al., 19 convolution DBN is choosed, and DBN network with Gauss visible layer is used to realize fault identification of ordinary bearing. Compared with traditional shallow layer method, the high accuracy of the DBN method is verified. In Chen et al., 20 the time-domain, frequency-domain and time-frequency-domain features of small bearing signal are extracted as the input of DBN model for fault diagnosis and recognition, and the recognition effect of other deep learning algorithms is compared to verify the superiority of DBN method in fault diagnosis.
Based on the characteristics of EMD and DBN, this study proposes to apply EMD and DBN to detect pipeline leakage. The EMD is used to denoise the collected pressure signals and identify the pipeline leakage using the deep belief network algorithm.
The remainder of this article is organized as follows. In Section 2, we presents the structure of the pipeline leak detection based on a CPS. In Section 3, we provide a brief introduction to the EMD, DBN and proposed method of pipeline leak detection. In Section 4, we supply the experimental results of pipeline leak detection, which we analyze and discuss. Finally, the conclusions are listed in Section 5.
Pipeline leak detection principle
Empirical mode decomposition
The empirical mode decomposition (EMD) can process signals. It has no base functions, so the pressure signal is divided into different intrinsic mode functions (IMFs); a detailed introduction of the EMD algorithm can be found in Shu and Gao. 21 The measured pipeline pressure signal can be calculated based on the EMD as follows.
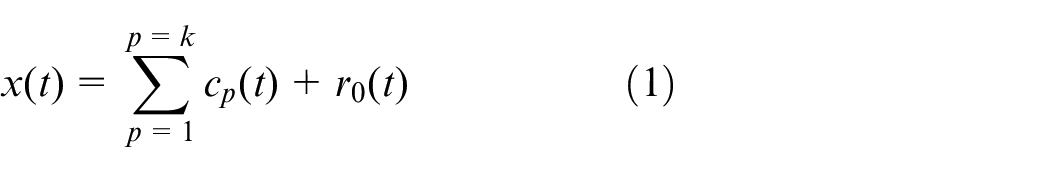
where
In equation (1), the original measured signal
Deep belief network
The deep belief network 22 is a neural network (NN), which is composed of multiple restricted Boltzmann machines (RBMs). The input layer indicates the characters of the original data, and the output layer indicates the labels of these data. From the input layer to the output layer, by layer abstraction, we mine the essential characteristics of data in the deep architecture.
A deep belief network is achieved by stacking several RBMs. The first-layer RBM is the input of the DBN of the pipeline leak detection, and the output is represented by the last RBM hidden layer. The DBN is treated as a multilayer perceptron (MLP); when used for classification, a logistic regression layer is added to the output.
The DBN structure consists of a few RBMs. Each RBM is composed of visible and hidden units.
Let
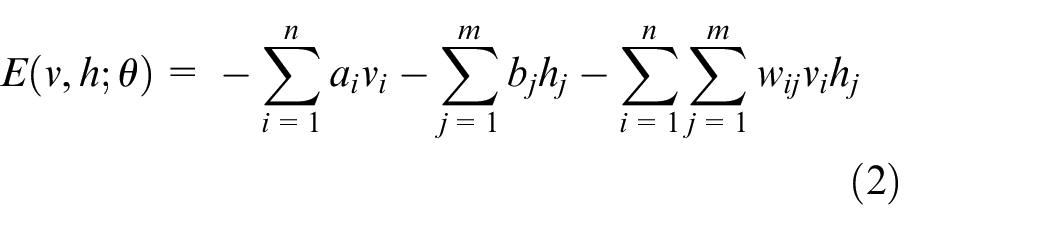
where
The joint probability formula for the visible-hidden vector pair is:
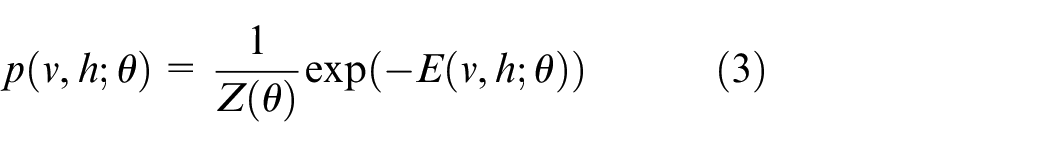
where
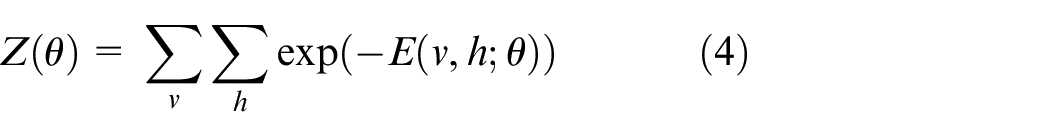
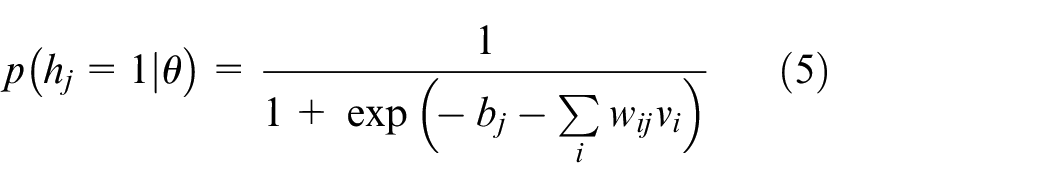
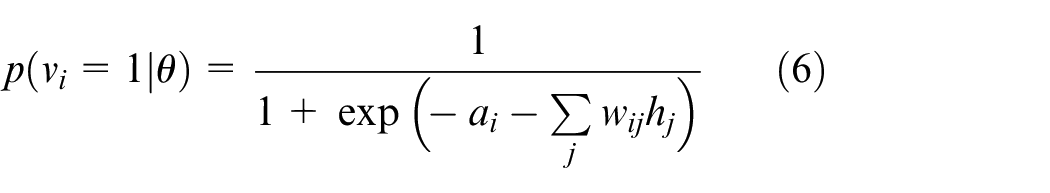
Because the hidden-hidden and visible-visible cases are mutually independent, the conditional probabilities of these units are expressed as follows:
As shown in Figure 2, the three hidden layers are inside the DBN.
The layer-by-layer learning process of the DBN can be observed from Figure 1, where the DBN contains three hidden layers. The training data came from the same pipeline and had the same experimental condition and different leakage size. First, the train data are transmitted to the visible layer on the first RBM unit. Second, the hidden layer receives input data from the visible layer. Finally, the visible layer of the second RBM unit receives a hidden layer from the RBM unit. The exercise of the DBN is completed through the following individual RBM units.
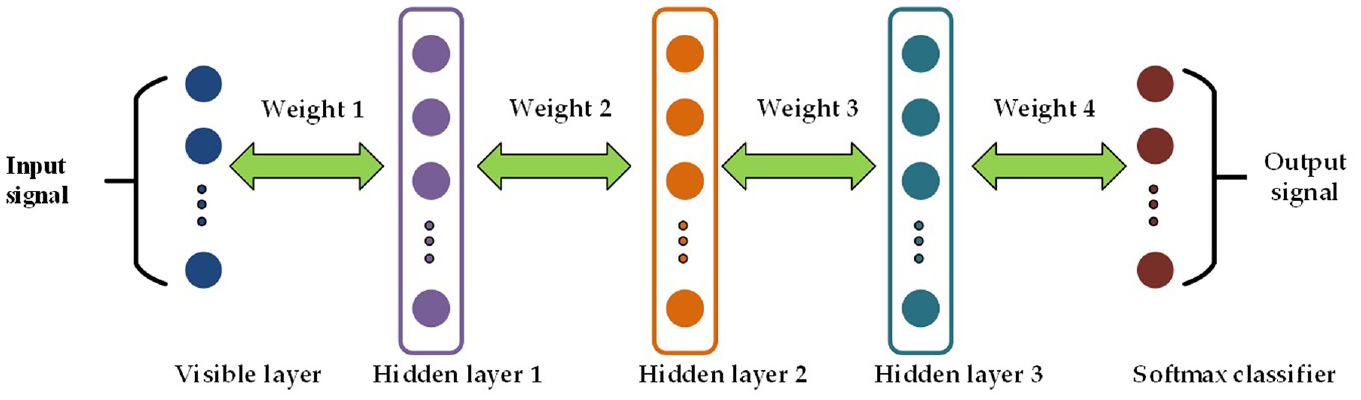
DBN structure.
Leak detection method based on EMD and DBN
Using the advantages of both EMD and DBN, we propose a hybrid leak detection method. In fact, the noise or uncertainty is complicated, it can be heavy-tailed distributed, 23 spatially correlated 24 and reproducible.23,25 EMD can remove noise from the pressure signals. These signals may be different because they correspond to different working conditions, but if there is no feature extraction based on prior knowledge, it is difficult to directly distinguish a leakage by pattern recognition.
Consequently, the DBN identifies the leak condition by signals after the EMD denoising without prior knowledge. The data acquisition comes from the same pipeline, simulating different leakage locations and different leakage volumes. The schematic of the pipeline leak detection is shown in Figure 2.
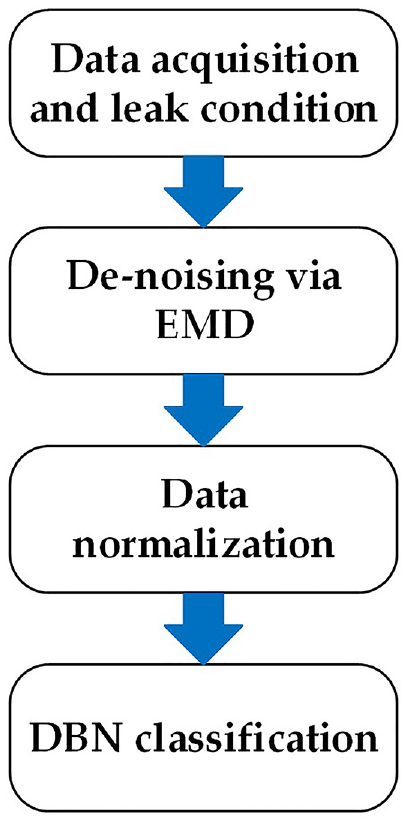
Schematic of the pipeline leak detection.
The pressure fluctuation signals collected in the experiment may not only be caused by pipeline leakage, but also by the pump start and valve regulating. 26 The latter two working conditions may cause false alarms. When the working conditions change, the pressure waveform will also change. In this study, in order to determine the source of abnormal pressure and eliminate the false alarm of pipeline leak detection, the characteristic parameters of different working conditions are selected from the time domain and waveform characteristics. Figure 3 shows a schematic diagram of pipeline laying from an oil pipeline company.
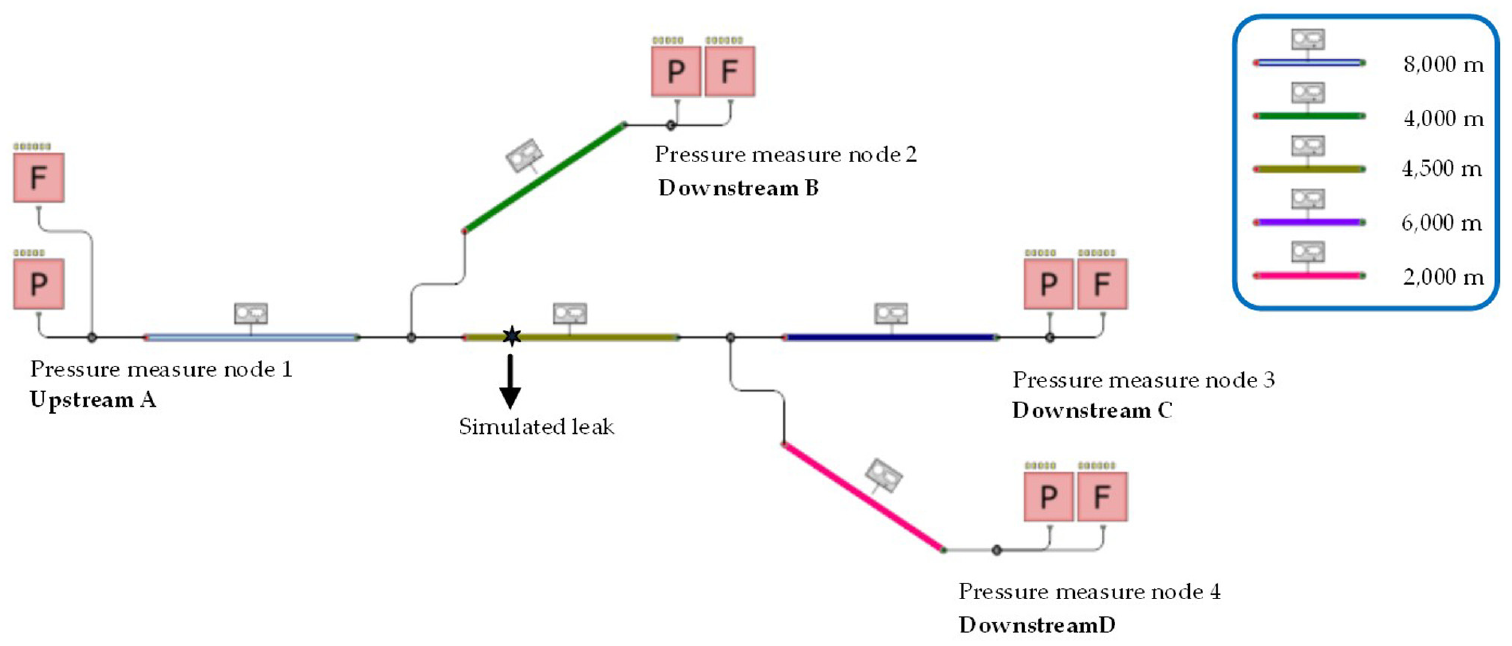
Schematic diagram of pipe laying.
There are five main pipelines, with lengths of 8000, 4000, 4500, 6000, and 2000 m respectively, which are shown in Figure 3. The pipeline inner diameter is 0.50 m and the roughness is 0.025 mm. We use valves to control the amount of oil that goes into the each pipeline and the time of delivery. In order to ensure transportation smoothly and efficiency, we use pressure pump to pressurize the tubing. The pressure of upstream A is 4 MPa; the pressure of downstream B, downstream C, and downstream D is 0.1 MPa. The negative-pressure wave and ambient temperature is 1100 m/s and 20°, respectively. Four pressure-measure nodes are installed in nodes 1–4. The sampling time is 9000 s with the sampling frequency is 100 Hz. The inlet flow rate is 0.15 m3/s. Moreover, a flow ball leak valve is installed in 10,000 m from upstream A to emulate the leaks with a flow rate of 0.01 m3/s. When the leakage simulation experiment runs for 20 min, the leakage valve is opened to simulate the leakage. Because the negative pressure wave generated by the leakage propagates along the pipeline, the pressure signal at each end of the pipeline changes. Therefore, we can obtain the pressure change signals of each end of pipeline for further analysis and processing. In this paper, 400 groups of pressure signals, which compose of pressure measure nodes 1–4, are selected in each working condition. In the EMD algorithm, we use the first and second IMFs to reconstruct the pressure signals. Thus, the pressure signals and denoising after the EMD at the end of a pipeline under diverse operating conditions are indicated in Figure 4.
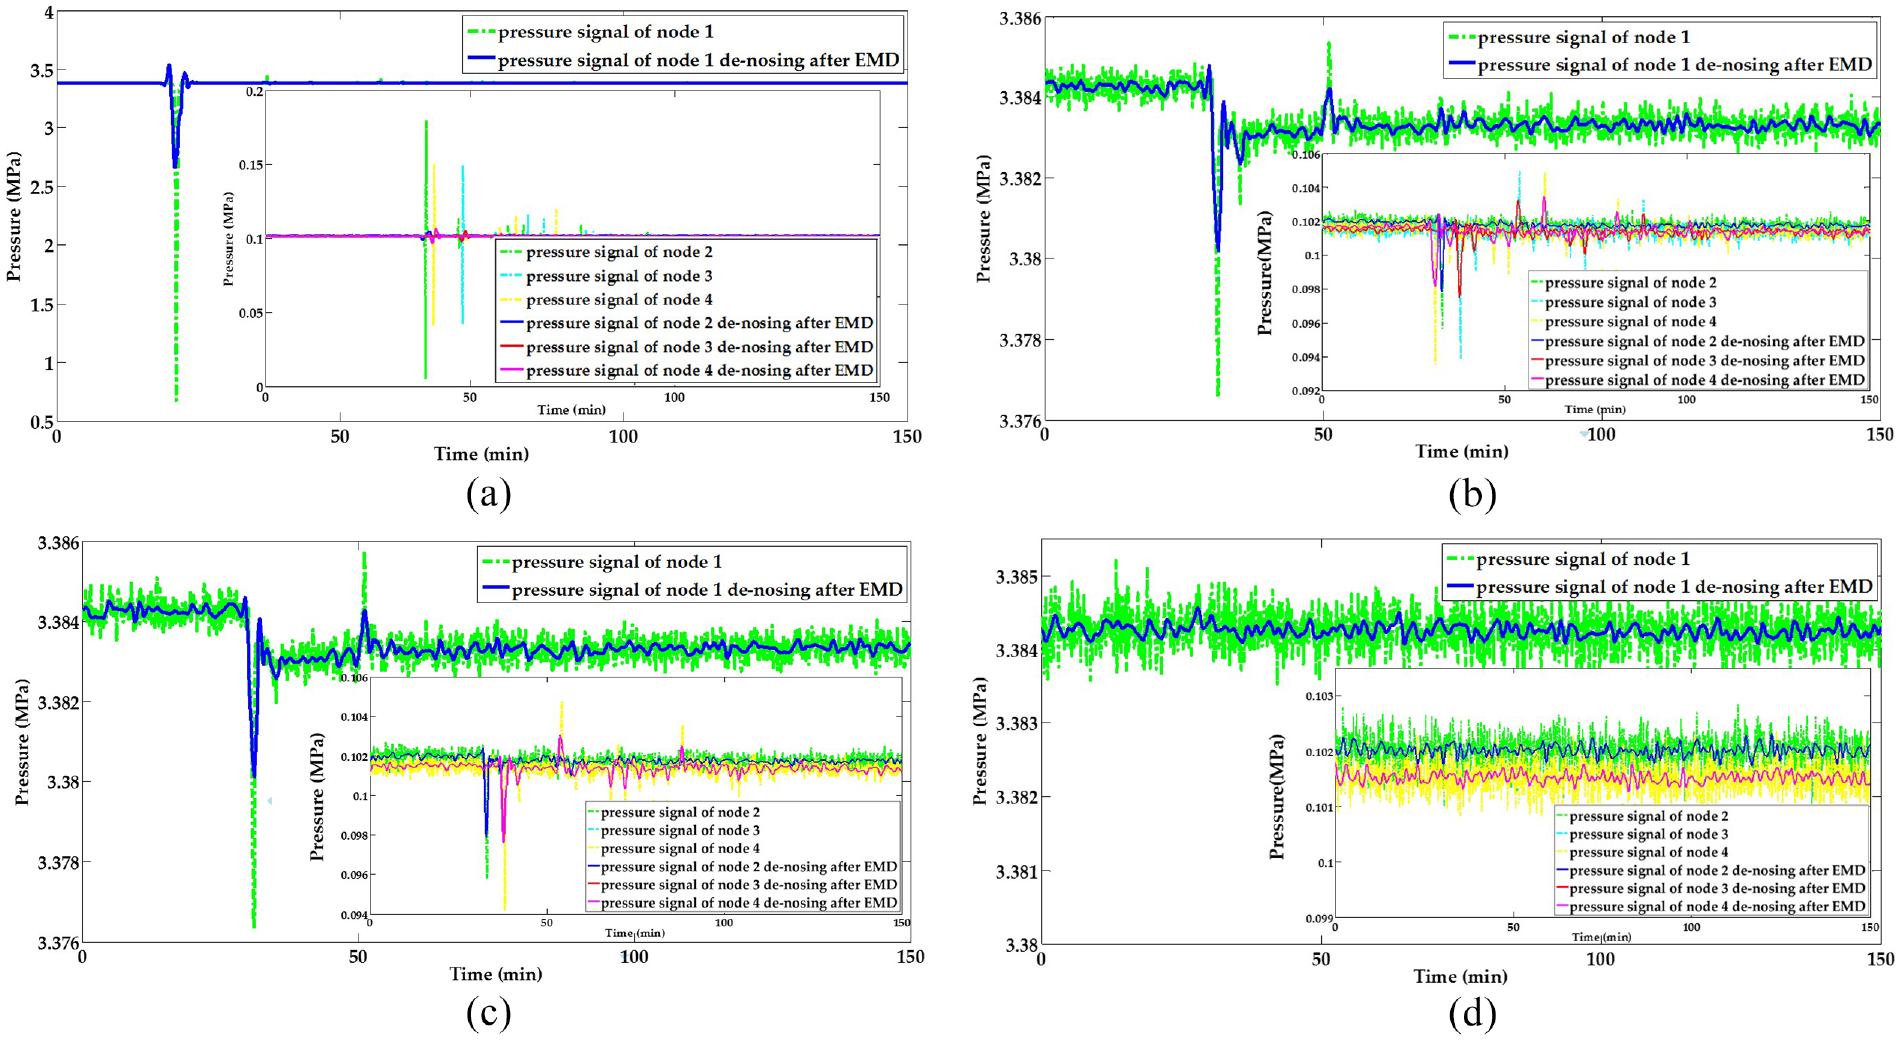
Pressure signals at the end of a pipeline under different working conditions. (a) Pressure signals at measure node 1 to measure node 4 under valve regulating condition. (b) Pressure signals at measure node 1 to measure node 4 under the pump start condition. (c) Pressure signals at measure node 1 to measure node 4 under leakage condition. (d) Pressure signals at measure node 1 to measure node 4 under normal condition.
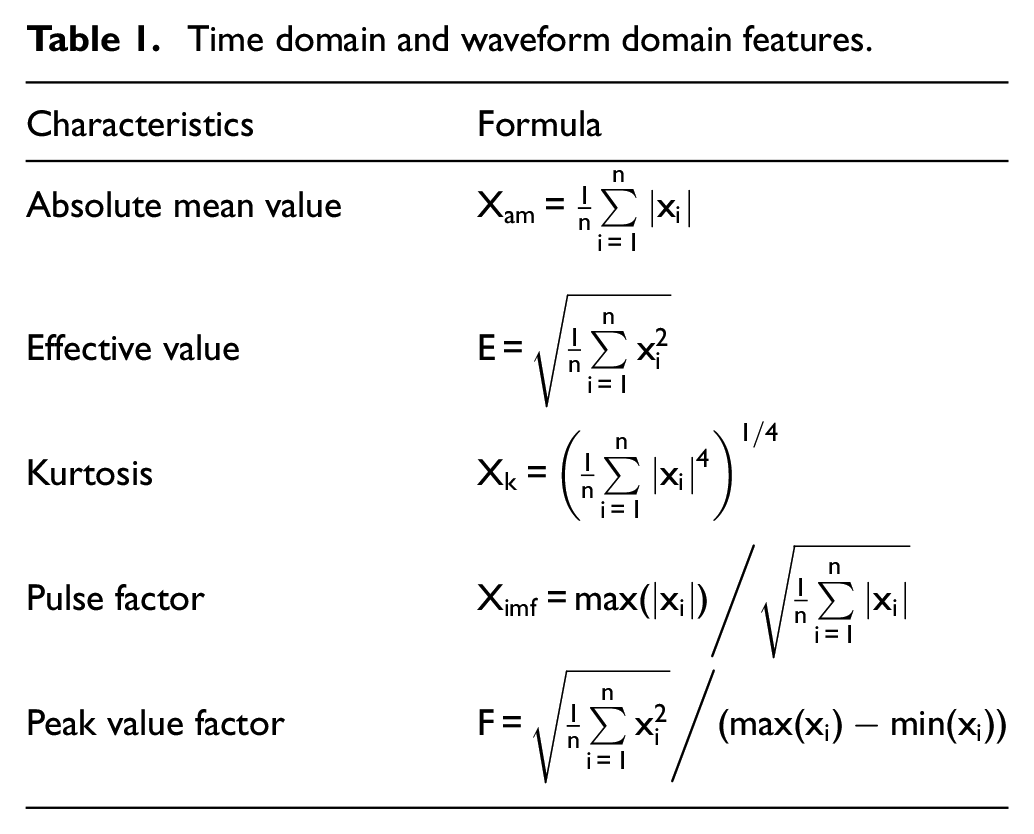
The pressure time domain and waveform domain contain rich information about the operating condition characteristics. The magnitude of pressure fluctuation can be expressed by the absolute mean value. The vibration energy of the pressure signals can be expressed by an effective value. The distribution of the pressure signal amplitude can be expressed by Kurtosis. The influencing characteristics of the pressure signals can be expressed by the pulse factor. The amplitude change of pressure signals can be expressed by the peak value factor. These characteristics listed in Table 1,
Time domain and waveform domain features.
Five pressure modes with waveforms and time domain characteristics are analyzed. Figure 5 shows one of the eigenvalues. The training samples are any 320 sets of eigenvectors, and the remaining eigenvectors are test samples.
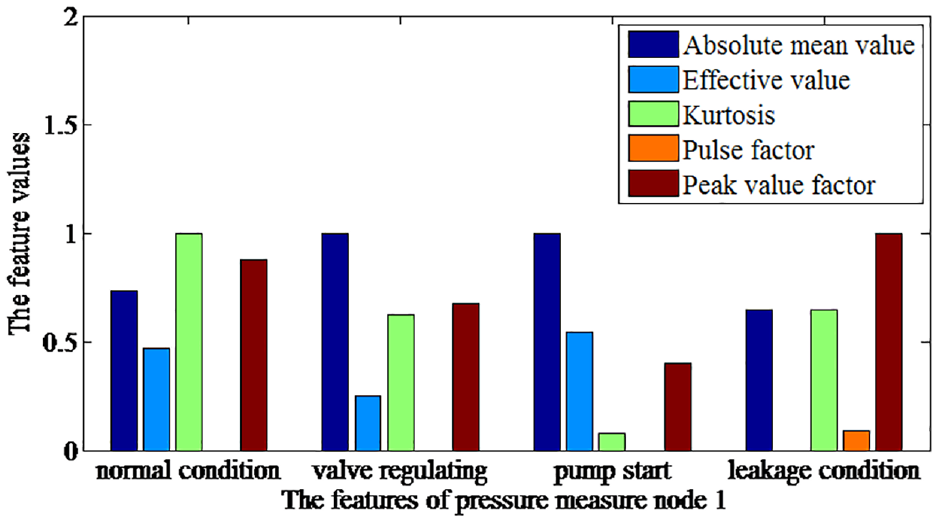
The features of pressure node 1 under different working conditions.
Five types of pressure patterns with time domain and waveform characteristics are analyzed respectively.
The features of valve regulating, pump start, and leakage condition are different under different pipeline working conditions. According to our analytical result, the DBN recognizes the pipeline leak conditions via raw data with the sampling size includes 3000 sample points, and the raw data is normalized from 0 to 1. To verify the signal processing the capability of the DBN method from the raw time domain signals, we use the DBN to identify various working conditions with the twin support vector machine (TWSVM), BPNN, and SVM as a comparison tool. In this simulation experiment, the raw pressure data are the inputs of the DBN, whereas absolute mean value, effective value, kurtosis, plus factor and peak value factor are input into TWSVM, SVM, and BPNN. In each condition, 80 sets of eigenvectors were selected, a total of 320 groups were selected as the training samples and samples, which were residual eigenvectors. We chose the DBN with three hidden layers to implement the multiclassifier. However, the most important condition to determine the number of units in the input layer is the sample size. We make the number of units selected from the first hidden layer to the third hidden layer be ready for 500, 200, and 50, and the number of units of the output layer is four (normal condition, valve regulating, pump start and leakage condition). The weights of the DBN can be arbitrarily initialized to set the deviation initialization to zero. The effect of DBN method to identify leak condition is shown in Figure 6.
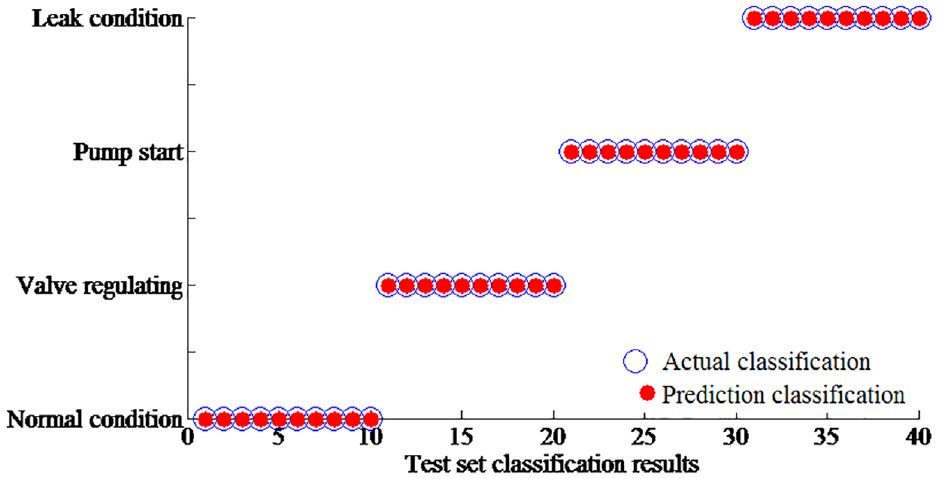
The recognition results under leak condition of DBN method.
According to the experimental conditions, the maximum iterations, batch size and learning rate is 10, 100, 0.1, respectively. In the TWSVM, the slack variable is set to
Comparison of the leak detection of the identification results and computation time of different methods.
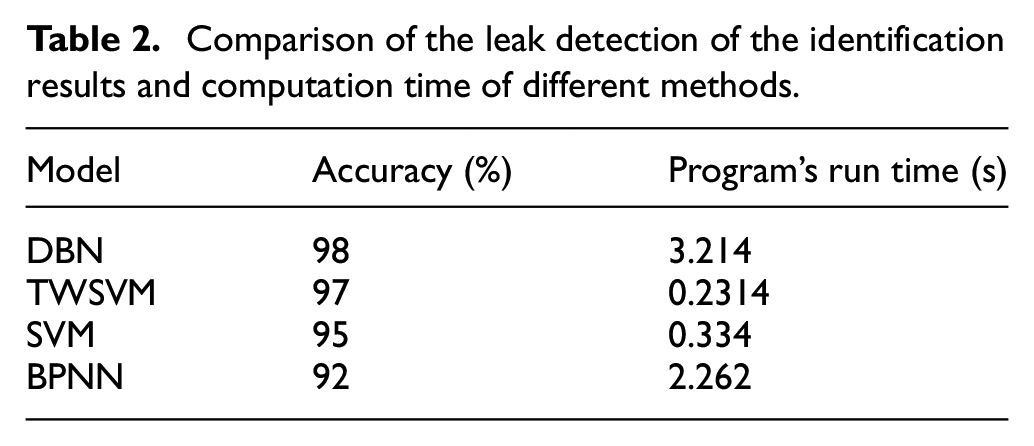
The recognition results of these 80 testing samples are in Table 2. The DBN recognition accuracy is 98% compared with the TWSVM, SVM, or BP leak recognition accuracy, which is 97%, 95%, and 92%, respectively. Additionally, running this program may take more time and effort. The results show that the DBN method can overcome the raw signal without prior experience, and different working conditions are recognized from the raw time domain signal. The above analysis shows that the DBN model is better than other models at identifying different working conditions from the raw data without feature extraction.
Conclusions
In this paper, the CPS technology is applied to monitor the operating conditions of long oil pipelines. Furthermore, the method for pipeline leak detection based on EMD and DBN was proposed. The EMD is applied to refine the measured pressure signals to obtain more meaningful leakage information. The selection of DBN classifiers can better avoid the basic indices selected according to artificial features, so the ideal performance of the leak condition recognition can be obtained. To explore the accuracy of the proposed method, it was compared with TWSVM, SVM, and BPNN. The experimental results show that the date obtained by this method are effective under the actual working condition data collected from a pipeline company. Meanwhile, it also shows that the model of the DBN can extract the features from the original signal and obtain higher identify accuracy. Moreover, the proposed method achieves higher classification accuracy than the traditional methods without depending on the feature extraction and feature selection. The effect of the sampling size of different working conditions based on deep learning neural networks will be studied in the future.
Footnotes
Declaration of conflicting interests
The author(s) declared no potential conflicts of interest with respect to the research, authorship, and/or publication of this article.
Funding
The author(s) disclosed receipt of the following financial support for the research, authorship, and/or publication of this article: This work was supported by “General project of scientific research of Liaoning Provincial Department of Education.” The fund number is “L2019025” and the project name is “the study on the oil mixing characteristics and wax deposition mechanism of long-distance pipeline mixing and transportation of waxy crude oil.” and Xingliao Talents Program of Liaoning Province(XLYC1907059).