
Abstract
As the multi-daily electricity consumption behaviors have the strong characteristics of dynamicity, nonlinearity and locality caused by temporal manifold structure, the existing methods are difficult to fine-grained and accurately classify it. To solve this problem, this paper proposes a hierarchical classification method based on the temporal extension of the neighborhood preserving embedding algorithm (TNPE) and Bayes. The input data are multi daily-load curves of a single consumer, including power-hour-day three dimensions, which contains the full information of the user’s consumption behaviors not only in hours, but also in days. Firstly, electricity consumption behaviors are divided into routine and non-routine types by k-means clustering algorithm. Secondly, the load feature mapping matrix of different industries is extracted through the TNPE, and each TNPE model can regard as one binary classifier, so the multi-classifier is constructed through multiple TNPE models. Finally, by converting the feature similarity between samples into probabilities, a Bayesian model is established to realize which the power consumption type belongs to. The case results show that this method can effectively recognize the local dynamic features in the temporal load data, and obtain a higher classification accuracy through a smaller number of training samples.
Keywords
Introduction
With the development of smart grids within an active power distribution network, the analysis of user behavior from massive user data becomes crucial for realizing and optimizing a multi-energy complementary system. Electricity consumption behavior reflects the electricity consumption patterns in various fields relevant to the national economy and provides an important basis to the power grid for analyzing electricity consumers.1,2 However, while huge amounts of data have been accumulated in different information systems under the electric power sector, the value of such data has yet to be fully utilized.3,4 The categorization of power consumers effectively using the data-driven approach is an issue of wide concern for data mining in the current smart grid system. 5
The characteristics of electricity consumption are most directly reflected by the load curve. Therefore, it has been the major research object for analyzing the electricity consumption behavior. 6 The load curve can be analyzed using either clustering or classification. Examples of typical clustering algorithms include the fuzzy C-means clustering, 7 k-means clustering, 8 density-based clustering, 9 and consensus clustering. 10 Yang et al. 11 proposed the k-shape clustering algorithm based on load shape, which is to detect different levels of building energy consumption patterns, and further use the clustering results to improve the accuracy of the prediction model. Xiang et al. 12 proposed a shape clustering method based on the segmented slope to solve the problem that the Euclidean distance as a measure of similarity is not enough to reflect the shape similarity of the load curve. In order to cluster the load curve data more accurately, Iglesias and Kastner 13 proposed a new method to calculate the Pearson distance, which helps to maintain the overall and local similarity of the load profile. The clustering algorithms are unsupervised learning methods for data processing; Also, clustering result requires people to define the category. The classification algorithms offer a supervised learning approach to process the data. Besides, classification results do not require people to define the category. Examples of typical classification algorithms include multilayer feedforward network (MFN), 14 artificial neural networks (ANN), 15 support vector machine (SVM),16,17 and extreme learning machine (ELM).18,19 Kim and Lee 20 adopt the Multi-Feature Combination that one of feature extraction techniques commonly used in audio signal processing to process power signals and select the Multi-Layer LSTM network as the classification model for further improvements. In Yang et al., 21 a new semisupervised multilabel deep learning-based framework is proposed to mitigate the reliance on large labeled datasets. Varga et al. 22 proposed a load profiles management software frame-work for encoding and classification in real-time, which tolerates defects and time shifts in input, so as to always provide accurate, fast, and reliable output.
Some researches analyze the consumption behavior based on the single daily-load curves in the power-hour dimensions. However, there is a stronger dynamic correlation between daily electricity consumption behaviors in the local time domain, and multi daily-load curves in the power-hour-day dimensions can more accurately reflect the user’s behavior information. Generally, multivariate statistical methods are used to reduce the redundancy and extract the true structure of the data. Compared with principal component analysis (PCA), 23 independent component analysis (ICA), 24 canonical variable analysis (CVA), 25 etc., TNPE allows obtaining the global data feature from the local geometric structure and the temporal characteristics. 26 Therefore, TNPE can more effectively extract the dynamic, non-linear, and local characteristics of the load data.
In this paper, a classifier based on TNPE and Bayes is proposed to identify the electricity consumer industries. Feature detection by TNPE algorithm can be regarded as a binary classifier, so the multi-classification can be constructed by multiple TNPE models. This paper mainly has the following three contributions. Firstly, the daily load data are divided into routine behaviors and non-routine behaviors by using the k-means algorithm based on Pearson correlation coefficient. Secondly, the load feature mapping matrix of different industries is extracted through the TNPE, and each TNPE model can regard as one binary classifier, so the multi-classifier is constructed through multiple TNPE models. Finally, by converting the feature similarity between samples into probabilities, a Bayesian model is established to realize which the power consumption type belongs to.
The organization of the rest of this paper is as follows. In section 2, the dynamic, nonlinear, and local characteristics of electricity consumption behaviors are analyzed. Section 3 briefly introduces the basic theory. Section 4 introduces the specific training and classification steps of the classification model proposed in this paper. OpenEI dataset is utilized for case studies in Section 5 to demonstrate the feasibility of the proposed approach. Finally, the conclusions are presented in Section 6.
Problem statement
Dynamic characteristic of electricity consumption
The load curve has been considered as the main research object for analyzing the electricity consumption behavior. Generally, the consumption characteristics of users are analyzed through the single daily-load curve as shown in Figure 1(a), which including power-hour two dimensions. However, consumption behavior usually has dynamic daily characteristic, and a single daily-load curve cannot reflect the full characteristics of users. As shown by the multi daily-load curves in Figure 1(b), which including power-hour-day three dimensions. Within the time neighbor of
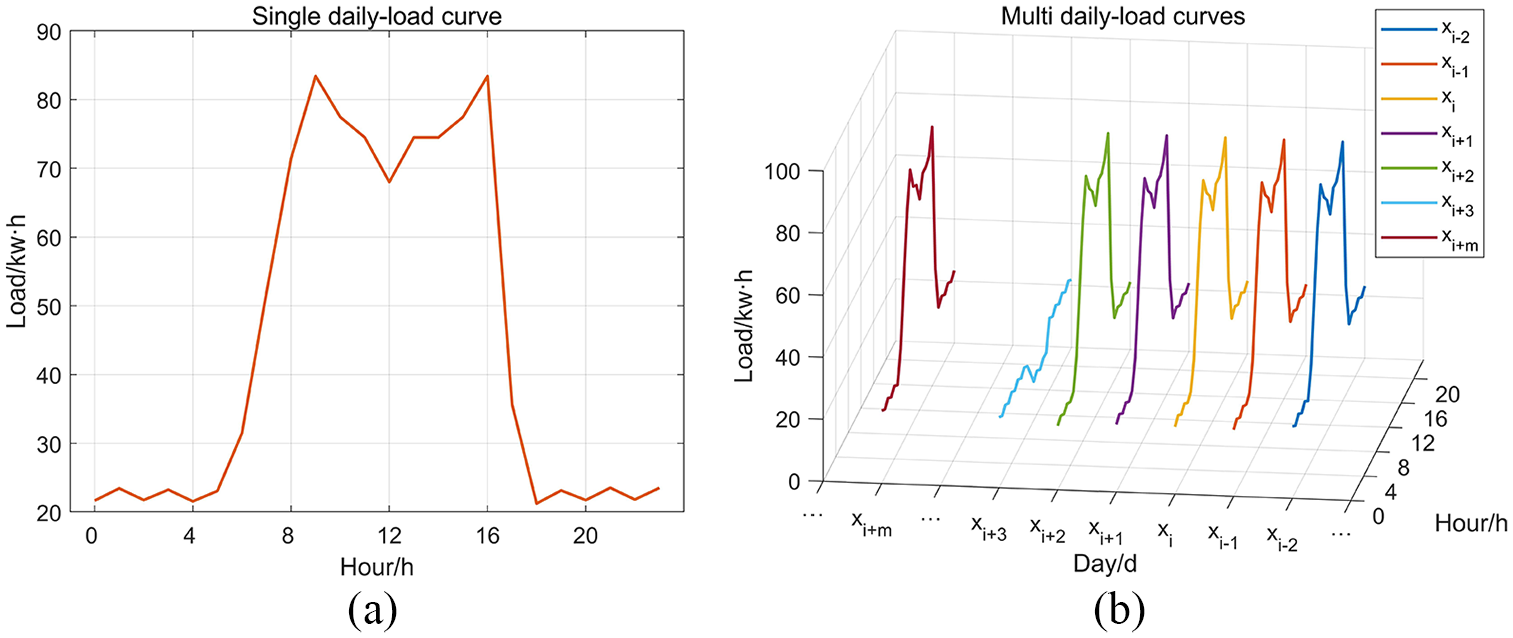
Dynamic characteristic of daily-load curve: (a) single daily-load curve and (b) multi daily-load curve.
Nonlinearity and local characteristics of electricity consumption
Due to the load data is one temporal series, the samples in the time neighbors have stronger correlation. This means that the user’s electricity consumption behaviors pay more attention to the local feature information of the load data. As shown by the daily load curve in Figure 2(a), Point A and point B are the power consumption values at 7:00 and 11:00 in a day, and there is a peak during these two moments. If the electricity consumption behavior analysis is applied by a global method, such as by the geodesic Path 1, it can only be concluded that the electricity consumption at 11:00 is higher than 7:00, but the fact that the electricity consumption peak exists is ignored. However, if the behavior analysis use a local method, such as by the manifold Path 2, the actual electricity consumption information can be fully reflected. Therefore, the load curve has characteristics of nonlinearity and locality. Similarly, when performing dynamic electricity consumption behavior analysis in the multi daily-load curves as shown in Figure 2(b), the real consumption behaviors between A and B is not represented by the geodesic path 1, but by the manifold path 2. So it is clear that nonlinearity and local characteristics of electricity consumption are caused by the manifold structure of it.
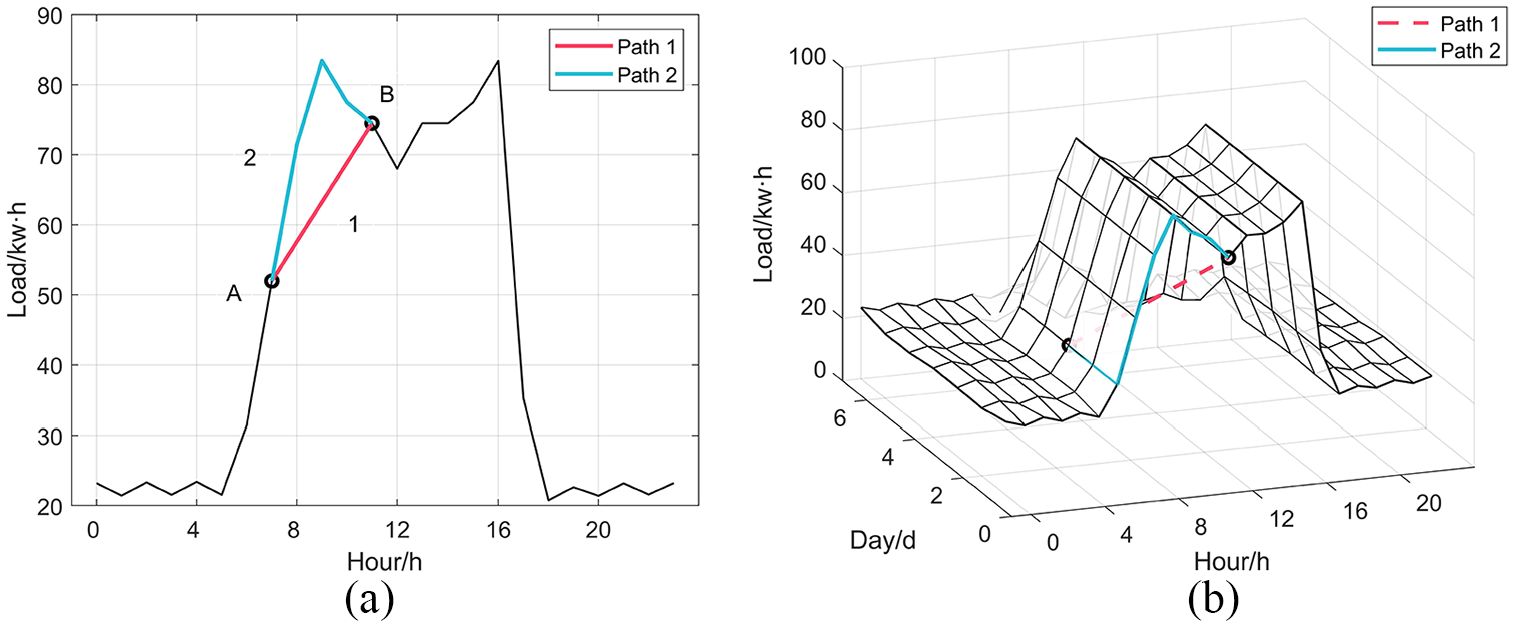
Nonlinearity and local characteristics of daily-load curve: (a) single daily-load curve and (b) multi daily-load curves.
Basic theory and analysis
The TNPE algorithm
Through the analysis in section 2, the dynamic, nonlinear, and locality exist in electricity consumption behavior, and the load data has a manifold structure. Hence, the classification problem of electricity consumption behaviors based on the multi daily-load curves should be solved by the manifold learning algorithm. Manifold learning, a branch of nonlinear dimensionality reduction, has become a hot topic in the field of information science since its proposition.
27
The TNPE algorithm has been proposed in a past study to enable the effective extraction of dynamic local features in multivariate temporal data through manifold learning.
28
TNPE allows the original data
Suppose data
The ultimate objective of the TNPE algorithm is to find

where
Considering that
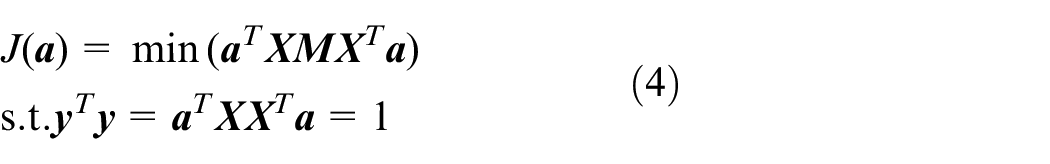


Equation (4) can be transformed into a constrained optimization problem using the method of Lagrange multipliers. The solution can then be obtained using the generalized eigenvalue decomposition method, which yields the following:

To ensure that the information of the characteristic structure is minimized after data mapping, the eigenvectors associated with
The feature extraction capability of the TNPE algorithm is related to three parameters, namely, the size of the time window
Define of feature similarity
According to the introduction in section 2.1, a single daily load curve cannot reflect the user’s dynamic behavior characteristics. For feature detection purpose between two periods of the multi-daily load curves, the
where data
Feature similarity coefficients are defined to describe the level of similarity. For the convenience of description,
where
Therefore, the feature similarity
where
Hierarchical classification method based on TNPE and Bayes
Figure 3 briefly introduces the framework of hierarchical classification based on the TNPE and Bayes. According to section 3.2, feature detection can regard as a binary classifier. Then in order to achieve multiple classifications, the “one-against-the rest” strategy is adopted. Therefore, the
Separation model: electricity consumption behaviors are divided into routine and non-routine types by k-means clustering algorithm based on the Pearson correlation coefficient
Hierarchical training model: the binary classifiers of different electricity behaviors in each industry are trained through the TNPE algorithm.
Hierarchical classification model: the multi-classifier is combined by multiple binary classifiers, and a Bayesian model is established to realize the user’s consumption type.
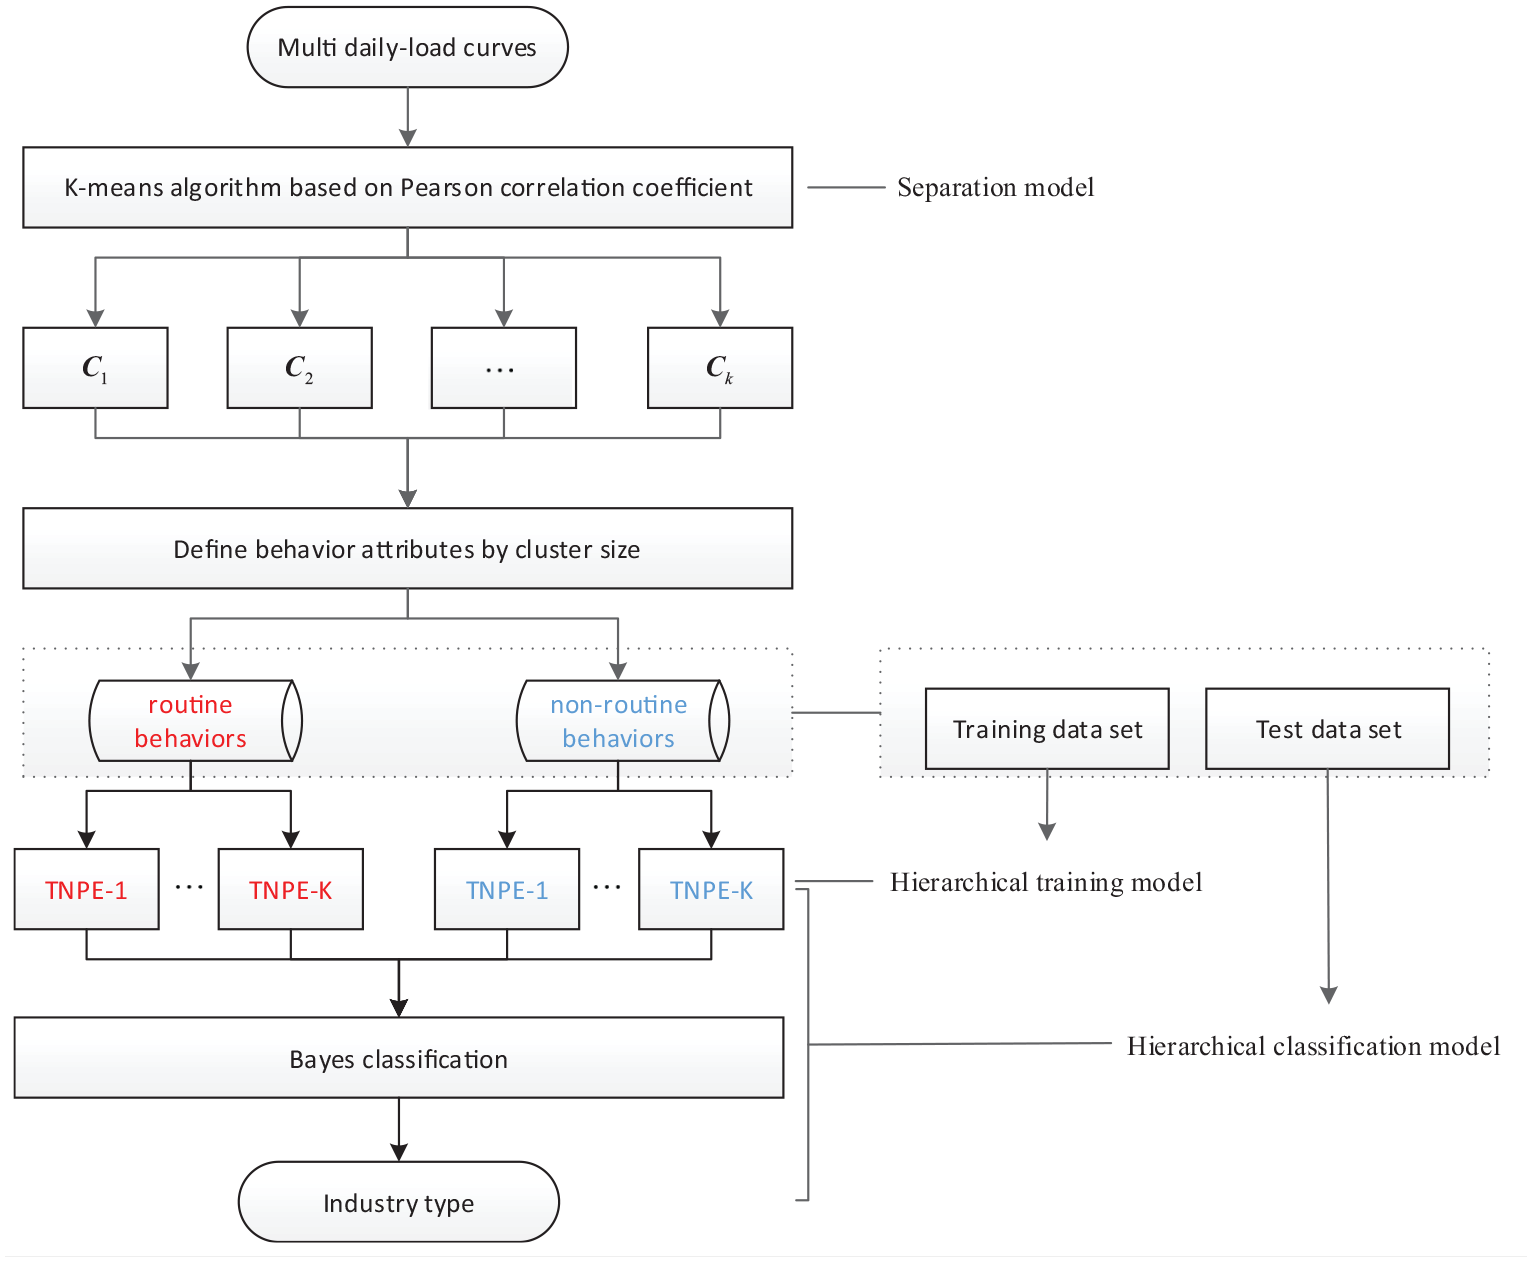
Diagram of hierarchical classification based on the TNPE and Bayes.
A supervised dimensionality reduction model is shown in Figure 4, satisfying
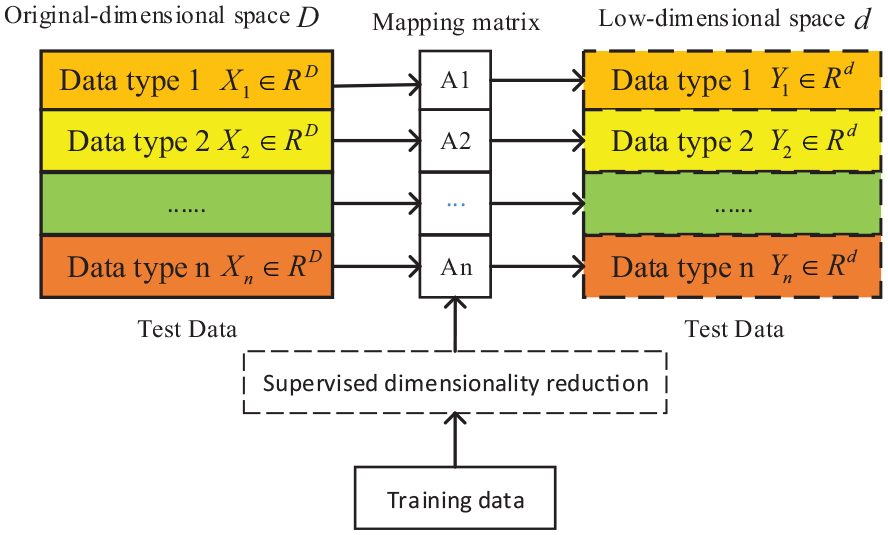
Supervised dimensionality reduction.
By projecting different types of data into the low-dimensional spaces through different mapping relationships, the homogenous structural features are minimized between different types of data. However, the type of mapping relationship cannot be known in the supervised dimensionality reduction classification model. Figure 5 shows the basic principle of obtaining the type based on feature statistics in an ideal situation. According to the discussion in section 3.2, if the test sample has a similar feature structure as the training model, then the test sample can be considered the same type as the training model when the feature statistics (
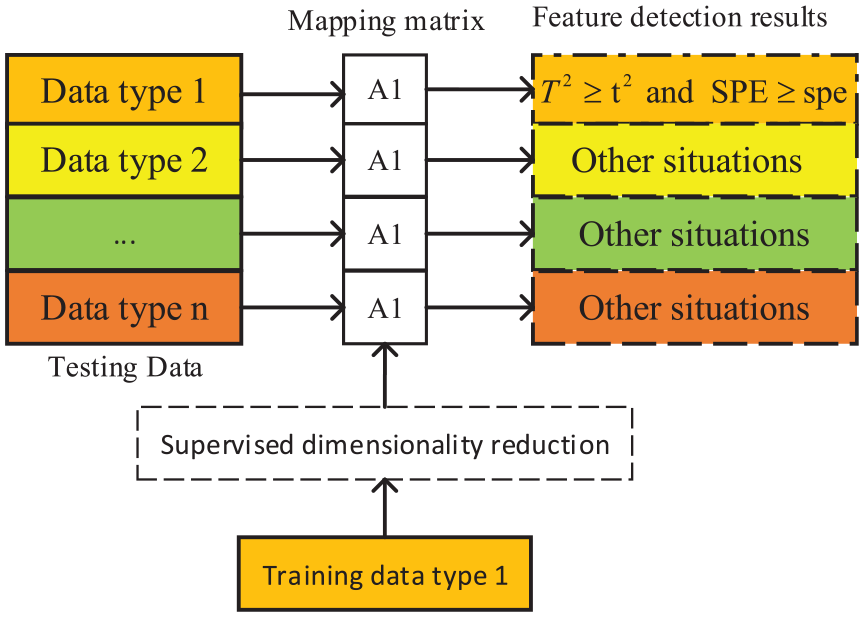
Principle of data type prediction based on feature statistics.
Separation model
K-means is an unsupervised clustering algorithm. The objective of k-means algorithm is to form
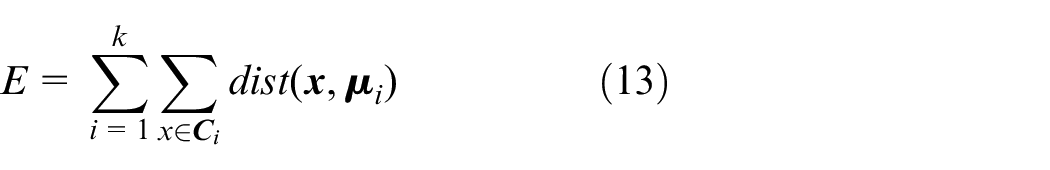
where
During the k-means clustering process, the distance
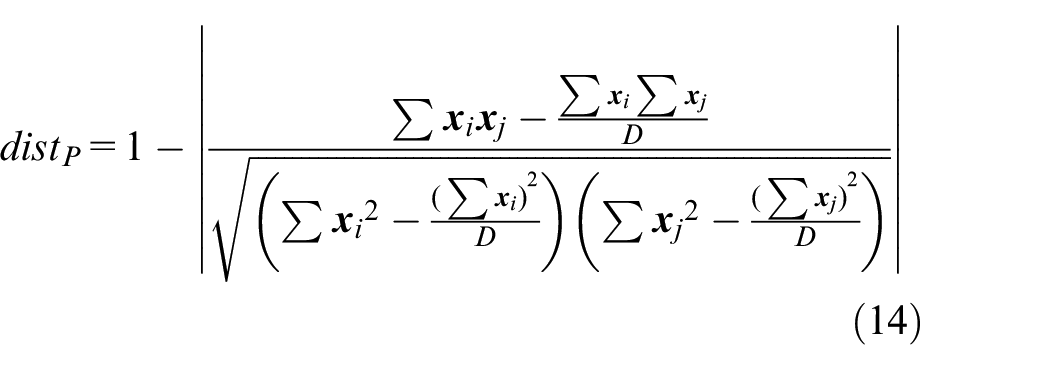
where
The original temporal load data are separated into multiple temporal load subsets by using the k-means algorithm based on the Pearson correlation coefficient:

where
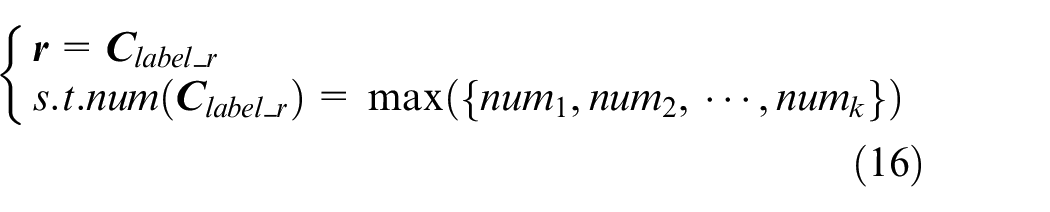
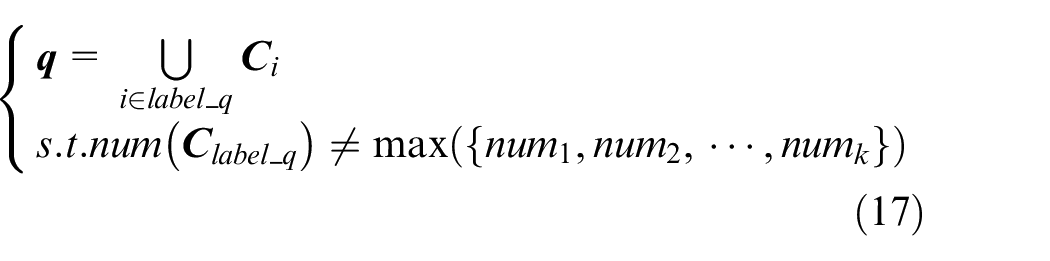
In this paper, the cluster with the largest sample size is defined as the routine behaviors, and the remaining clusters are regarded as non-routine behaviors. Let
Hierarchical training model
The objective of the hierarchical training model for electricity consumption behavior is to extract the characteristics of electricity consumption behavior through an optimized selection of training samples. The flowchart of the training model is shown in Figure 6. The model consists of two processes, namely, offline modeling and online training. The offline modeling will extract the electricity consumption characteristics of a user in the corresponding category. The online training will then update the electricity consumption characteristics of the sample library in the offline modeling process. Selecting preferential training samples through online training will prevent not only the overfitting caused by the incomplete extraction of structural features from the data, but also the extraction of redundant structural features due to the excessive size of the sample library.
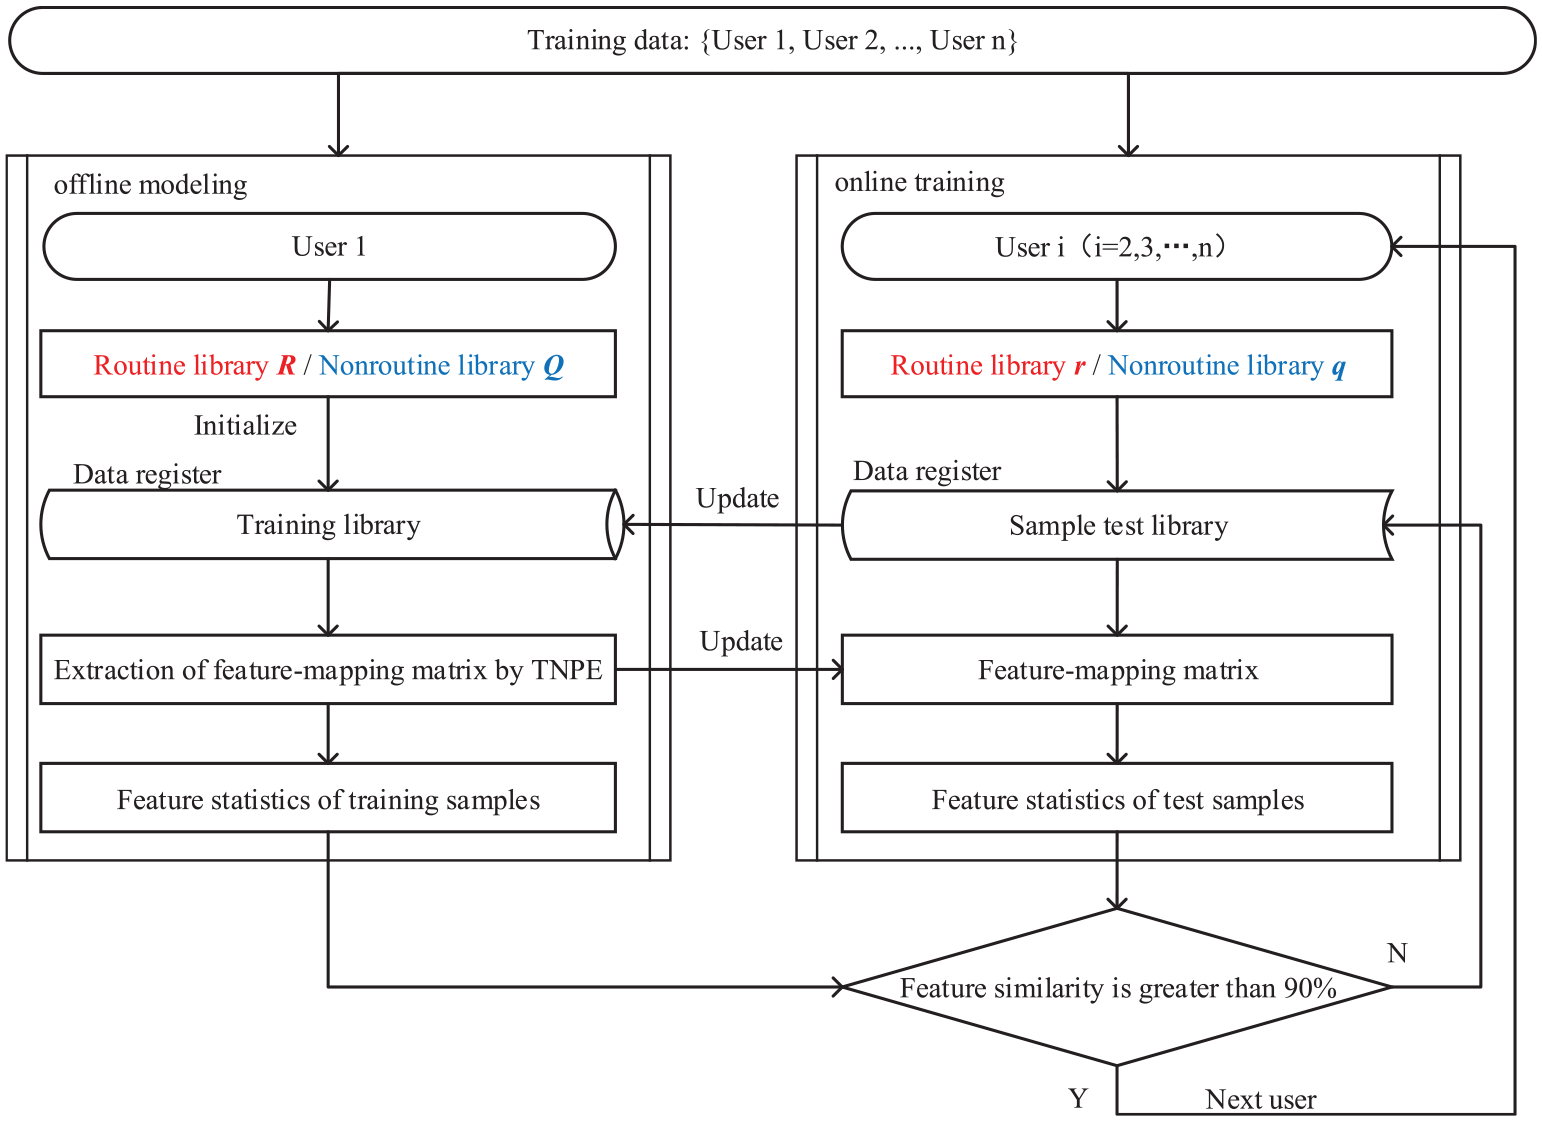
Hierarchical training model for electricity consumption behavior.
The detailed procedures for offline modeling are described as follows:
Separation of electricity consumption behaviors. The electricity consumption behavior of the first user is separated in the training data according to section 3.1 for initializing the sample training libraries
Extraction of feature-mapping matrix in the sample library. The feature-mapping matrices
Calculate the feature statistics. The feature statistics (
The detailed procedures for online training are described as follows:
Separation of electricity consumption behaviors. The electricity consumption behaviors are separated based on the load data of the new user analyzed in the offline modeling process. The sample sets
Calculation of feature statistics. The test data are projected onto the low-dimensional feature space according to the feature-mapping matrices
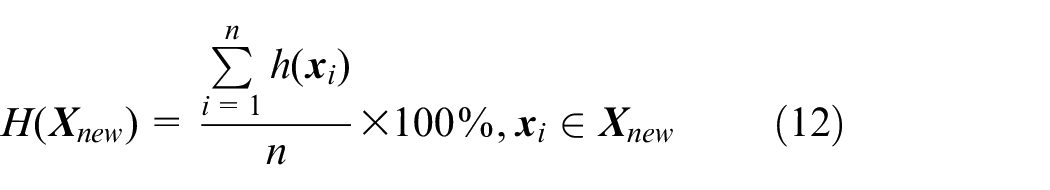
Verification of the update of the training sample library. The level of feature similarity between the training model and the test data is calculated according to equation (12). If the feature similarity of the electricity consumption behavior from the new user is less than 90%, then this sample will be updated to the corresponding sample training library through the data register. Furthermore, the feature-mapping matrix

where
The structural feature of the user’s consumption behaviors mainly refers to the shape of the load curves, and it has scale changes, displacement changes, and noise changes.
Scale changes
There are differences in the scale of the load curve. For example, the load curve
Displacement changes
The phase between the load curves has a certain deviation, such as
Noise changes
When two load curves have similar shapes, but are interfered with by different degrees of noise, the similarity between the two remains unchanged.
The update of the training sample set will only be triggered by the occurrence of new structural features in the electricity consumption behavior from a user in the corresponding industry. Therefore, the relationship between the structural features of the training samples in each training round is given as follows:

where
The original structural features of the data in the training samples are used as the local components of the updated training samples. The original samples can still be tested effectively using the feature detection statistics
Hierarchical classification model
The hierarchical classification model for electricity consumption behavior seeks to identify and classify the electricity consumption features. The flowchart of the model is shown in Figure 7. The feature similarity can be converted into probability based on the statistical characteristics of feature detection. The priori probability can be converted into a posterior probability through the Bayes classification model. 30
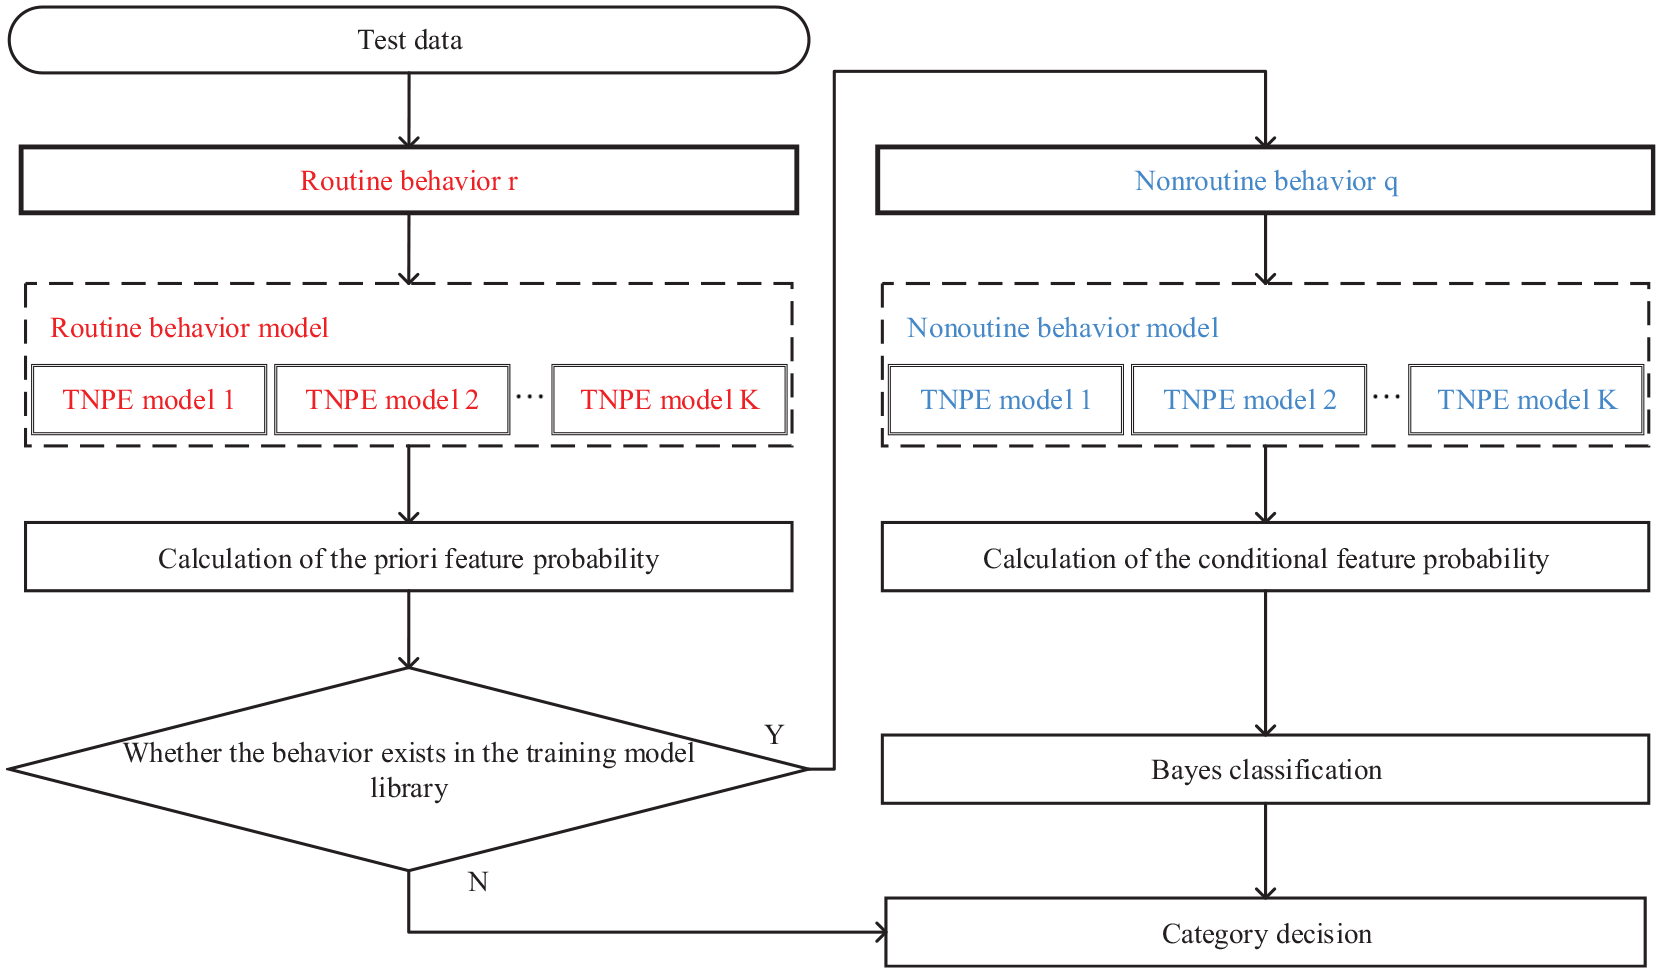
Hierarchical classification model of electricity consumption behavior.
The probability of classification into a specific category can then be calculated based on the known features. The Bayes classification model is expressed as follows:
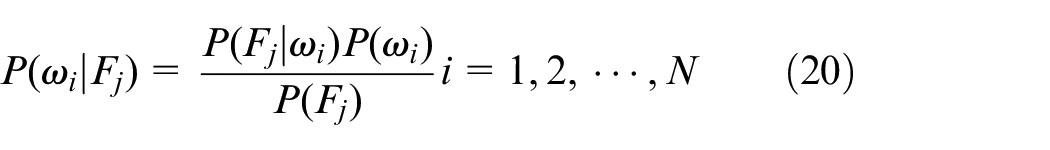
where
The detailed procedures of hierarchical classification (H-TNPE-Bayes) model are described as follows:
(1) Separation of electricity consumption behaviors. The routine electricity consumption behavior
(2) Calculation of the priori feature probability. The feature similarity
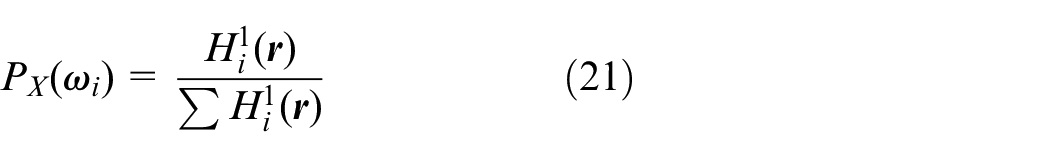
where
(3) Calculation of the conditional feature probability. Calculate the feature similarity
where
(4) Bayes classification. As shown in equation (20), knowing the probability of the electricity consumption feature
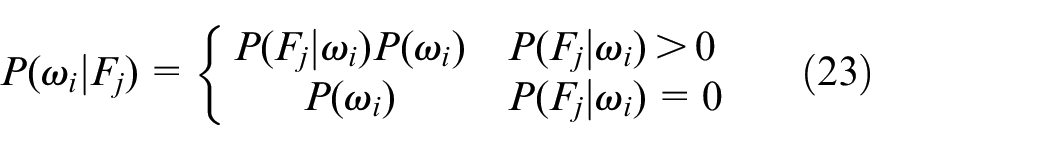
(5) Category decision. The category with the highest probability is the user’s industry label.

where
Case analysis
Experimental environment
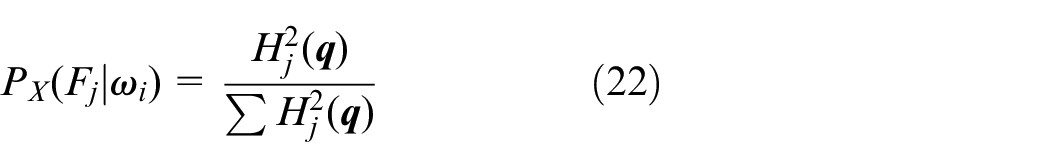
The commercial user load data released publicly on the website of the US Department of Energy (OpenEI, https://openei.org/datasets/files/961/pub) are used to validate the effectiveness of the model proposed in this paper. Each set of data comprises 365 days of electricity load information for 16 industries collected at a sampling time of 1 h over 1 year. In this study, 584,000 sets of load data were considered as the training samples, whereas another 584,000 sets of load data were used as the test samples. The classification performance is evaluated based on three indicators, namely, the classification accuracy (CA), the classification average accuracy (CAA), and Macro F1-measure (Macro-F1):
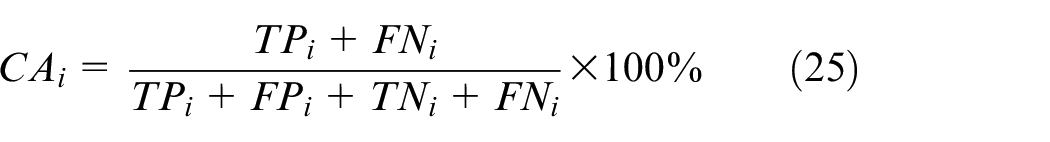
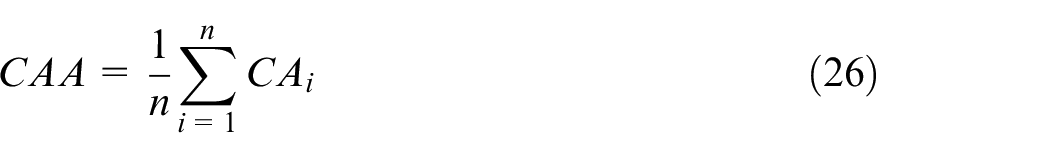
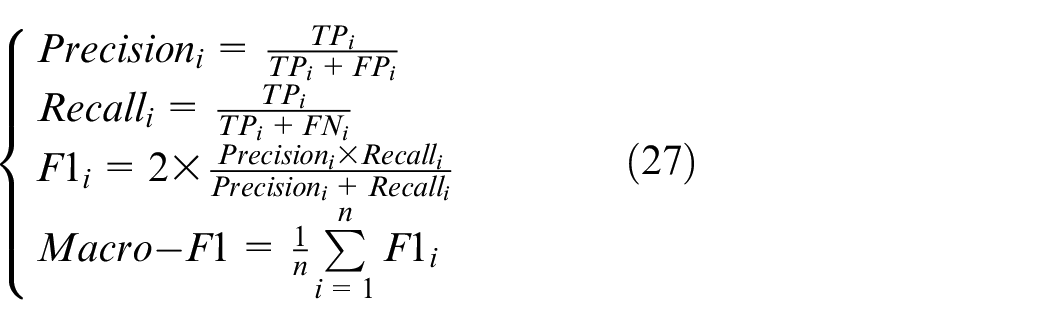
where
CA reflects the effectiveness of the classification of the proposed model for various industries. CAA provides a comprehensive measure for the classification performance of the proposed model for all industries. Macro-F1 can reduce the impact of categories balanced, and reflect the performance of the classifier with precision and recall.
Comparison of performances between different classification models
The TNPE algorithm is a dimensionality reduction algorithm based on supervised learning. To validate the effectiveness of the TNPE algorithm, we compared its performance with that of principal component analysis (PCA), which is an unsupervised dimensionality reduction algorithm. In addition, the effectiveness of the Bayes classification method based on feature detection was validated by comparing it with the ELM described in a past literature study. 17 In this study, the industries associated with the electricity users are classified based on the daily load data of the users over one year. However, the original classification result obtained from the ELM is based on the daily load data for a single day. Therefore, the condition for realizing industry classification through the ELM is given as follows:

where
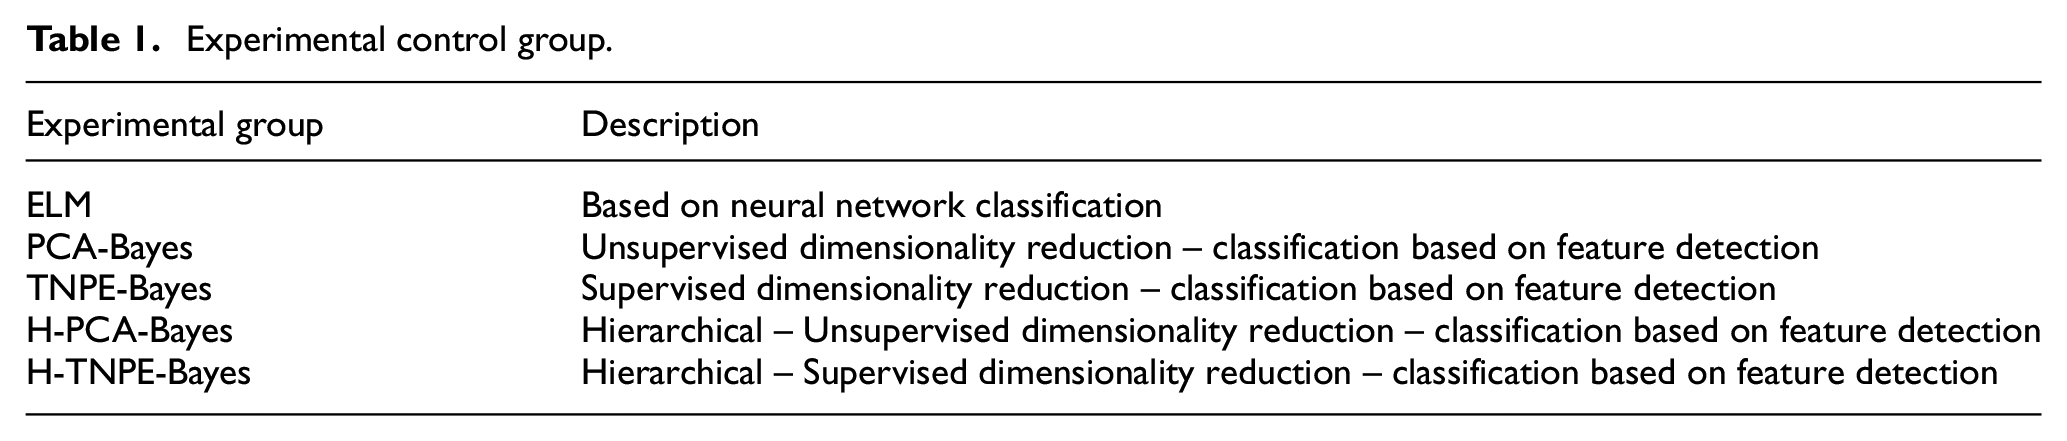
Both the TNPE and PCA algorithms work by first projecting the original data to the low-dimensional space through dimensionality reduction, then converting the classification problem into a probability issue based on feature detection, and finally realizing the classification through the Bayes model. However, the mapping of data structural features and the output of classification results are achieved through neural networks in the ELM. Therefore, the detailed configuration of the comparative experiments conducted in this study is summarized in Table 1. During the comparative experiments, an S-type activation function is employed by the ELM algorithm along with 60 hidden nodes. The number of variables reduced by the dimensionality reduction is set as four in the PCA algorithm. The size of the time window, the magnitude of the neighborhood impact factor, and the number of variables reduced by the dimensionality reduction are set as 5, 0.4, and 4, respectively, in the TNPE algorithm.
Experimental control group.
While PCA is an unsupervised dimensionality reduction algorithm, the classification is still based on feature detection, which requires the extraction of the feature statistics from the training samples. Therefore, the five groups of classification models used in the comparative experiments are all supervised models. The other classification models except ELM use the online training method in the 4.2 section to reduce the training dataset. The numbers of training samples used in the experiments are shown in Figure 8. As PCA-Bayes, TNPE-Bayes, H-PCA-Bayes, and H-TNPE-Bayes can use the training structure described in section 3.3 to optimize the sample selection without affecting the feature detection of the previous samples, the sizes of the training samples are greatly reduced in these methods compared with that in the ELM. Furthermore, the selection of preferential training samples allows the detection of whether the structural features of the data have changed. Compared with the PCA-Bayes and TNPE-Bayes classification models, the H-PCA-Bayes, and H-TNPE-Bayes classification models require a much smaller training sample size due to the application of the divide-and-conquer algorithm. Thus, the strategy of separating electricity consumption behaviors can reduce the complexity of the structural features of the data effectively.
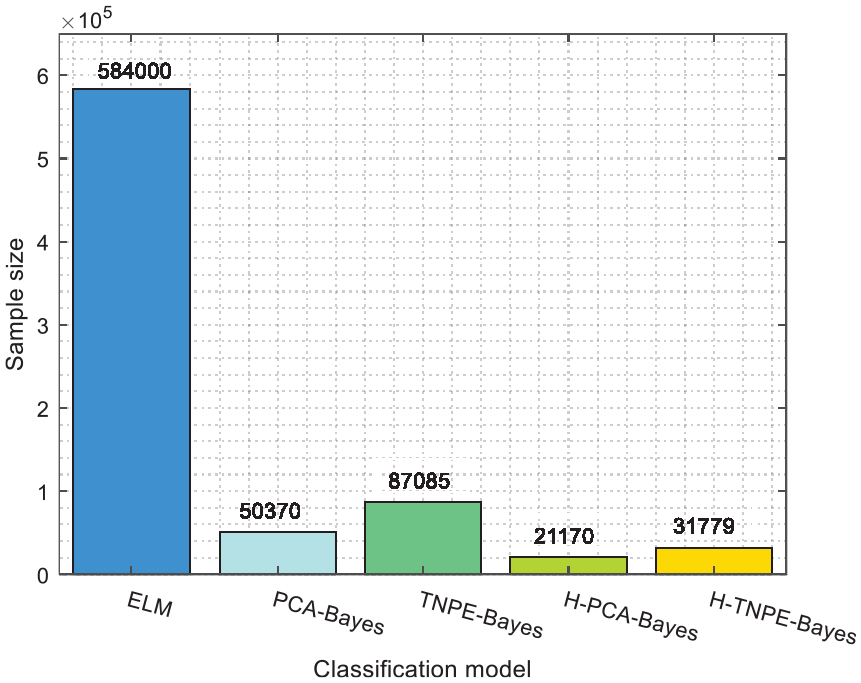
Training sample size of each classification model.
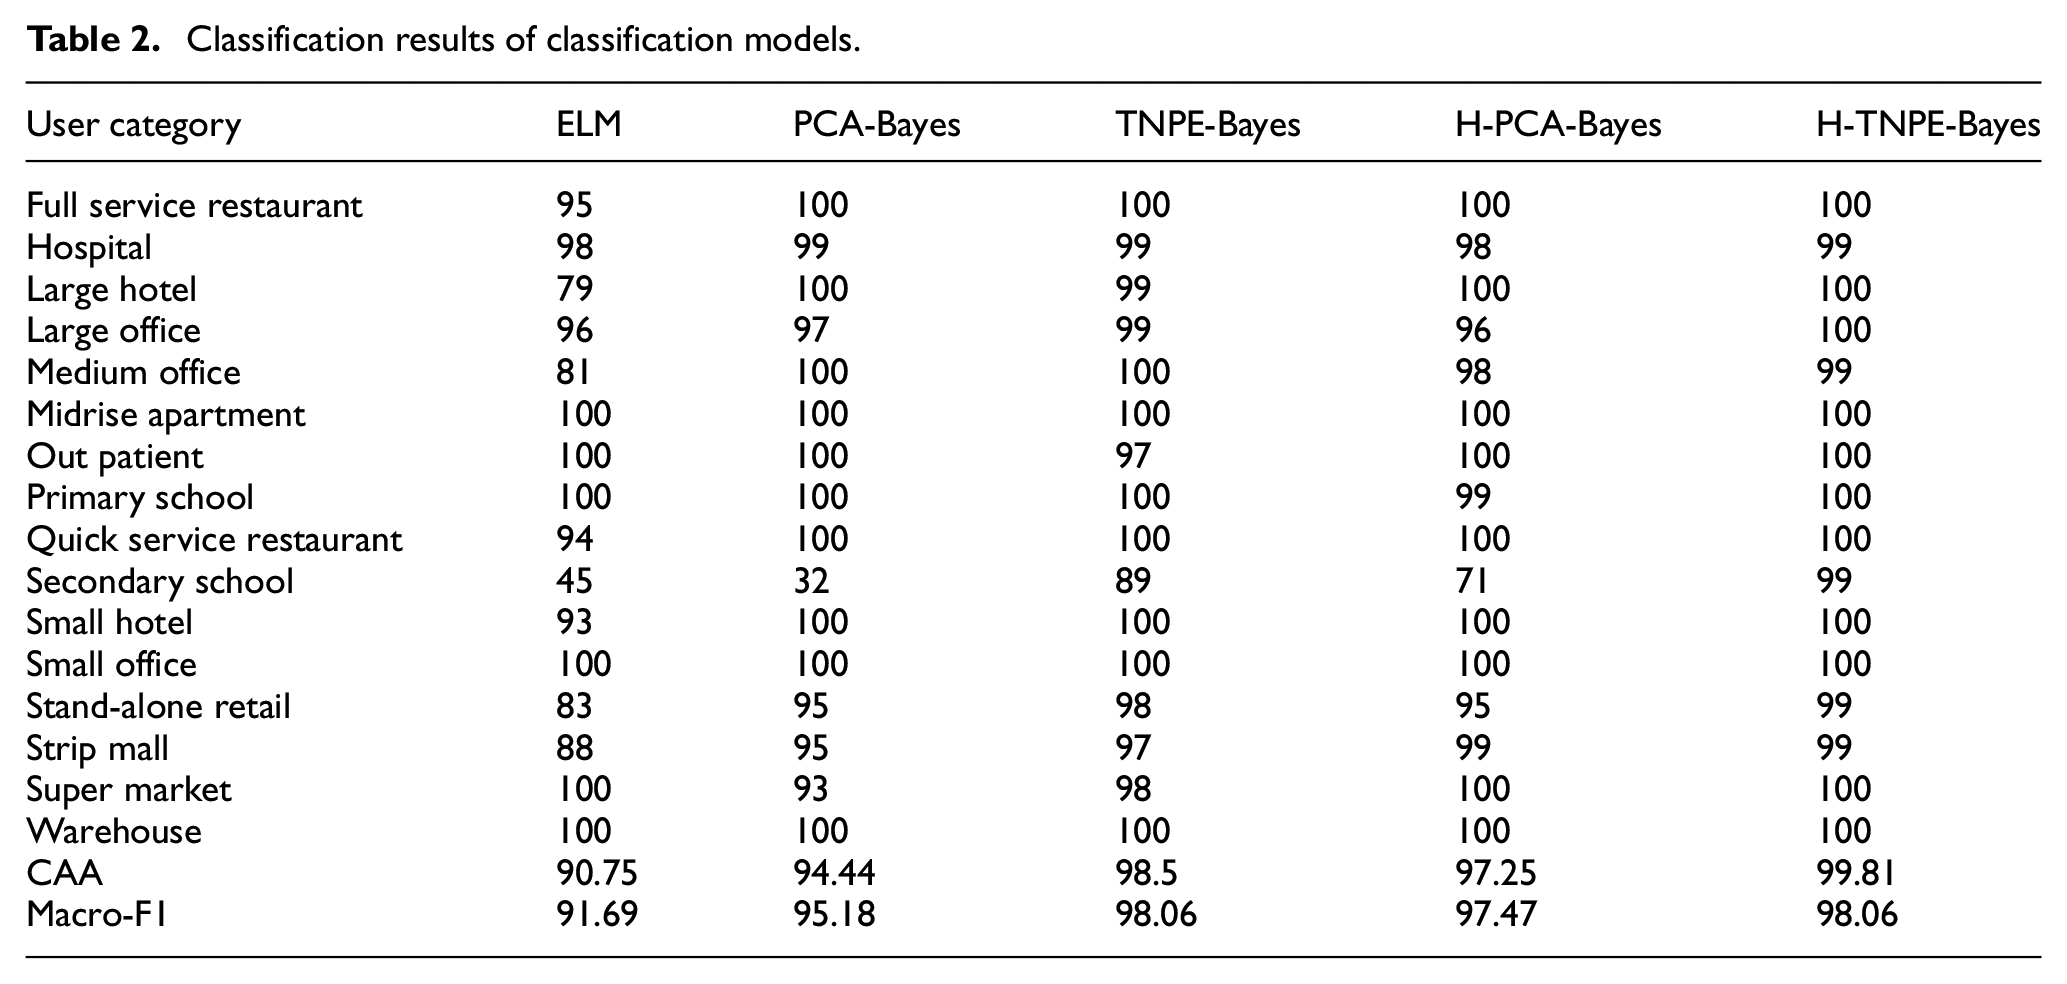
Table 2 shows the classification results of the five classification models. By reflecting on the CA of each industry, ELM performs poorly in the classification of several industry types, such as Large Hotel, Medium Office, Secondary School, Stand-alone Retail, and Strip Mall, compared to the four classification models. H-TNPE-Bayes can effectively and accurately distinguish all 16 industry users. Besides, the five classification models have the most significant performance on the difference in the recognition ability of Secondary School users. Reflected by CAA indicator, H-TNPE-Bayes performed the best, while ELM performed the worst. H-PCA-Bayes and H-TNPE-Bayes can effectively improve the classification ability of PCA-Bayes and TNPE-Bayes by adopting the strategy of separating electrical behavior. By observing the Macro-F1 indicator, the performance of H-TNPE-Bayes and TNPE-Bayes is the best, indicating that compared with traditional linear and static multivariate statistical algorithms, manifold learning can extract more data information.
Classification results of classification models.
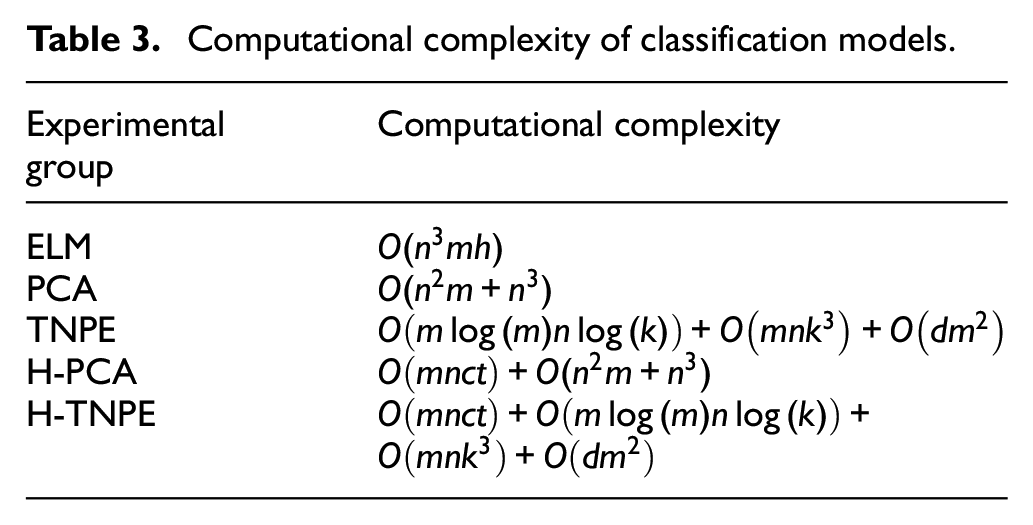
For a set of
Computational complexity of classification models.
Result analysis
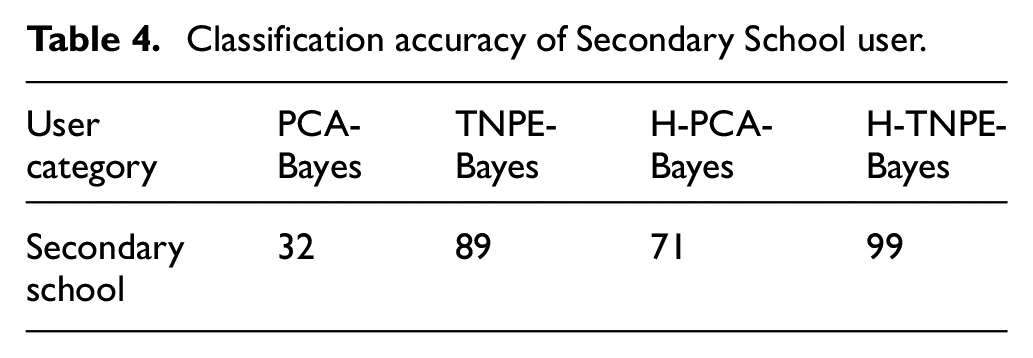
The method proposed in this paper based on feature detection, so whether the ability to extract the feature structure of the data effectively will affect the final classification result. Since the classification mechanism of ELM is different from the other model, this section mainly analyses the feature extraction capabilities of PCA, TNPE, H-PCA, and H-TNPE in load data. Table 4 shows the classification accuracy of Secondary School users, the four models have the most obvious differences in the performance of this type. Therefore, this paper selects Secondary School users to analyze the classification results.
Classification accuracy of Secondary School user.
As shown in Figure 9(a) and (b), the daily-load curves of Secondary school User 1 and User 2. Except for individual cases, most of them show daytime power consumption and the load characteristic is a single peak. In the summer electricity consumption, they both have a new load mode, which a higher electricity usage in the morning and evening. By observing the load heat map of the two users in Figure 9(c) and (d), the primary external performance of the difference in the electrical characteristics of User 1 and User 2 is the duration of different power consumption patterns in summer. Although the spatial characteristics of these two user loads are region consistent with the time-series changes. However, due to the influence of other factors such as region, climate, local policies, and so on, the characteristics of consumer electricity consumption in the same industry type have local dynamic changes.
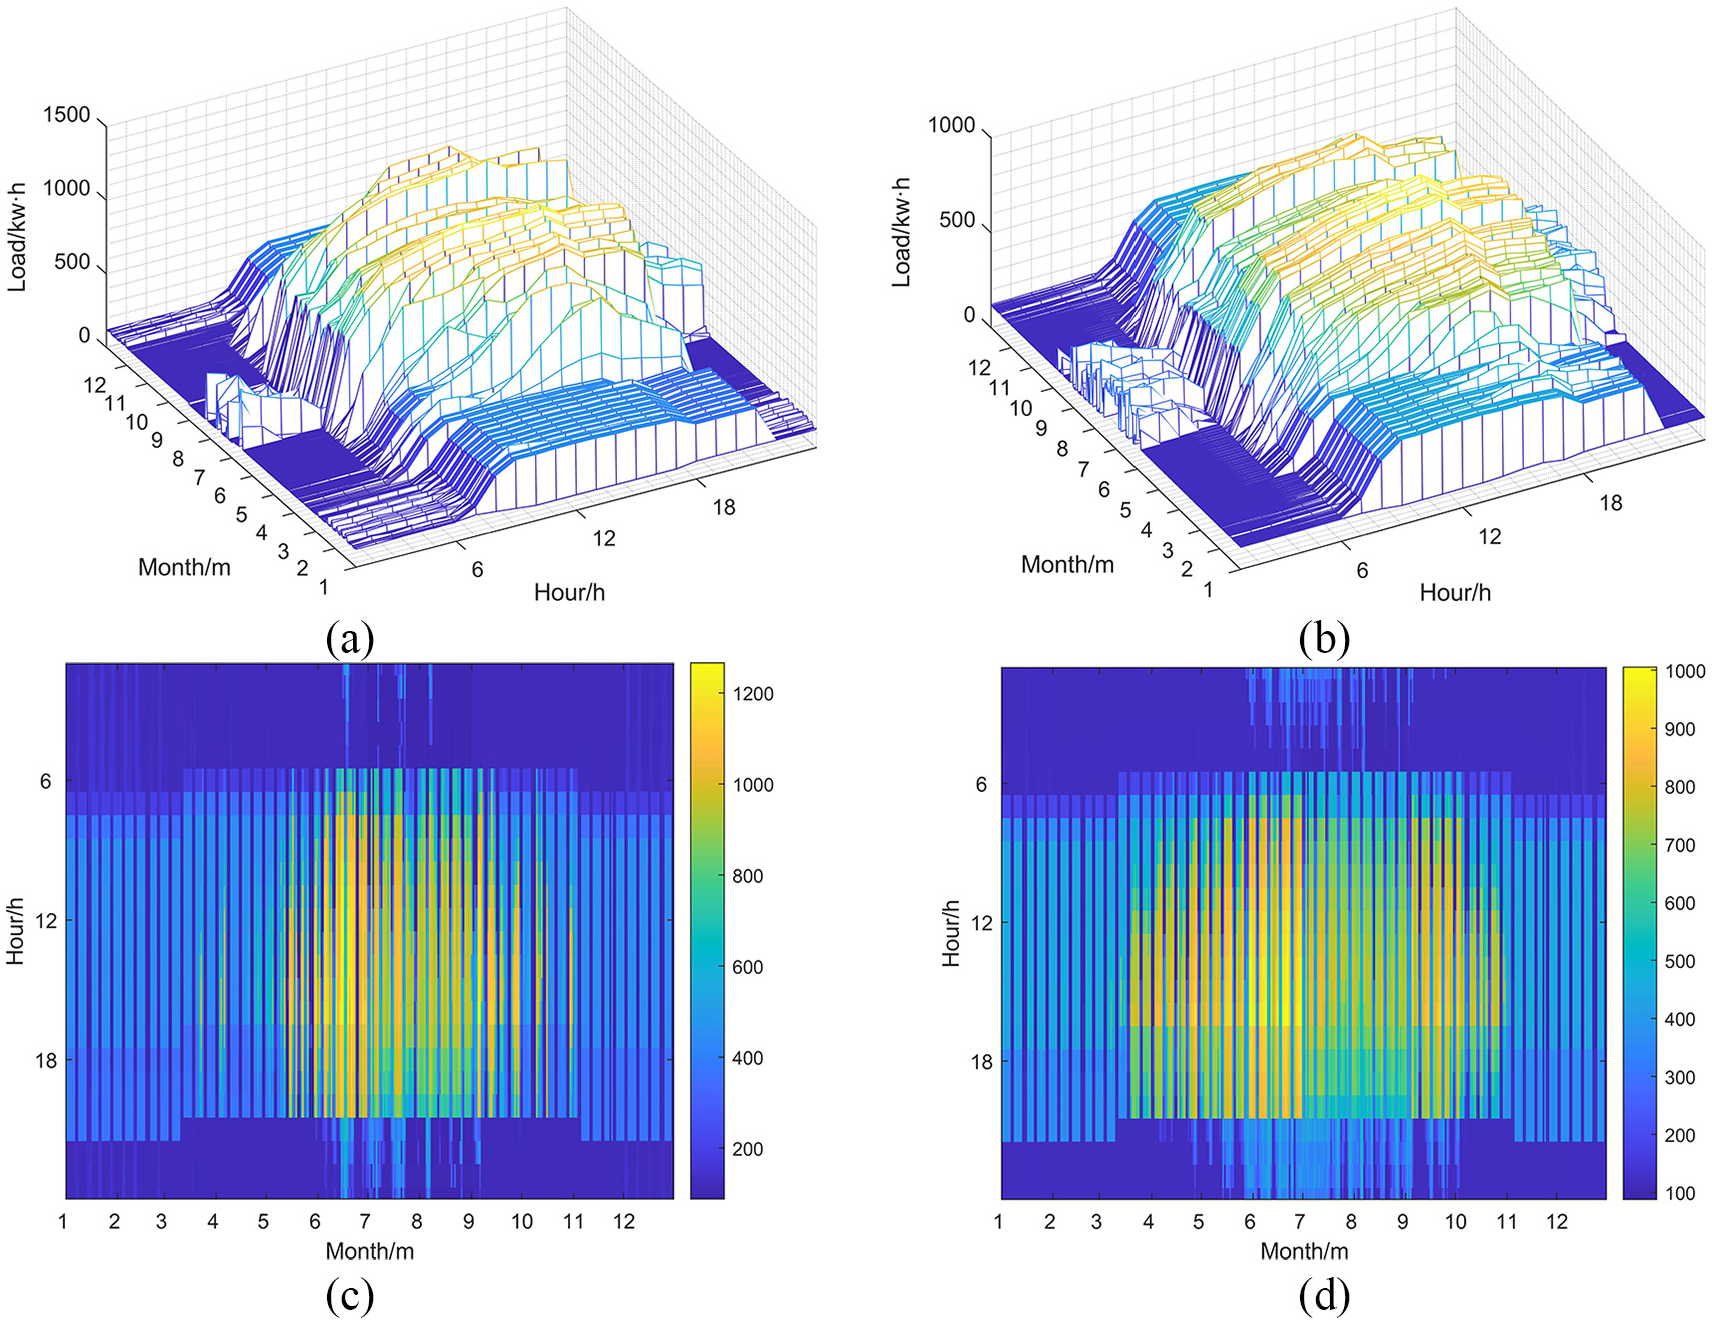
User load performance: (a) secondary school User 1 annual daily load curve, (b) secondary school User 2 annual daily load curve, (c) load heat map of secondary school user 1, and (d) load heat map of secondary school user 2.
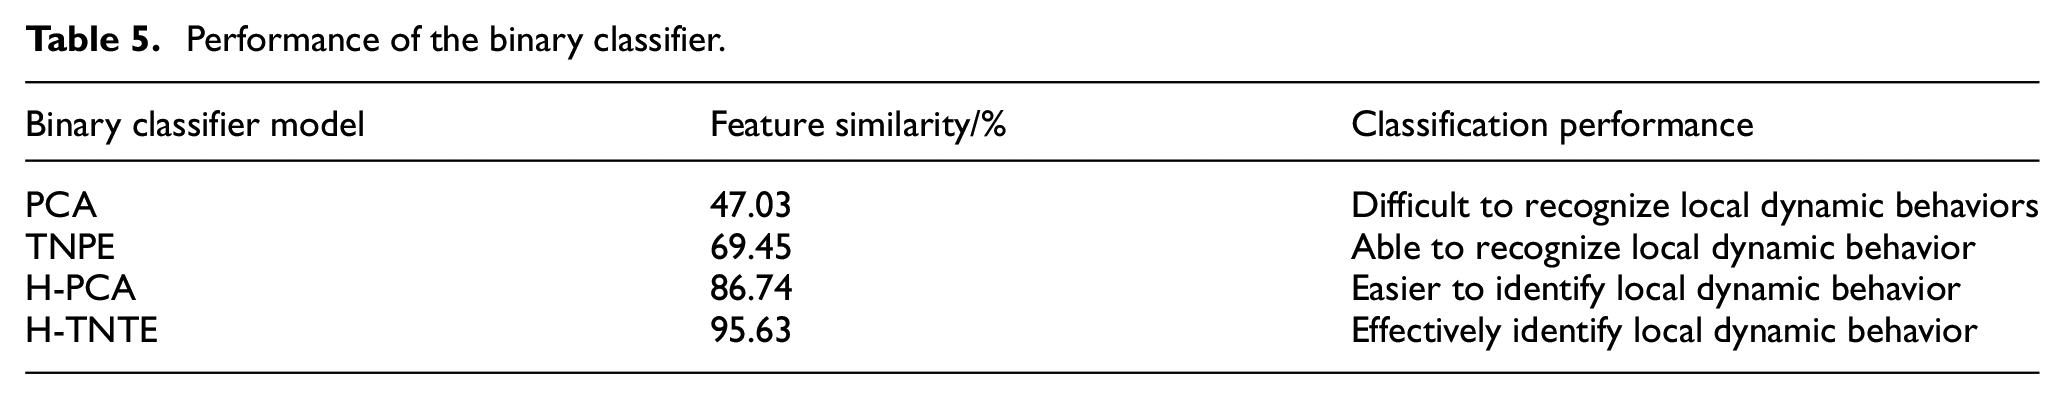
In order to evaluate the performance of the multi-classifier specifically, the classification capabilities of the binary classifier should be discussed. Figure 10 shows the performance of the binary classifiers of PCA, TNPE, H-PCA, and H-TNPE, where the red line is the feature statistics of user 1, and the blue line is the feature statistics of user 2. If the blue line is below the red line, it means that User 2 and User 1 have similar electricity usage behaviors. Otherwise, the part of the blue line above the red line represents a difference in their electricity consumption behavior. Calculate the feature similarity of user 1 and user 2 according to equation (12) in section 3.2, the result is shown in Table 5. The higher value of the feature similarity, the better performance of the binary classifier. Figure 10(a) shows the feature detection result of PCA, there are differences in the summer consumption behaviors between user 1 and user 2. In fact, their summer electricity consumption behaviors have similar load curves, but the duration is different. This difference may be due to external factors such as geographic location, climate, weather, etc. Despite their electricity consumption behaviors in local differences, they still are secondary school users. Therefore, it is difficult for PCA to identify local dynamic changes in the consumption behaviors of the same industry. Figure 10(b) is the feature detection result of TNPE. In the feature space detection, TNPE can identify the local dynamic changes of users’ electricity consumption behavior, but in the residual space detection, there are also problems similar to the PCA. Figure 10(c) and (d) are the feature detection results of H-PCA and H-TNPE respectively. By observing the statistics of feature space and residual space, H-PCA and H-TNPE are both better than PCA and TNPE. This means that the separation of electricity consumption behavior can improve the model’s ability to identify the industry to which electricity consumption belongs.
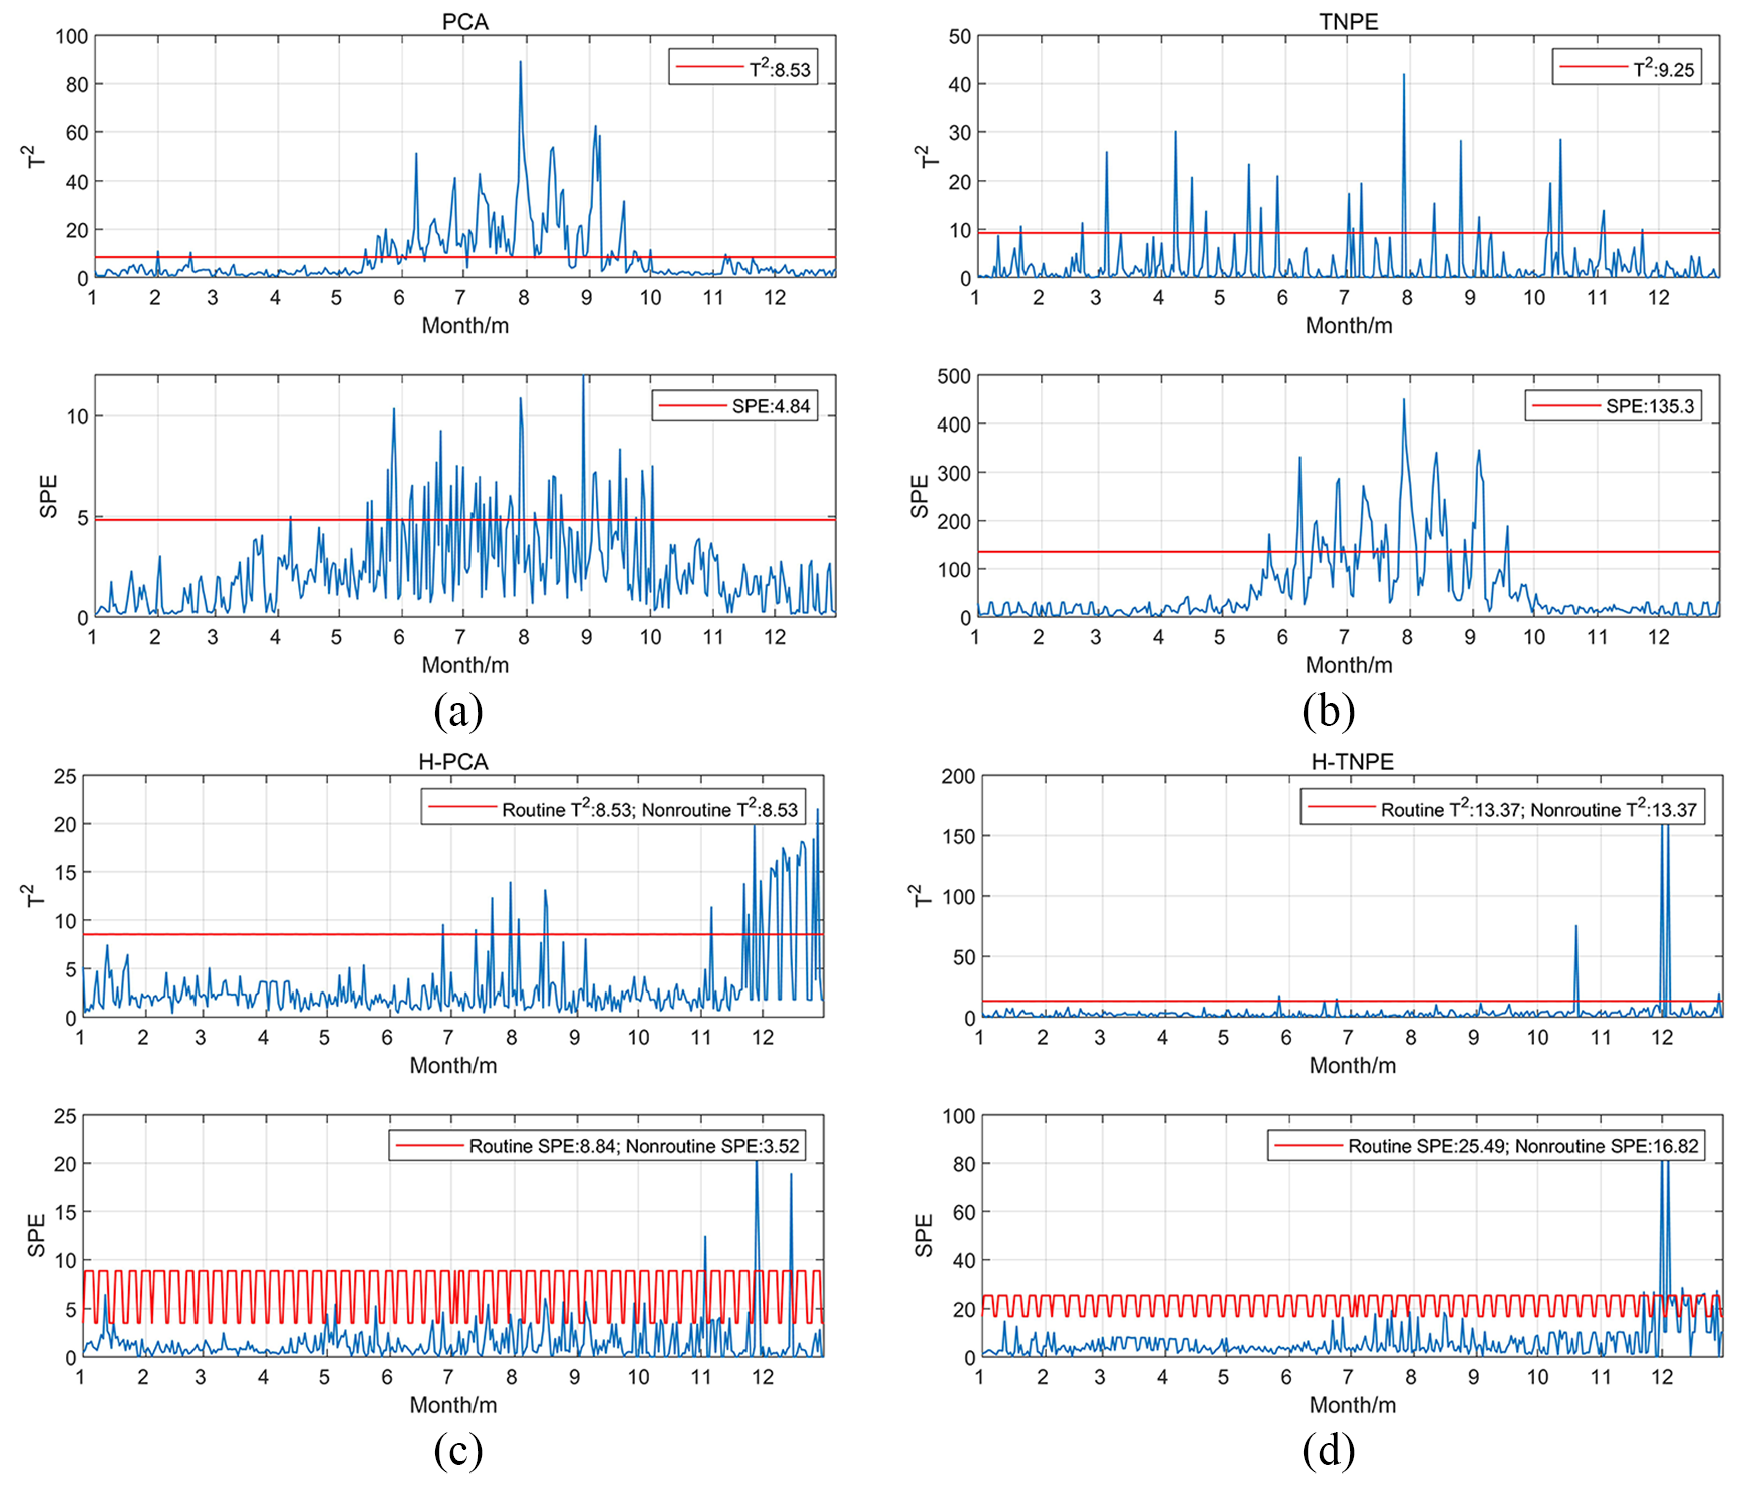
Feature detection results: (a) feature detection by PCA, (b) feature detection by TNPE, (c) feature detection by H-PCA, and (d) feature detection by H-TNPE.
Performance of the binary classifier.
Conclusions
In view of the nonlinear and local characteristics in the load data, the single daily-load curves with power-hour cannot truly reflect the user’s dynamic consumption behaviors, and the multi daily-load curves with power-hour-day can reflect the truth. This paper developed a classification method through TNPE and Bayes, and it is composed of multiple binary classifiers based on feature detection. By separating the consumption behaviors, the relationship between behaviors can be simplified. Through hierarchical classification, it can effectively reduce the bad influence of external factors such as region and climate on the performance of the classifier. The results of the case study demonstrated that the model proposed in this paper could realize a refined classification of the electricity consumption industries using fewer training samples.
In order to simplify the processing of the proposed model, electricity consumption behaviors are divided into routine and non-routine types. However, the fact is that different users may have different types of electricity consumption behavior. Therefore, how to establish a variable multi-type electricity consumption behavior classification model to identify user industry types is the focus of this paper’s future work. In addition, the classification model proposed in this paper depends on the completeness and reliability of the data. Therefore, how to improve the robustness of the model is the focus in future work.
Footnotes
Declaration of conflicting interests
The author(s) declared no potential conflicts of interest with respect to the research, authorship, and/or publication of this article.
Funding
The author(s) disclosed receipt of the following financial support for the research, authorship, and/or publication of this article: This research is supported by National Natural Science Foundation of China (No. 61763049); Science and Technology plan of Applied Basic Research Programs key Foundation of Yunnan province (No. 2018FA032).