
Abstract
Monitoring the degradation state of hydraulic pumps is of great significance to the safe and stable operation of equipment. As an important step, feature extraction has always been challenging. The non-stationary and nonlinear characteristics of vibration signals are likely to weaken the performance of traditional features. The two-dimensional image representation of vibration signals can provide more information for feature extraction, but it is challenging to obtain sufficient information based on small-size images. To solve these problems, a method for feature extraction based on modified hierarchical decomposition (MHD) and image processing is proposed in this paper. First, a set of signals decomposed by MHD are converted into gray-scale images. Second, features from accelerated segment test (FAST) algorithm are applied to detecting the feature points of the gray-scale image. Third, the real part of Gabor filter bank is used to convolve the images, and the responses of feature points are used to calculate histograms that are regarded as feature vectors. The method for feature extraction fully acquires the multi-layered texture information of small-size images and removes the redundant information. Furthermore, support vector machine (SVM) and nondominated sorting genetic algorithm II (NSGA-II) are introduced to conduct feature selection and state identification. NSGA-II and SVM can conduct the joint optimization of these two goals. The details of the proposed method are validated using experimental data, and the results show that the highest recognition rate of our proposed method can reach 100%. The results of the comparison among the proposed method, local binary pattern (LBP), and one-dimensional ternary patterns (1D-TPs) certify the superiorities of the proposed method. It obtains the highest classification accuracy (99.7%–98%) and the lowest feature set dimension (13–10).
Keywords
Introduction
The heart of hydraulic system is hydraulic pump, which has the advantages of high pressure and high efficiency. As a component for transferring and converting energy, hydraulic pumps are widely used in the fields of transportation and industry. 1 Failure to troubleshoot hydraulic pumps in time will threaten the safe operation and reliability of the hydraulic system and even cause terrible accidents and economic losses. 2 Therefore, degradation state identification for hydraulic pumps is conducive to the reliable and long-term operation of the system. However, the structure of hydraulic pump is not as simple as other rotating machinery such as bearings. The thermal-solid-fluid coupling existing inside the hydraulic pump makes its fault information hidden. 3 Consequently, a novel method needs to be proposed for feature extraction and applied to the degradation state identification for hydraulic pumps.
The traditional features of time–frequency domain, time domain, and frequency domain are widely used in the fields of fault diagnosis and prognosis. Applying frequency domain analysis and time domain analysis to non-stationary signals is not effective. 4 Although the time–frequency analysis can be used to extract the features of a non-stationary signal more effectively, its stability will be weakened in the presence of a signal with weak fault characteristics and nonlinear characteristics. 5 In recent years, some novel methods for feature extraction have been proposed in the fields of fault diagnosis and condition monitoring. Hongru Li et al. 6 extracted the power entropy and singular entropy of the modified composite spectrum from multi-channel vibration signals of the hydraulic pump and proposed the relative entropy method to fuse the initial features. Ying Jiang et al. 7 proposed a feature indicator called hierarchical entropy based on sample entropy and hierarchical decomposition. Since then, some scholars had combined the hierarchical decomposition with other complexity indicators and proposed some novel feature extraction methods. With the support of hierarchical decomposition, Bing Han et al. 8 developed the single-scale Lempel–Ziv complexity into hierarchical Lempel–Ziv complexity and applied it to fault feature extraction for rotating machinery. In the process of hierarchical decomposition, the length of time series is shortened. Modified hierarchical decomposition (MHD) proposed by Yongbo Li et al. 9 overcome this drawback. The moving-difference and moving-averaging procedure were used to improve hierarchical decomposition, and modified hierarchical permutation entropy was proposed based on permutation entropy and MHD. Cheng Yang et al. 10 extended MHD to multiple scales, and proposed hierarchical multi-scale symbolic dynamic entropy, which is a tensor feature extraction method based on MHD, multi-scale analysis and symbol dynamic entropy. The above studies related to the hierarchical decomposition show that it has the advantage of obtaining the information of signals from high- and low-frequency components, so that it can reflect the fault information more accurately than traditional multi-scale analysis.
Inspired by the rapidly developing image processing technology, some scholars also applied it to extracting fault features. Kaplan et al. 11 applied texture analysis to diagnosing bearing faults. The one-dimensional (1D) vibration signals were converted into two-dimensional (2D) gray-scale images. Local binary pattern (LBP), a classic texture descriptor, was used to extract image features. Hao Zheng et al. 12 used a corner detection method called features from accelerated segment test (FAST) to identify the feature points in gray-scale images. They then used the unoriented scale-invariant feature transform (unoriented-SIFT) to describe the feature points. Melih Kuncan et al. 13 developed the local ternary patterns for image processing into one-dimensional ternary patterns (1D-TP), which was used to extract bearing fault features from vibration signals. 1D-TP can be considered as a variant of image processing technology. Since deep learning can learn the deep abstract features of data and has a strong data expression, it has also been widely used in the field of mechanical fault diagnosis. Although deep learning can process 1D signals, images have been more widely used as its input. Jianyu Wang et al. 14 proposed a bearing fault diagnosis model transferred from an AlexNet model. The images created by eight time–frequency analysis methods, including short-time Fourier transform, and fast kurtogram, were used as the input of the model. Yongliang Bai et al. 15 proposed an algorithm to represent the frequency spectrum characteristics of vibration signals in image form, and a deep neural network (DNN) classified the images to diagnose the faults of wheelset-axlebox assemblies. Duy-Tang Hoang et al. 16 converted the vibration signals into gray-scale images, and a deep convolutional model automatically extracted features from the images and recognized the bearing faults. Compared with 1D signal, 2D image representation has three main advantages: (1) For machinery working in a noisy environment, vibration signals are usually added with noise. However, when the data is transformed into images, the added noise is considered as the illumination of the light to the image. Therefore, the effect of noise is suppressed. 17 (2) Image representation can provide a comprehensive, detailed, and nonlinear description of the data. 15 (3) From the perspective of human vision, 2D images are of course easier to distinguish. With a simple transformation of the signal, people can more easily classify each signal from the images. 18
Although the application of image processing technology is novel and effective in the fields of fault diagnosis and prognosis, there are still several problems that need to be considered. First, an image often contains a large number of pixels in the field of image processing, while a fault sample is likely to contain a small number of data points in the field of fault diagnosis, which makes a 1D signal into a small-size image. It contains less information, and its local and global information needs to be considered comprehensively. Second, it is challenging to obtain sufficient information based on small-size images. Third, deep learning requires a large number of data samples to meet good recognition results. To extract the degradation features of hydraulic pumps more effectively, it is promising to combine hierarchical decomposition with image feature extraction. In this paper, an approach based on MHD, FAST algorithm, and Gabor filter is proposed to extract features. FAST is a feature point detection algorithm widely used in computer vision. 19 The points with large difference in gray value of surrounding pixels are identified as feature points by FAST algorithm; thus, FAST is a local feature detector and suitable for signals with non-stationary characteristics. 12 The role of the Gabor filter in this paper is to describe the detected feature points. As a powerful tool in the field of computer vision, the Gabor filter proposed by Dennis Gabor is one of the best approaches for texture analysis. 20 Because of its high sensitivity to describing directional features, it is suitable for calculating the gradient of feature points. Wei Jia et al. 21 used histogram of oriented gradients (HOG) descriptor improved by the Gabor filter to extract palmprint features. In this paper, a Gabor filter bank with one scale and several directions is applied to all feature points, and the response histogram is used as the feature vector of a gray-scale image.
In this study, after feature extraction, nondominated sorting genetic algorithm II (NSGA-II) 22 and support vector machine (SVM) 23 are introduced to conduct feature selection and identify different degradation states of a hydraulic pump. Overall, a new strategy based on MHD, FAST algorithm, Gabor filter, NSGA-II, and SVM is proposed to identify degradation states of hydraulic pumps. The results of two experiments show that the proposed method is effective and reasonable. Compared with LBP and 1D-TP, it can obtain the highest classification accuracy with the fewest features.
The following contents are also presented: The details of model establishment for the proposed degradation state identification method are presented in the second section. Experimental test results and discussion content are given in the third section. The fourth section summarizes the full paper and gives conclusions.
Model establishment
Feature extraction
Modified hierarchical decomposition (MHD)
Compared with the conventional hierarchical decomposition, MHD proposed by Yongbo Li has a better stability. 9 The calculation process of MHD includes four steps as follows:
Step 1: For a given time series


Step 2: The operator
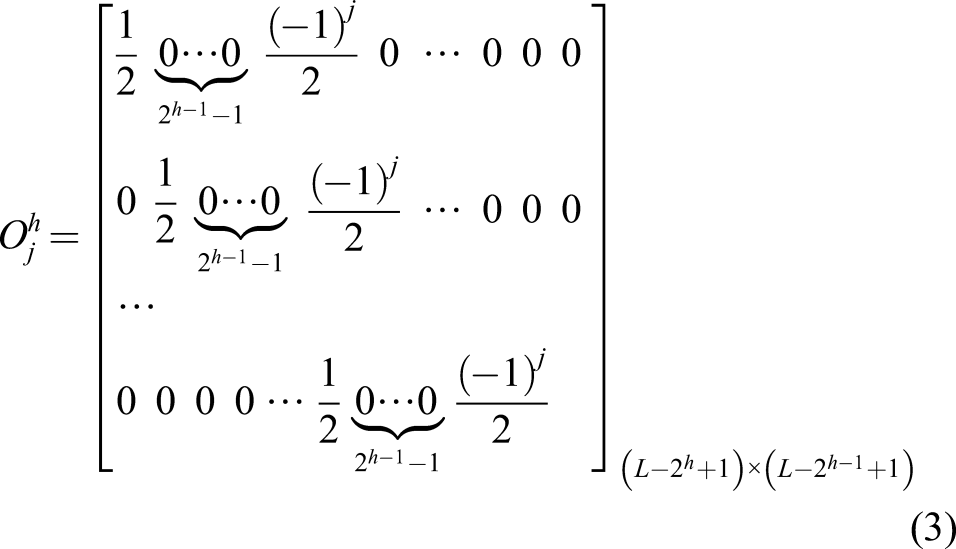
Step 3: For a given positive integer
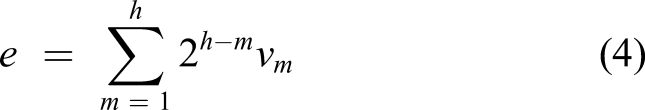
Step 4: Calculate the component at the node An example of MHD with three layers.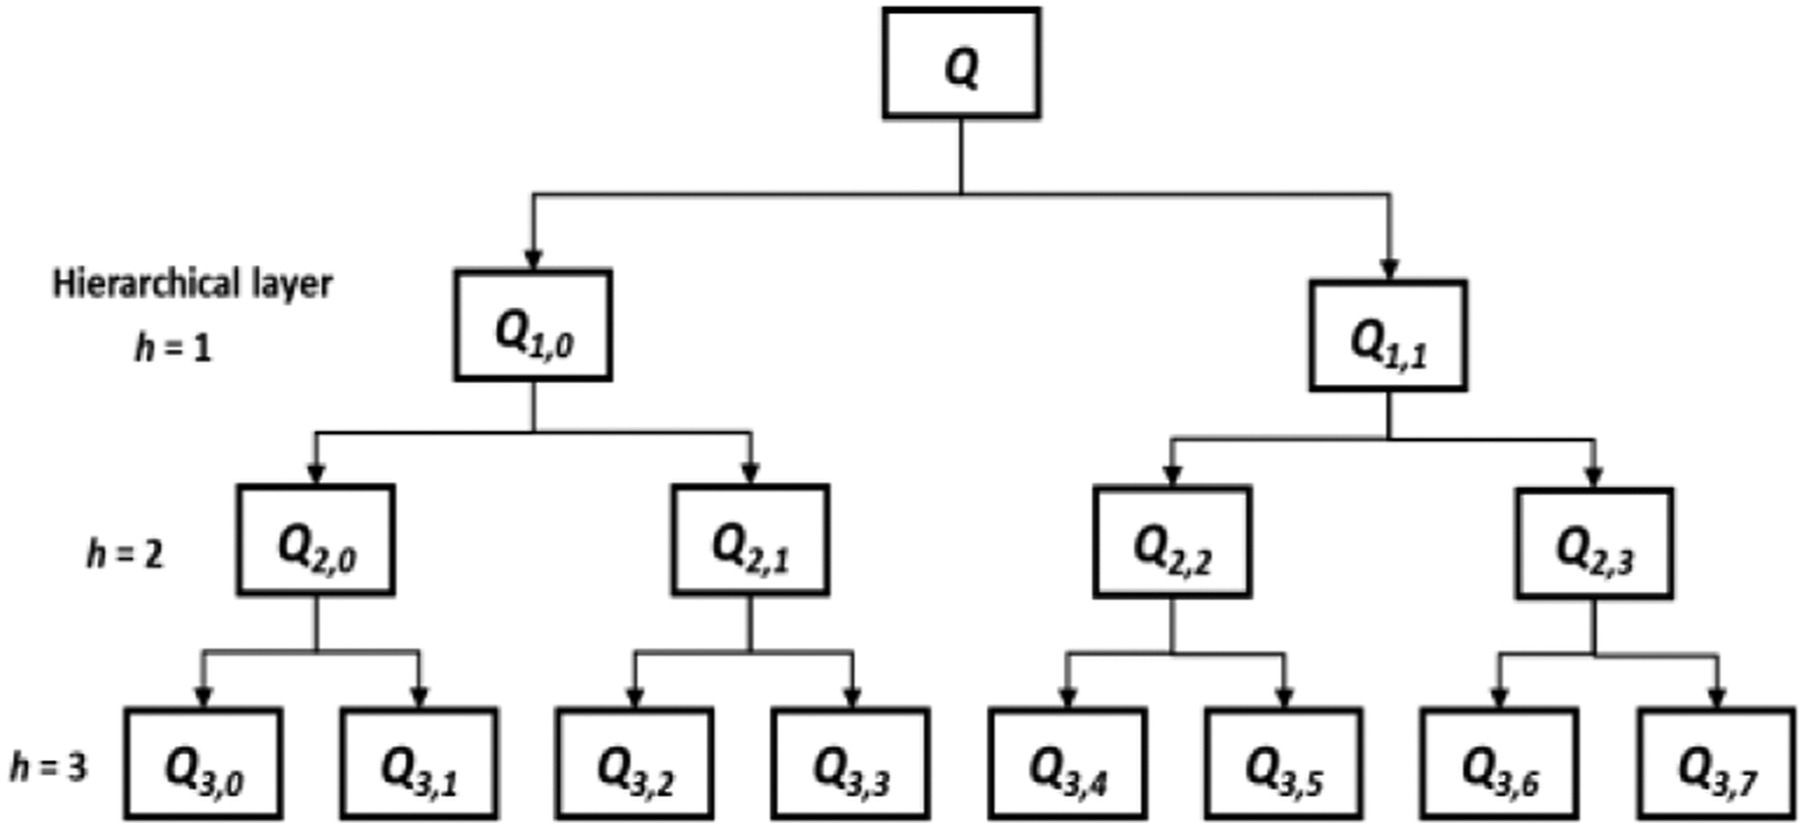

FAST feature detection
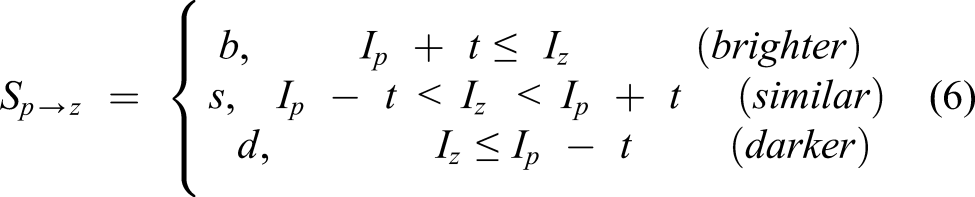
As shown in Figure 2, a pixel p is selected from an image, and the calculation method of FAST is as follows: The gray value of FAST feature detection.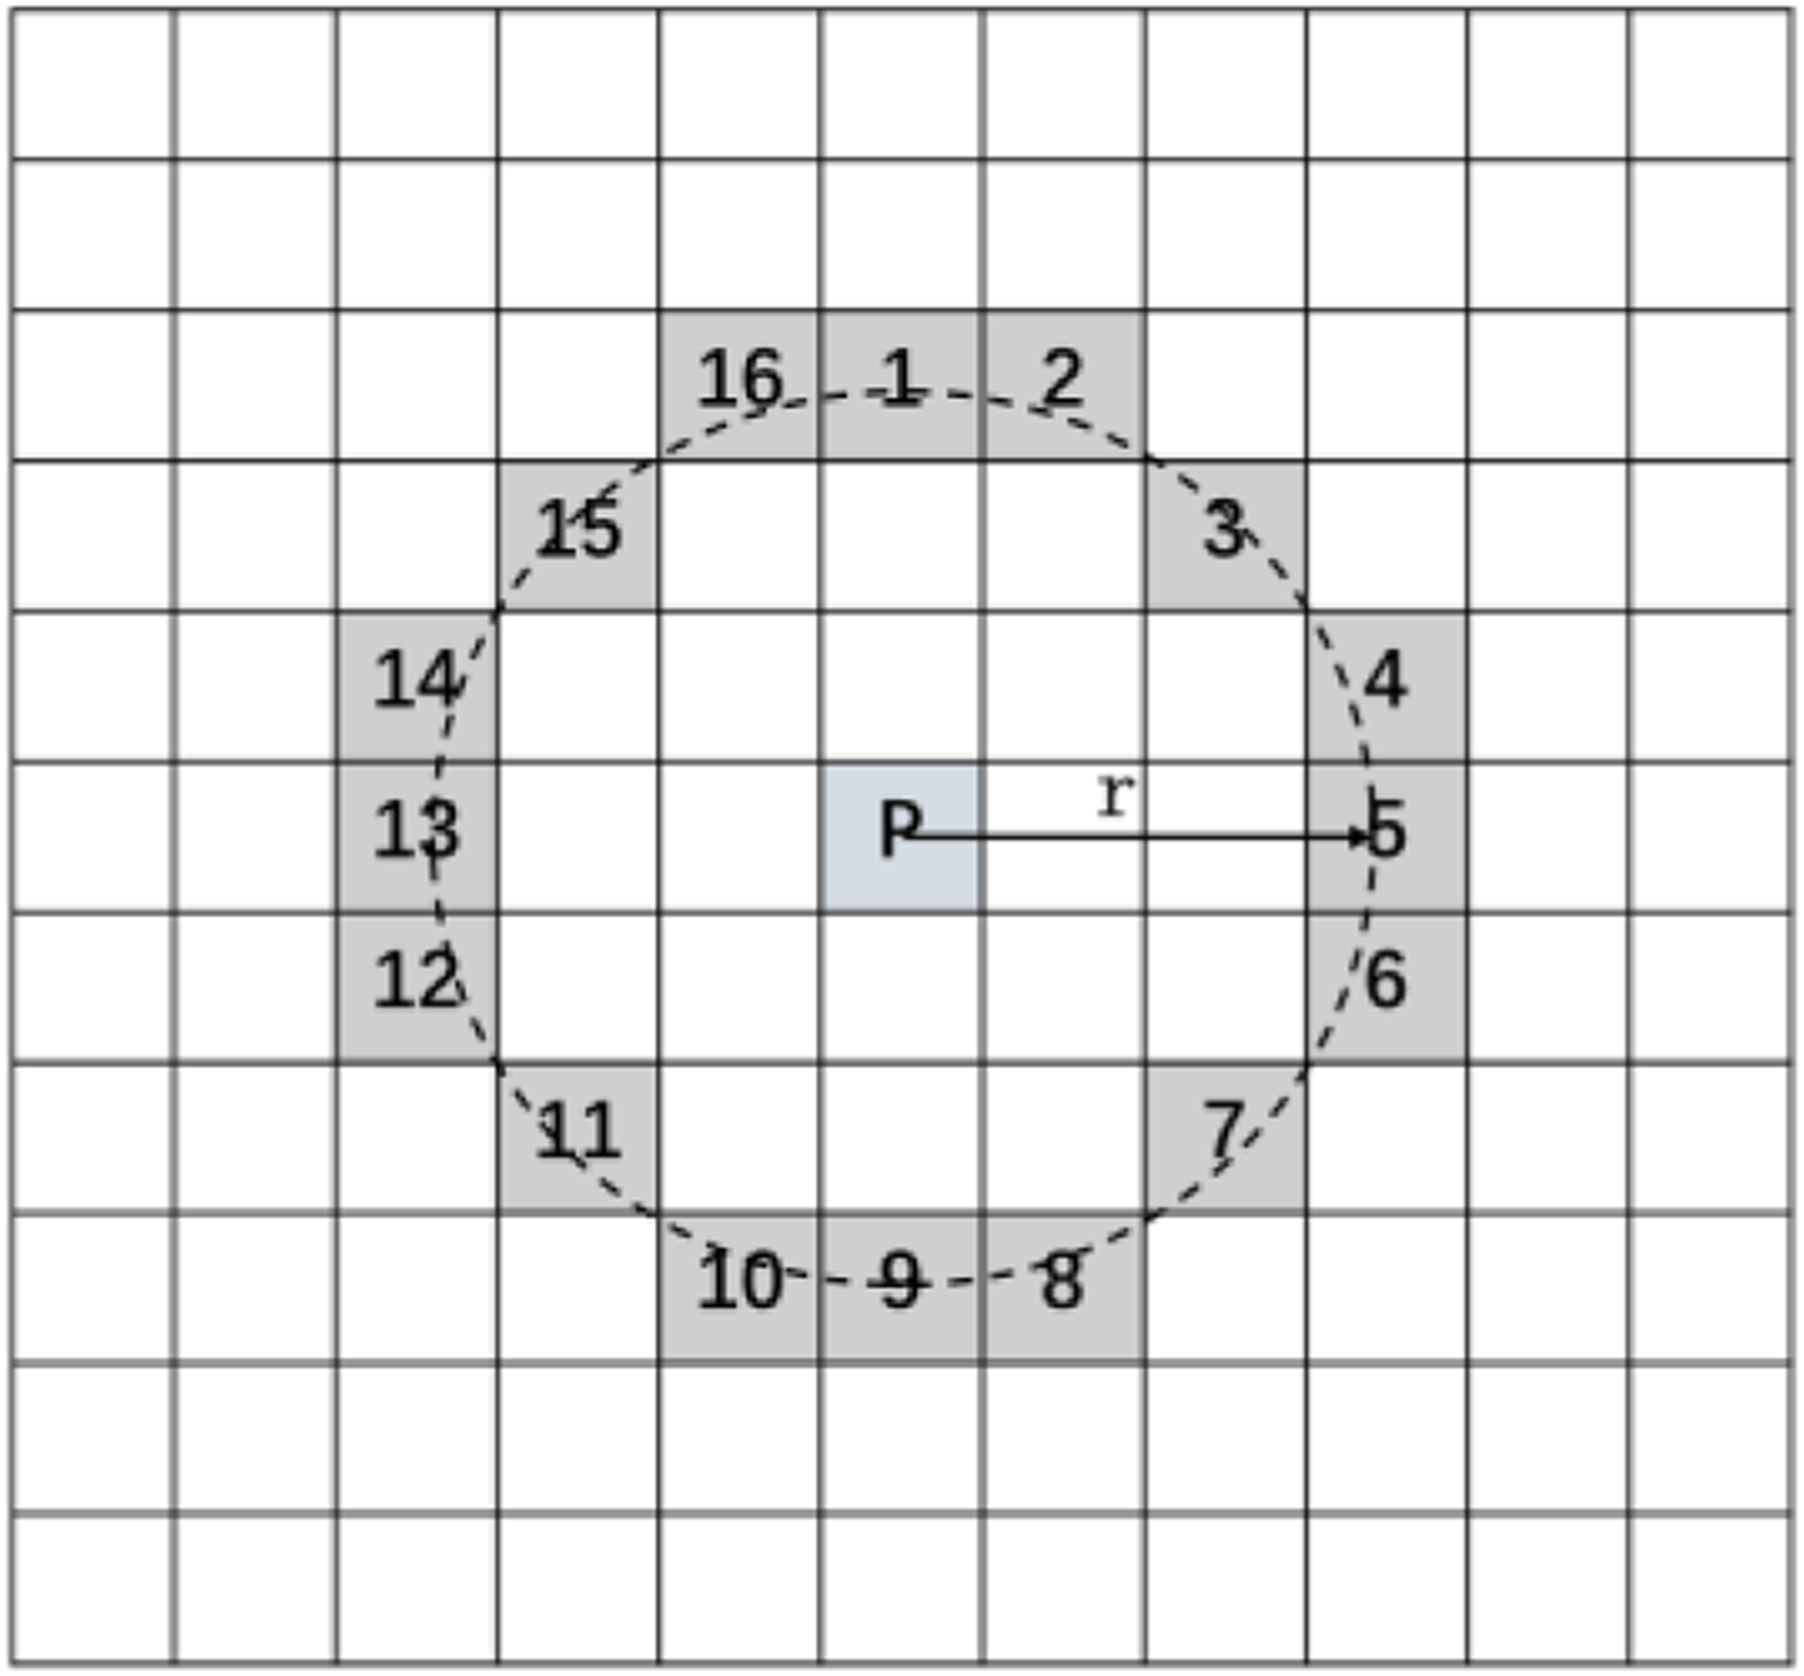


Gabor filter
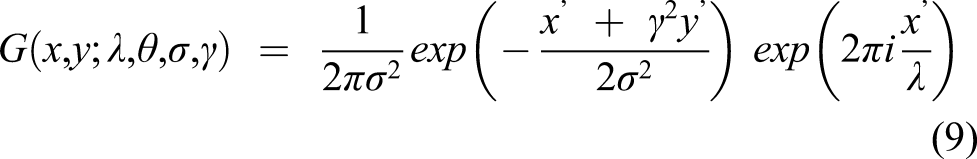
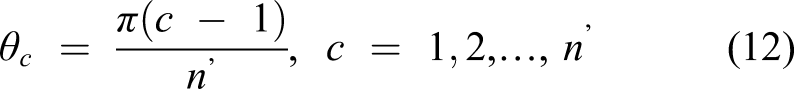
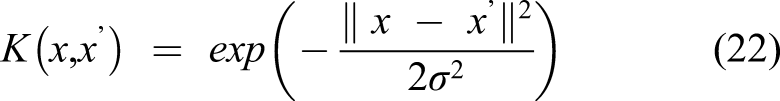
In a two-dimensional space, the Gabor filter is a Gaussian kernel function modulated by a sinusoidal plane wave,
24
which can be expressed as equation (9)
The proposed feature extraction method
For a given signal segment Illustration of the proposed feature extraction method (an example).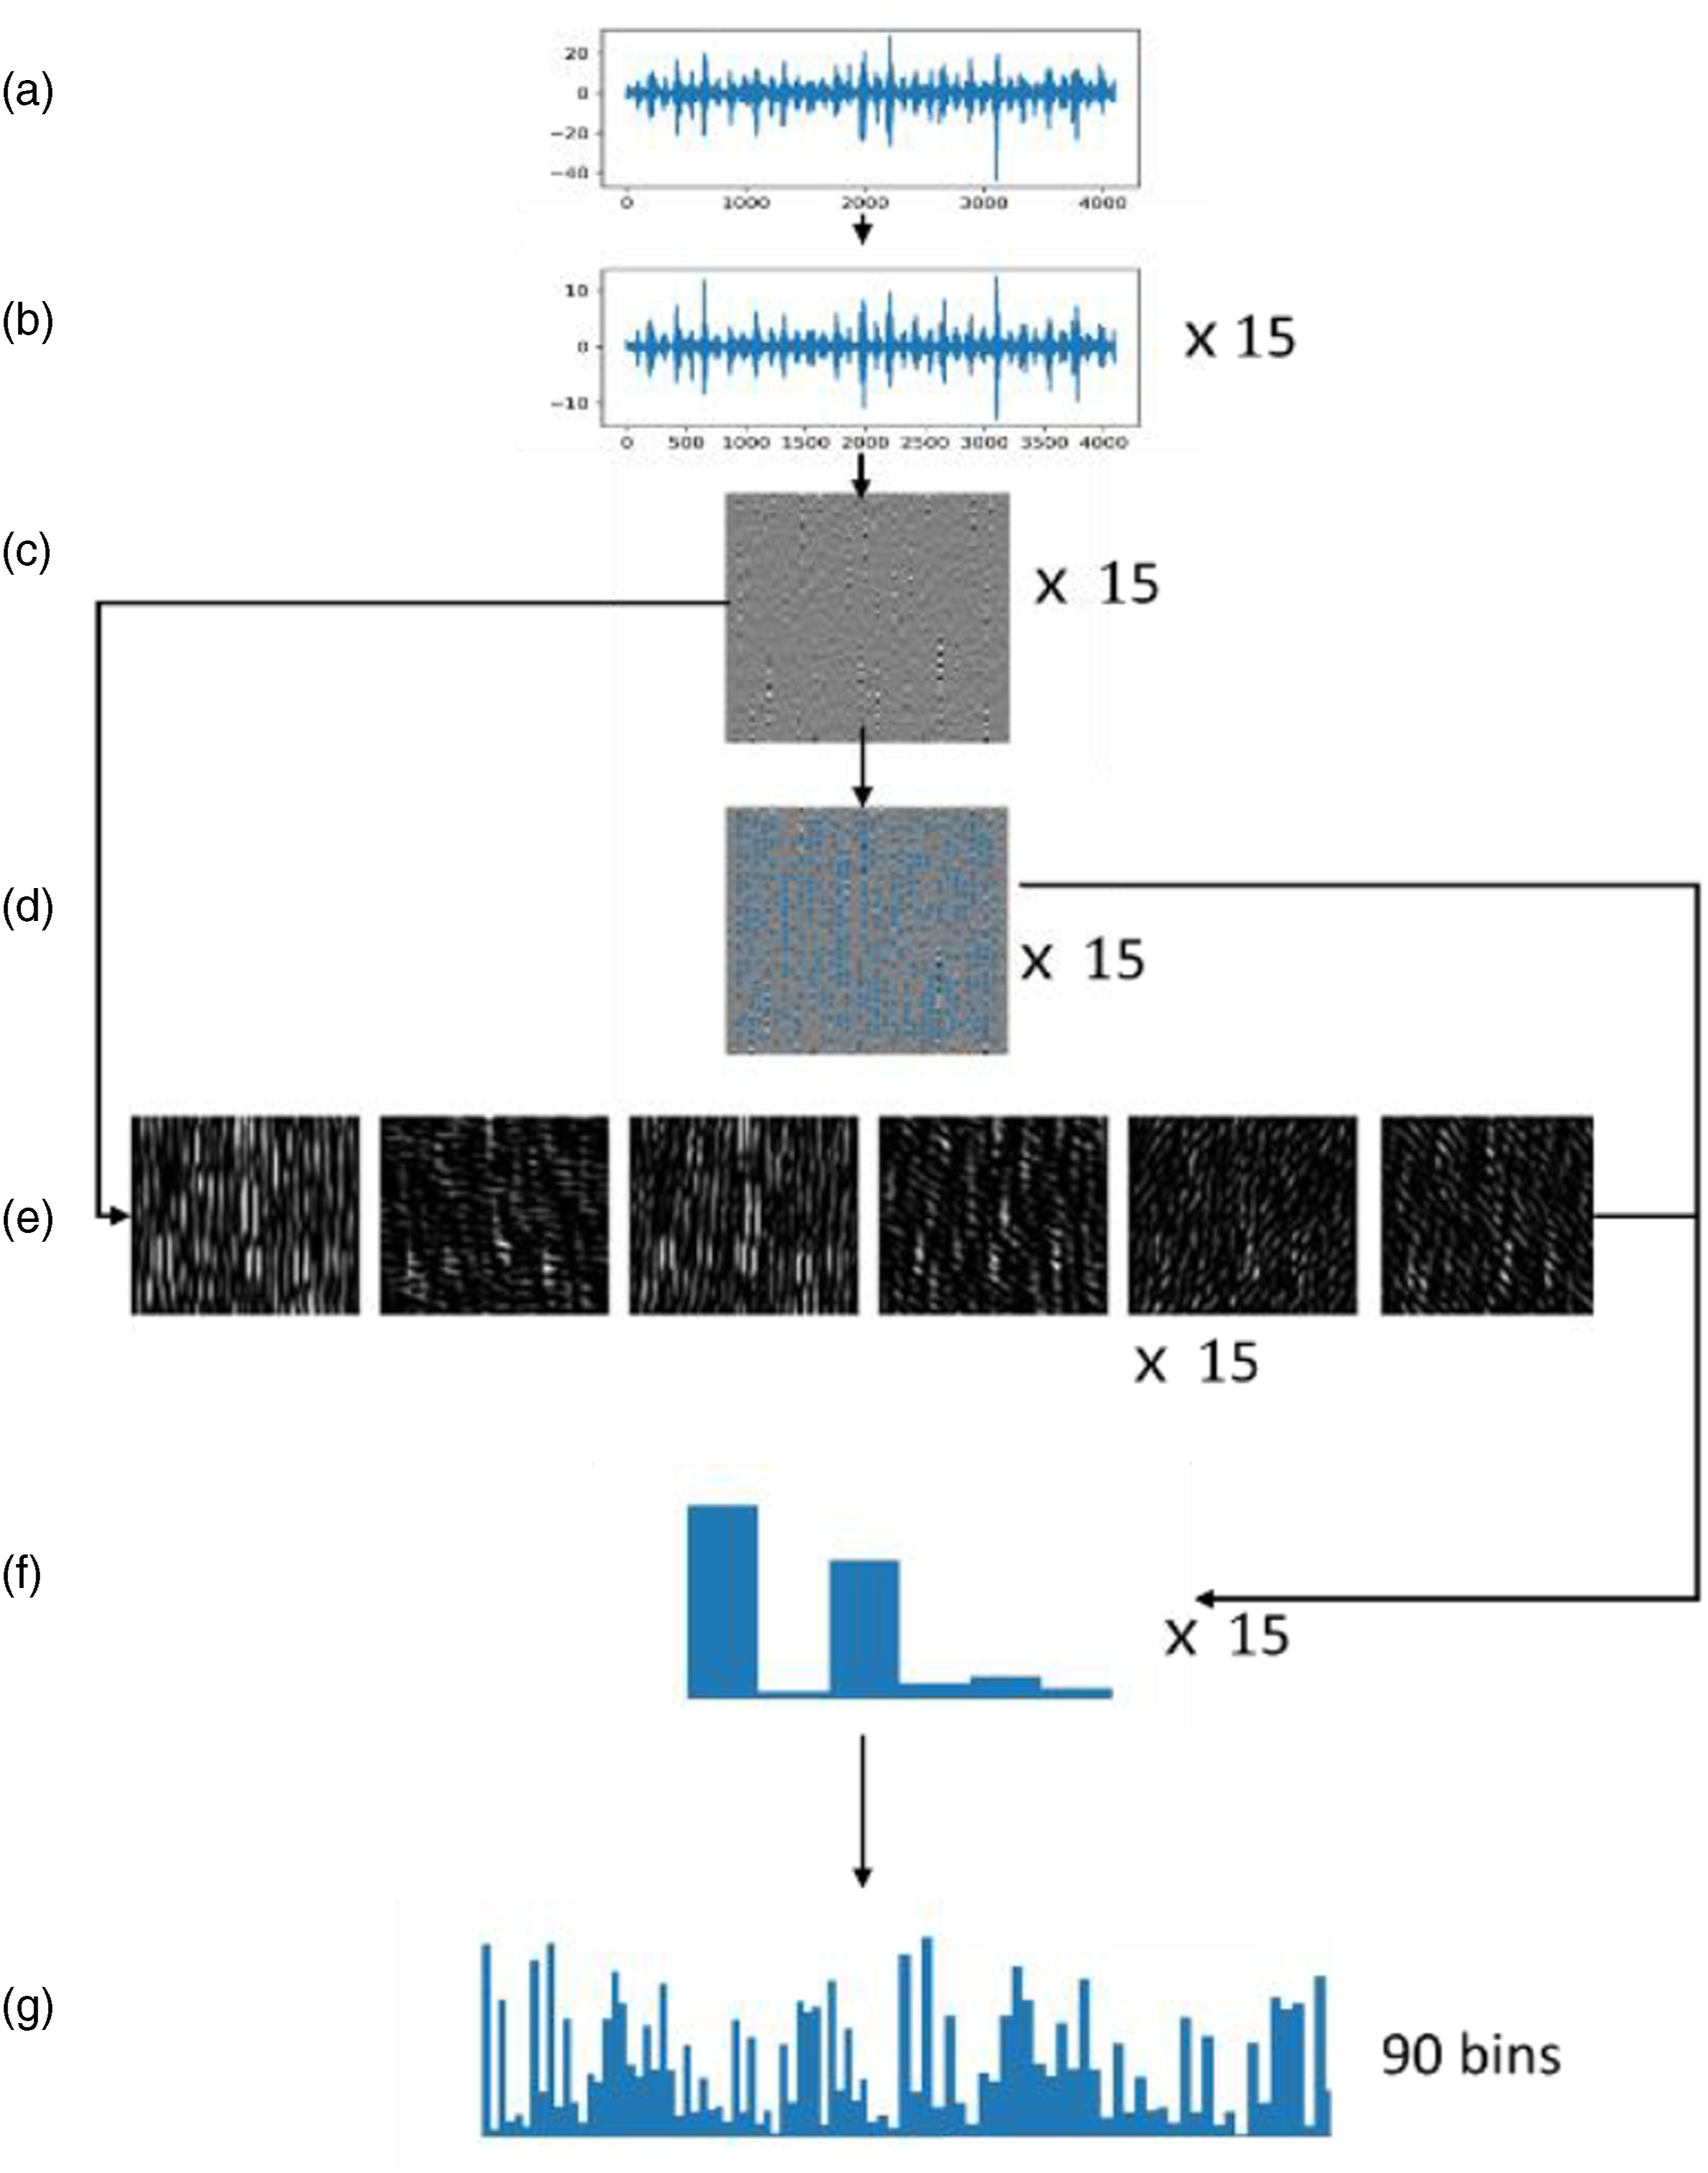
Step 1: Apply MHD to
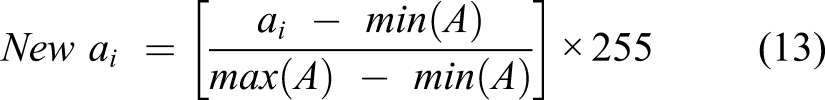
Step 2: Transform each hierarchical component into a gray-scale image. First of all, each component is converted into a matrix according to the method shown in Figure 4. When it comes to the size of the matrix, the difference between M and N is minimized. In other words, a square matrix is the best result. Note that several data points may be discarded. For example, for a given signal with 4088 data points, (M, N) is set to (68, 60), and 8 points are discarded. Then, all the elements of the matrix are converted to values between 0 and 255 according to equation (13) Illustration of converting a one-dimensional signal into a two-dimensional matrix.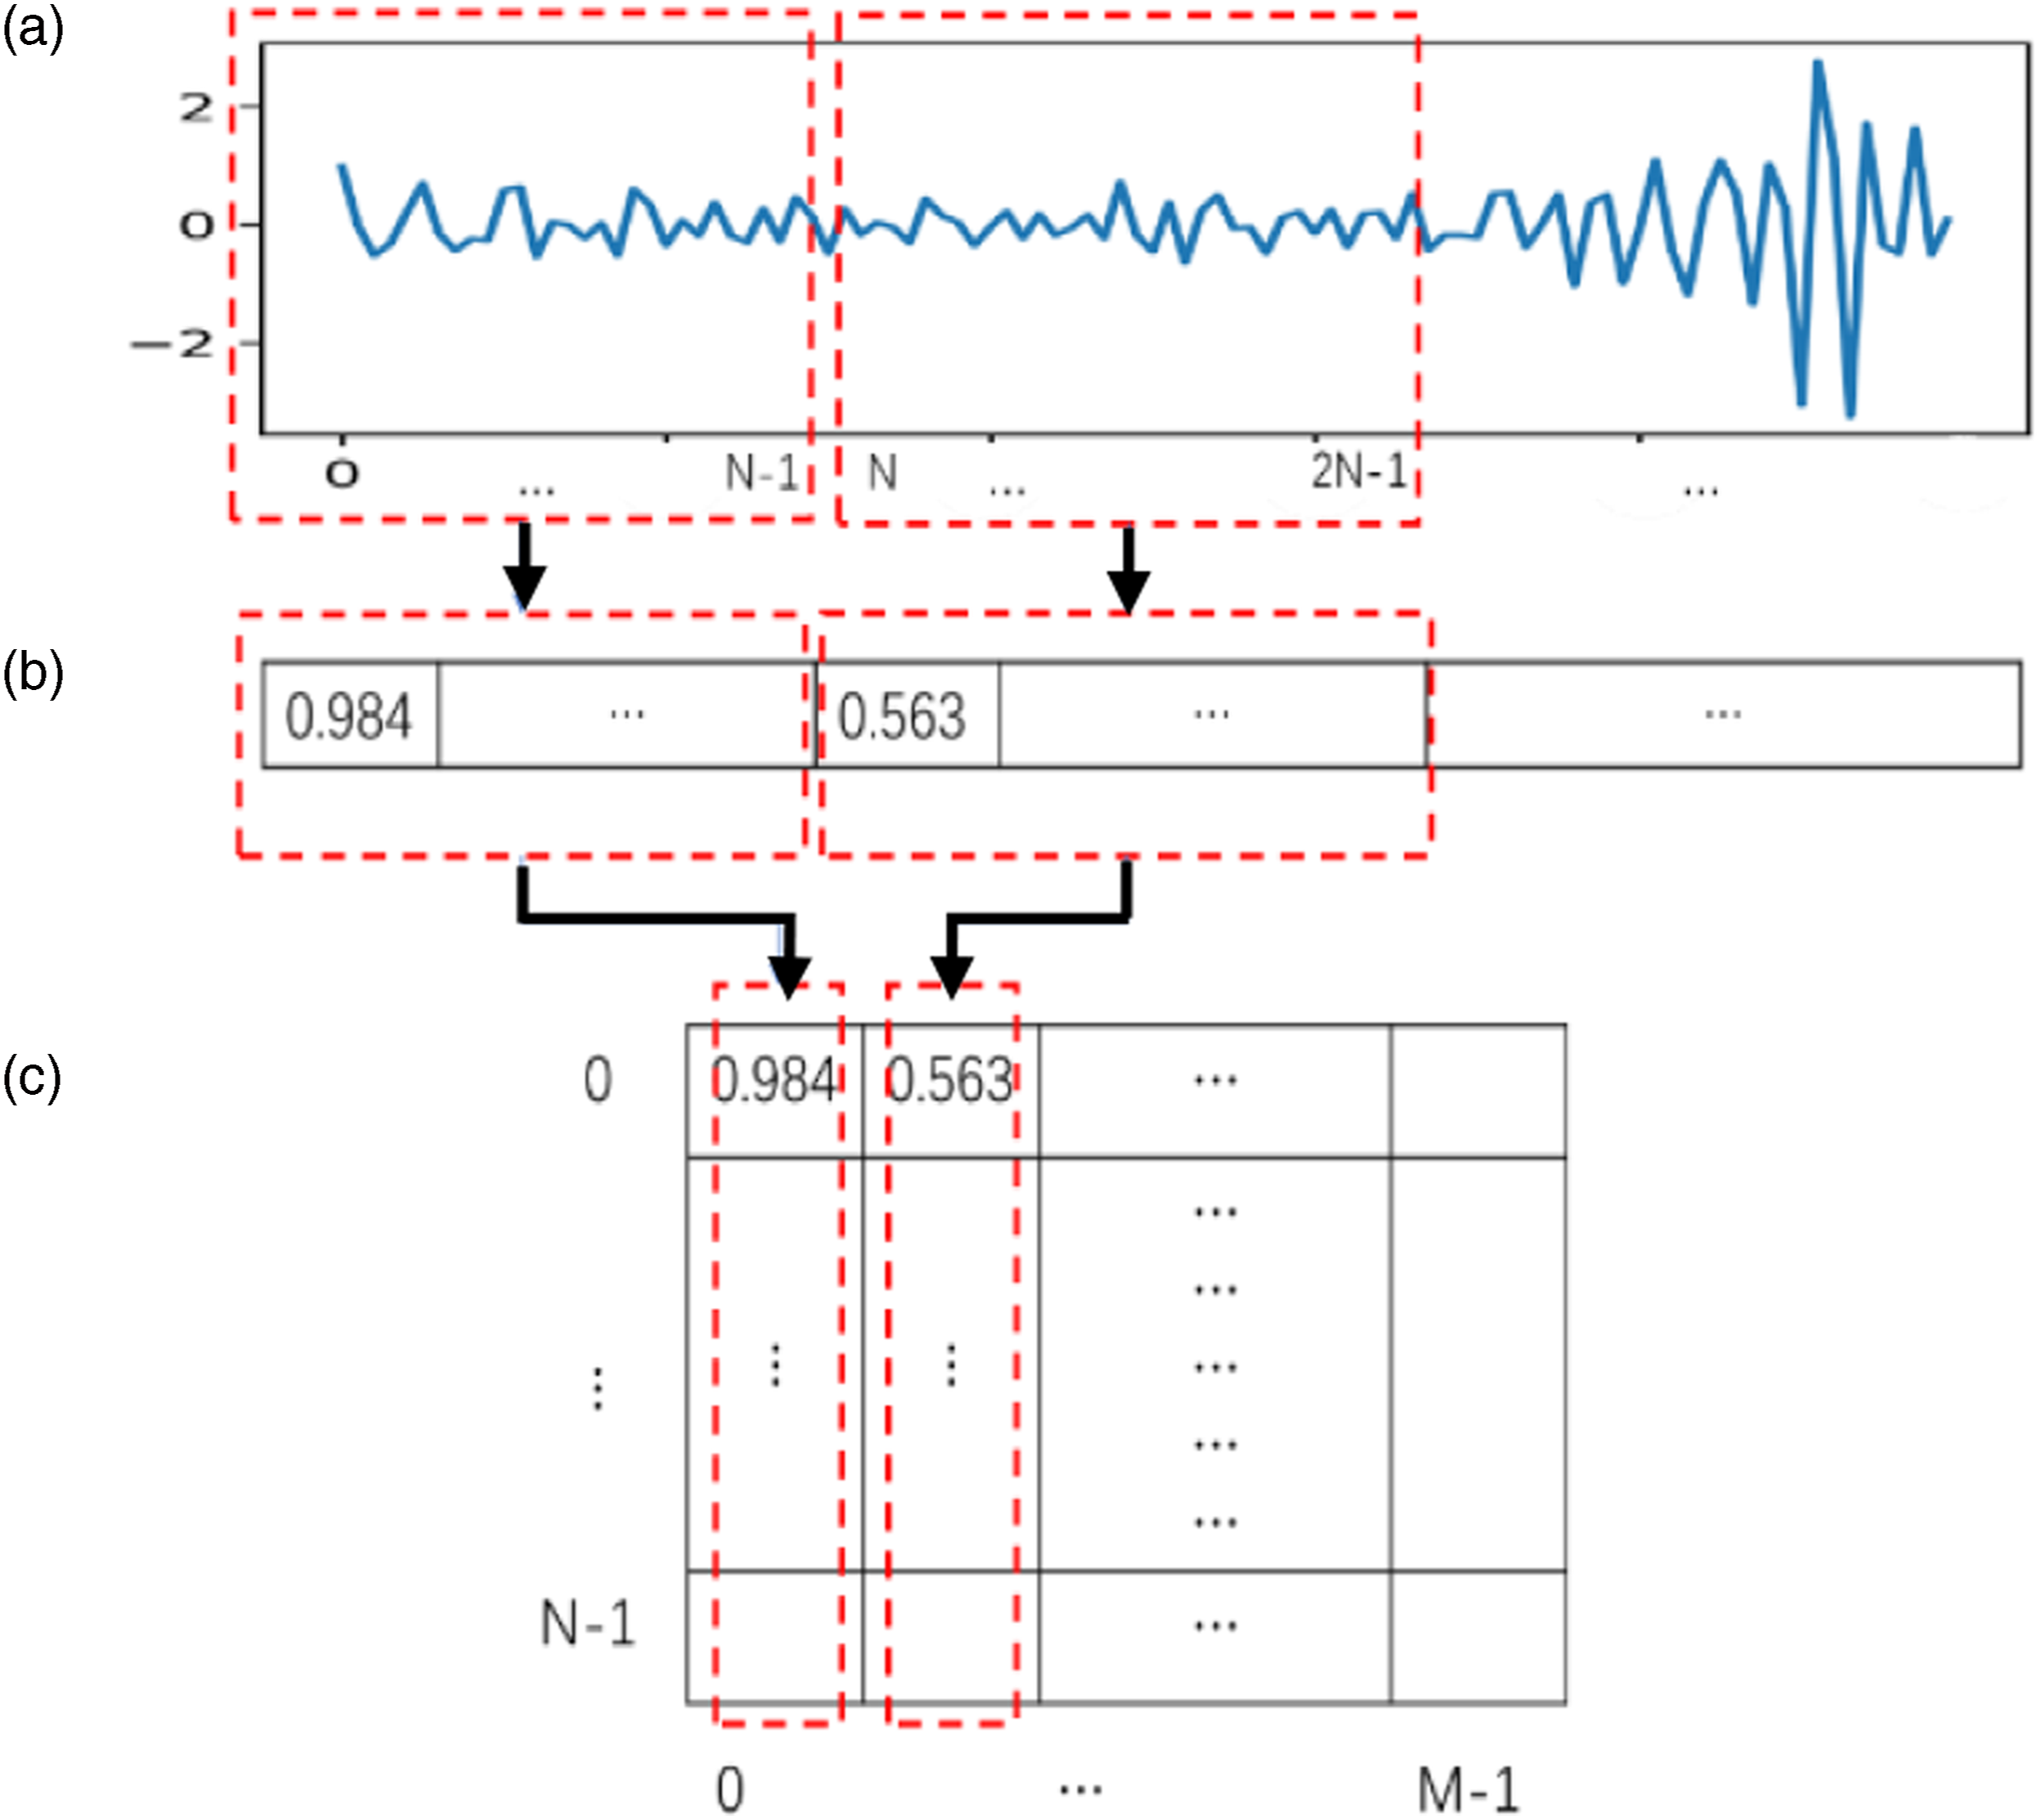
Step 3: FAST feature detection: The feature points in each gray-scale image are detected according to the method described in the subsection “FAST feature detection” (Figure 3(d)).
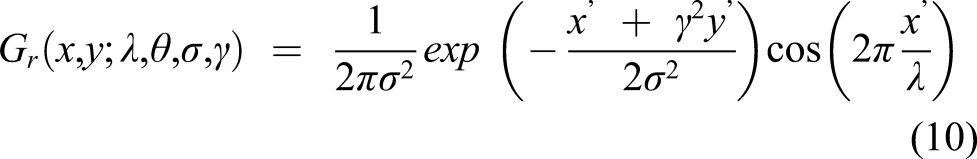
Step 4: A Gabor filter bank is created according to the method described in the subsection “Gabor filter”. Then, each gray-scale image is convolved with the real part of the filter bank. Finally, the gradient magnitude


Step 5: Create

Step 6: The histogram corresponding to the signal segment

Feature selection and state recognition based on NSGA-II and SVM
After performing feature extraction, a feature pool that contains amounts of information is created. However, the feature pool generally includes redundant information, which will cause the performance of degradation state identification to be impaired. 25 In this paper, NSGA-II and SVM are introduced for joint optimization of feature selection and degradation state identification.
Nondominated sorting genetic algorithm-II
NSGA is the earliest multi-objective evolutionary algorithm. 26 NSGA-II is an improved version that addresses the shortcomings of NSGA, such as lack of elitism and high computational complexity. As an algorithm based on nondominated sorting, NSGA-II has the same basic process as the original genetic algorithm. 27 With the properties of an elitist strategy, a fast nondominated sorting procedure, a simple yet efficient constraint-handing method and a parameterless approach, NSGA-II has found increasing application in the fields of fault prognosis and diagnosis for equipment.28,29 The procedure of NSGA-II is summarized as follows:
Step 1: Initialize a random population, which consists of N individuals.
Step 2: Sort the population based on the nondominated sorting procedure and assign ranks to all individuals.
Step 3: Utilize selection, crossover, and mutation operators to create the offspring population Q t from the parent population P t .
Step 4: Combine the offspring population and the parent population to form a whole and sort the whole according to the nondominated sorting procedure.
Step 5: Continuously select nondominated solutions from the best ranking (F 1 , F 2 , …, F k , …, F n ) to generate a new population P t+1 . The selection is not stopped until the selection of a certain F k makes the size of P t+1 exceed the population size N. Then select individuals from F k according to the crowding distance sorting until the size of P t+1 is equal to N.
Step 6: Go to step 2 if the stop condition is still not met.
For a better understanding, Step 4 and Step 5 are illustrated in Figure 5. For other unfinished details about NSGA-II, refer to Deb et al.
22
Step 4 and 5 of NSGA-II.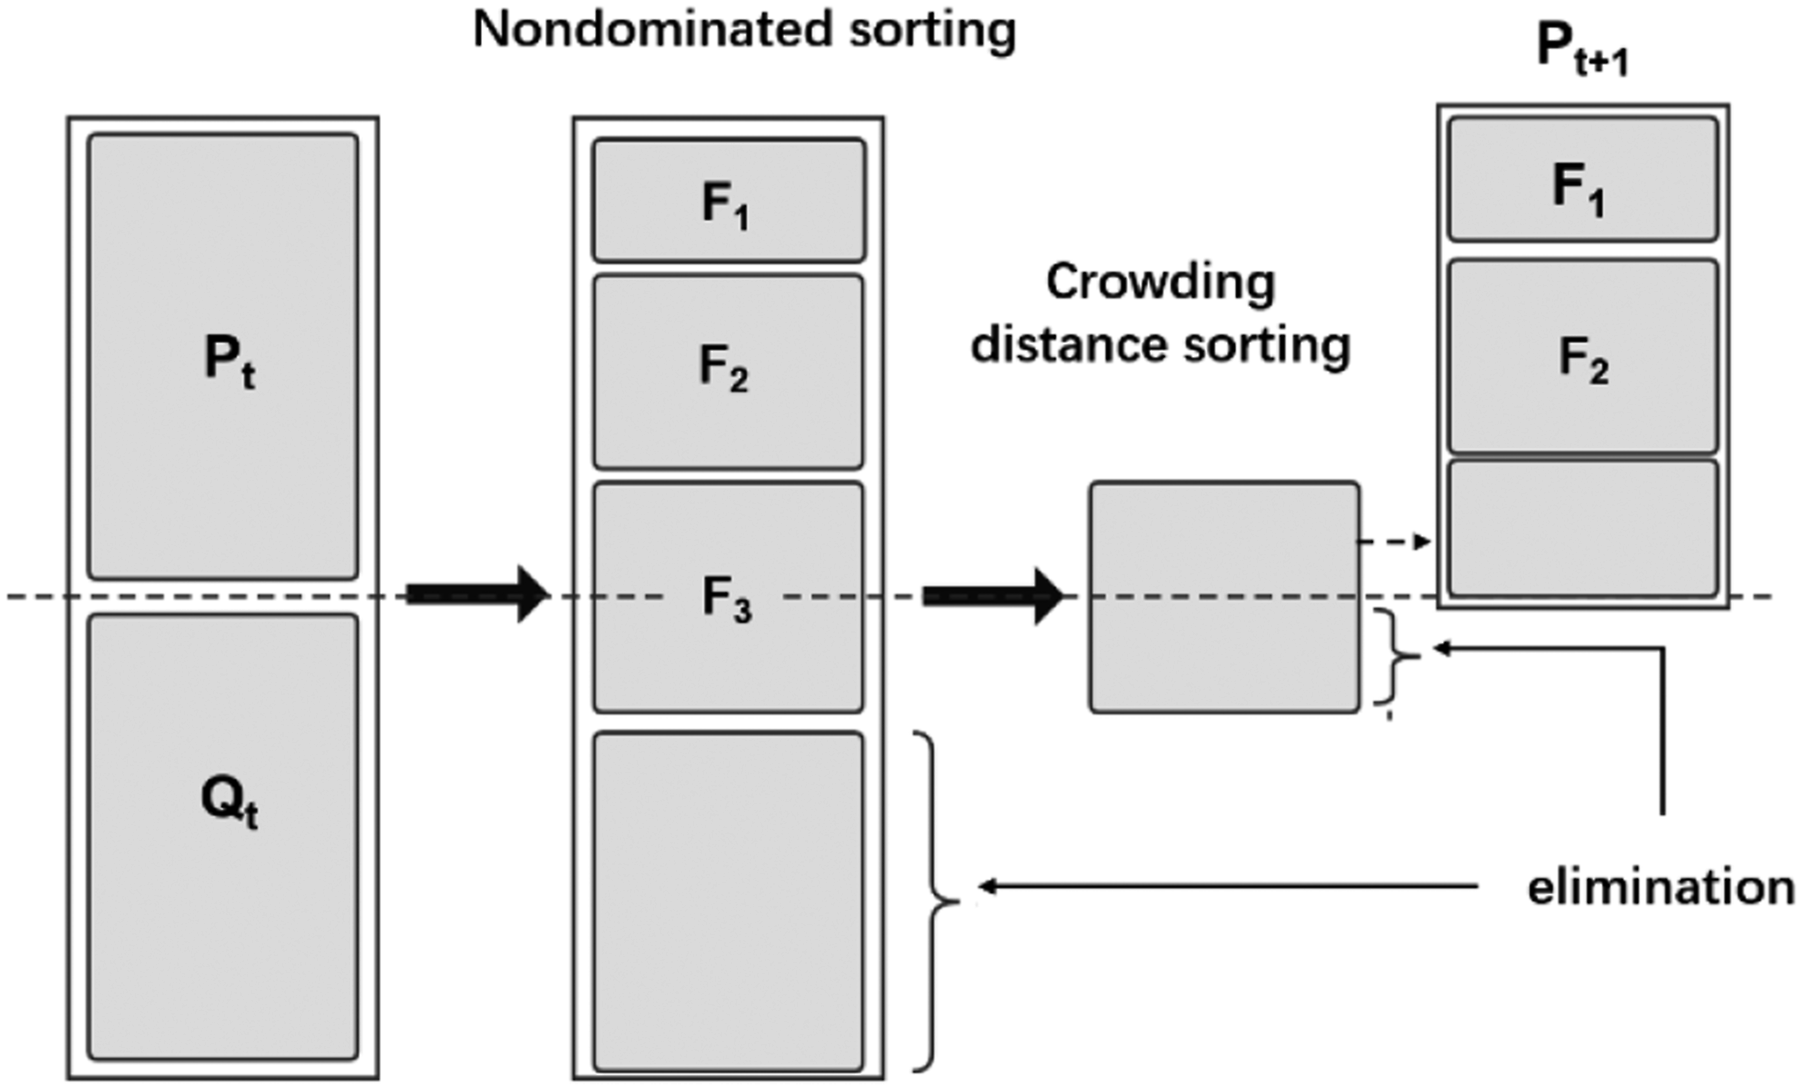
Support vector machine
As one of the classic machine learning techniques, SVM is widely used in pattern recognition. It learns by example to assign labels to objects.
30
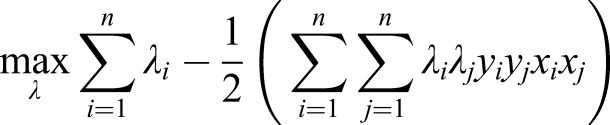
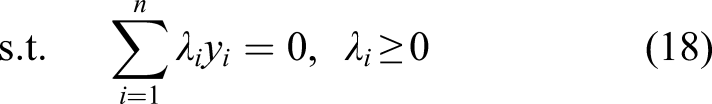
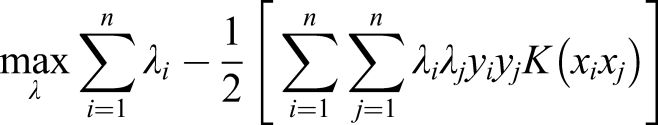
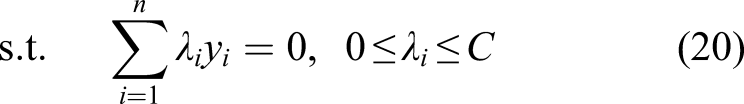
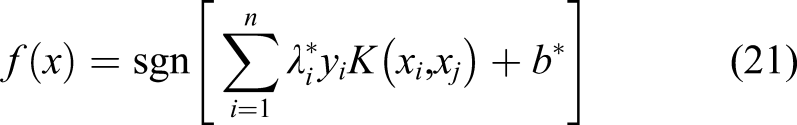
SVM finds an optimal classification hyperplane so that the sum of the distances from this hyperplane to the nearest sample in each class is minimized. Take the binary classification problem as an example, for n linearly separable samples

The details of SVM are described in Hearst et al. 32
The proposed method for feature selection and state recognition
NSGA-II has two objective functions, recognition accuracy and the total number of features fed into SVM, in this study. The recognition accuracy is the classification accuracy provided by SVM. The chromosomes of individuals in the population are encoded in binary form, “0” means the corresponding feature is not selected and “1” means it is selected. When NSGA-II runs, the algorithm maximizes the recognition accuracy and minimizes the total number of features simultaneously.
The multiple optimal solutions called “Pareto Frontiers” result from a multi-objective optimization problem.
33
The Pareto Front with the highest classification accuracy will be selected. In other words, by performing this step, we can get the highest accuracy recognition result and its corresponding lowest-dimensional feature subset. The detailed process is shown in Figure 6. Flowchart of joint optimization of feature selection and state recognition using NSGA-II and SVM.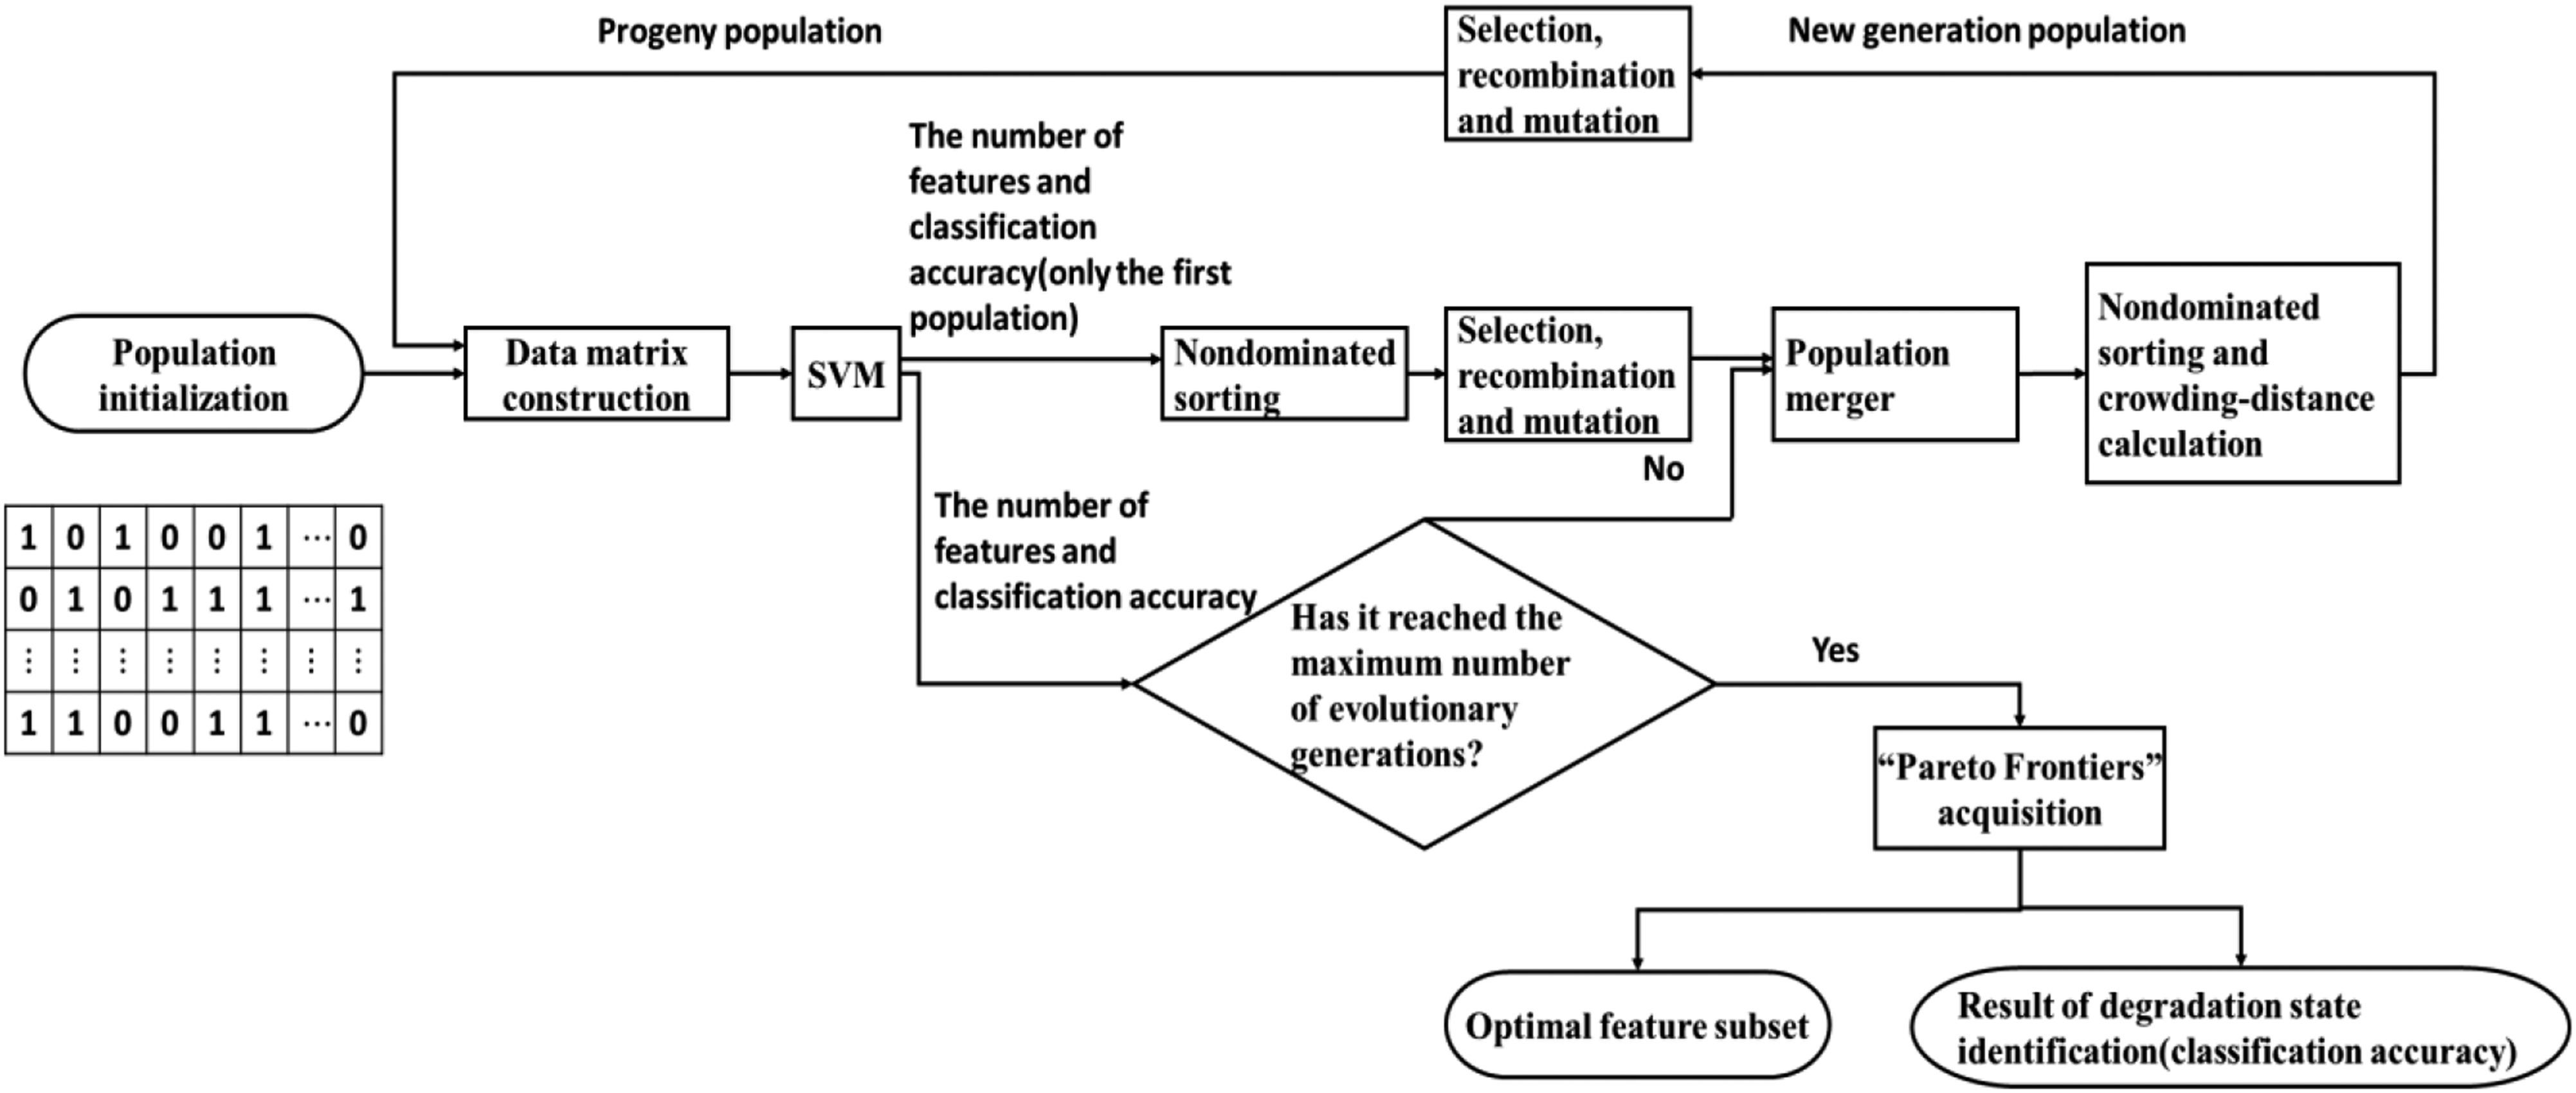
Suitable parameters determination
There are several parameters in the algorithms described above that need to be determined: Hierarchical layer h, radius r and two thresholds (t, n) of FAST feature detection, the same
The proposed degradation state identification method for hydraulic pump
The proposed method consists of the following four steps:
Step 1: Acquire the vibration signals for various degradation states of the hydraulic pump and divide them into several samples.
Step 2: Utilize the method described in subsection 2.1.4 to extract features from each sample. 90 features will be acquired according to the formula
Step 3: Integrate the features of all samples into a new dataset, and partition it into a testing dataset and a training dataset with a ratio of 1: 1.
Step 4: Utilize the method described in 2.2.3 to identify the different degradation states of the hydraulic pump, and the best feature subset is also obtained.
Experimental validation
A hydraulic pump test platform shown in Figure 7 was set up for data acquisition, which consists of a cooling system, a control system, a signal monitoring, acquisition and display system, a pressure regulating system, and a drive system. Hydraulic pump test platform.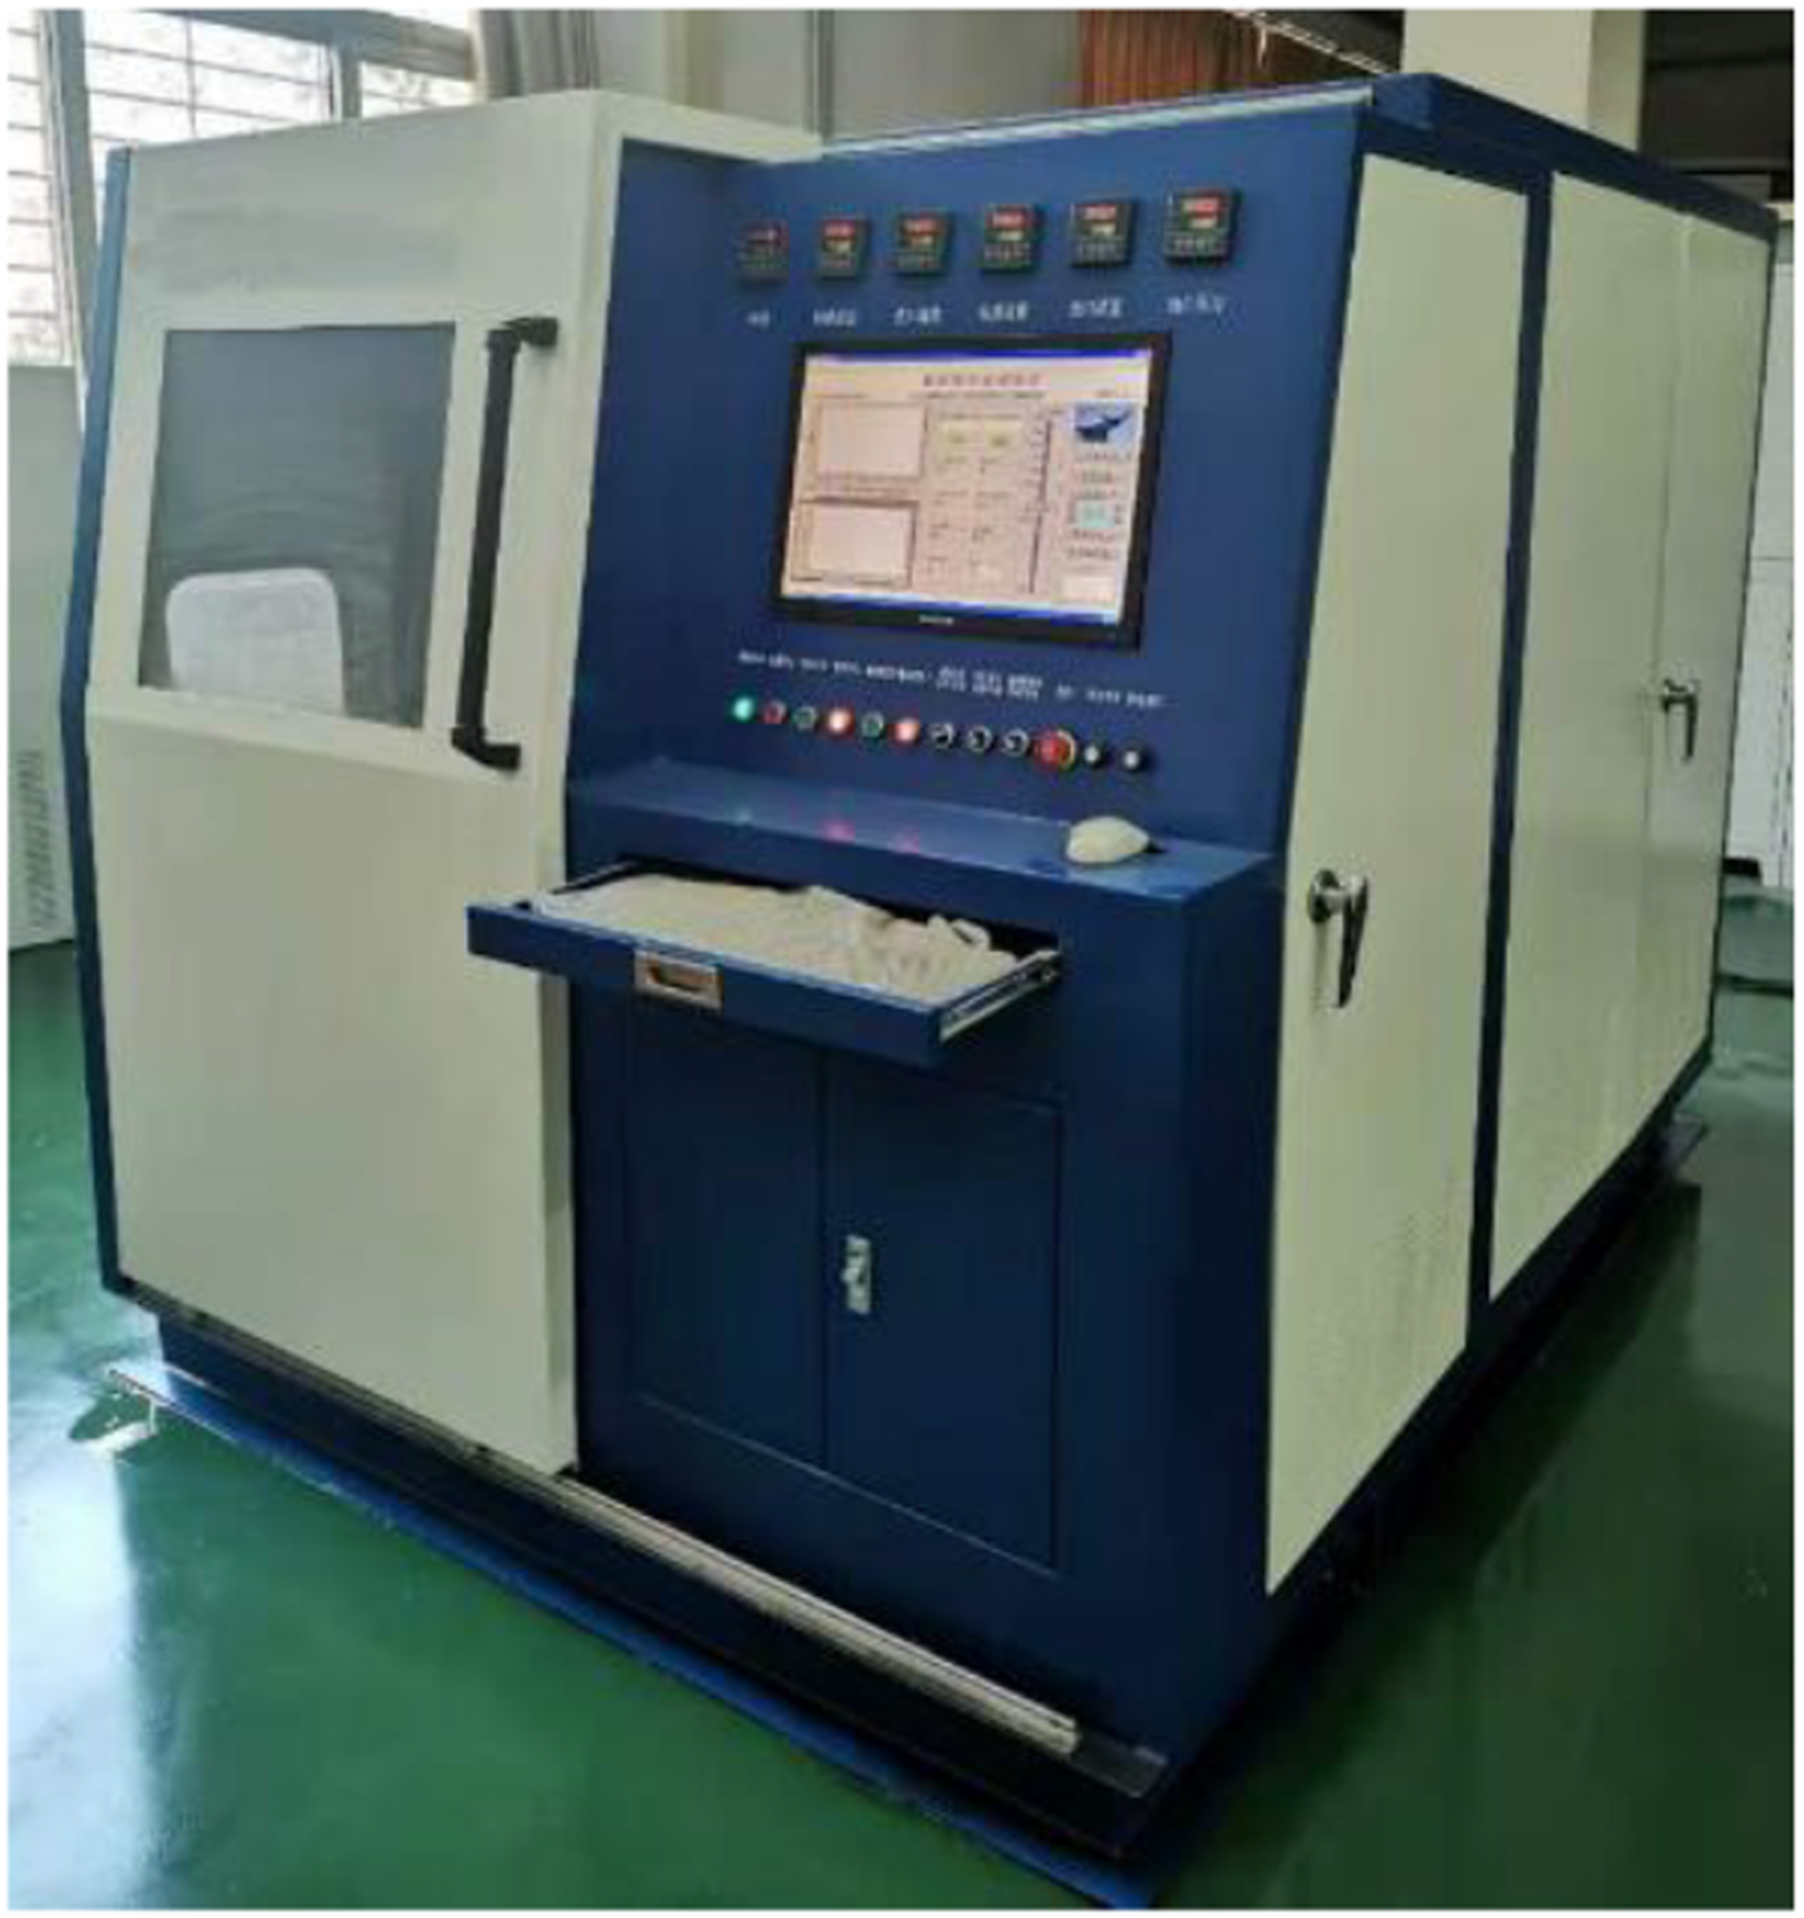
The hydraulic pump for this study is an axial piston pump with the following parameters: type: L10VS028DFR, displacement at the rated working condition: 28 Layout of the three vibration sensors.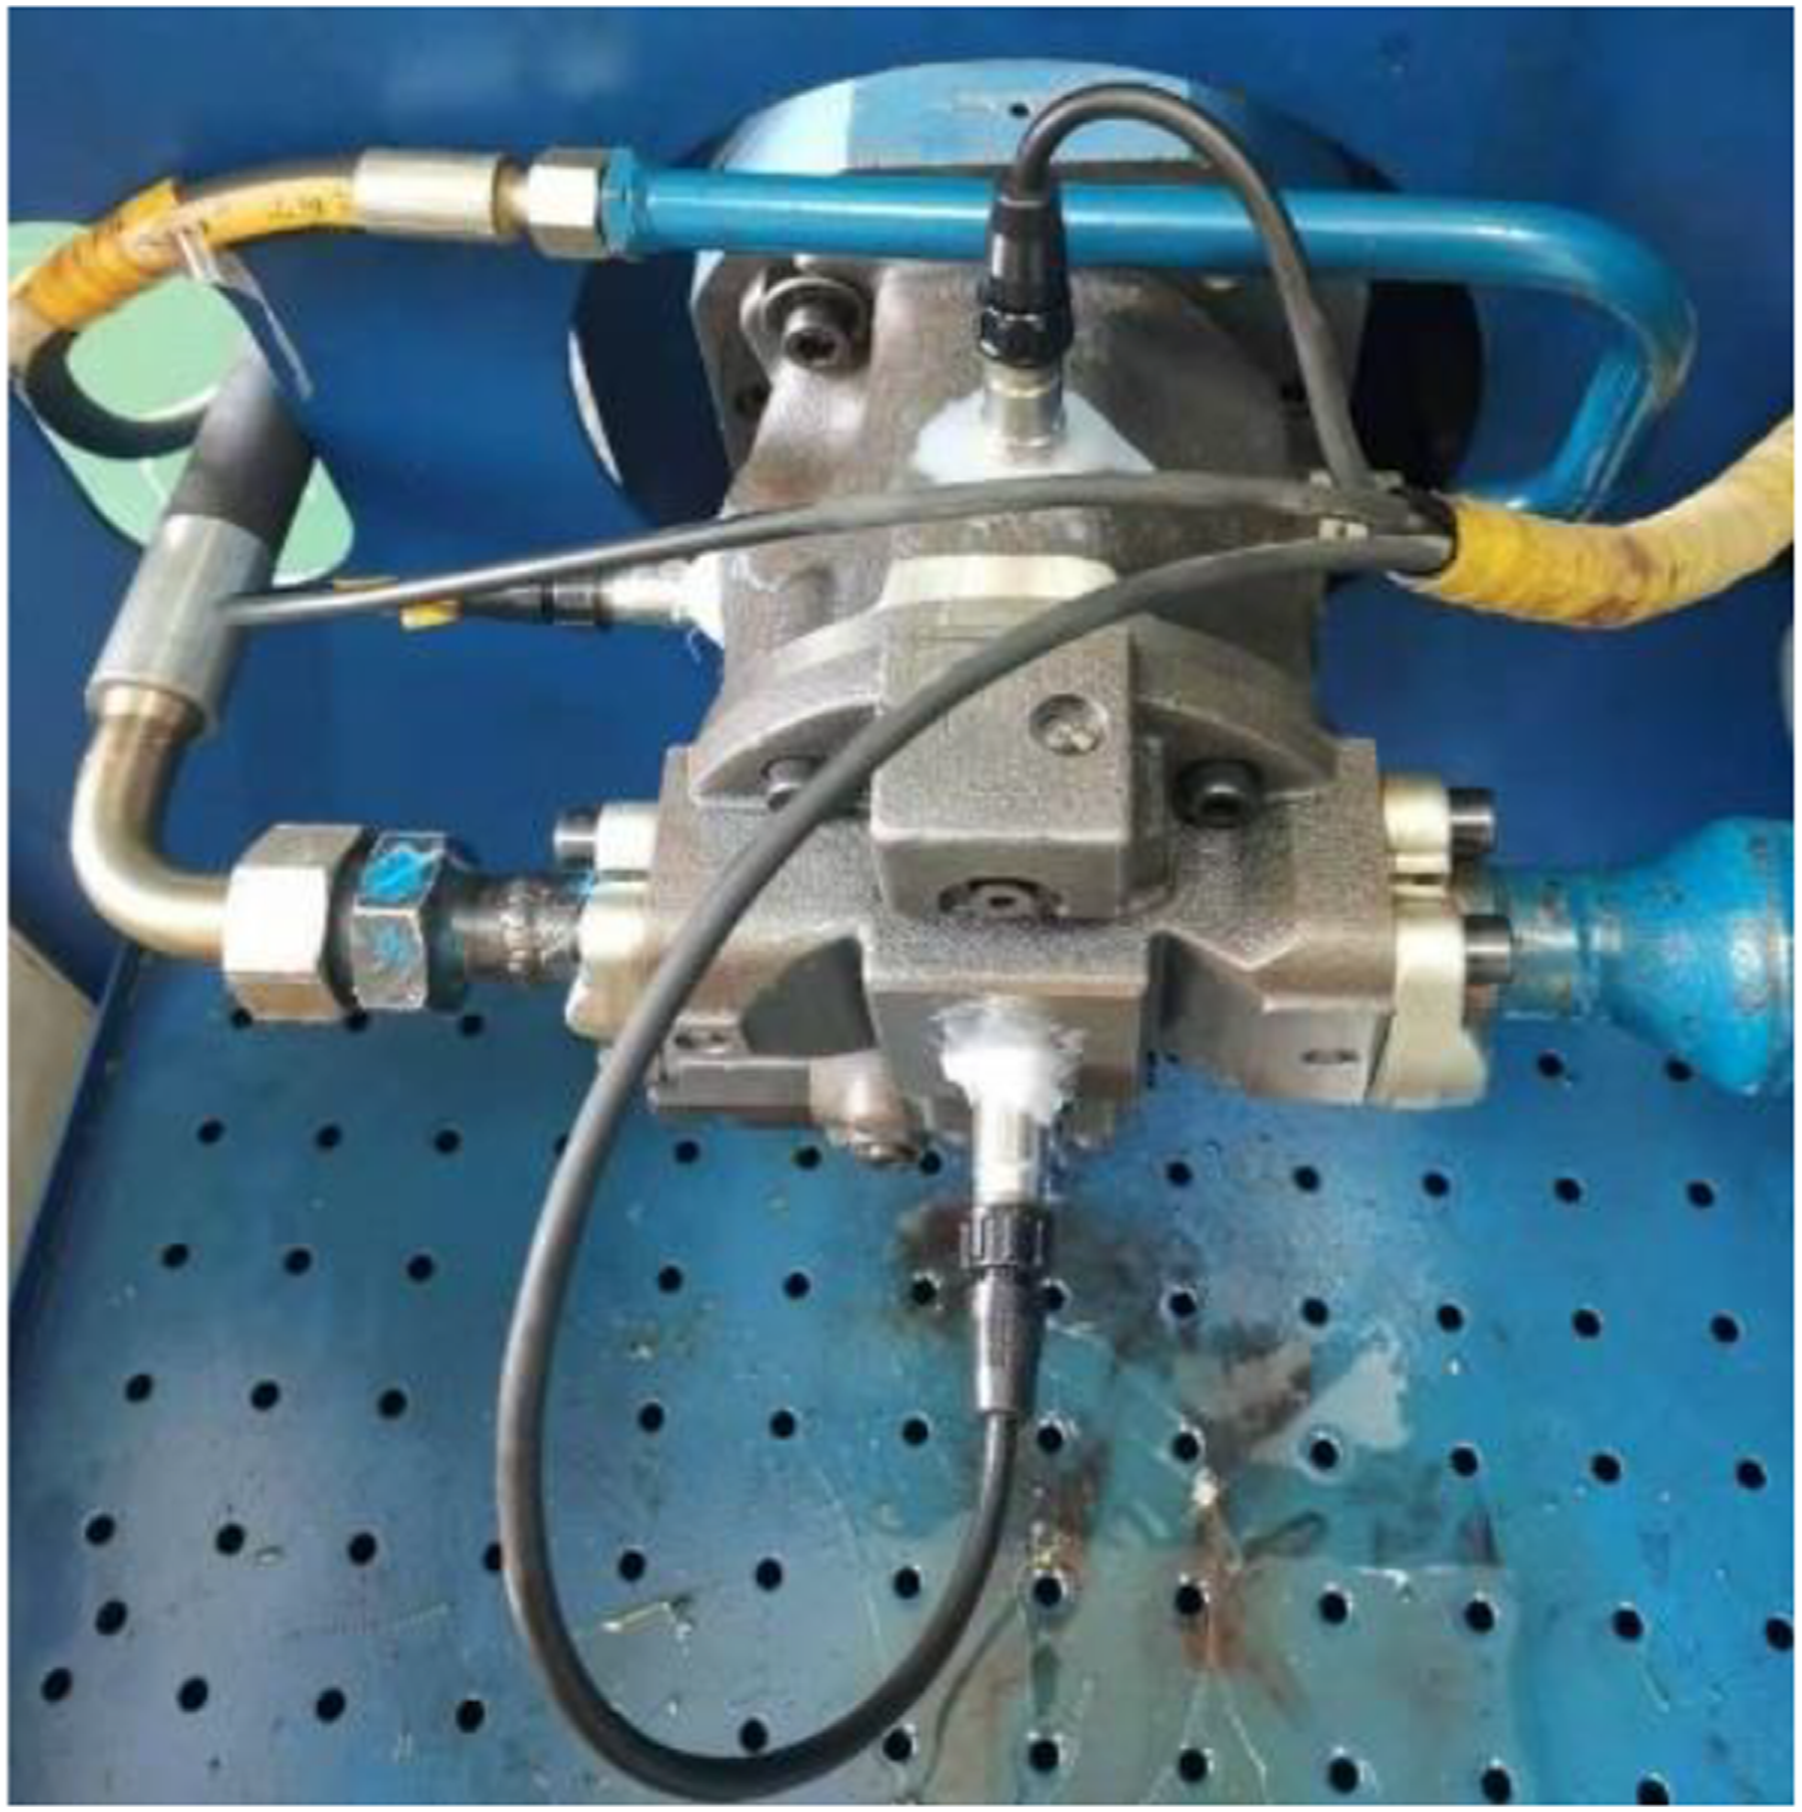
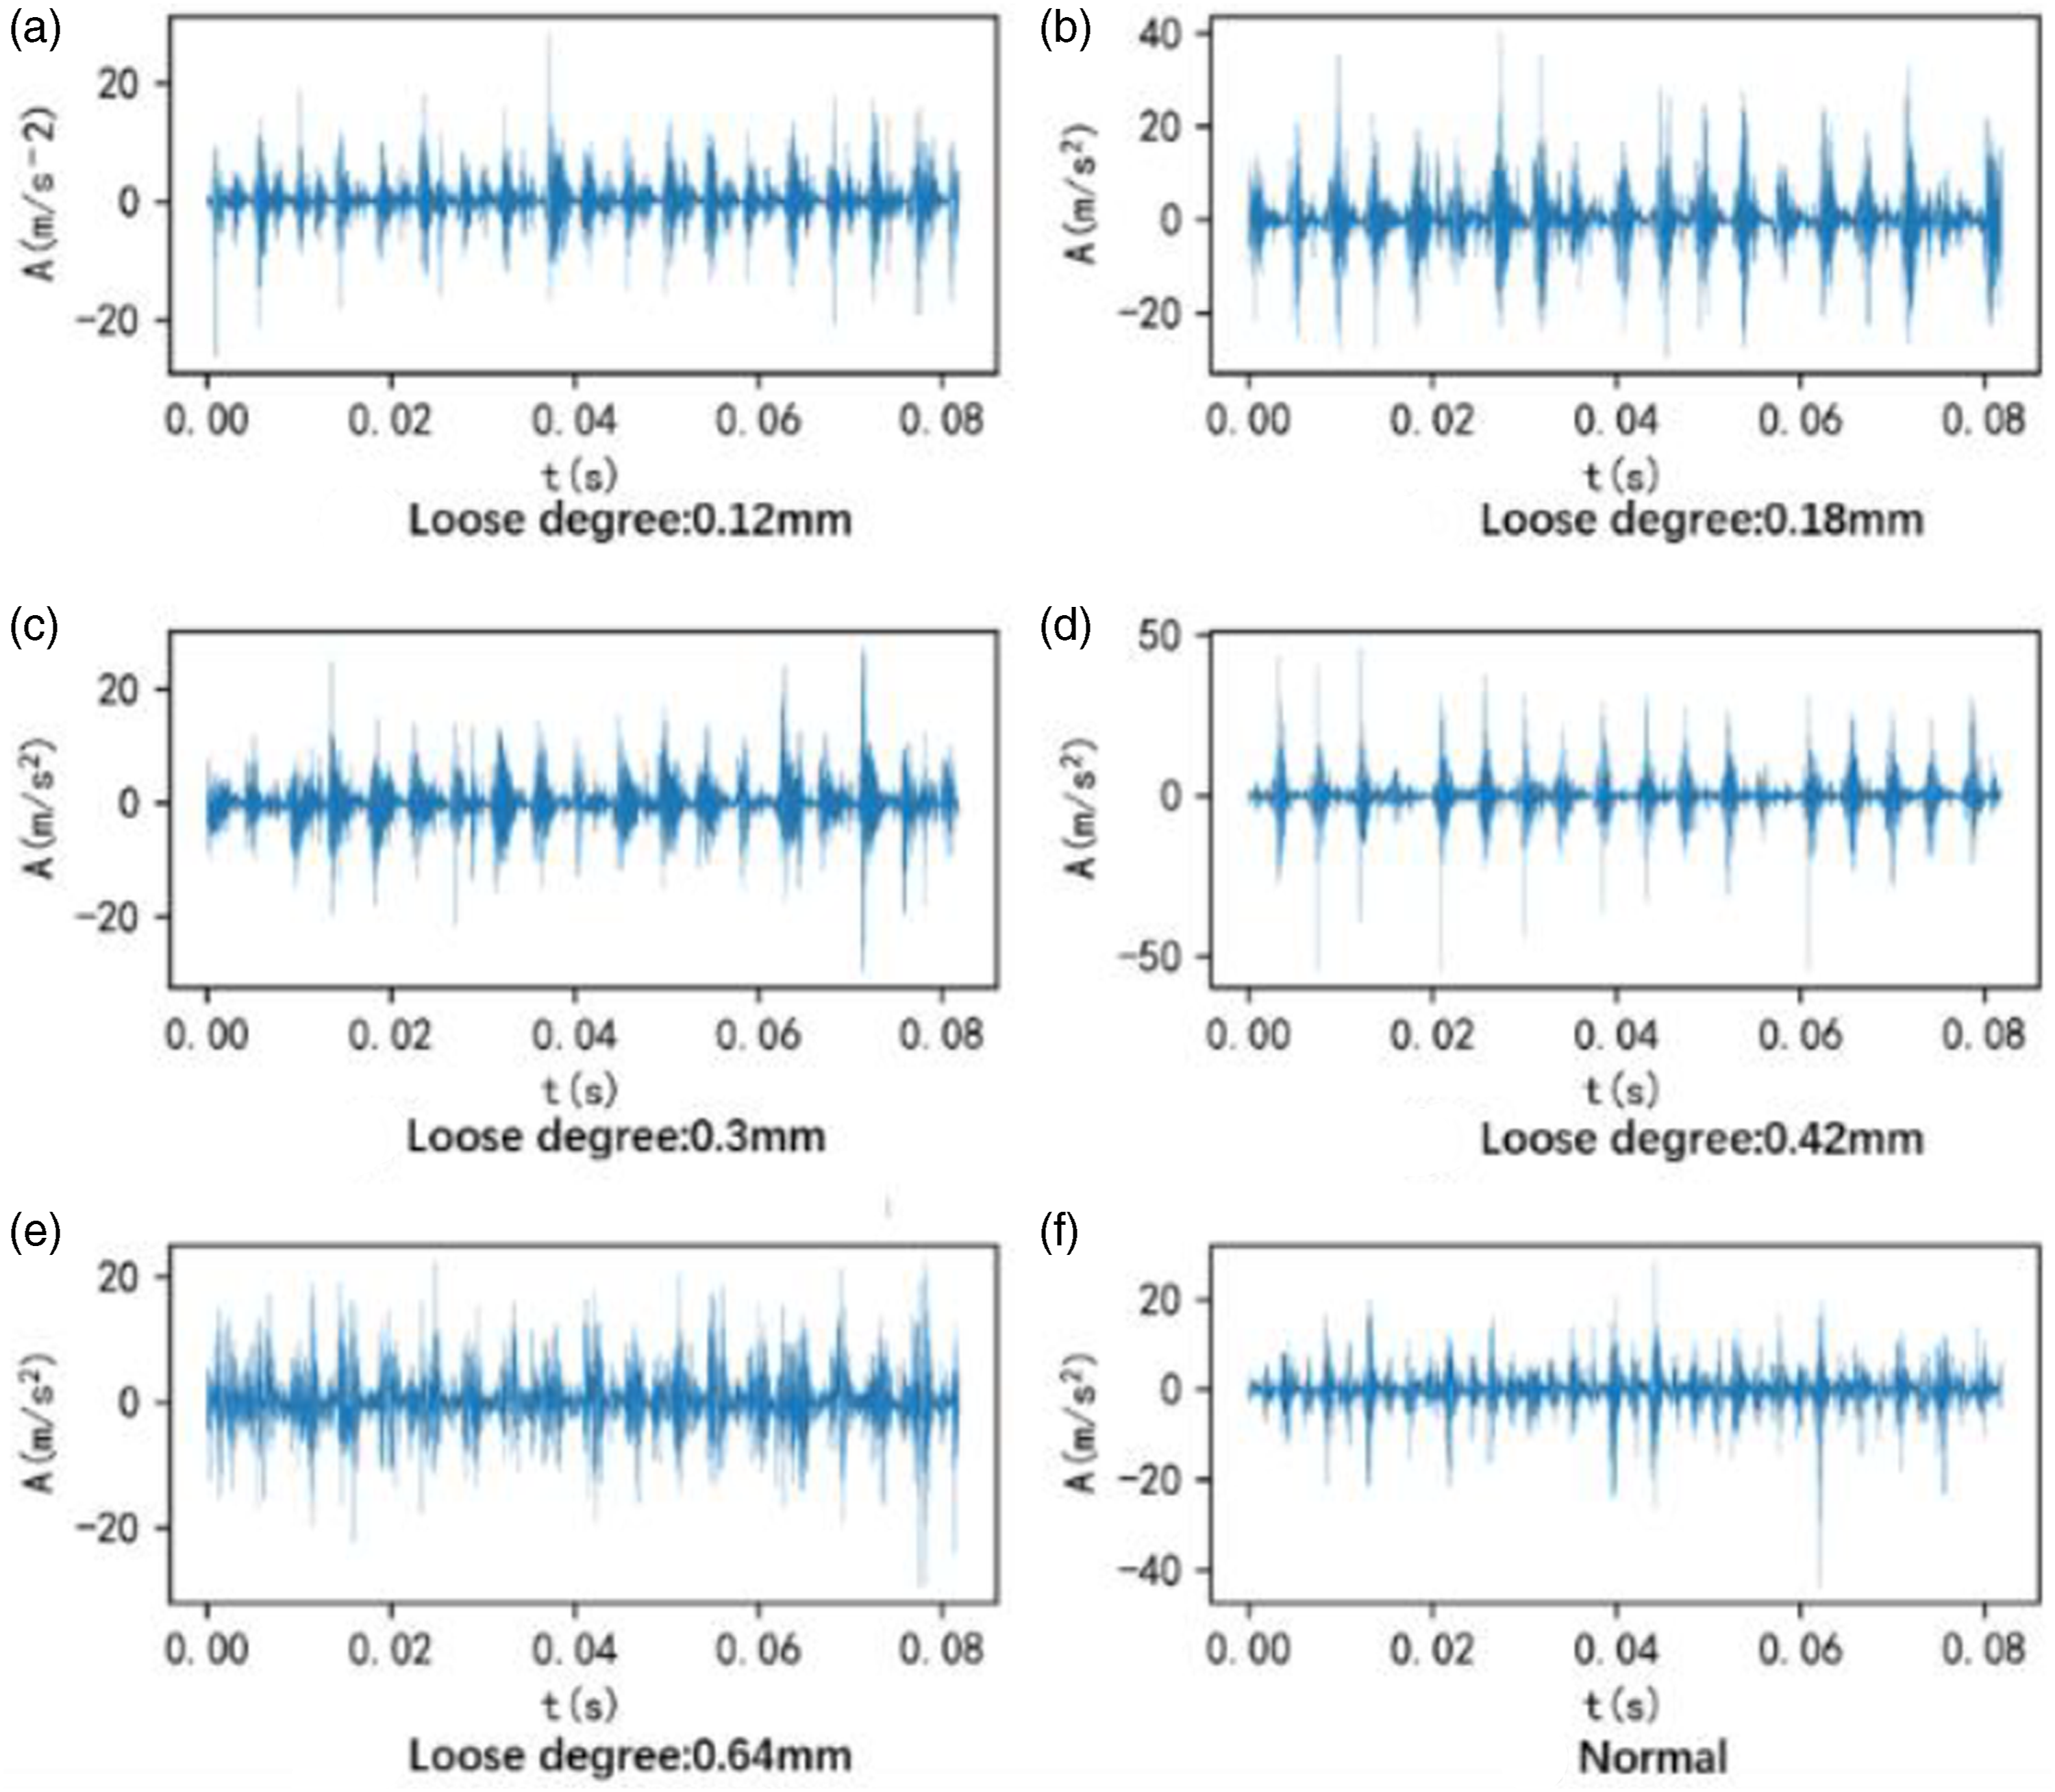
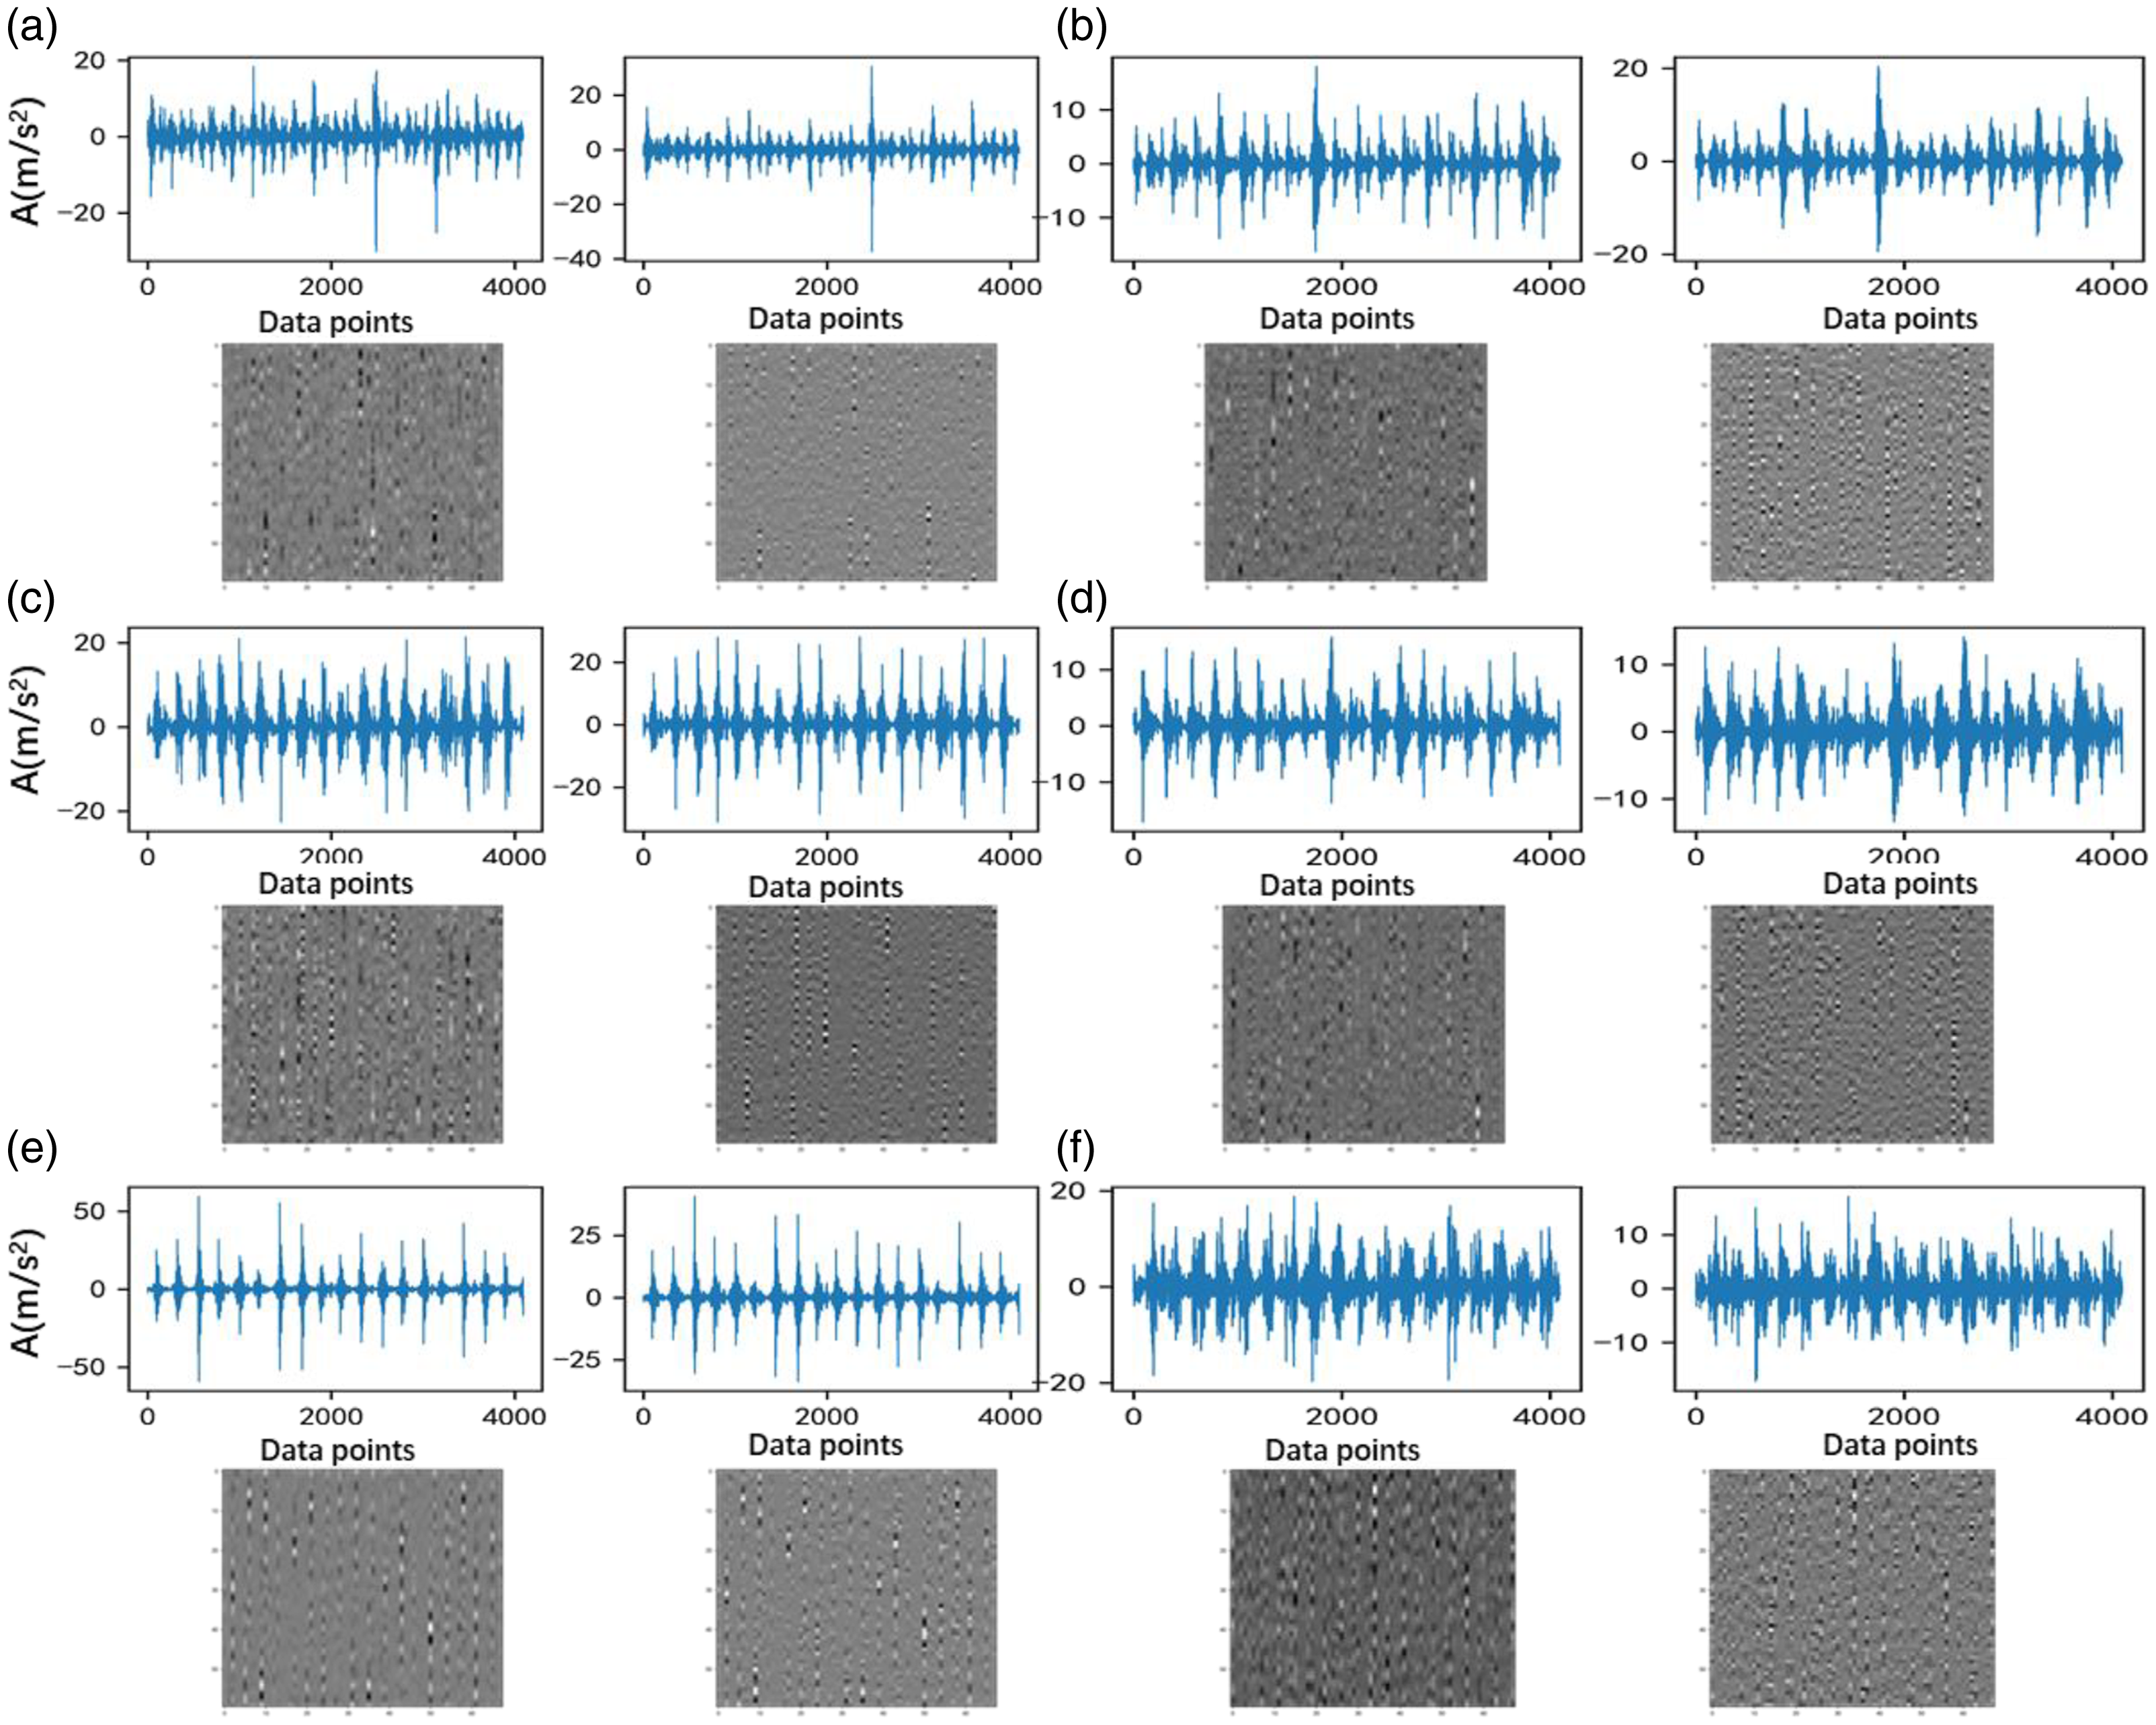
The single loose boot is studied in this paper because the loose boot is one of the common fault patterns of hydraulic pump. The gap between the plunger and the boot will increase when the loose boot occurs. To acquire vibration signals close to the actual situation, the normal plungers are replaced with failed plungers obtained after equipment maintenance. Five different degrees of the loose boot, as shown in Figure 9, are considered. Vernier caliper is used to measure the maximum radial distance between the boot and the plunger under the five different degrees. The five measurements considered as the loose degree are 0.12 mm, 0.18 mm, 0.3 mm, 0.42 mm, and 0.64 mm, respectively. Including the normal state which is considered as a special degradation state, a total of six different degradation states are considered. The data of each degradation state is divided into 100 samples, and each sample consists of 4095 data points. The time domain waveforms of several samples are shown in Figure 10. Furthermore, one sample of each degradation state is decomposed into two sub-signals using MHD, and their time domain waveforms and gray-scale image representations are shown in Figure 11. When the figure is analyzed, it is difficult to separate the degradation states from each other using the time domain waveforms. However, all images appear to be differentiated from each other. Therefore, the conclusion that the image representation of the signal is useful is reinforced. Five different degrees of loose boot: (a) 0.12 mm; (b) 0.18 mm; (c) 0.3 mm; (d) 0.42 mm; and (e) 0.64 mm. Time domain waveforms of several vibration signal samples. Time domain waveforms and image representations of the sub-signals: (a) normal; (b) loose degree: 0.12 mm; (c) loose degree: 0.18 mm; (d) loose degree: 0.3 mm; (e) loose degree: 0.42 mm; and (f) loose degree: 0.64 mm.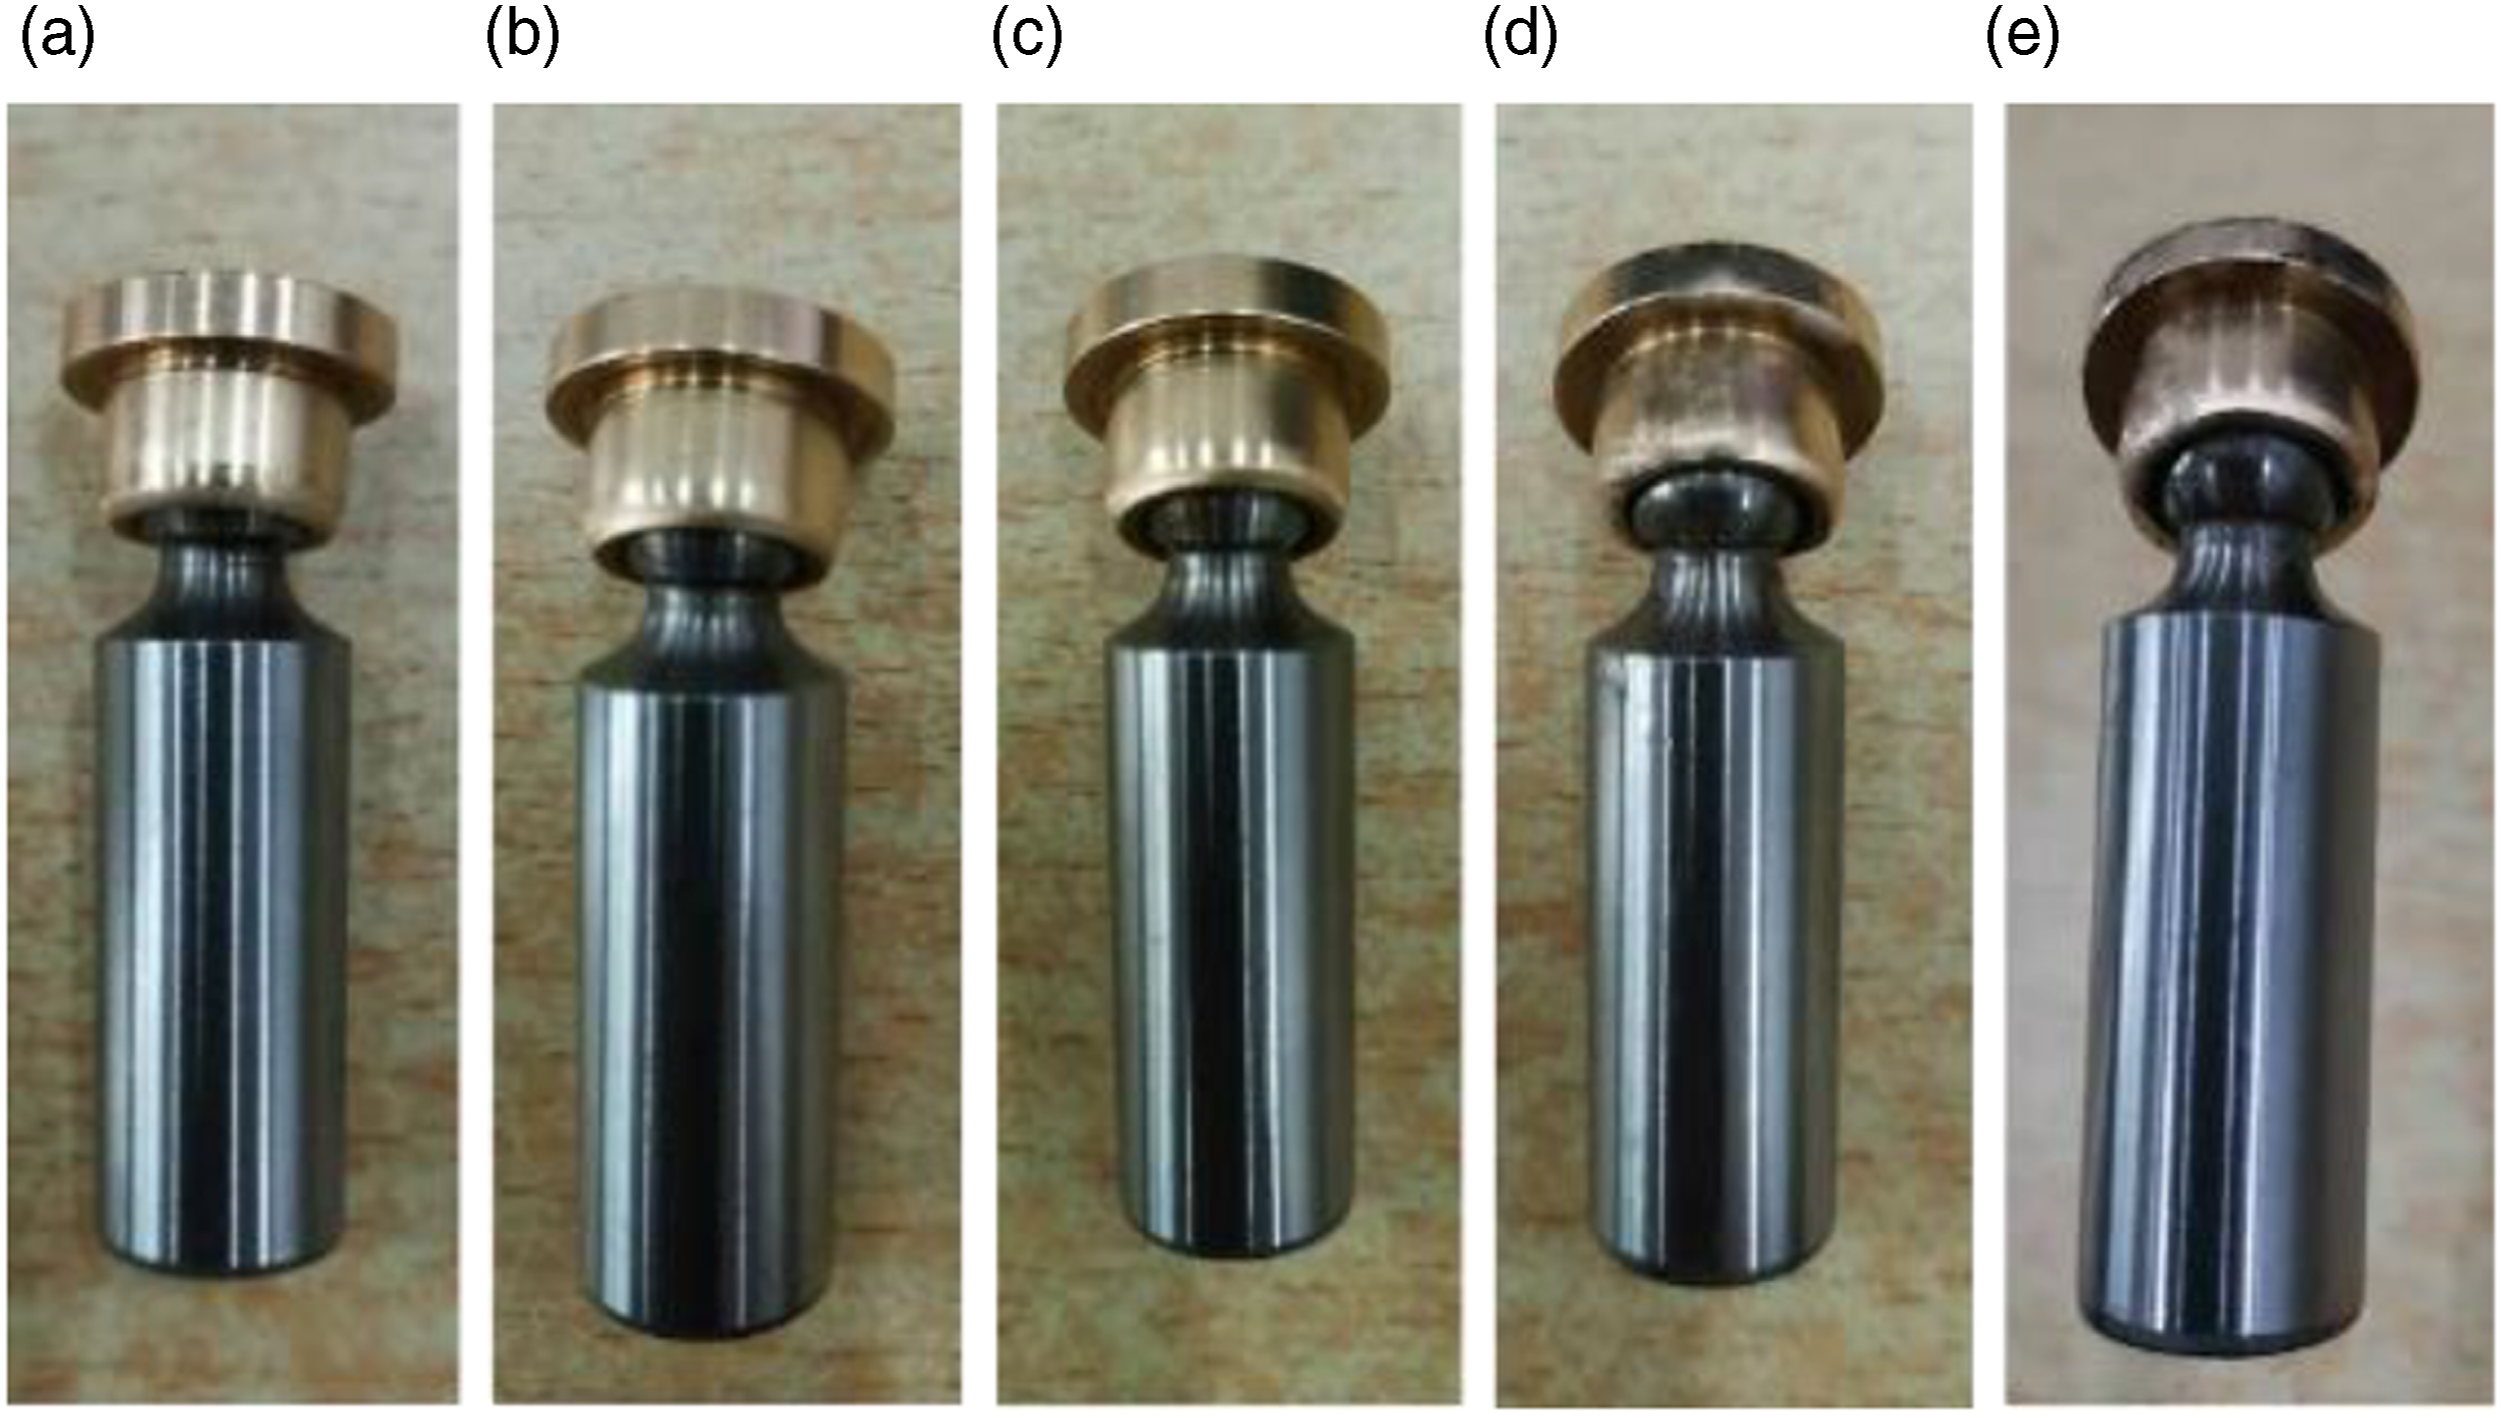
Experiment 1: Selection of parameters
,
,
, and Ksize
In this experiment, 600 data samples are directly converted into 600 images for testing. The threshold The number of feature points of different degradation states under different t.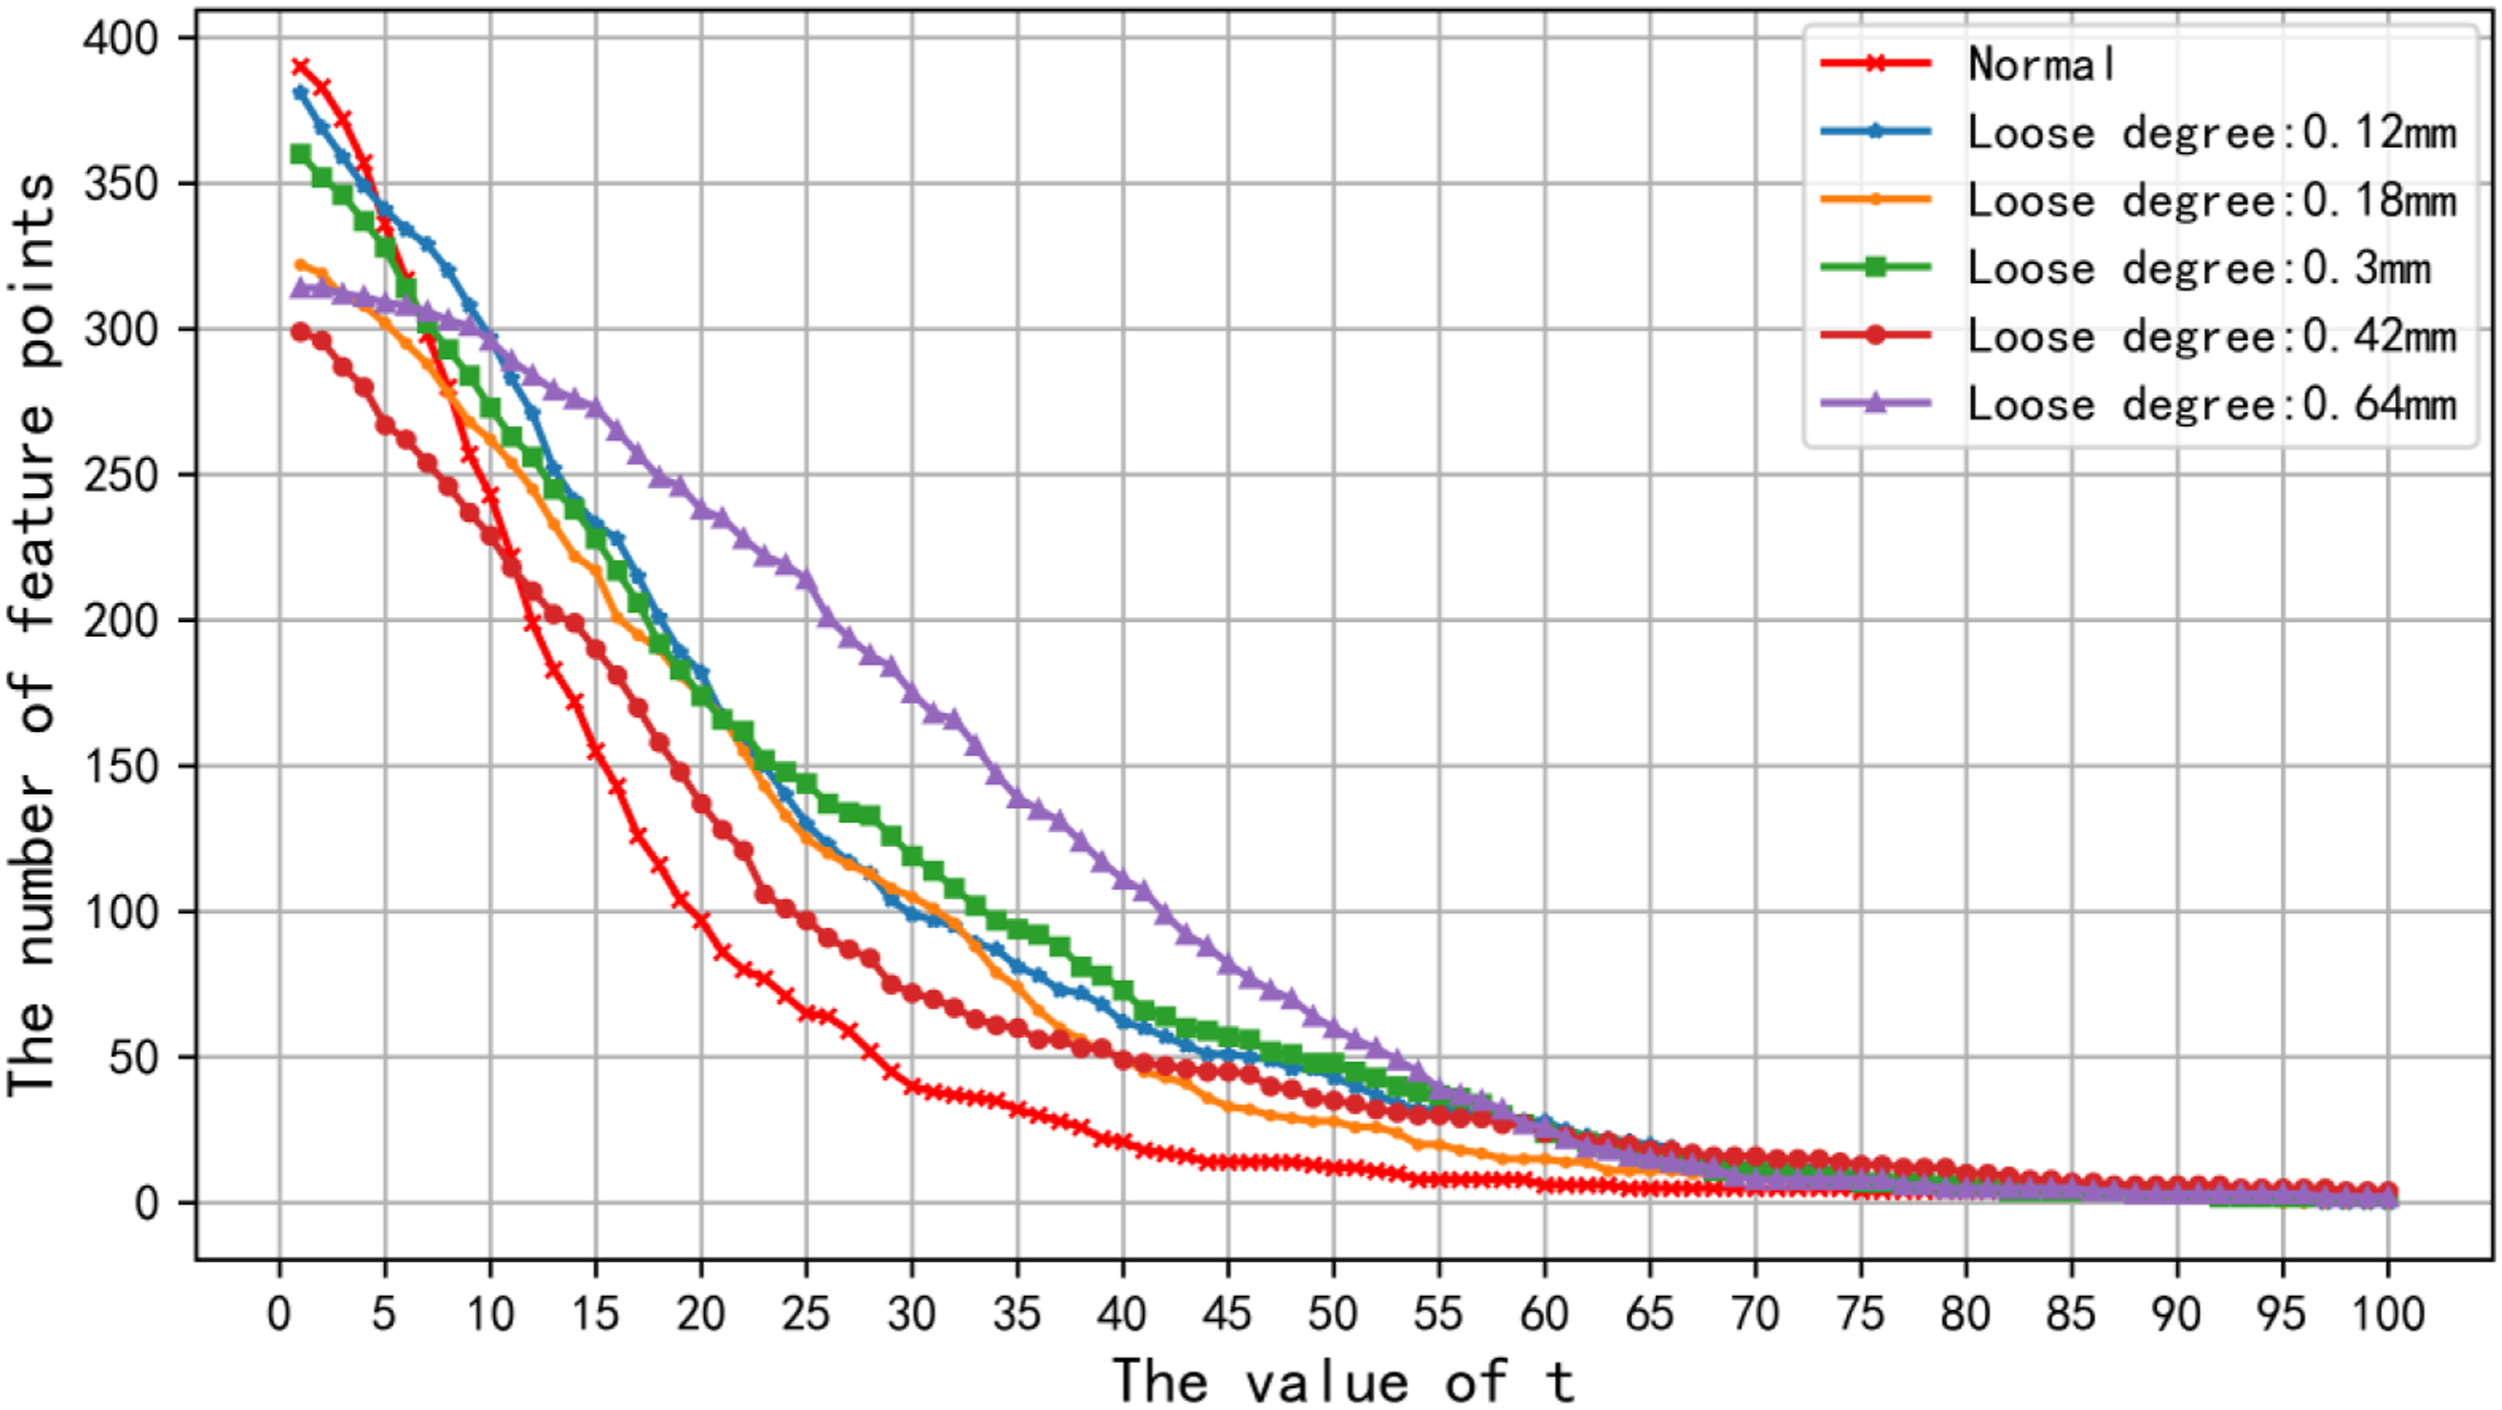
The Ksize value should be generally an odd number so that the filter kernel is centered on a pixel. As the Ksize value increases, neighbors in a larger neighborhood of a pixel participate in the convolution operation on the pixel. Some unrelated neighbors may participate if the Ksize value is too great. Likewise, some useful neighbors may be discarded if the Ksize value is too small. 38
The parameter
To verify the relationship between these three parameters and classification accuracy, we assign values to them for testing. The result is shown in Figure 13. It can be seen that the distribution of scattered points is not messy but regular. The scattered points with high classification accuracy are clustered together. The following phenomena have been noticed: (1) When the value changes in a range greater than 10, Ksize has little effect on accuracy. The scattered points with high classification accuracy are basically in this range. (2) The scattered points with high classification accuracy are mainly gathered in the open interval Two angles of the visualized relationship between classification accuracy and the parameters Ksize, σ, and t: (a) angle 1 and (b) angle 2.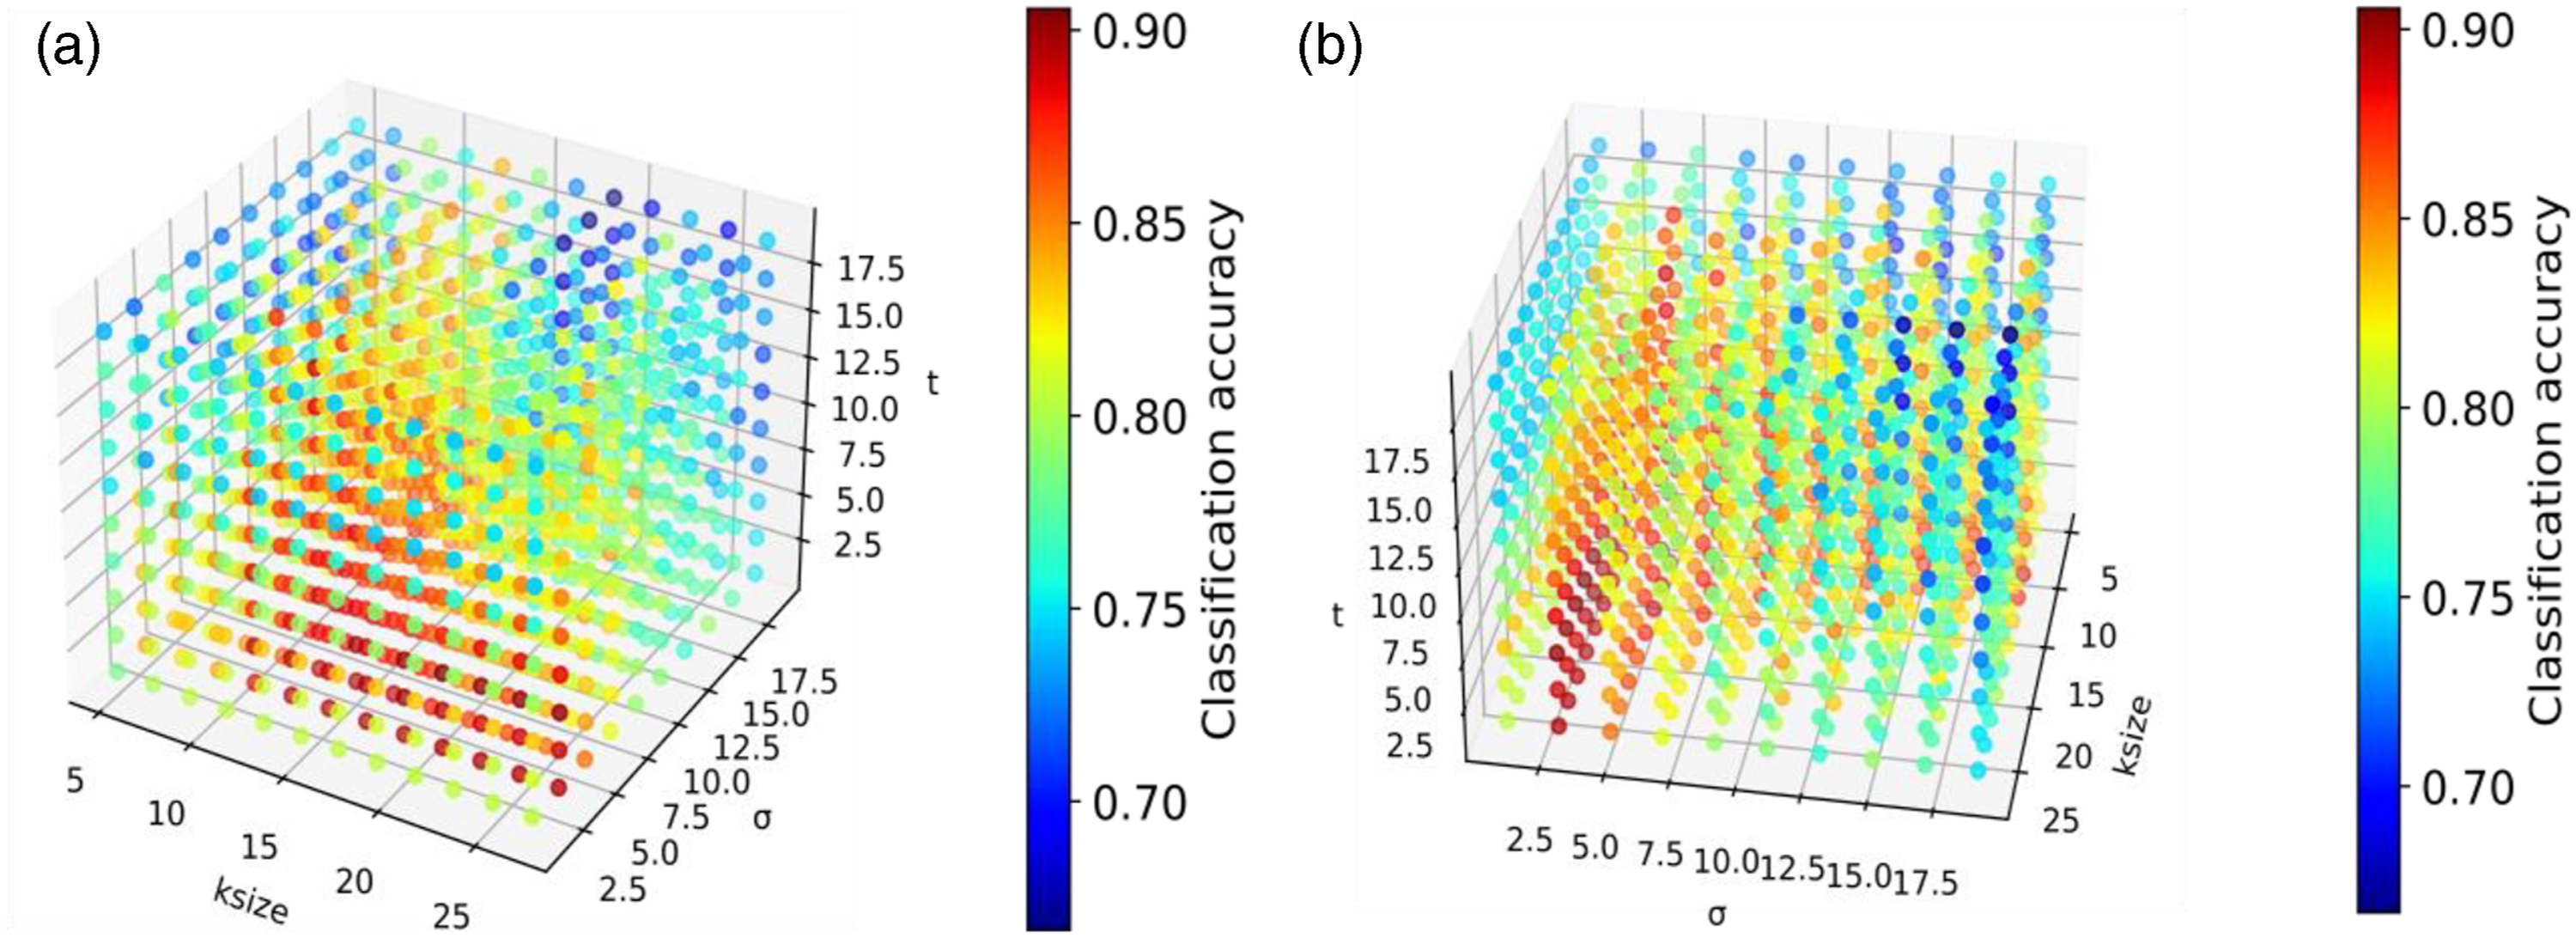
In order to finally determine the values of the parameters, we set the value ranges of the three parameters as Classification accuracy under different values of Ksize, σ, and t.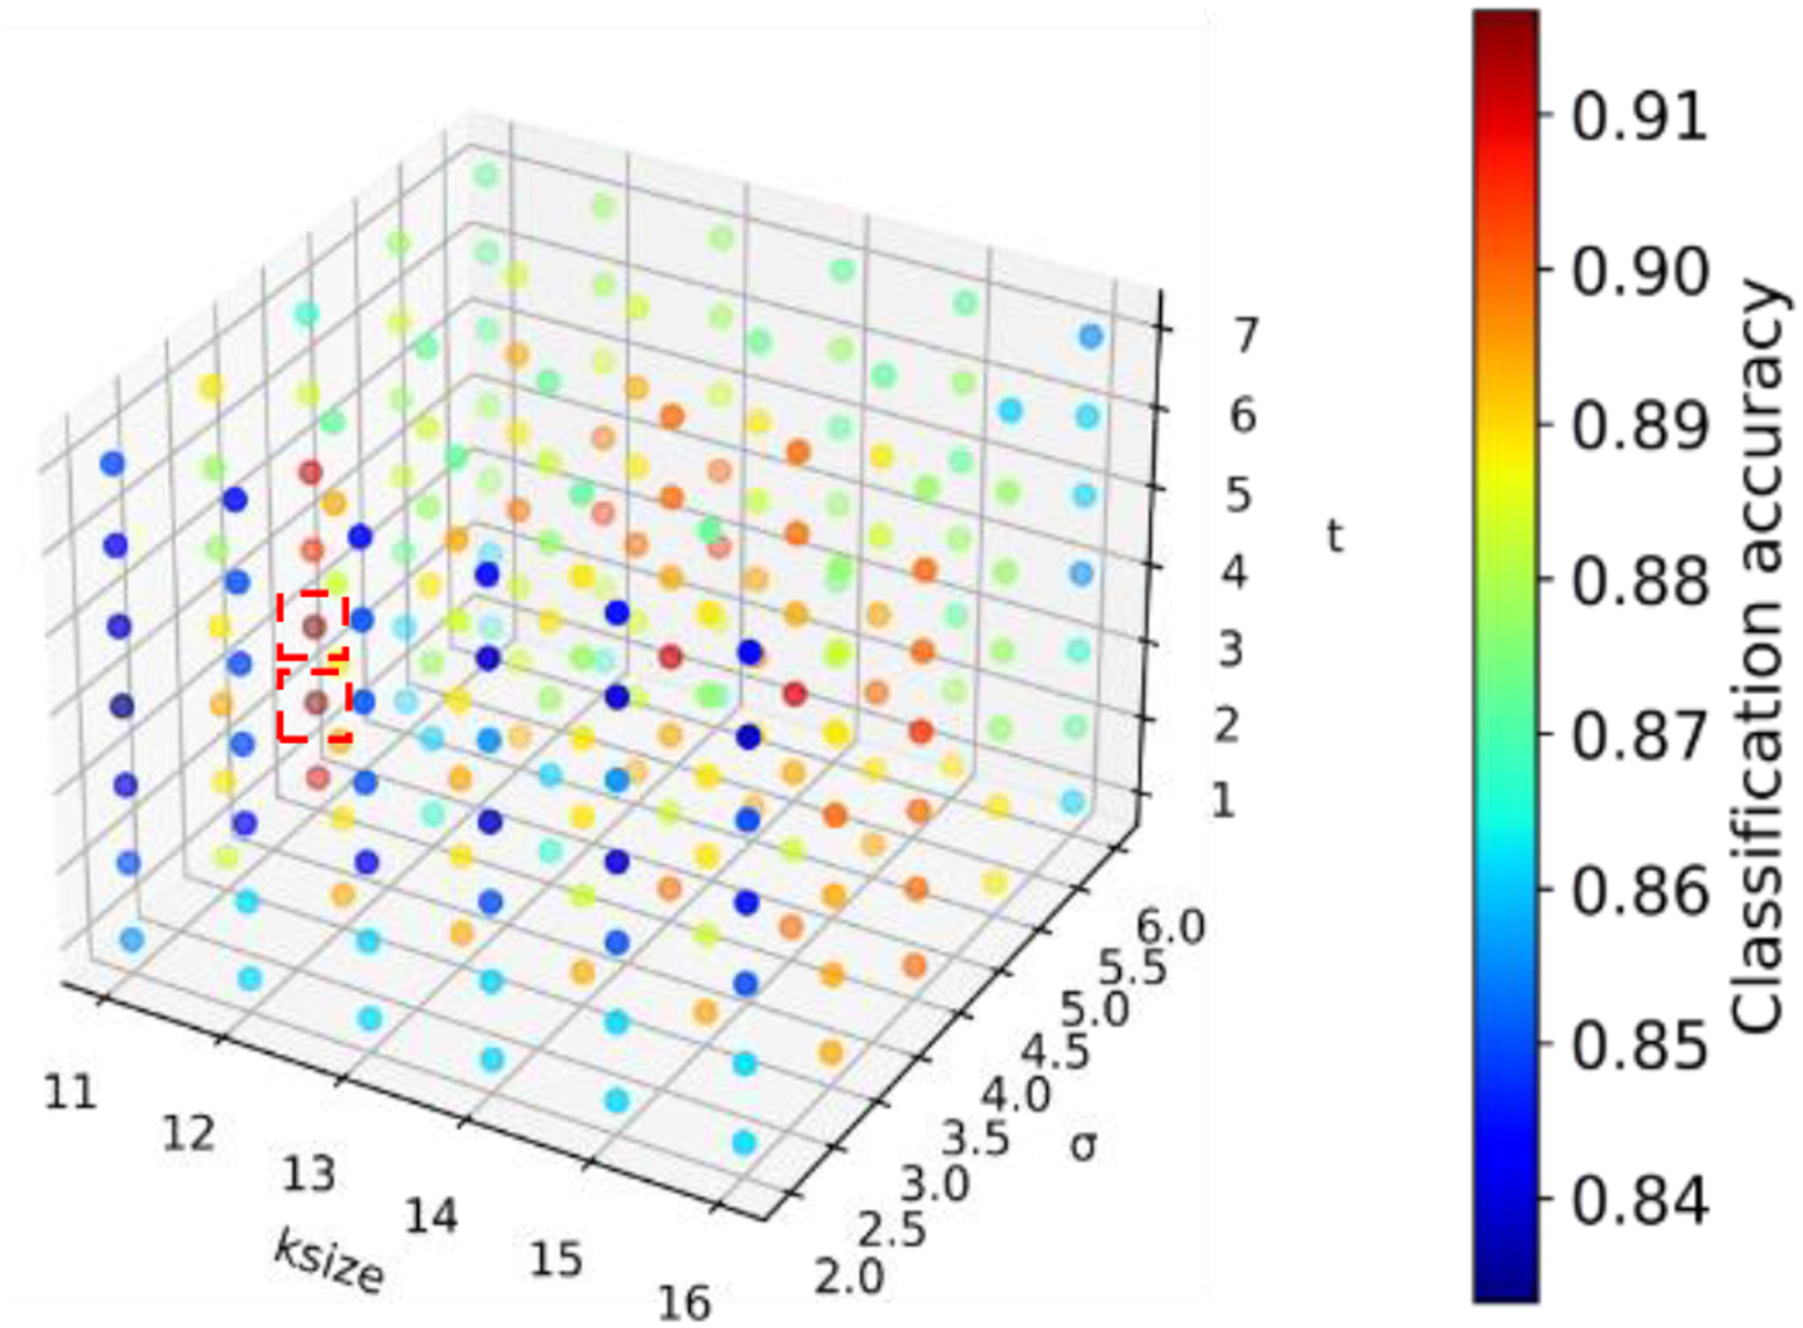
Experiment 2: Verification for the necessity of modified hierarchical decomposition
The following four methods are used to identify the degradation states of the hydraulic pump.
Method 1: The steps of Method 1 are the same as those described in subsection 2.4 except that the MHD is not applied. That is, only the 6 features of the original signal are extracted.
Method 2: The
Method 3: The proposed method described in subsection 2.4. 90 features are acquired.
Method 4: Apply Method 2 after applying the MHD to the original signal. 360 features are acquired.
From the above description of the four methods, it can be seen that the main differences between Method 1 and Method 2 are as follows: The image window in Method 2 is divided into small spatial regions called “cells,” and several adjacent “cells” are merged as a “block.” However, the image window in Method 1 is not divided into cells. Each method is implemented 10 times to reduce random effects. The highest classification accuracy obtained in each run is shown in Figure 15. Table 1 gives the statistical results of accuracy. Classification accuracy of the 4 methods in experiment 2. Classification accuracy statistics of the 4 methods in experiment 2.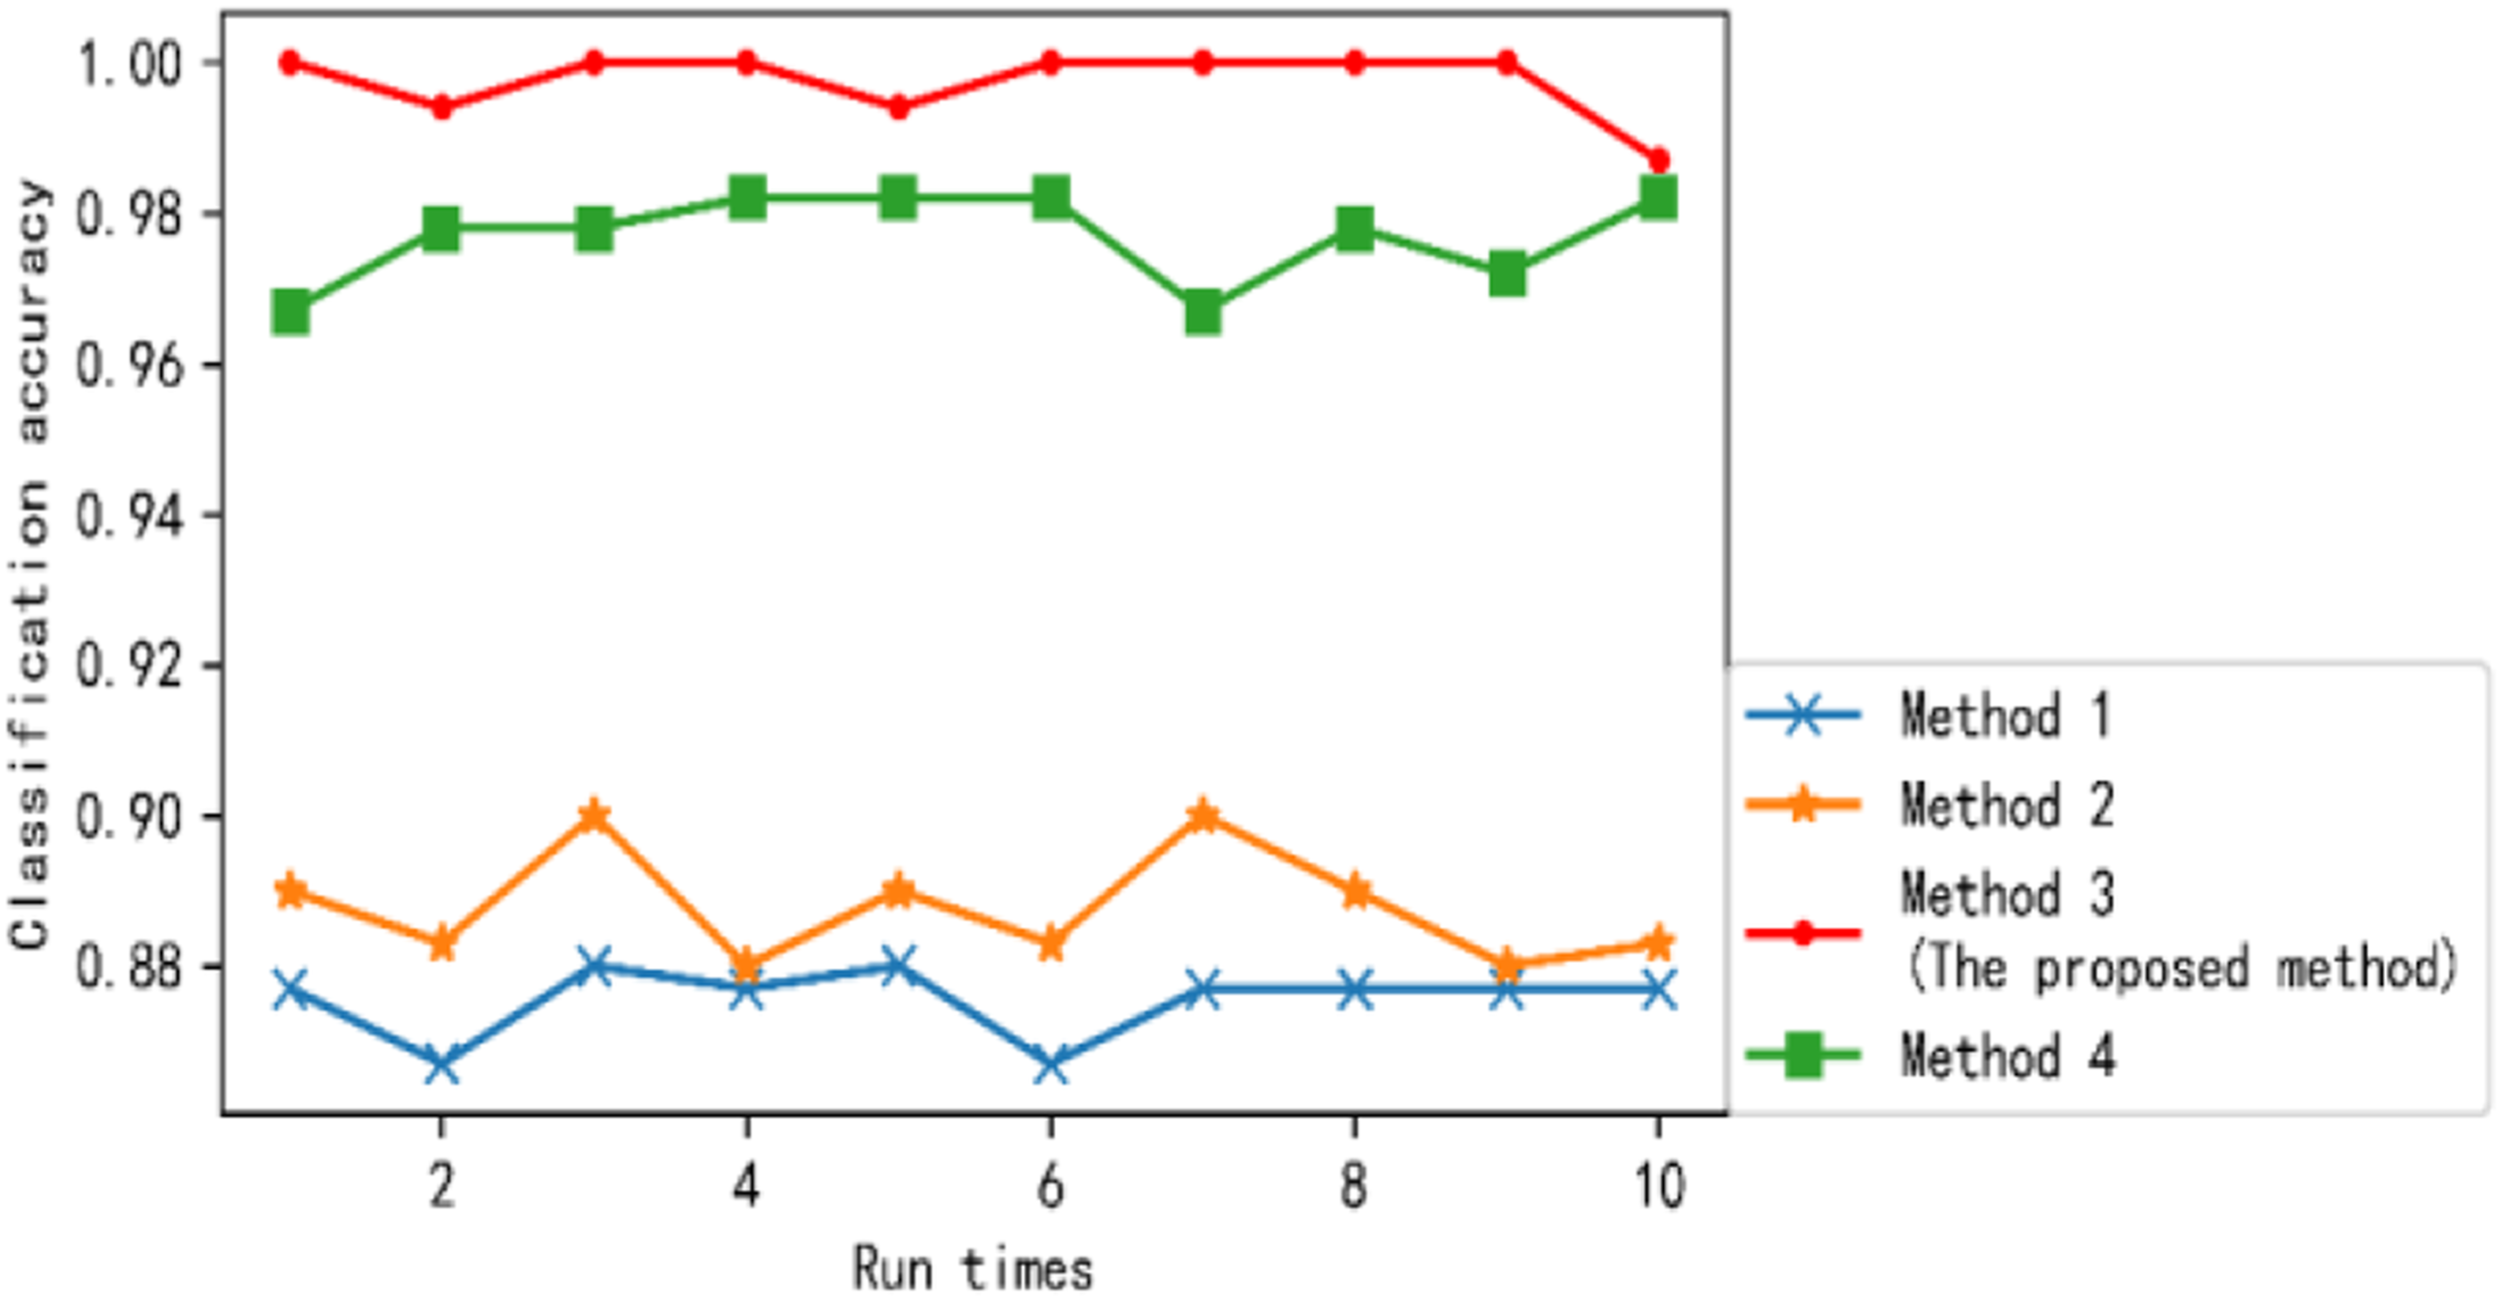
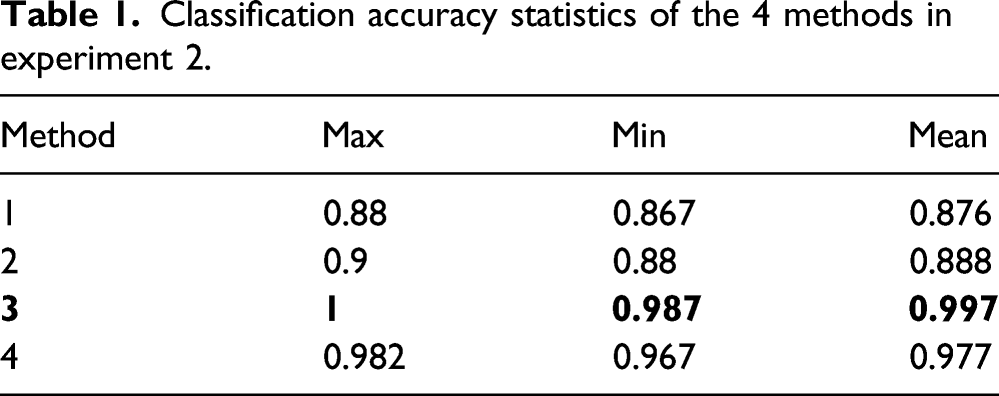
The following information is drawn from Figure 10 and Table 1: The classification accuracy obtained by Method 2 is higher than that obtained by Method 1. What is more noticeable is that the classification accuracy obtained by the proposed method is significantly higher than that obtained by Method 4. The proposed method achieves the highest classification accuracy (100–98.7%). There are 3 reasons for the result. First, in Method 2, more detailed information can be obtained since the image is divided into cells. However, each sample only consists of 4095 data points, which results in a smaller gray-scale image. Therefore, the contribution of dividing the image into cells to the classification accuracy is limited. Second, dividing the image into cells and applying the MHD together will improve the classification accuracy, but it will also produce more redundant information. Third, for samples with a small number of data points, not dividing the image into cells based on MHD and FAST feature detection is more beneficial to obtain useful information.
Experiment 3: Comparison among the proposed method, LBP, and 1D-TP
As mentioned in Kaplan et al.,
11
when LBP is applied to texture feature extraction, all non-uniform patterns are assigned a bin in the histogram, and each uniform pattern is assigned a bin. We set 8 neighbors for the central pixel. In this case, 59 features are acquired. We set 8 neighbors for the central point, threshold Comparison results of three methods in experiment 3: (a) classification accuracy and (b) number of features corresponding to classification accuracy. Degradation state identification of the 3 methods in experiment 3.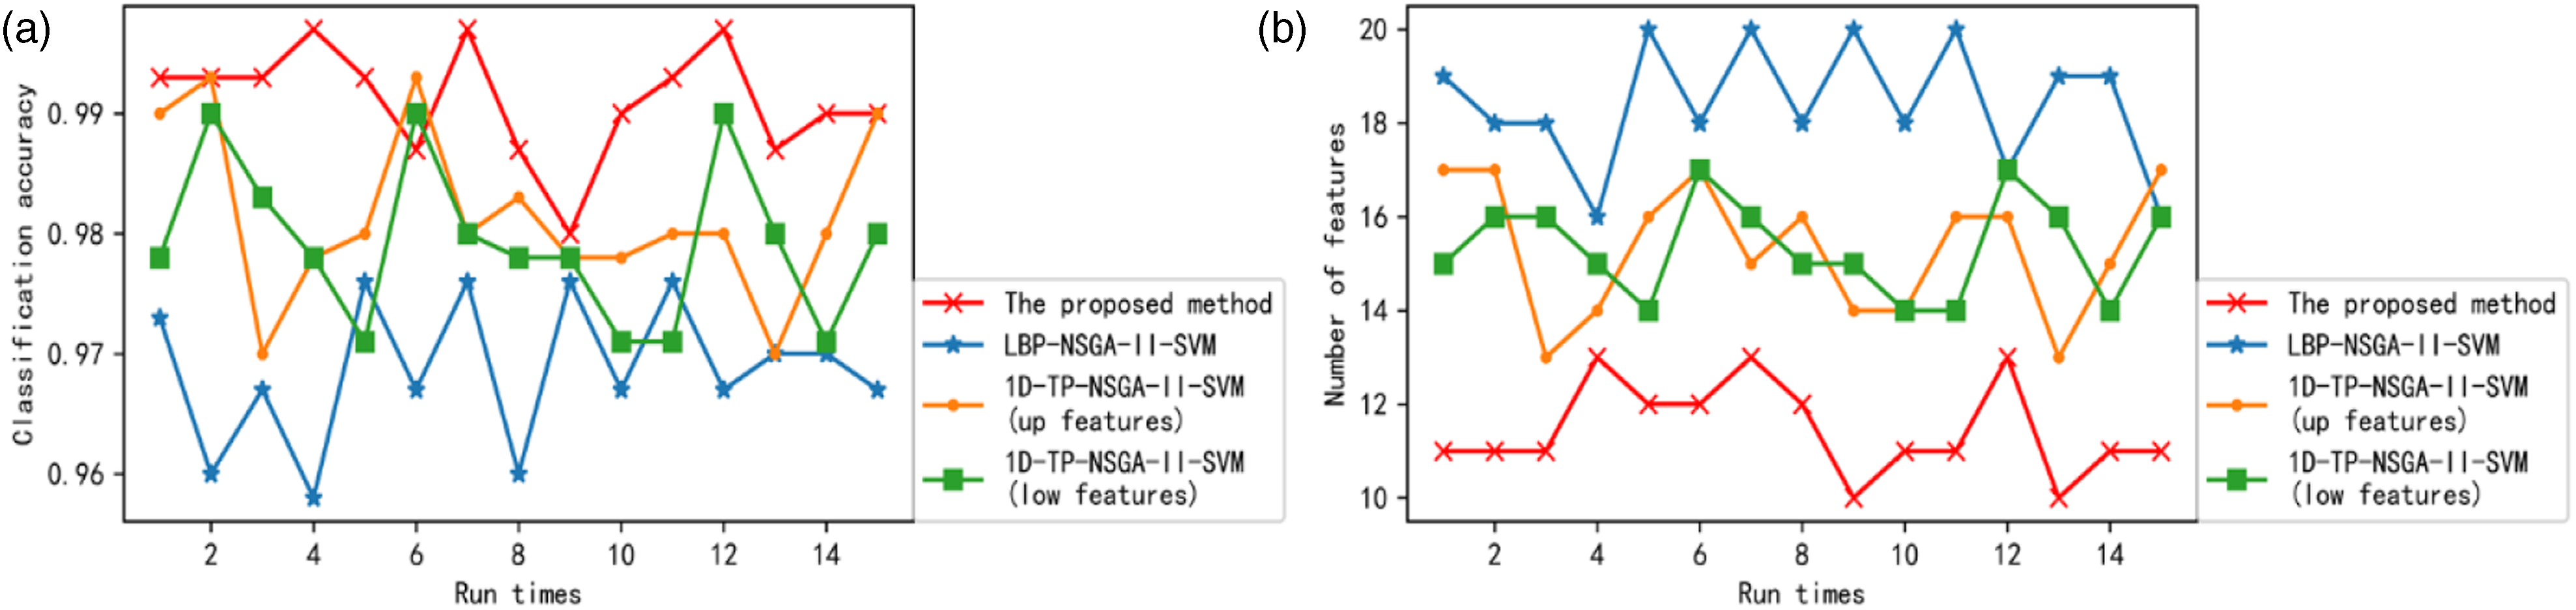
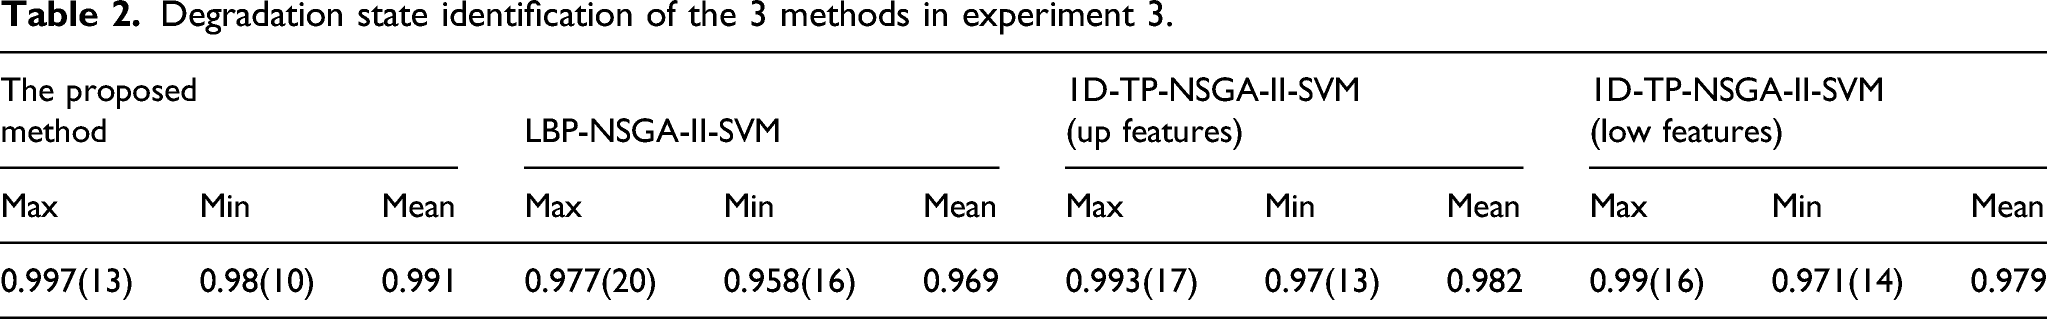
There are three reasons for the results. First of all, the proposed method for feature extraction combines the merits of FAST and Gabor filter. It can comprehensively reflect the local and global information of images. Second, the MHD enhances the integrity of the mined information. Third, in contrast, LBP and 1D-TP are insufficient in reflecting the information of signals.
Summary
To effectively extract the degradation features of hydraulic pumps, a novel method based on MHD and image feature extraction is proposed. The original signals are decomposed and transformed into gray-scale images. FAST algorithm and Gabor filter are applied to the images, and the histograms constructed by the filter response of the feature points are considered as feature vectors. They can fully reflect the local and global information of small-size samples. The effectiveness of the novel method and its superiorities in degradation feature extraction are validated using the experimental data. Furthermore, a new strategy for identifying the degradation states of hydraulic pumps is proposed based on our feature extraction method, NSGA-II and SVM. The experimental results show that the six different degradation states of the hydraulic pump can be successfully identified by the proposed method. This paper has 4 major contributions as follows: (1) The combination of FAST feature detection and Gabor filters can effectively obtain local and global information of the image. (2) MHD was introduced to increase the ability to obtain information. (3) A novel method based on our feature extraction method, NSGA-II and SVM was proposed, which was applied to degradation state identification for hydraulic pumps. (4) The superiority of the method proposed in this paper was demonstrated with experimental signals.
In this study, the experimental data comes from a hydraulic pump with prefabricated faults. The purpose of the experiment is to verify the effectiveness of the proposed method in identifying the degradation state of the hydraulic pump. When it comes to condition monitoring of an actual hydraulic pump, the real-time vibration data of the hydraulic pump is acquired first. After dividing the data into some samples, the feature representations are calculated according to the feature extraction method proposed in this paper. Vibration data of the prefabricated faults has extracted features in advance. In this way, two sample sets are obtained. The sample set belonging to the actual hydraulic pump is considered as the testing set. The other is considered as the training set. These two sample sets are fed to the NSGA-II-SVM proposed in this paper to conduct feature selection and state recognition, and the degradation state of the actual hydraulic pump can be identified. As the identification continues, the training set can be continuously updated, which is conducive to the subsequent identification.
In previous studies, some effective feature indicators were proposed by us. Fusing the degradation features proposed in this paper with them is the focus of further studies.
Footnotes
Acknowledgments
The authors gratefully acknowledge the support of National Natural Science Foundation of China (Grant No. 51275524).
Declaration of conflicting interests
The author(s) declared no potential conflicts of interest with respect to the research, authorship, and/or publication of this article.
Funding
The author(s) disclosed receipt of the following financial support for the research, authorship, and/or publication of this article: This project is supported by National Natural Science Foundation of China (Grant No. 51275524).