
Abstract
In this study, a non-stirred Particle Image Velocimetry (PIV) testing device is developed to measure the flow field in a solid–liquid two-phase centrifugal pump. The pump casing and impeller are made of an organic glass material. Two types of impellers are designed considering different structure parameters. The performance curves of the pump are obtained for the different impellers at a rotating speed of 900 rpm with particle concentrations of 0%, 3%, 5%, and 10%. The flow fields for water and a solid–liquid two-phase mixture for the two impellers are measured utilizing the PIV system in a centrifugal rotating frame at the designed condition. The distribution of the particles, together with its influence on the performance of the different impellers, is analyzed. From a comparison of the relative velocity vector fields, the following can be concluded. First, the pump with a double arc-shaped profile demonstrated a more uniform and stable flow field distribution and higher performance than that with a single arc profile. Secondly, the solid particles were distributed mainly at the outlet of the impeller and volute wall, whereas the concentration distribution of the larger particles tended to match the pressure surface. This research can provide theoretical guidance for the design and optimization of two-phase flow centrifugal pumps.
Introduction
A liquid/solid flow centrifugal pump is key equipment in the delivery of a mixture containing both water and particles, and it has been widely used in numerous industrial applications such as coal-water slurry transportation, dredging, and irrigation. Serious wear in flow components and low efficiency, which widely exist in a Liquid/Solid flow centrifugal pump, are the most common shortcomings in its generalization and application. However, owing to the complexity of two-phase flow, neither theoretical research nor a design principle has been developed systematically and maturely. The laws of Liquid/Solid flow remain in the exploratory stage and have not yet been identified seriously. Hence, the majority of the current designs must depend on the experience and conceptions in engineering practice, and thus the performance of pumps designed in this manner cannot be guaranteed. Therefore, fundamental studies on internal flow in such centrifugal pumps are necessary and urgent, from which a theoretical basis can be developed to design pumps with higher performance and longer service life.
Testing the internal flow field of a centrifugal pump by experimental means is the most direct and reliable method for Solid/Liquid two-phase flow; it is also the most effective method to verify the degree of compliance between the numerical simulation results and actual flow field. Flow field experiments typically measure the average particle velocity distribution and particle concentration distribution of the two-phase flow pump, and the motion trajectory of the particles in the blade passage. Presently, a non-contact measurement method has been widely used in the research of solid–liquid two-phase centrifugal pumps. PIV (Particle Image Velocimetry) has become the most popular measurement method because of its advantages. Roco et al.1,2 conducted an experimental study on the performance curves of centrifugal slurry pumps with different structures when transporting slurry. It was remarked that in the solid–liquid mixed flow, the evaluation of the overall performance characteristics of the slurry pump should consider the influence of single factors on pump performance. Walker et al.
3
selected solid particles of two particle sizes as the research object and studied the effects of different slurry parameters on the performance of the centrifugal pump. The experimental results indicate that the blade profile is the main factor influencing the head and efficiency of the pump. In addition, Sussman et al.,
4
Wei,
5
and Xu
6
comprehensively analyzed the Liquid/Solid flow law in centrifugal pump impellers using theoretical analysis and experimental research and obtained useful laws such as the average velocity field of particles and the distribution of particle concentration in the pump. Under certain working conditions, the external characteristic performance and life of the solid–liquid two-phase centrifugal pump depend on the geometric parameters of the impeller and the characteristics of the volute.7–12 The head of the centrifugal pump depends mainly on the outer diameter of the impeller. It is generally believed that the head increases with the increase in the outer diameter. Blade width
In summary, although the predecessors have achieved considerable research results,17–21 owing to the complexity of the internal flow of the solid–liquid two-phase centrifugal pump, the Liquid/Solid flow law for impellers and volutes has not been fully revealed, which also hinders the development of design theory for solid–liquid two-phase centrifugal pumps. Hence, this paper attempts to obtain the relative solid–liquid two-phase velocity field under different conditions using experiments and explain the solid–liquid two-phase movement in the pump, its influence on the performance of the centrifugal pump, the distribution of solid particles in the impeller, and the influence on the wear of the flow passage parts of the solid–liquid two-phase centrifugal pump.
Test facility for PIV measurement
As shown in Figure 1, a non-stirring PIV test device is designed. During the experiment, the solid particles only circulate in the pipeline and do not enter the water tank. Therefore, a relatively high concentration of particles two-phase flow test can be realized with fewer particles, which reduces the cost of the experiment. The agitator is removed, which reduces noise and energy consumption. A shaft encoder is adopted to make the shooting location more accurate. This device has the advantages of simple structure, low noise and less power consumption. It can be used for inner flow field test both single phase medium and solid liquid two phase medium, which is a kind of multi-functional PIV test device is adapt to a variety of experimental conditions.
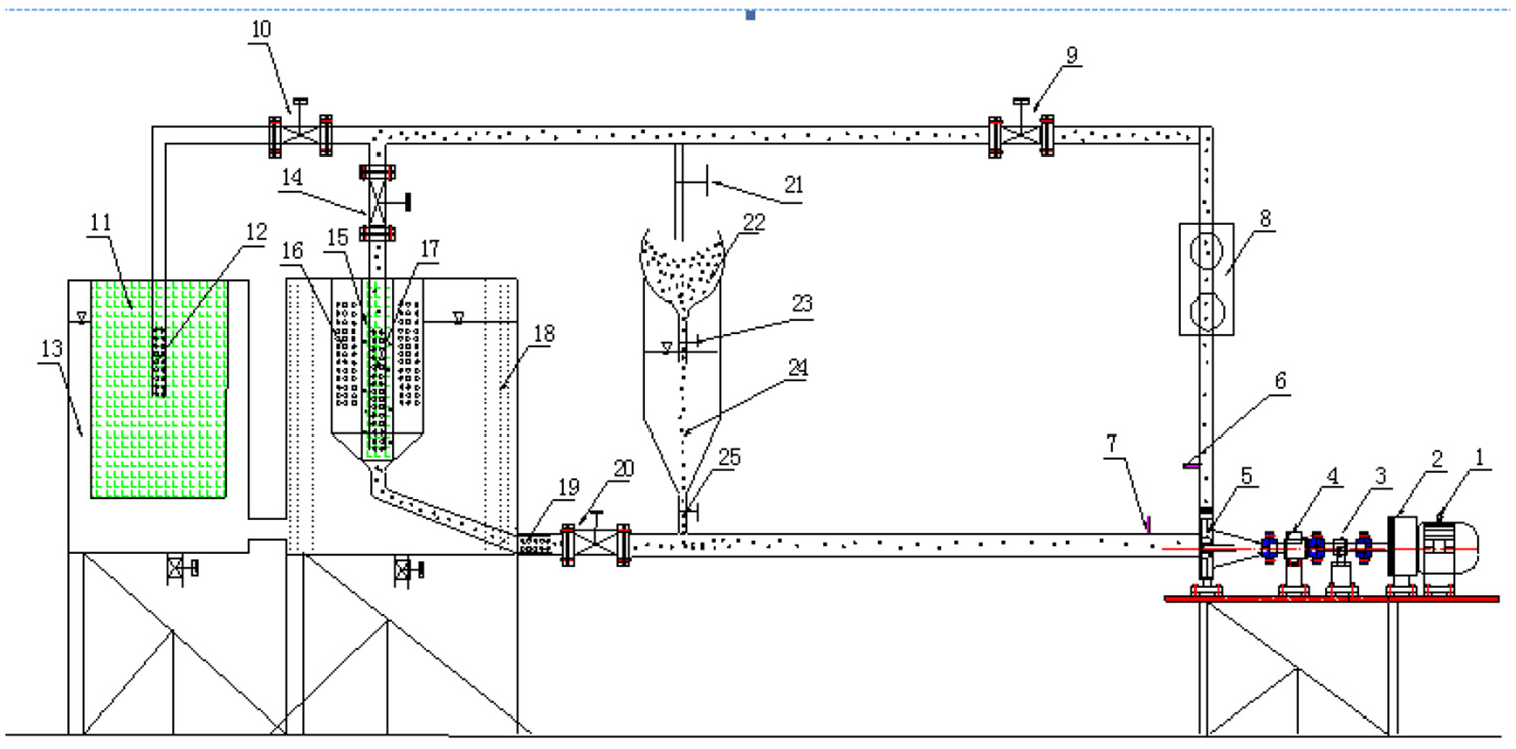
Schematic of test facility for PIV measurement of Liquid/Solid flow in centrifugal pump. 8
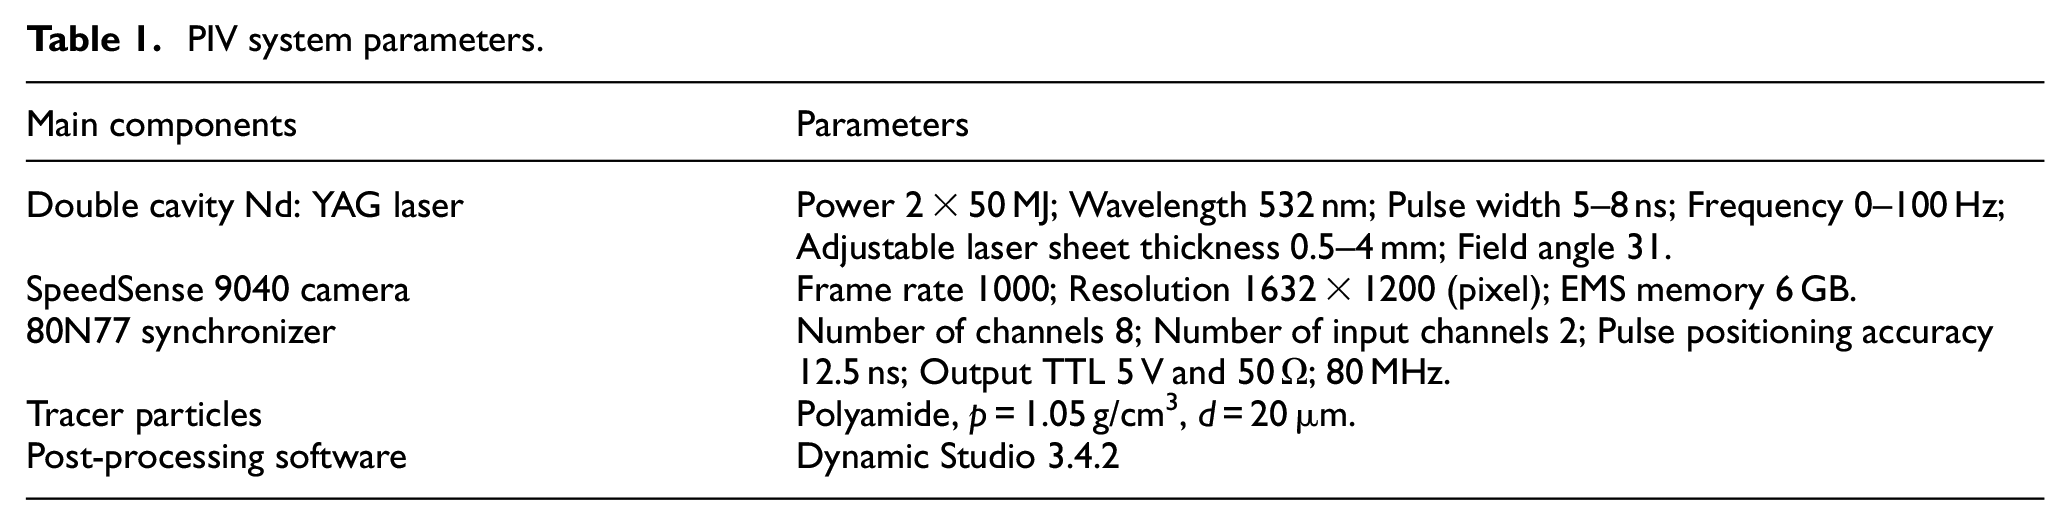
In the PIV internal flow field test, first, open the valve 20, the valve 9 and the valve 14; then, start the test pump by turning on the motor, and adjust the stepless variable speed device to make the test pump reach the set speed. Finally, adjust the valve 9 to change the flow. After the operation is stable, record the flow of each working condition. Holes 6 and 7 are connected with a differential pressure transmitter, which can obtain the pressure difference between the inlet and outlet of the centrifugal pump, and then the shaft power of the pump can be obtained through the speed torque sensor. Thus, the head and efficiency of the pump under different working conditions can be calculated. Open the valve 25 and slowly add the solid particles and tracer particles to be mixed through the particles releasing device. The mixed particles enter the circulation pipeline through the particles releasing device and reach the water storage tank. Because most of the kinetic energy is discharged, the bubbles generated by the high-speed impact of the Solid/Liquid two-phase are avoided. The automatic and uniform mixing of solid and liquid can be realized in the water storage tank, because the liquid flow moves in the form of vortex, generating sufficient tangential velocity. The well mixed Liquid/Solid flow enters the pump through the inclined pipeline. After the system runs stably, start PIV test by setting the parameters of the test software and external trigger mode. The particle images of the flow field in the impeller channel under different conditions can be obtained by changing the experimental conditions and repeating the above steps. After the test, open the valve 10 and take the particles into the filter bag. Figure 2 displays the PIV measurement system and main dimensions of the test pump. Impeller pictures are displayed in Figure 3. The PIV system detail are listed in Table 1.
PIV system parameters.
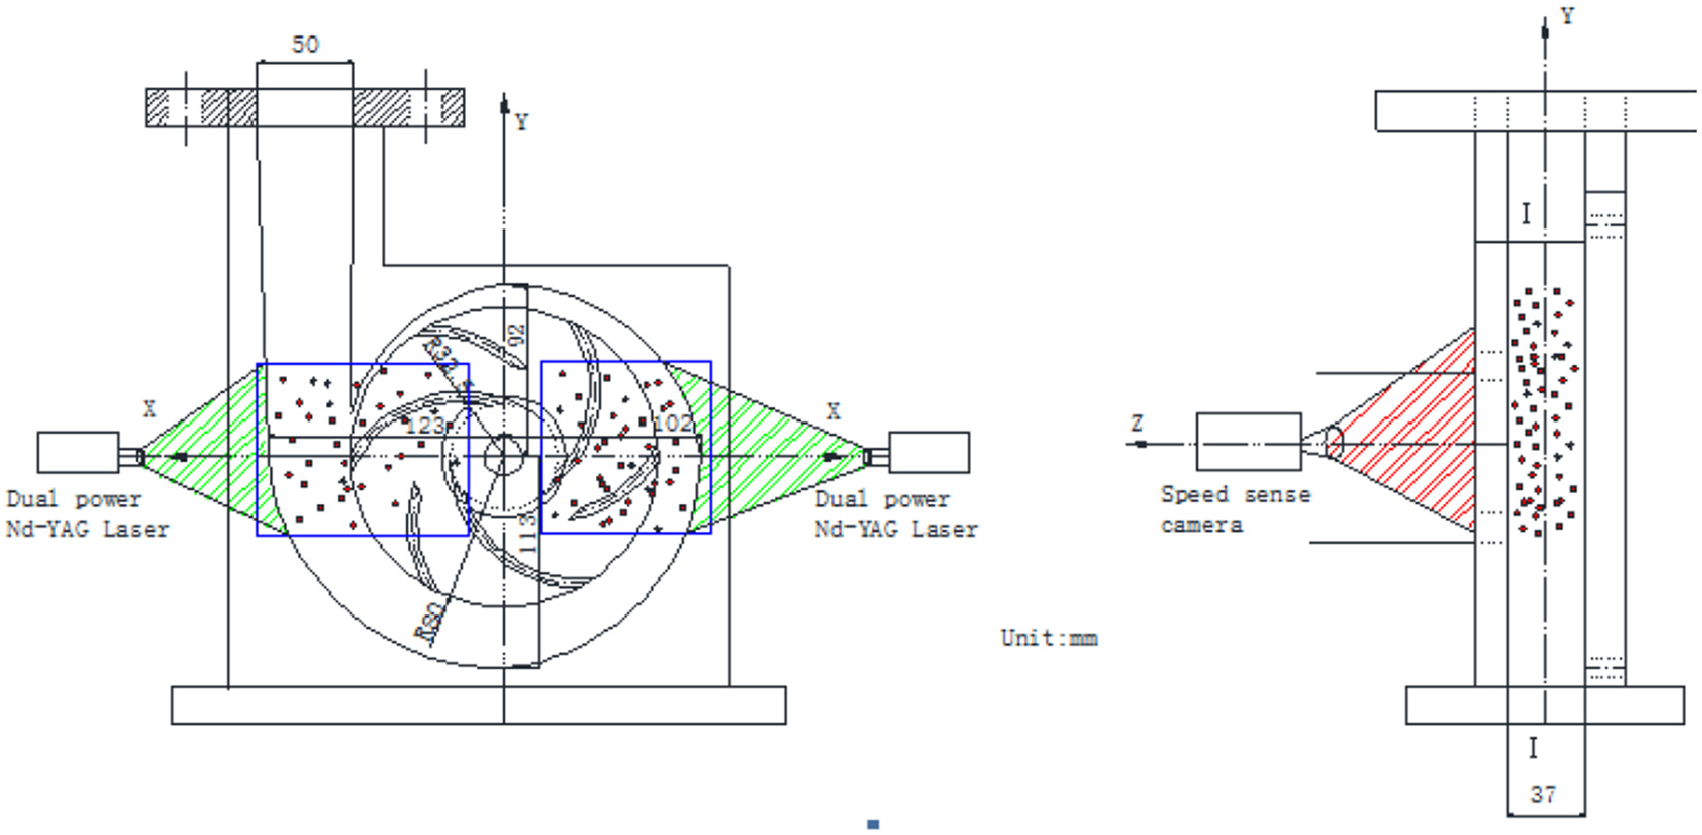
PIV measurement system and main dimensions of test pump. 8
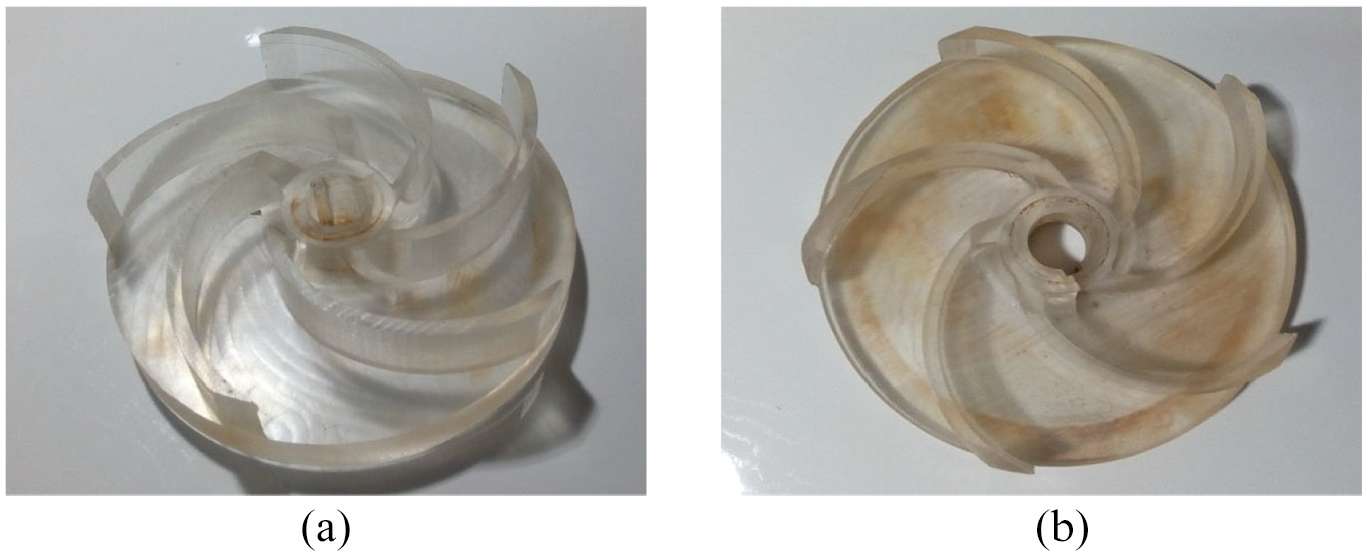
Impeller pictures: (a) single arc and (b) double arc.
The speed coefficient method 22 is used to design the impeller structure. The speed coefficient method is based on a series of similar pumps. It uses statistical coefficient to calculate the size of each part of the flow passage parts.
According to the specific speed formula, the following formula is obtained.
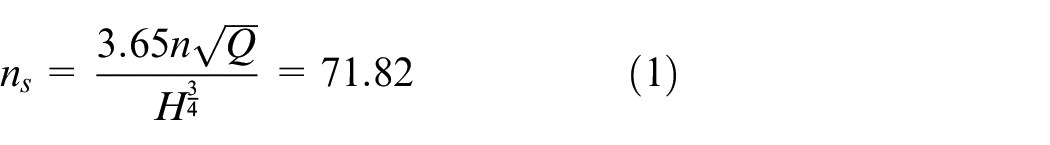
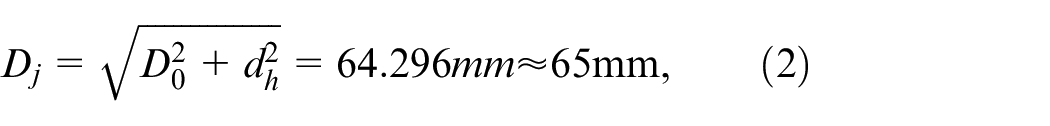
where dh = 30 mm.
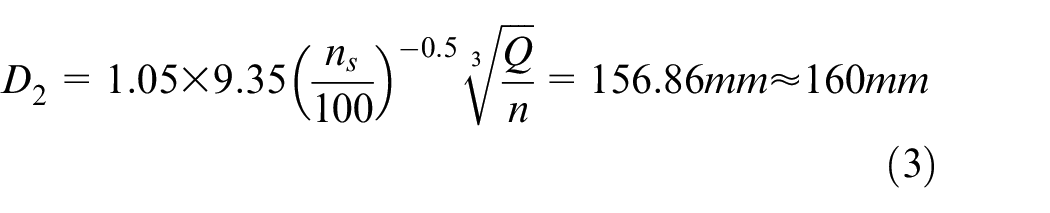
Where Dj– Impeller inlet diameter, D0– Equivalent diameter of inlet, dh– Impeller hub diameter, D2– Impeller outer diameter, Q-design flow, m3s−1
The calculation formula of blade outlet width is as follows.
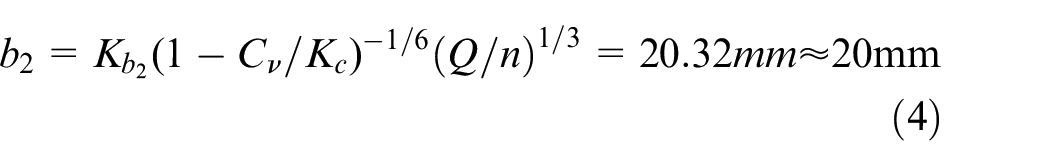
Where:
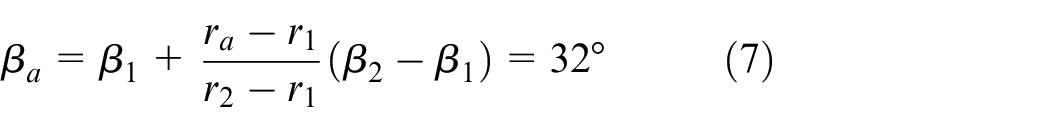
The arc profile can only ensure that the blade inlet and outlet angles at both ends of the arc are the calculated values. For the single arc profile, the blade profile can be obtained directly by drawing the inlet and outlet angles of the blade. For the double circular arc profile, several other parameters need to be determined: the middle circle radius ra, the inlet side arc radius r1 and the outlet side arc radius r2. For ra:

The results are as follows:

The value here is ra = 49 mm.
Blade angle at middle circular profile:
Arc radius of entrance side:
Arc radius of exit side:
Figure 4 shows the design structure of the two impellers.
Impeller structure design drawing: (a) single arc and (b) double arc.
Processing analysis of experimental data
Performance curve testing of different impeller structures
To study the effect of Liquid/Solid flow on pump performance, the performance curves of two impellers were tested. Glass beads with particle sizes of 0.4–0.6 mm were selected as solid phase particles. By controlling the volume concentration of the solid particles in the flowing medium, the experimental results of the head and efficiency changes of the pumps when transporting these fluids were analyzed, and the effect of the solid phase on the performance of the centrifugal pumps and their mechanism was explored. Among them, the main difficulty in the measurement of solid-liquid two-phase turbulent flow is how to effectively distinguish solid particles from tracer particles indicating liquid phase. At present, there are obvious differences between solid particles and tracer particles in size and gray level, so a method based on gray level feature threshold statistical analysis and particle size feature is used to identify two different particles. 23
The experiment included an outlet valve to adjust the flow rate of the pump, which could be changed within the range of 0–17 m3/h. The experiment employed an electromagnetic flowmeter to assist in the adjustment to obtain the exact value of the flow. In each experiment, 14–16 operating points were measured. A differential pressure transmitter was used to obtain the pressure difference between the pump inlet and outlet. The outlet measuring point was approximately 1.2 m at the outlet of the pump to ensure its full flow and minimize the fluctuation of its pressure. Using a continuously variable transmission to adjust and fix the speed at a specific value, and obtaining shaft power using a torque-measuring instrument, the velocity of the inlet and outlet fluids was calculated using the flow rate and cross-sectional area of the inlet and outlet pipelines. The rated power of the motor was 3 kW to avoid overloading of the pump during operation. Each set of data was read when it achieved a stable state. The calculation of the head is as follows:
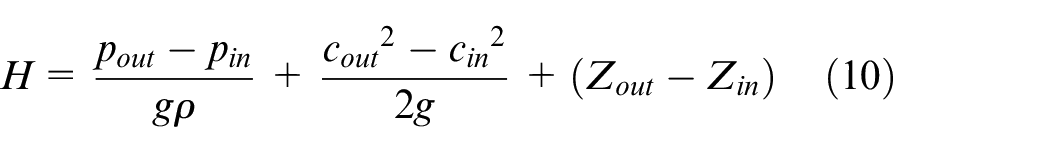
Pump efficiency is the ratio of effective power to shaft power:
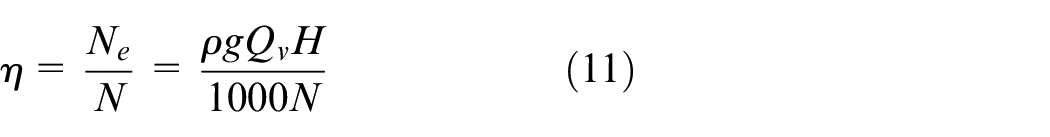
The basic design parameters of the model pump used for PIV test are: Q = 15 m3h−1, H = 8 m, n = 1450 rpm. Owing to the detachability of the designed model pump, the impeller could be replaced for testing. Table 2 lists the main parameters of the two impellers used in the test. The inlet and outlet radii of each impeller, thickness of the blade, and thickness of the cover plate remained the same; hence, the same volute could be used for the tests.
Main parameters of two different impellers.
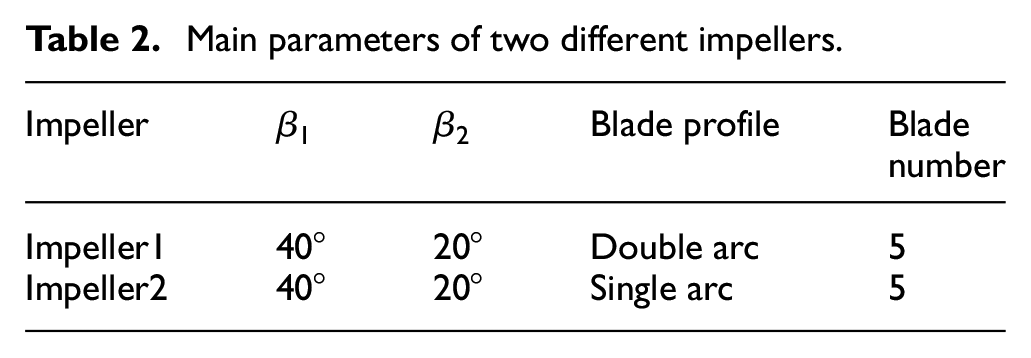
The head-flow curves and efficiency-flow curves of the two impellers under clean water, 5% particle concentration, and 10% particle concentration were tested. Then, the data were aggregated and compared, which provided the performance curves of the two impellers under the same working conditions. Figure 5 displays the test results of the performance curves of the different impellers at different particle concentrations at a rotational speed of 900 rpm.
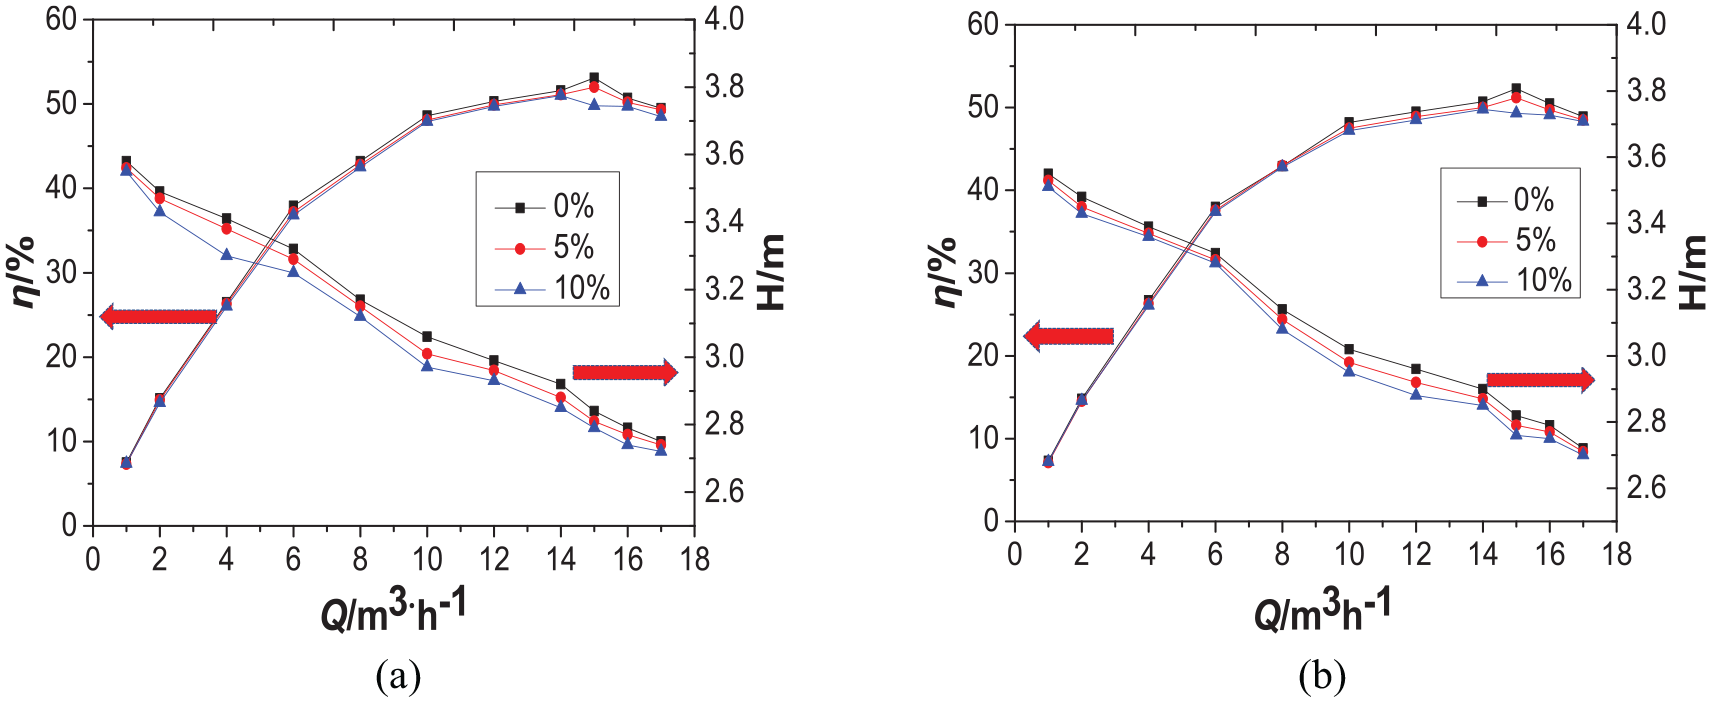
Performance curves of two impellers under different working conditions: (a) impeller1 performance curve and (b) impeller2 performance curve.
As can be observed from Figure 5, for the two impellers, the head and efficiency of the pump with particle concentration were less than those with clean water, and the effect of the reduction was more apparent with the increase in solid particle concentration, which is the same as the experimental conclusion obtained by Ni et al. 24 The addition of solid particles increases the viscosity of the fluid and changes the flow structure, causing an increase in the flow loss of an impeller designed under clean water conditions. The velocity difference between the solid particles and water increases the friction loss, reduces the velocity of liquid phase, and reduces the head. Under the condition of low flow rate, the effect of adding particles on the performance of the pump was small, mainly because the inlet velocity decreases with the decrease in flow rate, and the solid particles deposit at the inlet of the pump. As the concentration increases, the pump’s high efficiency zone shifts towards a reduced flow.
Effect of flow conditions on flow field
The internal flow field of the impeller with different flow rates, particle concentration, and particle size was analyzed. The experiment employed the particle image sequence acquisition method, and each test point captured 100 frames of 50 pairs of cross-correlation images. The experimental data were processed as follows. First, using TSI’s Dynamics Studio 3.42 software, the 50 pairs of images were processed by the cross-correlation algorithm to obtain 50 instantaneous absolute velocity fields. The Liquid/Solid flow field was first separated; then, the average absolute velocity was obtained and the data files were extracted. Because the flow in the impeller of the centrifugal pump is a compound motion, when the impeller rotates, the fluid rotates together with the impeller, while it also flows outward along the vanes in the impeller flow passage. Thus, the movement of the fluid within the impeller can be divided into implicated motion and relative motion. The relative speed obtained by decomposition is displayed by the tecplot software for vector display.
Flow fields inside the impeller at different flow
When the centrifugal pump deviates from the design flow, the head and efficiency change. To study the mechanism of the change, the flow field inside a third impeller, Impeller i4 (
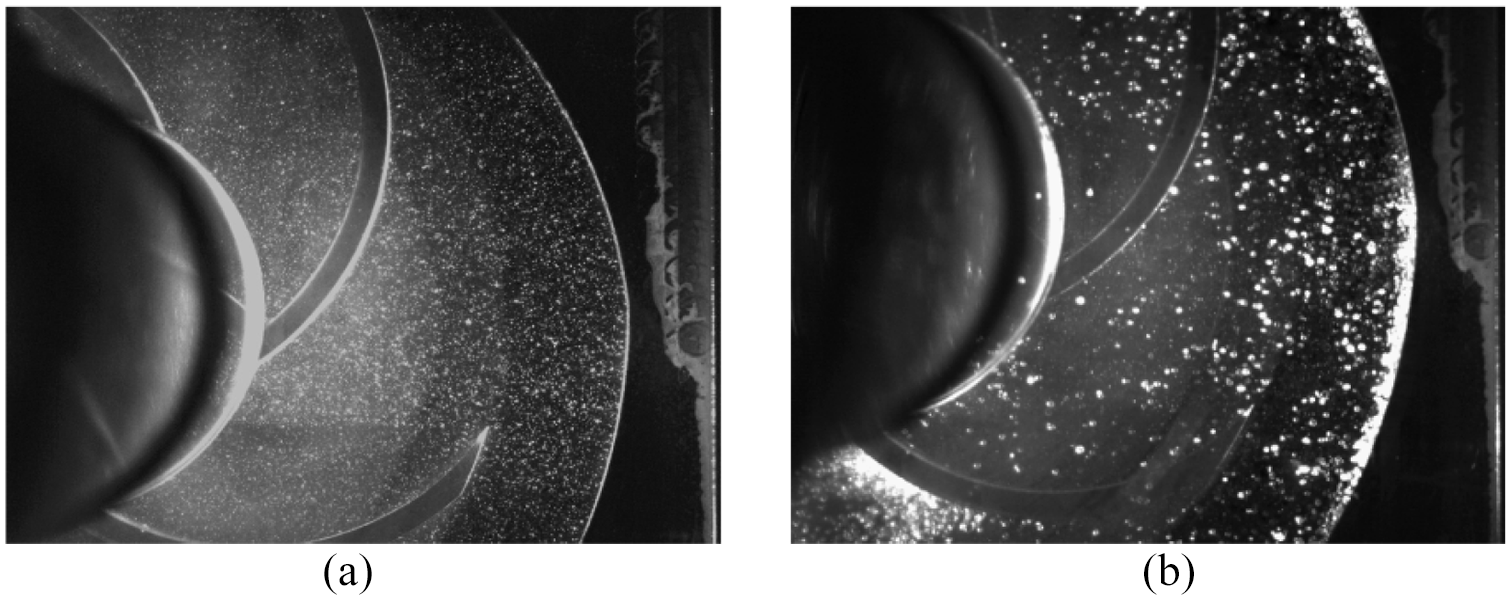
Original image captured in experiment: (a) clean water and (b) mixed fluid.
Figure 7 displays the relative velocity field at different flow rates. It can be observed that the direction of the relative velocity was the tangential direction of the blade. Under the designed flow rate, the relative velocity increases from suction surface to pressure surface, making the pressure on both sides of the blade unequal, which is the basic condition for the blade to function in the fluid.
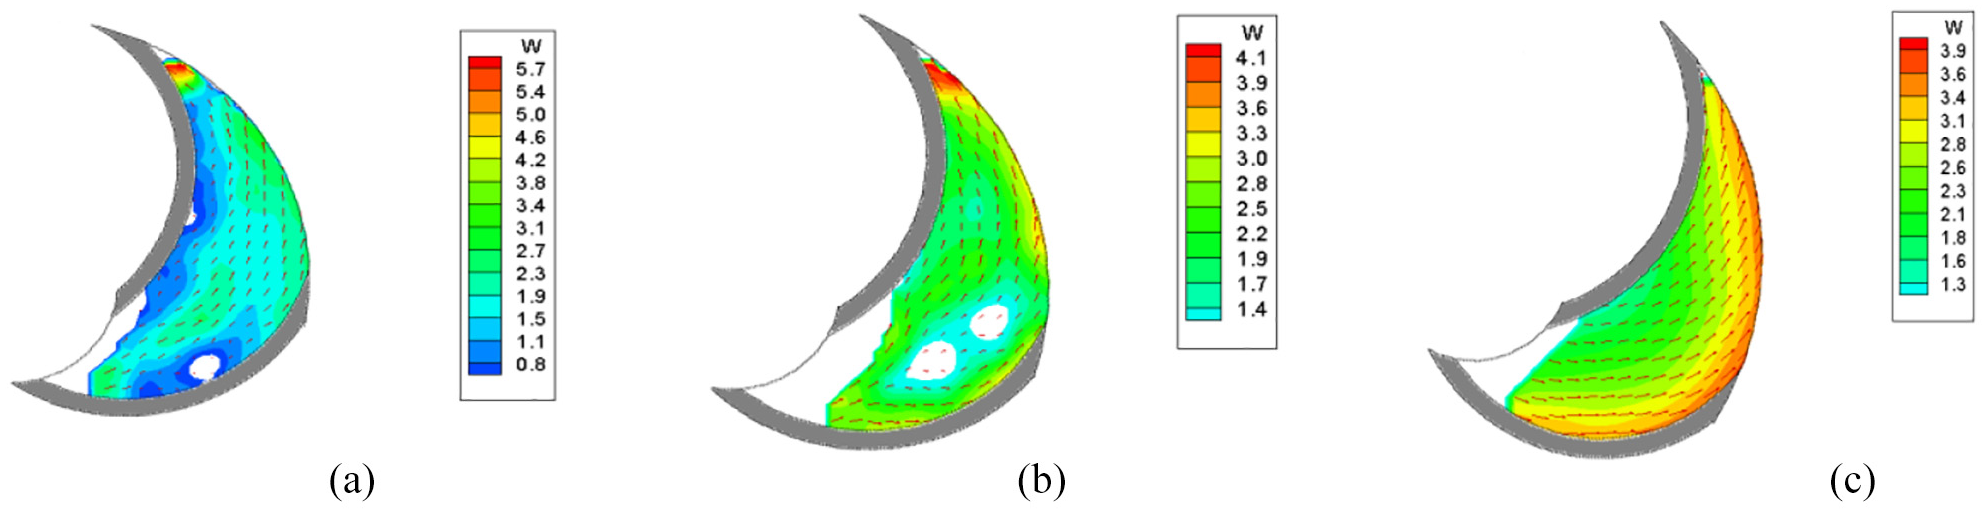
Relative velocity field of clean water under different flow rates (m s−1): (a) 12 m3h−1 relative velocity, (b) 13 m3h−1 relative velocity field of flow field of flow, and (c) 15 m3h−1 relative velocity field of flow.
The variation of relative velocity along the radius is indicated in Figure 8. At the same flow rate, on the pressure surface, the relative velocity increased gradually from the inlet to the outlet of the impeller and achieved a maximum at the outlet. On the suction side, the relative speed had a relatively decreasing trend from the impeller inlet, attained a minimum near the midpoint of the flow passage, and then gradually increased. Such a velocity profile indicates that in the first half of the flow path, the flow is diffused, and then it accelerates in the second half. For centrifugal pumps, flow separation occurs easily on the suction surface at the impeller outlet. Reducing the diffuse pressure in the second half of the blade helps to move the separation point maximally to the outlet, thus reducing the loss in the impeller, which is beneficial to the flow in the pump.
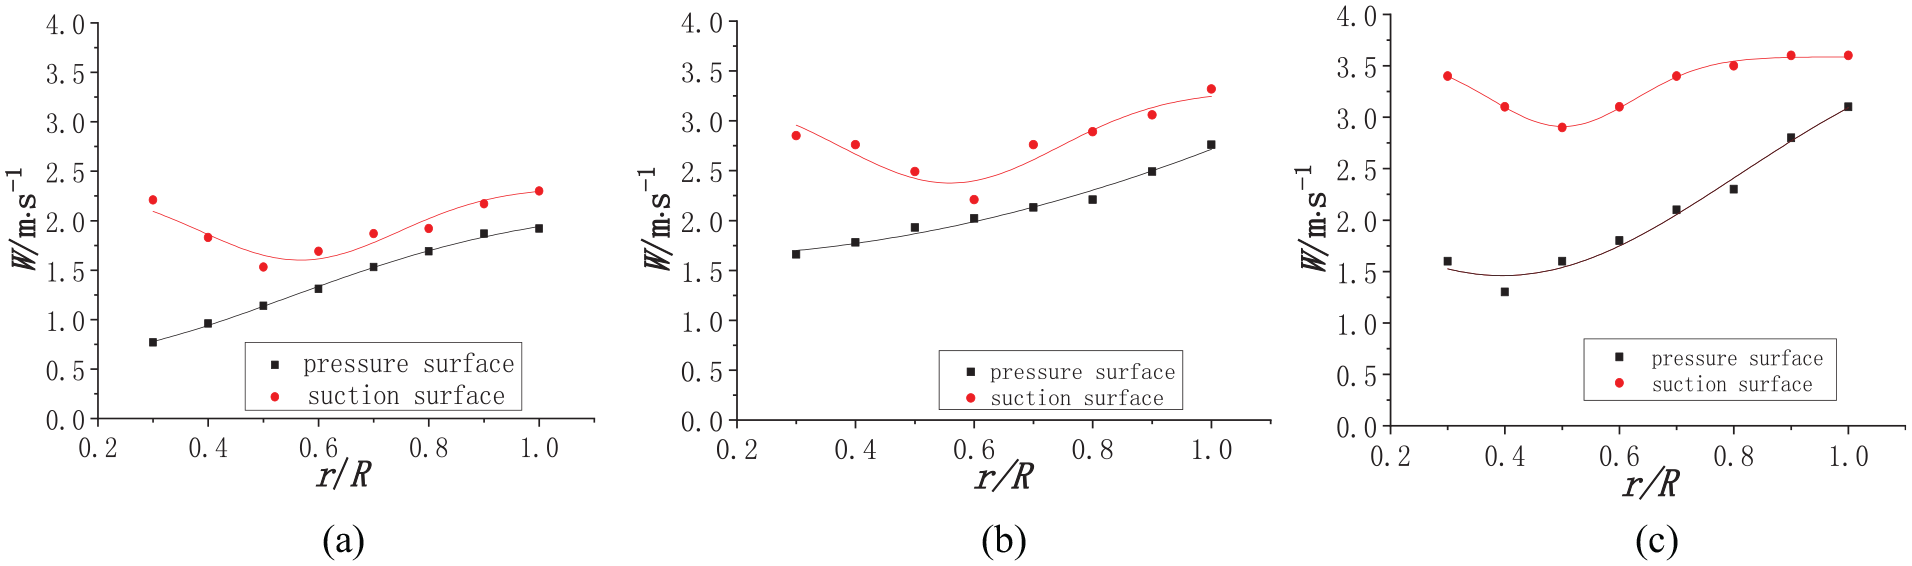
Distribution of relative velocity of liquid along pressure surface and suction surface at different flow rates: (a) variation of relative velocity of 12 m3h−1 flow, (b) variation of relative velocity of 13 m3h−1 flow, and (c) variation of relative velocity of 15 m3h−1 flow.
With the increase in flow rate, the average value of the relative velocity increased correspondingly. Under the design condition, the difference of relative velocity between the suction surface and pressure surface is greater than that under the non-design condition, which also indicates that the impeller had a strong working ability under this condition. Compared with the designed flow rate, when the pump operates under the non-designed flow rate, its internal flow becomes chaotic and a whirlpool appears. The greater the deviation from the design condition, the higher the degree of disorder of the flow. The whirlpool aggravates the internal loss of the pump. The chaos of the flow results in the impact loss of the pump, which is one of the reasons for the lower efficiency of the pump under a non-design condition. 25
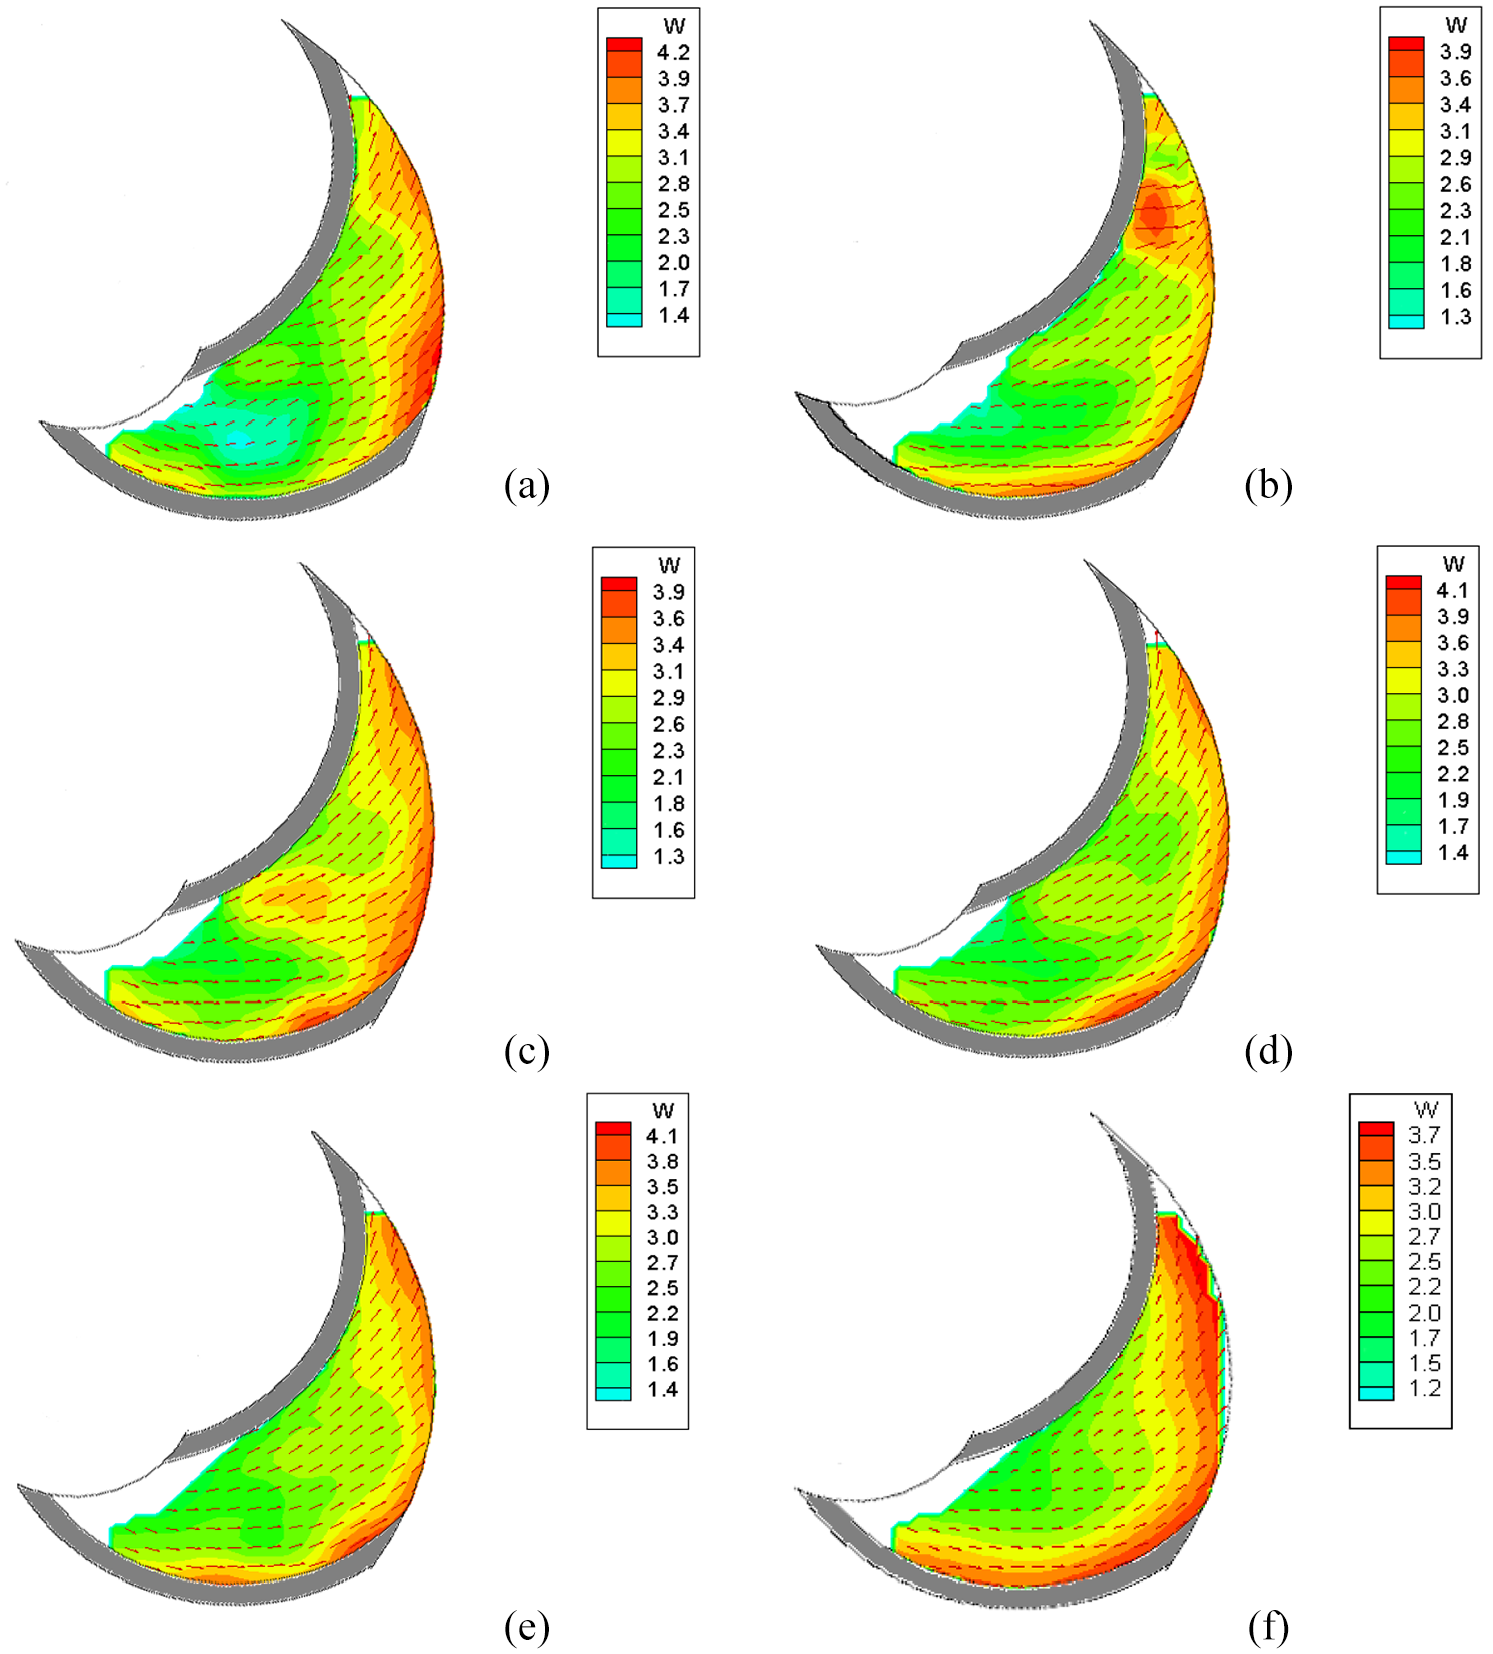
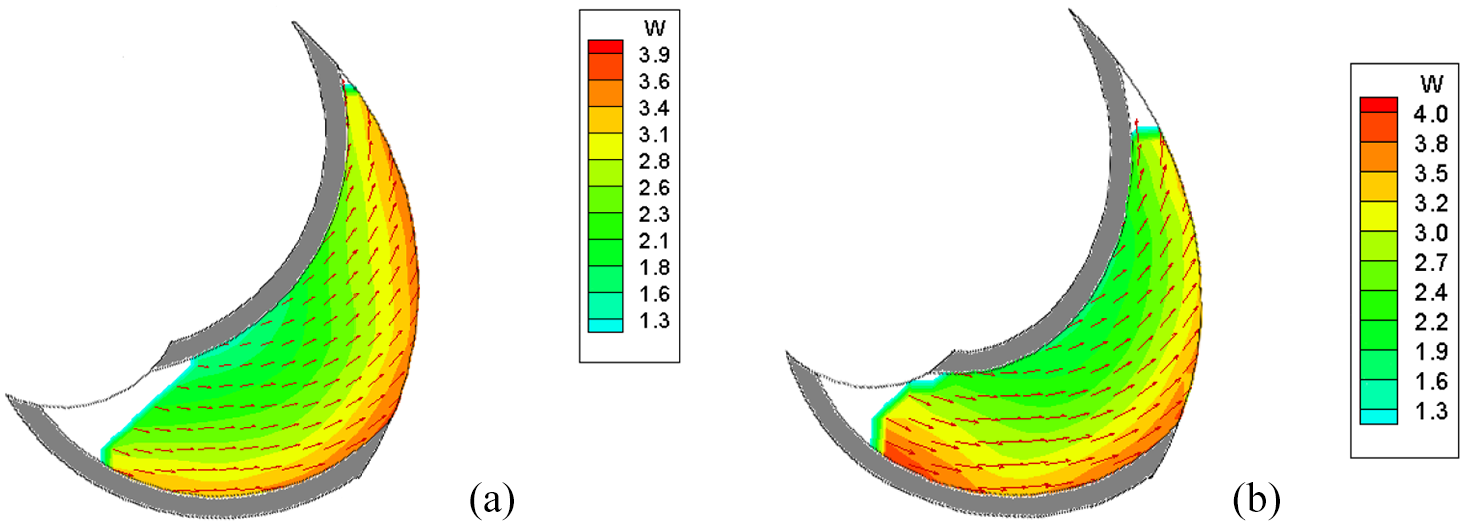
The interaction of the solid and liquid phases makes the flow in the impeller overly complicated. To study the velocity distribution of solid–liquid two-phase fluid in the impeller, Q = 15 m3/h and particle volume concentration Cv = 10% were photographed. The mixed flow field was treated, the solid particles were separated from the liquid phase for separate analysis, the absolute velocity vector distribution was obtained using the Dynamic Studio 3.42 software, and the relative velocity distribution was obtained using Tecplot software, as indicated in Figure 9. It can be observed from the figure that the distribution of the relative velocity field of the solid–liquid phase was more uniform and stable under the designed flow rate and marginally less than the designed flow rate. Under the condition deviating from the designed flow rate, the change of velocity was more intense, and could easily cause impact and collision losses. The velocity gradient at the inlet of the impeller was relatively small, and at the outlet was relatively large. With the increase in flow rate, the relative velocity at the impeller outlet also increased. Under the condition of low flow rate, because of the high speed of the pump, the flow in the impeller was unstable and the velocity gradient was relatively large. Under this condition, it is easy to produce reflux and cause energy loss.
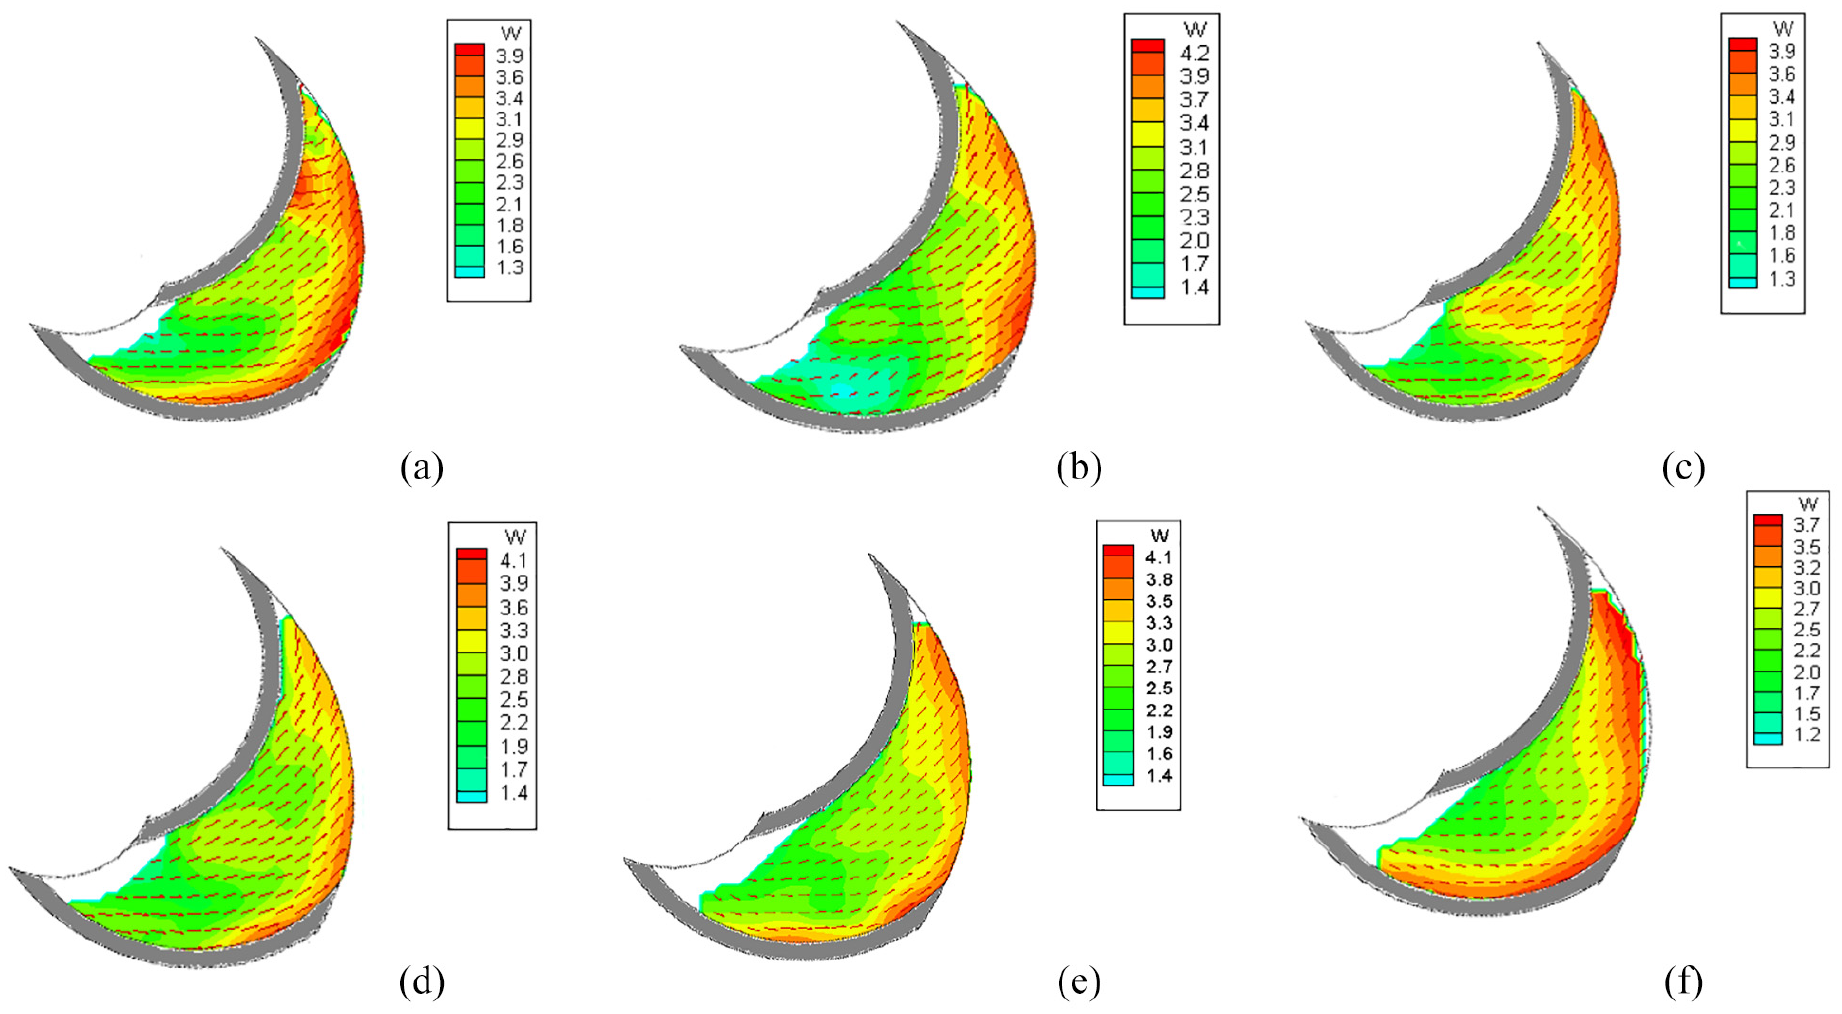
Liquid/Solid flow field at different flow rates (m s−1): (a) 12 m3h−1 relative velocity field of solid phase, (b) 12 m3h−1 relative velocity field of liquid phase, (c) 13 m3h−1 relative velocity field of solid phase, (d) 13 m3h−1 relative velocity field of liquid phase, (e) 15 m3h−1 relative velocity field of solid phase, and (f) 15 m3h−1 relative velocity field of liquid phase.
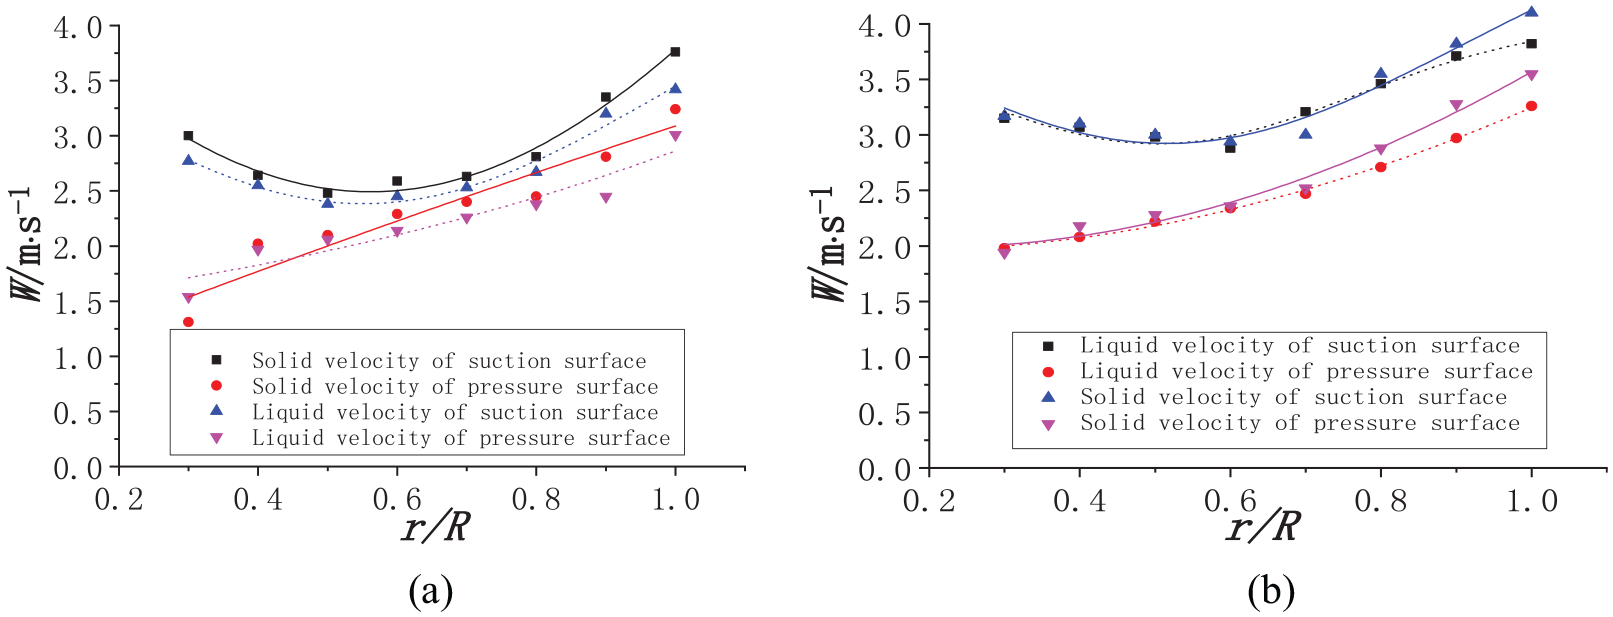
Figure 9 displays the distribution of the relative velocity of the solid–liquid phase along the radius under different working conditions. At the impeller inlet, the velocity of the solid particles and liquid is the same; the difference is negligible. At the outlet, the relative velocity of the solid particles is greater than that of the liquid. The velocity difference between them achieved the maximum at the impeller outlet, which is due to the larger mass of solid particles and the greater inertia force. The maximum relative velocity difference occurred at the end of the blade, which means that the end of the blade is prone to impact wear. The conclusion is also verified in the literature of Luo et al. 26
Internal impeller flow field under different particle concentrations
The effect of particle concentration on the performance of the Liquid/Solid flow pump is considerable. As the particle concentration changes, the head and efficiency of the pump change significantly. Presently, the numerical simulation method is increasingly popular for studying the effect of Liquid/Solid flow on the performance of the flow field stage in a centrifugal pump. The influence, however, of internal wear and head and efficiency of the pump remains relatively scattered. Furthermore, there is a lack of a sufficient analysis of the influence of small particles on the flow field in a centrifugal pump. Moreover, there is minimal comparison with the actual situation. Therefore, this section analyzes the internal flow field of a centrifugal pump under different solid phase concentrations and analyzes the mechanism of solid phase concentration influencing the performance of a Liquid/Solid flow pump.
Impeller i4 (
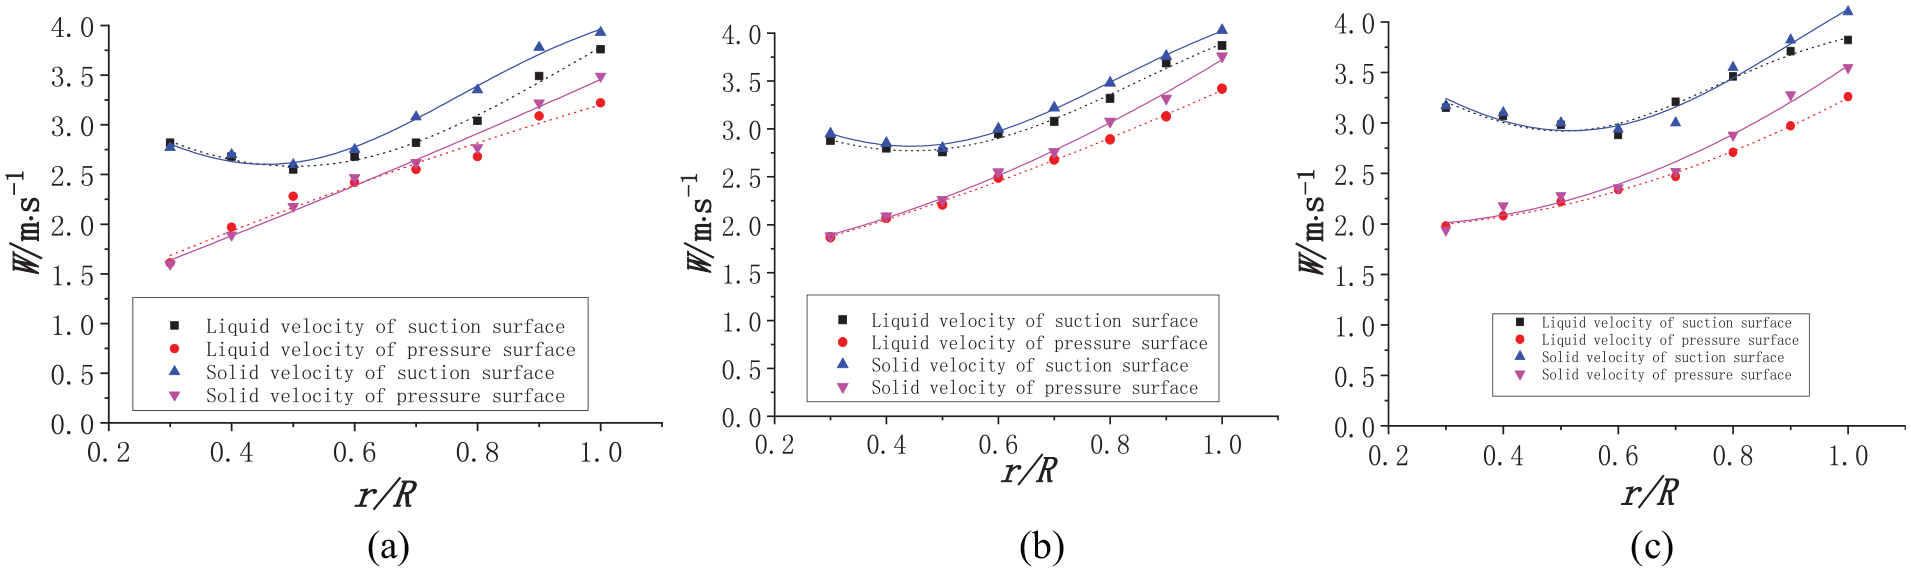
Distribution of relative velocity of solid–liquid phase along radius at different flow rates: (a) variation of relative velocity of 12 m3h−1 flow, (b) variation of relative velocity of 13 m3h−1 flow, and (c) variation of relative velocity of 15 m3h−1 flow.
It can be observed from the Figure 11 that the velocity distribution of the solid and liquid phases in the blade passage changed more uniformly when the particle concentration was reduced. From the entrance to the exit, the relative speed increased slowly. When the particle concentration was high, the effect of the turbulent characteristics of the liquid phase on the solid–particle interaction became increasingly greater, and the Liquid/Solid flow characteristics changed significantly. The viscosity of the mixed fluid increased as the concentration of the solid particles increased. The increase in viscosity indicates an increase in flow loss, a decrease in pump efficiency, and an increase in particle concentration, which also increases the collisions between the particles, causing flow disturbances and exacerbating flow losses. This somewhat explains why the efficiency of the centrifugal pump decreases as the solid phase concentration increases.
Relative velocity distribution of solid and liquid phases in impeller at different particle concentrations (ms−1): (a) relative velocity field of 3% solid phase, (b) relative velocity field of 3% liquid phase, (c) relative velocity field of 5% solid phase, (d) relative velocity field of 5% liquid phase, (e) relative velocity field of 10% solid phase, and (f) relative velocity field of 10% liquid phase.
Figure 12 displays the relative velocity of the solid–liquid two phases along the radius of the pressure and suction faces. With the increase in particle concentration, the average relative velocity of the pressure and suction surfaces decreased. After collision with the blade, a rebound of particles can occur, causing a secondary collision with other particles. Increased particle concentration also increases the probability of this situation, which can cause considerable energy loss. The decrease in the relative velocity difference between the pressure and suction surfaces also implies a decrease in the impeller’s working force.
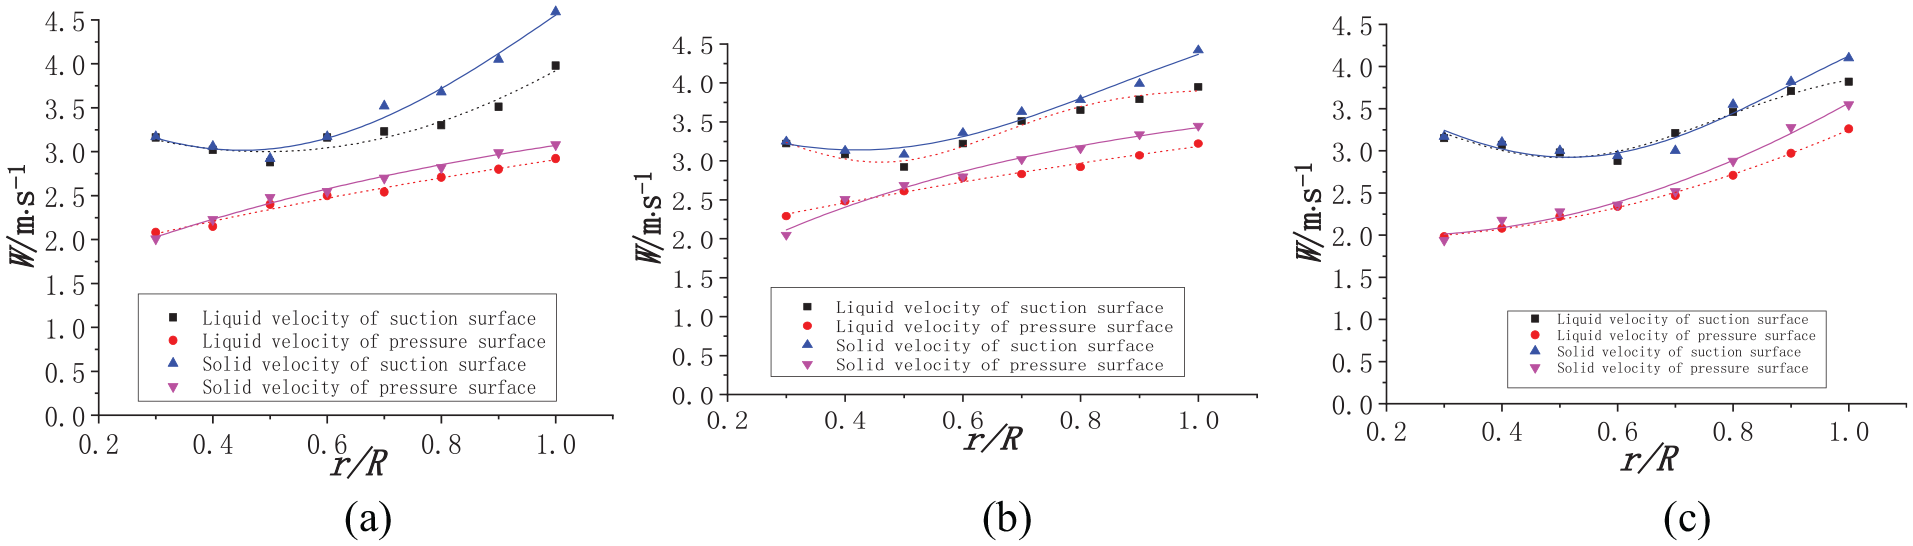
Distribution of relative velocity of solid–liquid phases with different concentrations along radius: (a) 3% particle concentration, (b) 5% particle concentration, and (c) 10% particle concentration.
Internal impeller flow field under different particle sizes
In the Liquid/Solid flow, the volume concentration of the solid phase has a considerable influence on the flow characteristics. However, the particle size of the particles also has a certain influence on the flow characteristics of the two phases. An increase in the particle size of the particles means that the effect of gravity on the inertial force is increased. It is generally believed that when the same pump delivers a mixture containing different particle sizes, the maximum transport efficiency decreases as the solid particle size increases, when the solid phase concentration, flow rate, and solid phase density remain the same. As the solid particle size increases, a corresponding increase in flow rate is required to suppress the tendency of solid precipitation. When the solid particles are overly large, the action of gravity causes the Liquid/Solid flow to become a two-layer flow, and the particle group moves virtually along the suction surface of the blade. The flow of water moves over the particle group, which reduces the effective flow area of the impeller, resulting in a relative blockage of the flow path and increased pressure loss. Furthermore, at the same flow rate, large-sized particles have a greater kinetic energy and the difference in speed between the liquid phase and solid phase is also greater. It is easier to form a greater angle of attack with the blade and volute, and the influence on the flow velocity also increases the impact loss. The impact of particles and material is also more likely to cause wear of the overcurrent components. Therefore, it is important to understand the flow field inside the centrifugal pump impeller of a Liquid/Solid flow under different particle sizes. Furthermore, the movement trend of the solid particles is also of significance for the study of solid–liquid two-phase centrifugal pumps. Figure 13 displays the distribution of the solid–liquid two-phase relative velocity of the i4 impeller blade in the channel at a flow rate of Q = 15 m3/h and particle size of 0.4–0.6 mm and 0.8–1.0 mm, respectively.
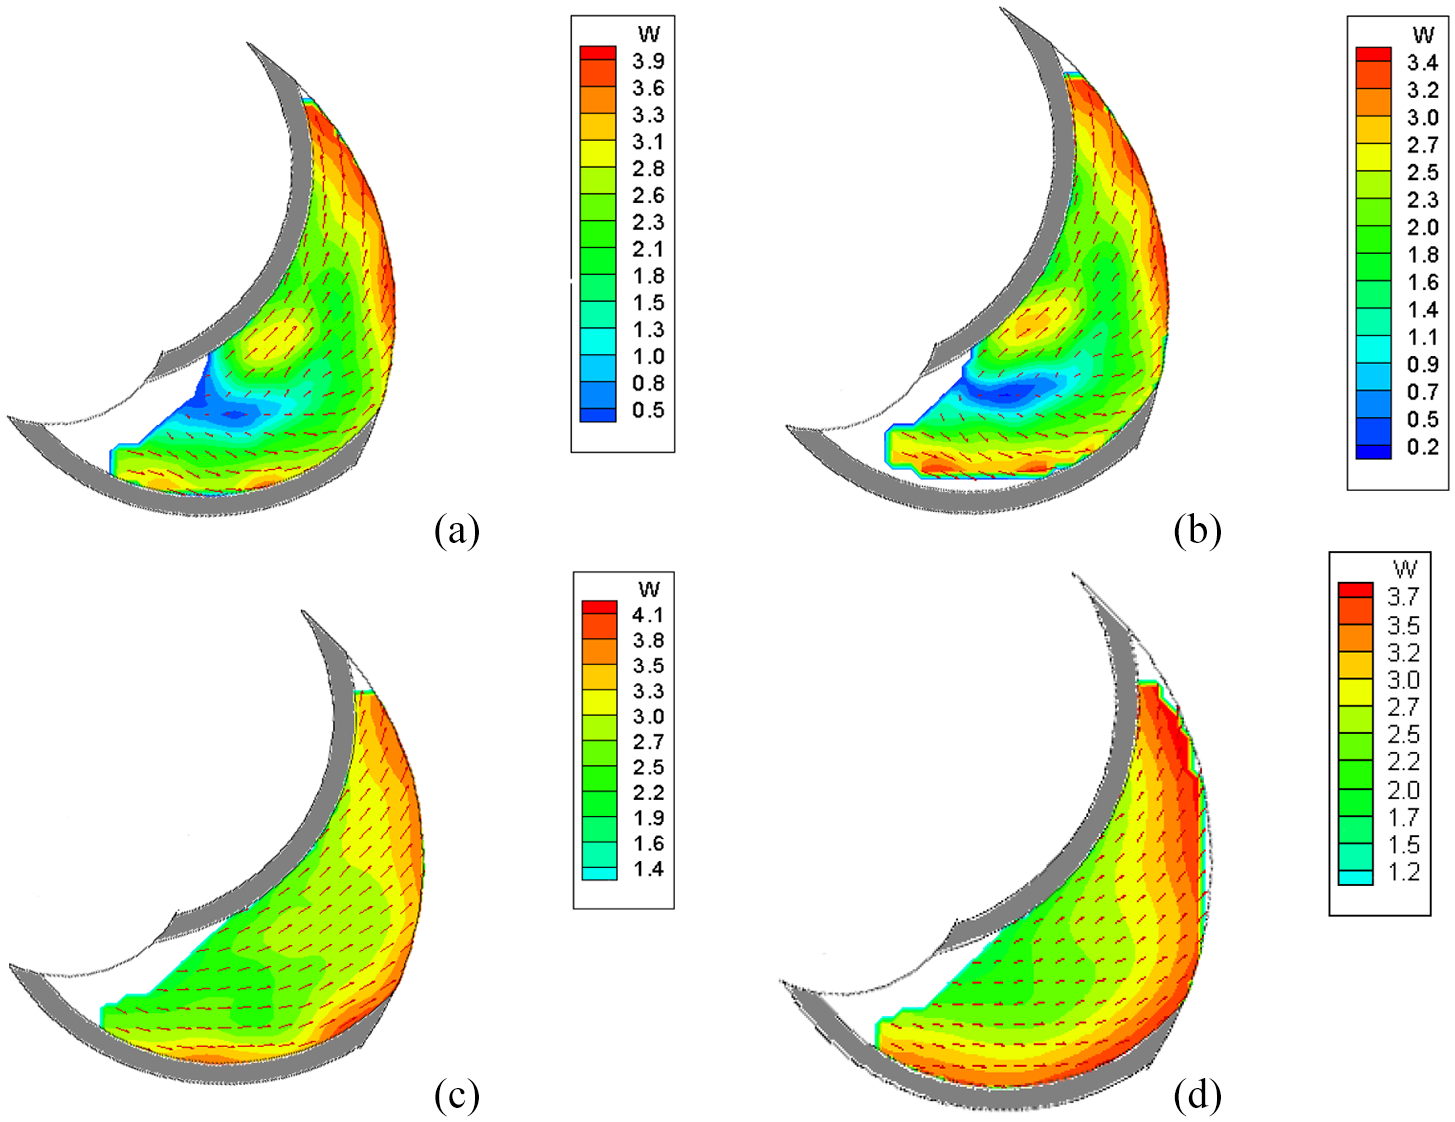
Solid–liquid two-phase relative velocity field under different particle sizes (ms−1): (a) small particle size liquid phase relative velocity field, (b) small particle size solid phase relative velocity field, (c) large particle size liquid phase relative velocity field, and (d) large particle size solid phase relative velocity field.
It can be observed from the figure that the Liquid/Solid flow field in the flow channel under a small particle size was similar. This is because the particle size of the solid particles is small and the followability with the water is acceptable; hence, the speeds of the two were similar. The large-sized particles, owing to the action of gravity, had a large inertia force, which caused a significant difference in the relative velocity of the solid and liquid phases, which can easily cause impact loss. Furthermore, it is easier for secondary collisions to occur with other particles after collision with the blade, resulting in a further loss of energy, which causes a decrease in efficiency.
Figure 14 displays the distribution of the relative velocity of the solid–liquid two phases along the blade radius on the pressure and suction faces. When the particle size was small, the relative speeds of the solid–liquid two phases on the suction side and the pressure side were not significantly different. When the particle size was larger, the relative velocity difference between the solid and liquid phases was more apparent, and increased with the increase in the blade radius, achieving a maximum at the impeller outlet. The large-sized particles were more severe owing to the effect of gravity, and the followability to the fluid was poor; hence, the relative speed difference between the solid and liquid phases was large.
Distribution of relative velocity of solid–liquid two phases along radius: (a) variation of relative velocity of large particle flow field and (b) variation of relative velocity of small particle flow field.
Influence of impeller structure on flow field
Using an analysis of the internal flow field of a circular double blade, an analysis and comparison of the differences can offer an explanation of the optimization mechanism. The experiment was performed under a flow rate of Q = 15 m3/h; the relative flow field of clean water is displayed in Figure 15. The angles of the two impellers were the same, which ensured that there were no other variables.
Relative velocity field of clean water under design conditions of single and double arc-curved impellers (m s−1): (a) relative velocity field of clear water in single arc and (b) relative velocity field of clear water with double arcs.
Under a pure water condition, the flow fields in both impellers were uniform and stable. The relative velocity was less on the pressure surface, and increased gradually along the rotation direction, achieving the maximum on the suction surface. The velocity gradient at the impeller inlet was small, and increased to a certain extent at the outlet. The variation of the relative velocity of the liquid along the radius on the suction and pressure surfaces is indicated in Figure 16. The average relative velocity of the suction surface of the double-arc blade was greater and the change of size was more uniform. This is because the blade angle of a double-arc blade is closer to the real flow angle of the fluid, which makes the angle of attack between the fluid and blade smaller and thus, the change of velocity smaller. On the pressure surface, the velocity varied significantly, and increased gradually from the inlet to the outlet.
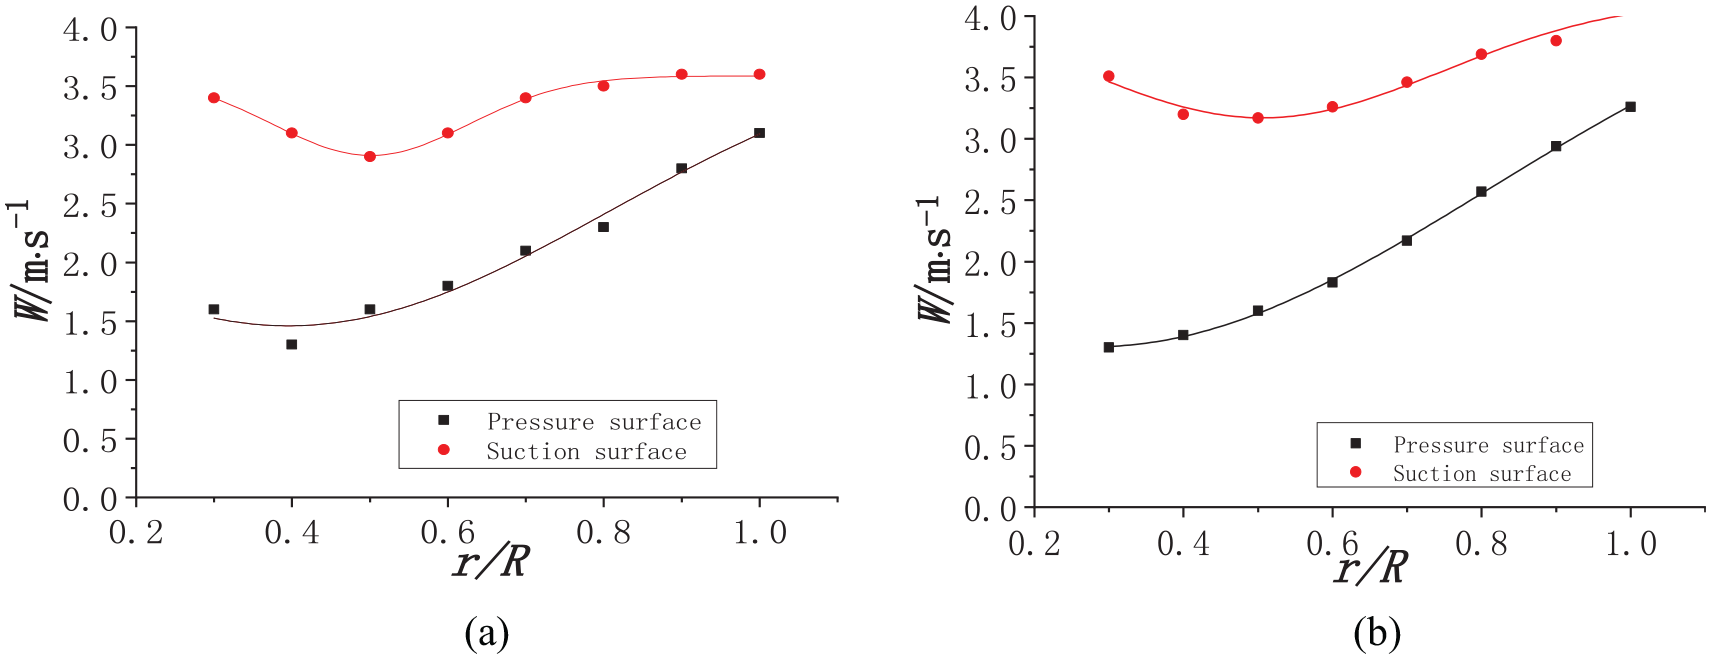
Distribution of relative velocity of clean water along radius: (a) distribution of clean water relative velocity along radius of single arc blade and (b) distribution of clear water relative velocity along radius of double arc blade.
When solid particles were added, the flow fields of the two materials changed (Figure 17). Near the inlet side of the impeller, the relative velocity gradient of the solid and liquid phases in the impeller with double circular arc blades was relatively small, which made the flow in the blade passage more stable, thus reducing the friction loss caused by the drag between the particles. The liquid phase velocity gradient at the exit of the double circular arc impeller was also small; the change was relatively gentle and the velocity gradient at the exit of the single circular arc impeller was also large. This illustrates, from the side, that the double circular arc line was closer to the liquid flow angle than the single circular arc line; hence, the impact between the liquid flow and blade was reduced and the speed changed uniformly. Moreover, the relative speed of the exit of the double arc blade was greater, and the speed difference between the pressure and suction surfaces was also greater, which also indicates that the functional force was enhanced.
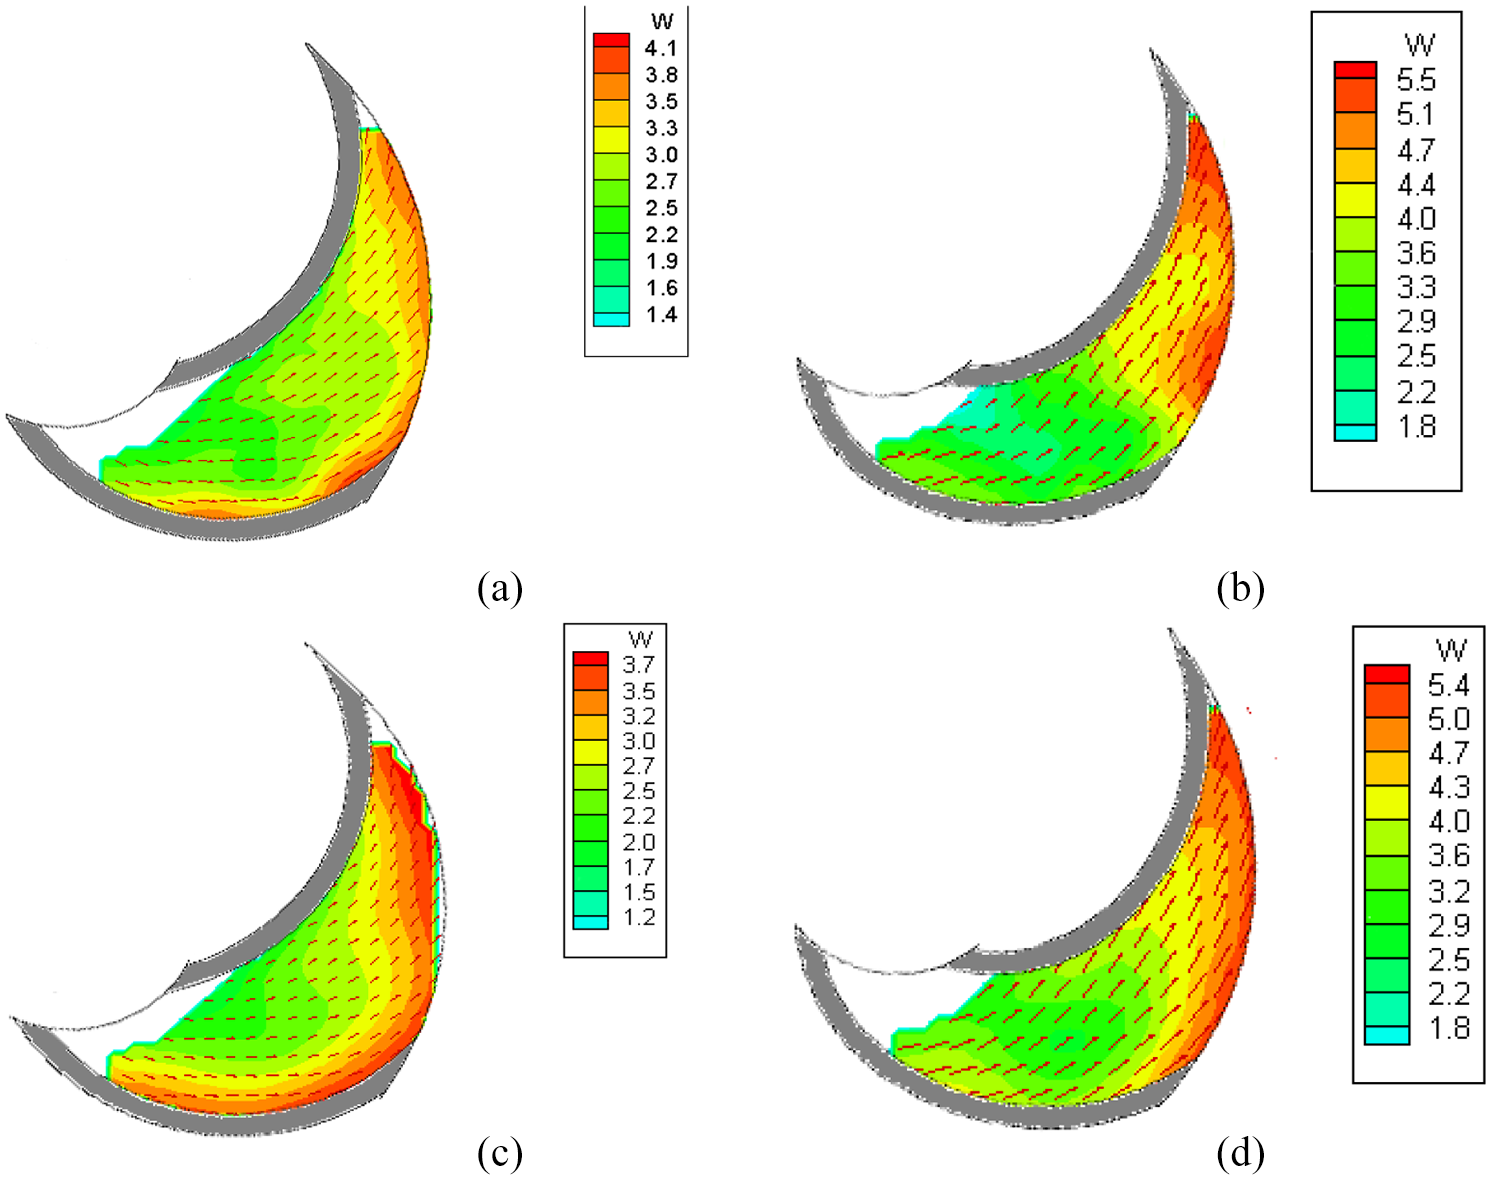
Single-double circular arc line solid–liquid two-phase relative velocity field (m s−1): (a) single arc solid phase relative flow field, (b) double arc solid phase relative flow field, (c) single arc liquid phase relative flow field, and (d) double arc liquid phase relative flow field.
Because of the more regular change of blade angle, the change of blade angle from the impeller inlet to outlet was closer to the change of the liquid flow angle, which made the performance of the double arc profile superior and the relative velocity distribution of the solid and liquid phases in the impeller more uniform. Owing to the small angle with the liquid flow, the surface of the blade of the double circular arc line was less prone to de-flow, which led to an increase in energy conversion efficiency.
Distribution of solid particles in the impeller
Figure 18 is a photograph of the particle distribution measured (using the five-blade impeller as an example) for glass beads with diameter ds = 0.4–0.6 mm, n = 900 rpm, Q = 15 m3/h, and particle concentration Cv = 10%. The image is a superposition of 20 solid particles after removing the tracer particle image. The white spots represent the particle phase. Owing to the presence of the positioning lock device, the impeller was operated at the same position for each shot. It can be observed from the figure that the particle distribution in the impeller flow channel was relatively uniform, the density of the pressure surface and the volute wall surface was greater, and the particle number density of the pressure surface was higher than the suction surface. The particle concentration gradually increased from the inlet to the outlet, which is in line with the fact that the centrifugal pump impeller flow path is a diffusion flow path.
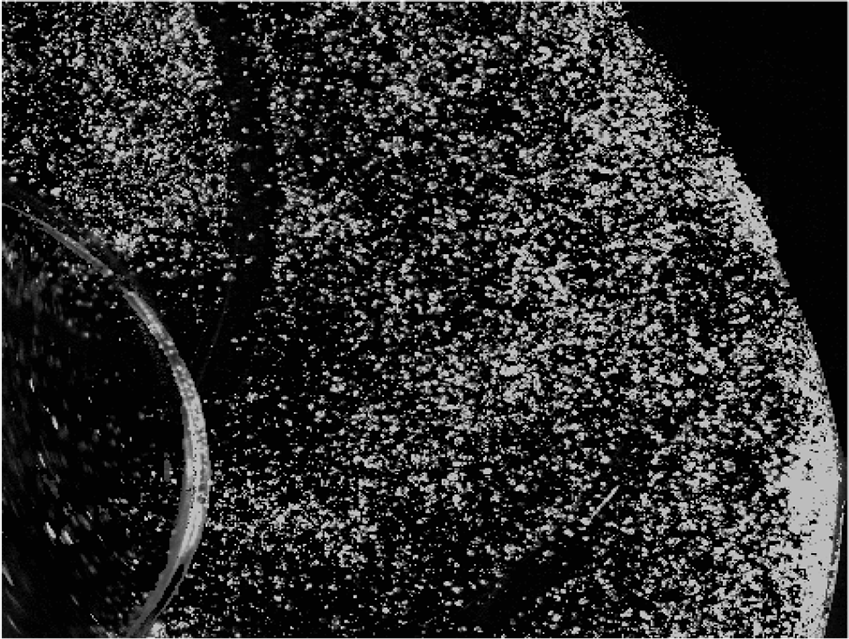
Distribution of particles in impeller.
Figure 19 displays the distribution of the particles at different particle sizes. Both are original images obtained at the design flow rate; the particle points were extracted and 20 images were superimposed. The impeller was the i4 impeller (
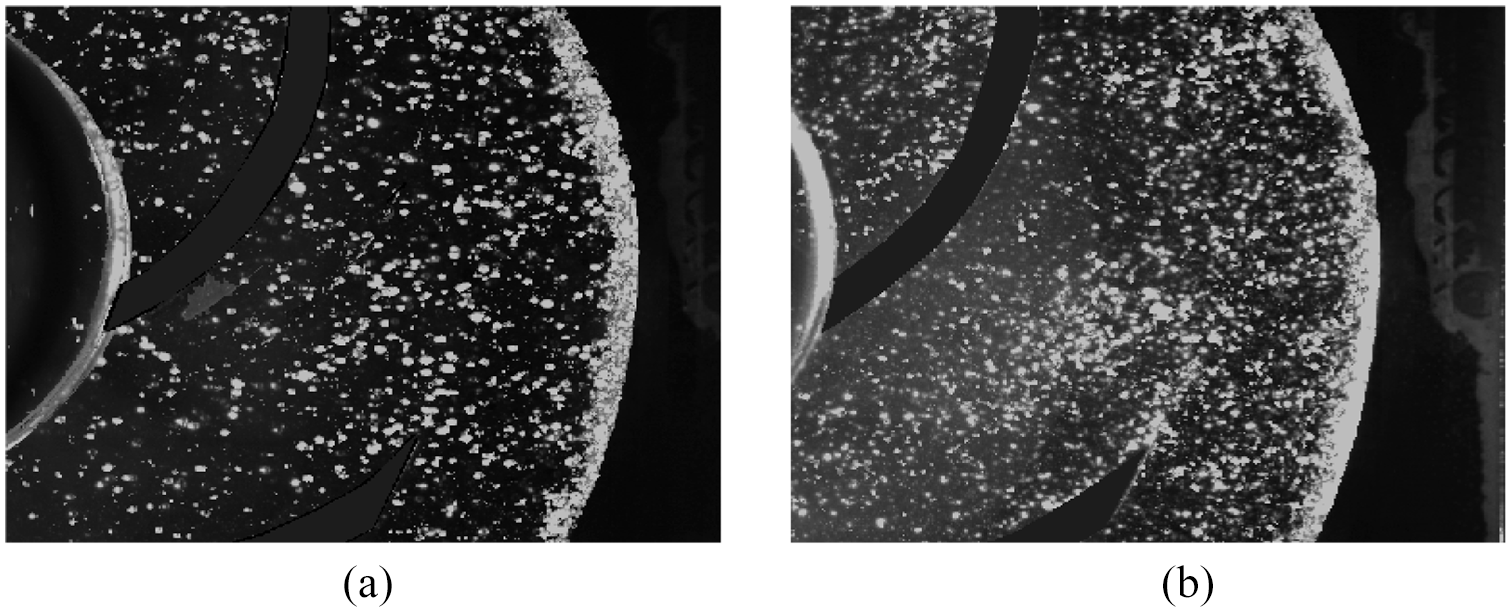
Particle distribution for different-sized particles: (a) glass bead 0.8–1.0 mm and (b) glass bead 0.4–0.6 mm.
Conclusions
The internal flow of the impellers under the two conditions of flow condition and impeller structure was studied experimentally. The experimental data were processed to obtain the relative velocity flow field and relative velocity of the solid–liquid two-phase along the pressure and suction surfaces, and the distribution trend of the solid particle phase inside the impeller.
The performance curves of the two impellers at different flow rates and particle concentrations were tested. As the particle concentration increased, the impeller performance of the double arc curve decreased slowly. Furthermore, the high-efficiency area of the impeller of the double circular arc line was significantly wider, indicating that the use of a double circular arc line in the solid–liquid two-phase centrifugal pump could improve the reliability of the impeller.
The flow inside the liquid/solid centrifugal pump under different working conditions was studied from three angles. At the same radius, the relative velocity gradually increased from the pressure surface to the suction surface and achieved the maximum at the suction surface. On the pressure surface, the relative velocity increased gradually along the radius and achieved the minimum near the inlet and outlet of the pressure surface. At the suction surface, there was a downward trend initially, which ended near the midpoint of the blade, and then increased. After adding solid particles, the velocity field of the solid–liquid two-phase fluid changed. The relative velocity of the solid and liquid phases was close at the inlet of the impeller; there were clear differences at the outlet, which results in an increase in wear of the solid particles on the outlet of the impeller. With the increase in solid particle concentration, the viscosity of the fluid increased and the relative velocity decreased. The increase in the concentration of solid particles increases the number of impacts of the particles and blades, which increases the wear of the blades. Owing to their small mass, the small-sized particles required less suspension speed in the liquid, and demonstrated superior followability with the fluid and less difference in the relative speed of the solid–liquid two phases. For the large-sized particles, the inertial force was large; hence, the relative speed difference between the particle and liquid phases was large, which increases the friction loss and causes the efficiency of the liquid/solid flow pump to decrease. The double arc profile was closer to the liquid flow angle, which reduced the impact loss and increased the efficiency.
The distribution of solid particles in the impeller was analyzed. A superimposed image indicated that the particle distribution in the impeller flow channel was relatively uniform, the density of the pressure surface and the volute wall surface was greater, and the density of the pressure surface was higher than that of the suction surface. The particle concentration gradually increased from the inlet to the outlet, which is in line with the fact that the centrifugal pump impeller flow path is a diffusion flow path. Large-sized particles were more likely to follow the fluid owing to their higher mass and tended to work on the blade working surface during the flow. The concentration of particles in the outlet of the impeller and the volute was large, which subjects the two parts to increased wear.
Footnotes
Declaration of conflicting interests
The author(s) declared no potential conflicts of interest with respect to the research, authorship, and/or publication of this article.
Funding
The author(s) disclosed receipt of the following financial support for the research, authorship, and/or publication of this article: The authors gratefully expressed their thanks for the financial supported by the Foundation of the Nati-onal Natural Science Foundation of China (No. 51974033) and Educational Commission of Hubei Province of China (D20171305).