
Abstract
The power quality assessment provides a reference for power quality management and control of microgrid operation. In terms of reflecting the correlation of power quality indexes and the dynamic changes of microgrid operating conditions, the traditional power quality assessment methods need to be improved. A power quality comprehensive evaluation based on CRITIC and dynamic coefficient is proposed in this paper. In this method, the objective weight of power quality indicators in single node is determined by using the intensity of conflict and contrast firstly. For the node weight calculation, the dynamic coefficient is proposed to reflect the different influence degree of node with different connected load. The proposed method in this paper can reflect both the internal characteristic of data sequence and the relationship between different data sequences. In addition, it also can reflect the dynamic changes of microgrid. Finally, an example is used to verify the feasibility of the proposed method.
Introduction
Microgrid is one of the reasonable ways to connect distributed power generation system to the grid. Its characteristics include low environmental pollution, flexible operation mode, and strong power supply reliability, therefore it has been extensively studied.1–3However, compared with traditional power grids, microgrids have the characteristics of small capacity and low inertia. The proportion of power electronic equipment in the microgrid is higher than the large grid.
Since the microgrid is susceptible to the load of the power grid and power electronic converters, power quality problems frequently appear in the microgrid. An increasing number of researchers are paying more attention to the power quality of microgrid.4,5
In response to the complex power quality problems in microgrids, relevant power quality standards in various countries have been established, 6 and various comprehensive power quality evaluation methods have been proposed by domestic and foreign experts. The existing power quality evaluation methods mainly include analytic hierarchy process,7–11 entropy method,12–14 and methods based on probability statistics.15,16
In power quality assessment, AHP (analytic hierarchy process) is commonly applied, in which the importance of different power quality indicators is sorted to form a judgment matrix in AHP, which can be determined the weight vector.7–11 However, the traditional AHP cannot accurately identify the specific reasons for the inconsistency of the matrix when the conditions of the matrix consistency test are not met. In order to overcome the limitations of the traditional AHP, the matrix consistency test was improved by related scholars.10,11 The complete consistency matrix can be obtained by derivation of the antisymmetric matrix and the transition matrix. Therefore, the process of matrix consistency test in the traditional AHP can be omitted. 10 In addition, the fuzzy judgment matrix is proposed to solve the problem of uncertain subjective judgment based on expert experience. 11
In power quality assessment, the subjective weighting method is too reliant on the expert experience to deviate from actual data characteristics. In contrast, the weight can be obtained by extracting the data character in subjective weight method. The improved entropy weight method is proposed to improve the mismatch between the weight and the information when the entropy value is close to 1.12–14 At the same time, some methods combining subjective with objective are proposed.17–19 However, the relevant information between the different data sequences and the dynamic change of system cannot be embodied well.
In this paper, a comprehensive power quality evaluation method of microgrid with dynamic weighting based on CRITIC is proposed. In this paper, the CRITIC method is used to evaluate the power quality of a single node, and the node dynamic coefficient is added. In other words, when the large-capacity load of the microgrid changes, the impact of loads on the microgrid is also changed. A comprehensive power quality evaluation model is established, which can adjust the evaluation rules in real time according to the actual load operation of the microgrid when large capacity load changes occur. This method can realize the identification and evaluation of the power quality problems in the microgrid system. According to the evaluation results, the power quality problems of the microgrid can be discovered in time to ensure the power quality and daily operation.
Microgrid structure and power quality problems
The microgrid structure
Microgrid is a small regional power generation and distribution system with the composition of distributed power supply, energy storage device, energy conversion device, 20 as shown in Figure 1. Through the opening and closing of PCC (Point of commonly coupling), the microgrid can be operated in parallel with the external power grid or in island operation. 21 When the microgrid is operating on islands, the energy storage devices, photovoltaic power generation devices, and wind generators in the grid maintain the operation of the microgrid. The intermittent problem of renewable energy generation is regulated by the microgrid by controlling the charging and discharging of energy storage equipment. In this way, it is ensured that electric energy meets the load demand in different time periods.
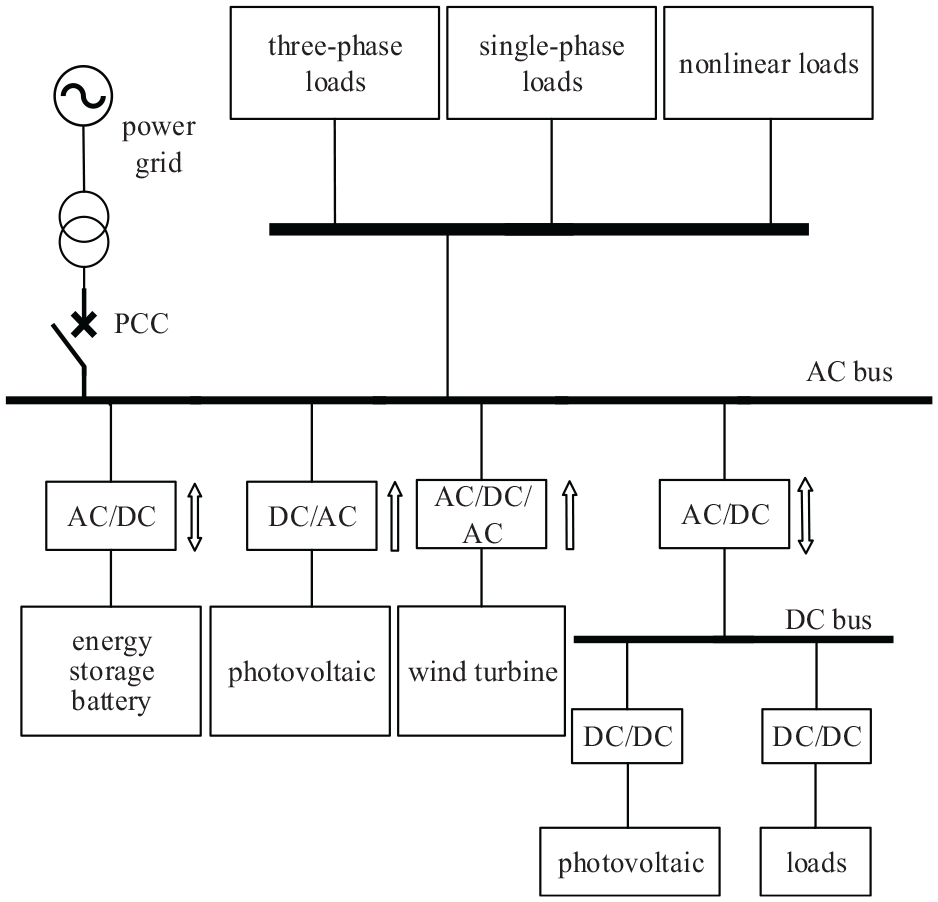
Schematic diagram of microgrid structure.
Analysis of microgrid power quality problems
Microgrids are generally built at the end of the distribution network. 22 There is a large number of distributed power generation equipment and some user loads in the microgrid, which are connected to the bus through one-level or multi-level conversion using power electronic converters. 23 The harmonic problem caused by a higher proportion of power electronic equipment in the microgrid is more prominent, and the power quality of the large power grid will be polluted in severe cases. 24
The SPWM inverter circuit is usually used when the microgrid is performing AC/DC conversion. In the inverter circuit, the output voltage and current close to a sine wave, but in a three-phase bridge inverter circuit, the harmonic angular frequency contained in the output line voltage is 25 :

where
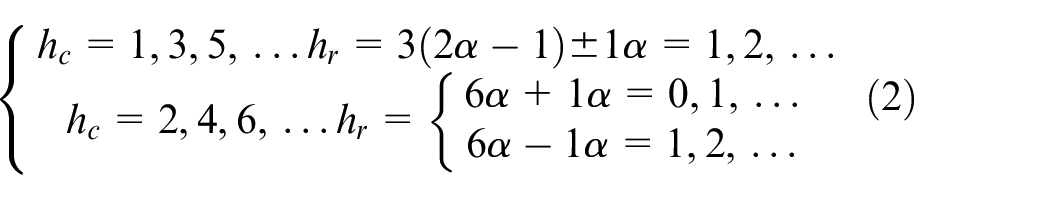
In order to make the output waveform close to the ideal sine wave, the carrier frequency is usually higher. After the inverter circuit, the harmonics in the system not only contain the low order harmonics of the power frequency integral times, but also contain the high-frequency harmonics near the switching frequency. At the same time, the connection of load side nonlinear components also brings out the harmonic problems. All of these lead to the wider frequency and more complex harmonic distribution. 26
Due to the existence of a large number of single-phase equipment in microgrid, the actual voltage of A phase is shown in the equation (3) 27 :

where
The three-phase balance structure of distribution network is seriously damaged. The single-phase equipment, single-phase load, and power grid influence each other in microgrid, which situation destroys the three-phase voltage balance of microgrid, and brings the problem of three-phase voltage imbalance in microgrid. 28 As a small power generation and distribution system, the power quality of microgrid is simultaneously affected by the load side, the distributed generation side, and the grid side, which makes it more difficult to analyze and control the power quality. 29 The power quality of the microgrid will affect the normal operation of the equipment to a certain extent, and affect the life of the equipment. It also may lead to the large-scale power outages huge economic losses in serious cases. 30
Compared with the traditional power grid, the traditional power quality evaluation methods are not suitable for microgrid evaluation. The access of a large number of power electronic devices and the structure of the microgrid is different from the traditional power grid. At the same time, the voltage fluctuation is great when the microgrid switches large capacity load, which affects the stability of the microgrid. And in this case, the power quality problem becomes more complicated. The power quality problems of microgrid systems cannot fully be reflected through a single power quality standard. Therefore, it is necessary to establish a reasonable power quality evaluation method, which is the premise to ensure the stable operation of microgrid. 31
Evaluation algorithm based on adjustable weights
The CRITIC method
The CRITIC method is proposed by Diakoulaki et al. whose basic idea is to use two parameters: correlation coefficient and standard deviation to determine the objective weight of the indicator. 32
In the CRITIC method, the objective weight between various indicators is measured by contrast strength and conflict. The standard deviation expresses the contrast strength of the indicator, which represents the size of the value difference between the evaluation schemes of the same indicator. The larger the standard deviation shows that the value difference between the schemes is greater. While the correlation coefficient is a quantitative index of conflict, the conflict will decrease with the increase of correlation coefficient.
In the CRITIC method,
where
The larger the index
Single node evaluation of microgrid
Before the data is processed, each indicator is standardized to overcome the impact of different indicator dimensions on the evaluation results. Since the indicators adopted in this paper are all positive indicators, the deviation standardization is adopted for the indicators in this paper, as the following 33 :
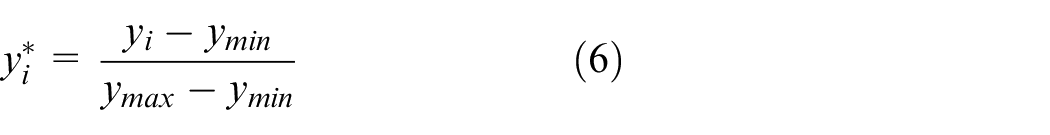
where
In this paper, the voltage deviation degree, frequency deviation degree, three-phase unbalance degree, and harmonic content are taken as the evaluation indexes of the system. System data is collected every Δt time. The index weight of the node is calculated by the CRITIC method, recorded as:

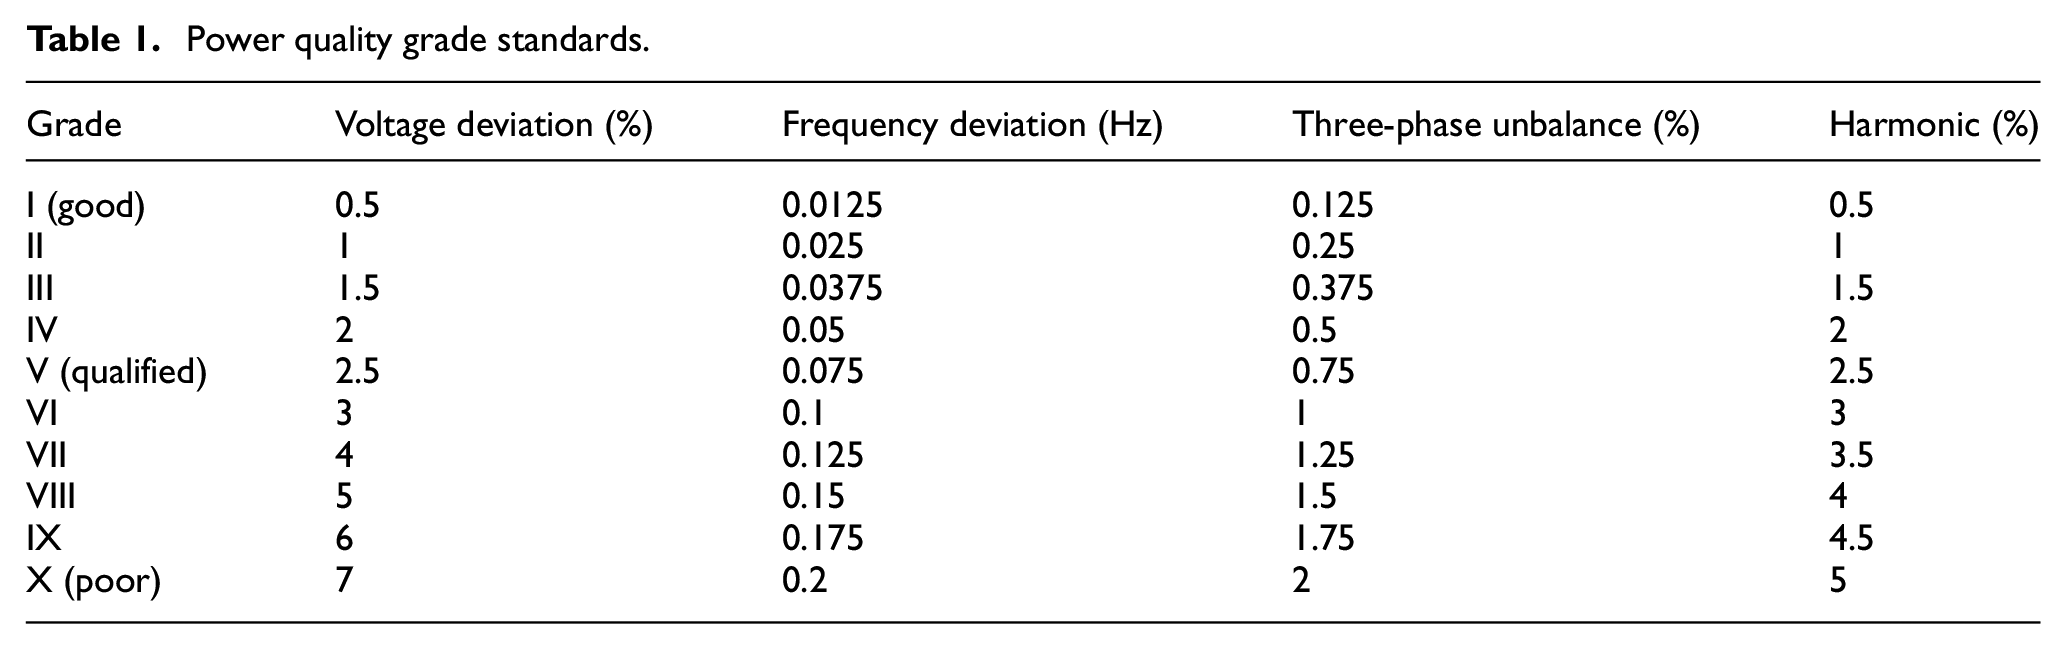
Consideration of the national power quality standard, the grade standard is developed as shown in Table 134–38:
Power quality grade standards.
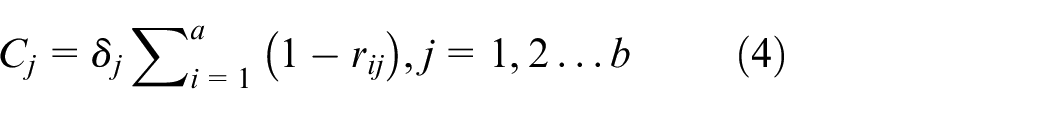
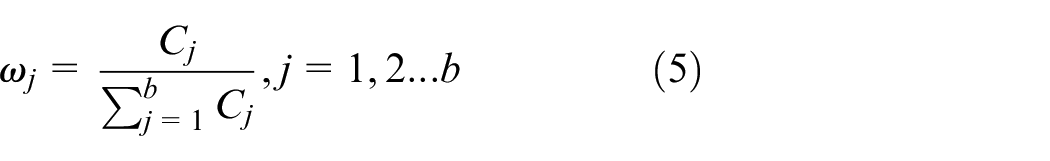
The weight of power quality of this node is as followed:
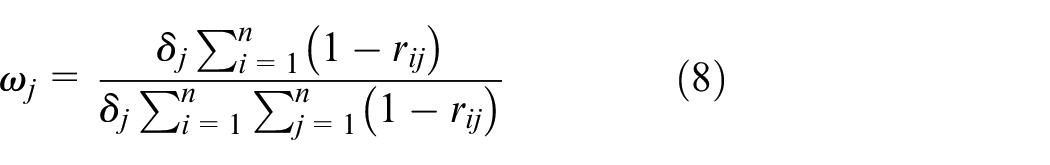
where
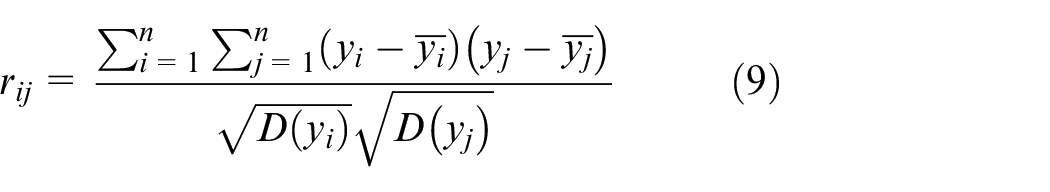
where
Since each index in the data is collected at the same time under the same microgrid system, the data quantity of power quality index i and j are both equal to n.
The frequency of each index in each grade is obtained by statistics. Under the grade k, the frequency of node i can be obtained as:
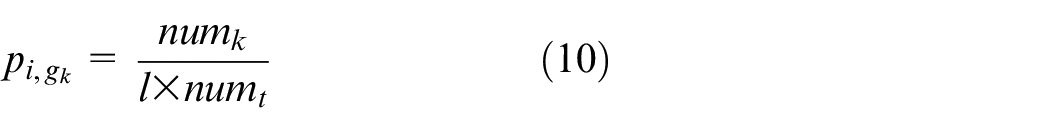
where k is used represent the power quality level; l is the total number of loads under this node;
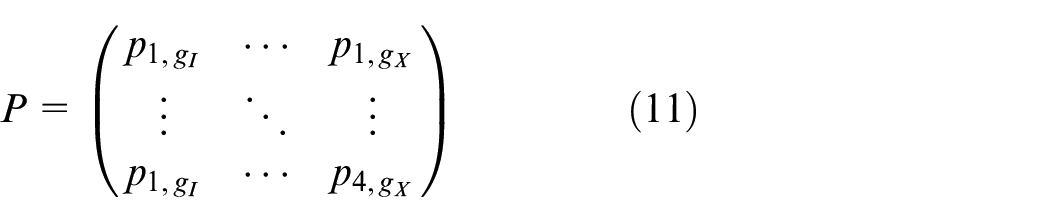
The probability matrix is composed of the frequency of multiple indicators of a single node, which can be expressed as:
Then the evaluation result vector can be obtained as:

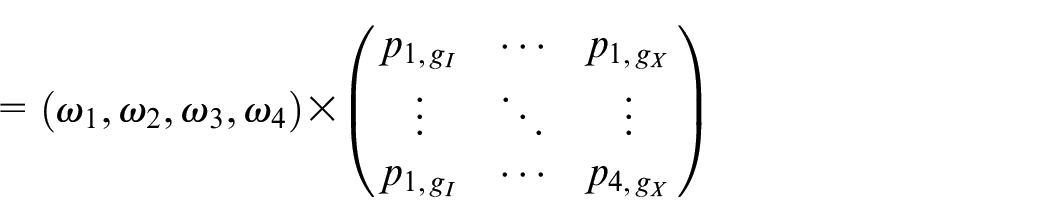

The final score is obtained by weighting the evaluation result vector as the relative importance index.
Comprehensive evaluation of microgrid
The gap between peak load and valley load, which affects the power quality seriously, is becoming larger and larger. For example, during peak hours of microgrids, severe voltage deviations occur due to switching loads. In the period of low power consumption, the frequency of the power grid is affected by load switching, which produces a relatively large frequency deviation. The impact loads will occur even in special circumstances. 31
Due to the support of large power grid, the voltage fluctuation of traditional distribution network with large capacity load switching is small. However, in the microgrid, the switching of large capacity load causes severe fluctuation of microgrid. In this paper, the dynamic load factor is added, which is related to the actual average operating load based on the evaluation of CRITIC single node. The dynamic coefficient of the node is related to the load capacity. When the load capacity changes, the dynamic coefficient of the node changes accordingly. The practical load with 95% probability is used as the average operation load in a period, which is positively correlated with the dynamic coefficient.
Assume that the microgrid system has a total of m nodes, the dynamic coefficient is expressed as:
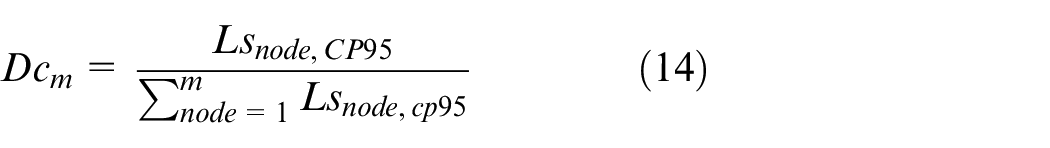
where
The 95% probability refers to the average value of the remaining 95% after the 5% maximum value of the power quality index is removed in the period.
The comprehensive power quality score of the microgrid model can be expressed as followed:

where
As mentioned above,
Example verification
The test data is captured in the microgrid simulation platform, which consists of energy storage battery, wind power system, photovoltaic system. The distributed generation unit are connected to the microgrid through power electronic converter. Switches are set at the front end of the microgrid system to control the grid connected operation and island operation mode of the microgrid. Multiple nodes are set up at the load of the microgrid system. By selecting three-phase balanced resistance load, three-phase unbalanced load, and nonlinear load to connect to the microgrid, the actual operation of the microgrid is simulated.
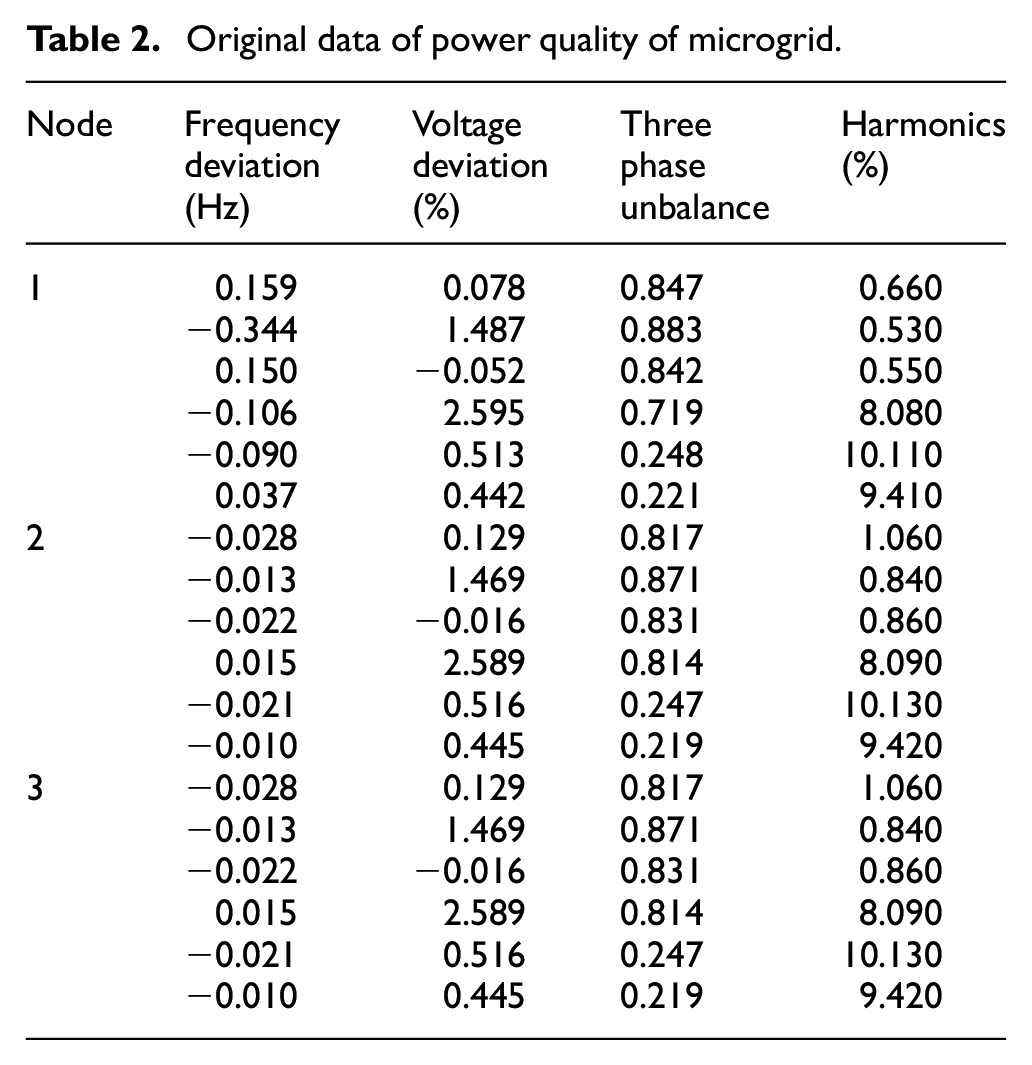
During the operation of the microgrid simulation platform, different capacities and different types of loads are switched on and off. In different periods and at different nodes, data is collected to calculate the voltage deviation of the microgrid system and other power quality data. Take load type as nonlinear load for example, the power quality data is shown in Table 2.
Original data of power quality of microgrid.
Dynamic coefficient condition evaluation
In order to verify the algorithm proposed in this article, the multi-period power quality data of seven nodes are collected when the loads are linear loads. The result of power quality index weight can be obtained by using equation (8):
The single node evaluation score and average load of seven nodes are shown in Table 3.
Average load and assessment results before connecting.
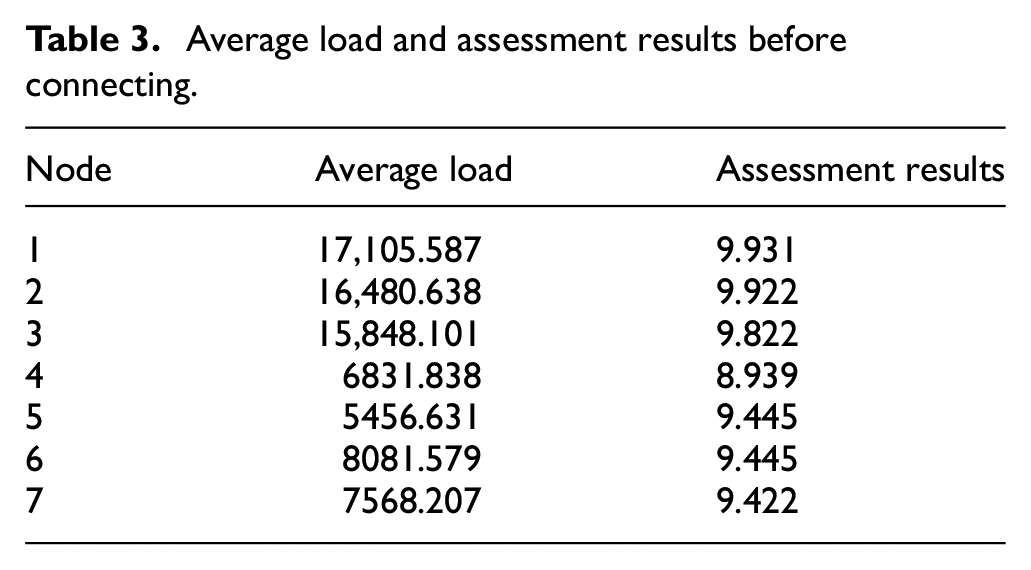
In this state, the dynamic coefficient matrix of the node is calculated by equation (14):

After weighting, the final score of the system is 9.68 (The full mark is 10).
In the microgrid, the load status is adjusted to a variety of situations of non-linear load or any combination of unbalanced load and linear load to evaluate power quality.
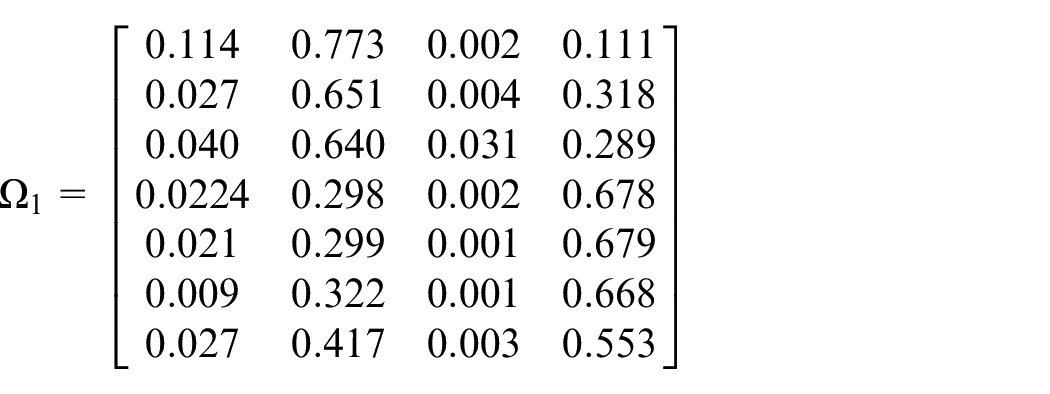
When there is a nonlinear load in the microgrid, the weight evaluation matrix obtained by equation (8) is as followed:
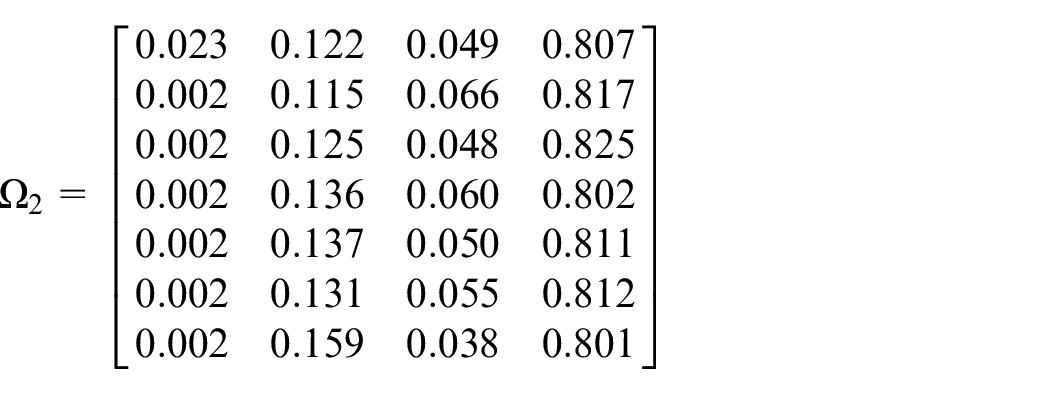
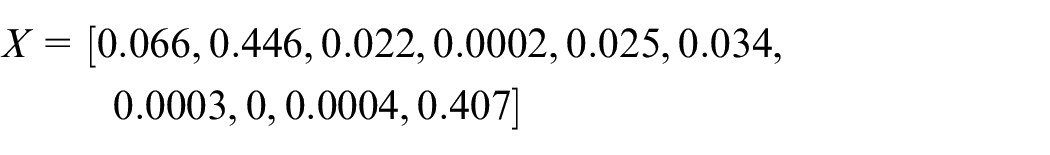
The evaluation result vector matrix of node 1 is calculated by equation (12) as followed:
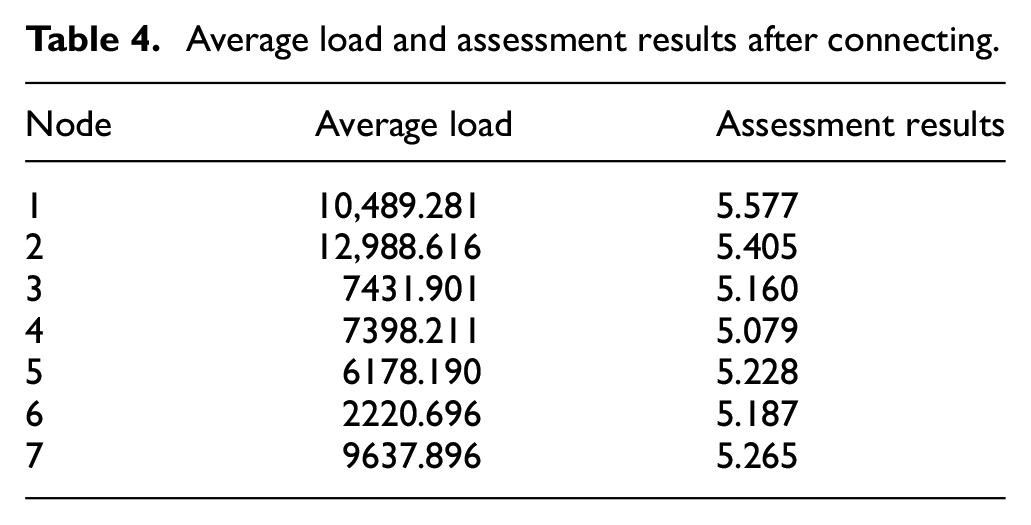
The comprehensive evaluation results and average load capacity of the seven nodes after connecting the nonlinear load are shown in Table 4.
Average load and assessment results after connecting.
In this state, the dynamic coefficient matrix of the node is calculated by equation (14):

After weighting, the final evaluation result of the system is 5.31.
In contrast, switching the system load to reduces the power quality of the microgrid system. Taking the nonlinear load in node 1 as an example, the results are calculated respectively by equations (8) and (9) as follows:
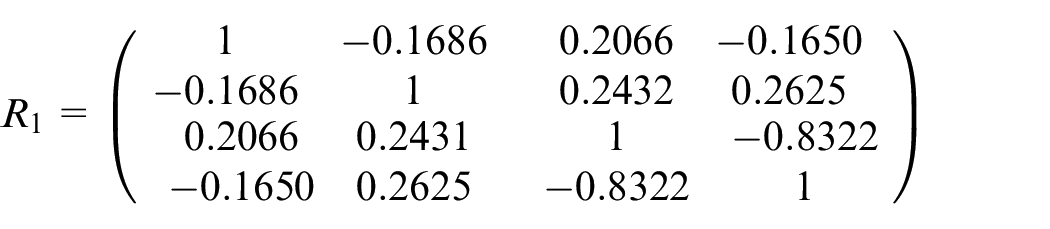


It is obvious that the weight coefficient and standard deviation of harmonics are the largest. When the nonlinear load is incorporated into the system, large harmonic problems are appeared. Then the evaluation result is becoming worse.
Load switching is the main factor causing the stability of microgrid. In this paper, the evaluation results of each node of the system are combined through adding dynamic coefficient to judge the power quality of the system. At the same time, dynamic coefficients are added to distinguish large-capacity loads from small-capacity loads. In addition to this, the coefficient of large-capacity load is increased in the evaluation.
Evaluation of typical power quality problems
The traditional entropy weight method is used for comparison and verification. Finally, the power quality evaluation weight of the system under nonlinear load is obtained by equation (8) as followed:

The weight comparison chart of the two methods can be shown in Figure 2.
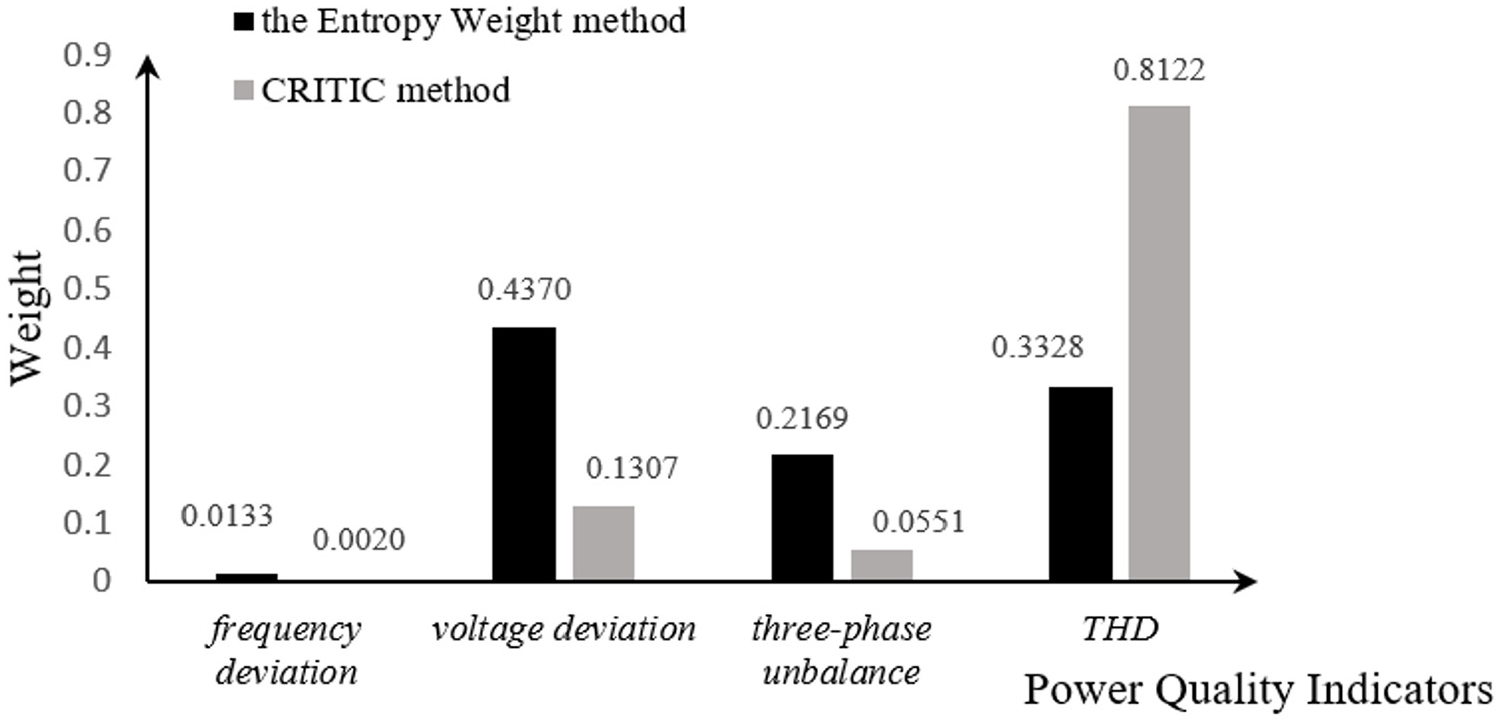
Weight comparison chart.
In Figure 2, the weight of each power quality index is uniformly distributed generally when the traditional entropy weight method is used to evaluate power quality. The weight of voltage deviation is the largest, followed by harmonics. Therefore, the most serious power quality problem of the microgrid system is voltage deviation, followed by harmonics. And the weight distribution of power quality indicators is relatively uniform.
However, compared to the entropy weight method, by using the method proposed in this paper the weight distribution can reflect the differences between the indicators. In Figure 2, the harmonic weight is the highest when a great deal of nonlinear loads is connected into the microgrid system. In other words, by using the proposed method the results indicates that the main power quality problem of the system is harmonic problem, which is consist with the actual operation mode.
Compared the original data with the above two algorithms for verification in the Table 2. In the original data, when a nonlinear load is incorporated into the system, the system voltage deviation and other indicators are basically within the controllable range. However, most of the harmonic data exceeds national standards. In other words, due to the non-linear load and a large number of power electronic equipment, the harmonic problem of the microgrid system is the most serious.
When the traditional entropy weight method is used as the power quality assessment method for microgrid, the indexes are homogeneously distributed. The typical harmonic problems in microgrids cannot be highlighted. It is more suitable for power quality analysis in traditional grid. The proposed evaluation method can more accurately and objectively respond to the power quality issues that have the greatest impact on the microgrid. It can provide accurate guidance for the microgrid control strategy, thereby the power quality level of microgrid can be guaranteed.
Conclusion
Comprehensive power quality evaluation method of microgrid with dynamic weighting based on CRITIC is proposed in this paper. Based on the single-node evaluation method of the CRITIC method, the load capacity is also considered to attain a comprehensive weighting factor, therefore a multi-node evaluation method can be obtained. The proposed method is suitable for both single-node and multi-node power quality assessment scenarios in microgrid systems.
Compared with the traditional power quality evaluation method, the method proposed in this paper reflects the actual power quality problems of the microgrid more objectively and accurately. It can not only reflect the strengths and weaknesses of power quality and the correlation between indicators, but also can be adjusted in real time according to the actual operation of the load in the microgrid. Therefore, it more closely follows the actual operation of the microgrid, which has a good application prospect in the power quality management of microgrid. Such as, the proposed power quality assessment can be applied in the position and identification of the microgrid power quality problems, and further can be used to provide guidance for the setting power quality devices.
Footnotes
Declaration of conflicting interests
The author(s) declared no potential conflicts of interest with respect to the research, authorship, and/or publication of this article.
Funding
The author(s) disclosed receipt of the following financial support for the research, authorship, and/or publication of this article: This work is supported by National Nature Science Foundation (51667002) and Ningxia first-class discipline and scientific research projects (electronic science and technology), No. NXYLXK2017A07.