
Abstract
The historical temperature data logged in the supervisory control and data acquisition (SCADA) system contains a wealth of information that can assist with the performance optimization of wind turbines (WTs). However, mining and using these long-term data is difficult and time-consuming due to their complexity, volume, etc. In this study, we tracked and analyzed the 5-year trends of major SCADA temperature rise variables in relation to the active power of four WTs in a real wind farm. To uncover useful information, an extended version of the bins method, which calculates the standard deviation (SD) as well as the average, is proposed and adopted. The implications of the analysis for engineering practice are discussed from multiple perspectives. The research results demonstrate a change in the patterns of the main temperature rise variables in a real wind farm, completeness of the monitoring of the WT internal temperature state, influence of wind turbine aging on temperature signals, a correlation between different measurement points, and a correlation between signals from different years. The knowledge gained from this research provides a reference for the development of more practical and comprehensive condition monitoring systems and methods, as well as better operation maintenance strategies.
Keywords
Introduction and motivation
Due to huge market demand and technological advances, the global installed wind power capacity has been growing steadily for many years, and wind power has been playing an important role in the power supply of many countries.1–3 Over time, wind turbines (WTs) will inevitably age, and decline in performance and efficiency, whereas their operation and maintenance (O&M) cost will increase.4–6 In addition, as WTs continue to become larger and larger,7,8 the hub, nacelle, and other important parts become higher and higher off the ground, bringing challenges to the O&M of wind power equipment and pushing up the maintenance costs of the turbines. Controlling the cost of energy (COE) of wind power and keeping it financially viable is the issue that the wind power industry must face in order to continue its healthy development. 9
Monitoring changes in the condition of the WTs or particular assemblies, and formulating optimized O&M strategies based on the condition information is an effective way to improve the service performance of WTs and reduce the energy cost of wind power. 10 This is also a current research hotspot in the wind power field. In Refs.11–14 the authors provide a review of the development of WT condition monitoring (CM) technology. Vibration analysis, oil monitoring and analysis, acoustic emission, ultrasonic testing techniques, strain measurement, radiographic inspection, thermography, etc. are all effective means of monitoring the condition of WTs. The data analysis methods used include trend analysis, data clustering, normal behavior modeling, failure modeling, and other methods. The rapid development of AI and machine learning technologies in recent years has greatly facilitated the advancement of WT condition monitoring technology and the mushrooming of new methods. Adrian et al. 14 focused on the application of machine learning methods in WT condition monitoring. Bangalorea and Patrikssonb 15 established a WT maintenance management framework that utilizes O&M data from different sources to combine the benefits of age-based and condition-based maintenance scheduling. Houda et al. 16 presented a decision-making approach for preventive maintenance strategies by the use of real options. Lu et al. 17 proposed an opportunistic condition-based maintenance (CBM) optimization approach for offshore WTs, in which economic dependence exists among the components that are subjected to condition monitoring. WT reliability studies will help to identify the most critical components of a WT, on the basis that identifying the most critical components will optimize the maintenance. 18 Daniel and John 5 analyzed life cycle reliability and maintenance of WTs, which applies the concept of failure mode and effects analysis (FMEA) and bond graph modeling to simulate the effects of maintenance strategies on the life cycle cost of WTs. Estefania et al. 18 presented an analysis and comparison of the reliability of 13 WTs conducted in Europe and the United States with a view of improving the effectiveness of condition monitoring systems. The fruitful work mentioned above has provided important technical support for the booming wind power industry.
Among several different types of systems used to monitor the condition of WTs, the most common ones include condition monitoring systems (CMS) and the supervisory control and data acquisition (SCADA) system. Tchakoua et al. 12 describes the latest technological advances of CMS. CMS, an optional additional configuration for WTs, requires expensive additional sensors installed on WT units.13,19 The SCADA system, as a standard feature of WT, is a low-cost solution for monitoring the condition of WTs. Jannis and Simon 13 reviewed WT condition monitoring technology that uses SCADA data. Sun et al. 20 established a general model for anomaly identification in WTs. Chen et al. 21 proposed a method for WT failure inspection based on deep neural networks (DNN) that more fully utilizes historical data on normal functioning and failures recorded by the WT SCADA system. Qiu et al. 22 put forward a WT failure diagnosis method based on the alarm information of the SCADA system and the Dempster–Shafer (D–S) evidence theory.
Temperature is one of the basic condition parameters that is closely related to the performance of WTs, and the SCADA system collects temperature signals from several key locations. Many condition monitoring methods make use of temperature data collected by the SCADA system. Guo et al. 23 proposed a new condition monitoring method using temperature trend analysis for a WT gearbox based on the nonlinear state estimate technique. Rodríguez-López et al., 24 by conducting a residual analysis of the bearing temperature using a prediction model based on the time delay neural network, realized the fault diagnosis and life evaluation of bearings on the non-drive end of a generator. Qu et al. 25 proposed a non-singleton fuzzy inference system (FIS) fault detection method to detect early WT faults. The temperature data collected by the SCADA system was used in the application cases. Based on the framework of the nonlinear autoregressive with exogenous inputs (NARX) neural network, Wang et al. 26 established a predictive time-sequence regression model, based on the key temperature signals of WTs. The vague information on the condition of WTs contained in the individual variation prediction residuals is clearly presented through the health index from the perspective of the temperature-related parameters (HIPT) established in the paper. Many studies have shown that there is significant individual variation and temporal variation in WT SCADA data,13,26,27–29 but the extent of variation is relatively unknown. Therefore, most of the above-mentioned methods (especially model-based methods) are flawed with limited applicability and one-sided assessment because they use recent local data as a reference for condition assessment. To further improve the performance of the condition monitoring method that uses the temperature data of the SCADA system, and to develop more practical and widely applicable condition monitoring technology, it is necessary to strengthen the understanding of the long-term changes in SCADA data of different individual WTs in real wind farms.
The SCADA system acquires and records important variables in the form of a time sequence that begins when the WTs are put into service. These historical data contain a wealth of information about the intrinsic characteristics of WTs. The knowledge gained by digging deeper into historical SCADA data provides the potential of using such data to optimize SCADA system design, WT condition monitoring methods, and O&M strategies. In recent years, many studies have focused on this added value of SCADA data. Francesco et al., 30 aiming to increase power generation, probed into the issue of optimizing the wind configuration of WT groups by mining SCADA data. Sequeira et al. 31 analyzed the effect of different types of lubricants on the efficiency of the gearbox and the efficiency of compete WTs. Gao et al. 32 investigated the power generation of four WTs, coupling the wake and topography effects with field measurements and SCADA data. Dai et al. 33 is a study of the aging of WTs. However, there are many difficulties in using and mining long-term SCADA data due to its complexity, volume, and in some cases, the involvement of trade secrets of wind power manufacturers or wind farms. The knowledge, especially in the development of CM and CBM of WTs, gained from SCADA data in existing studies is still very limited.
Therefore, in order to better understand the intrinsic characteristics, the individual variation and the patterns of variation over the service time of WTs in real wind farms, and to lay the foundation for the development of more practical and comprehensive CM systems and methods, as well as better O&M strategies, this study was conducted by tracking and analyzing the 5-year trends of all major SCADA temperature rise parameters in relation to active power of four WTs in a wind farm using the single-valued method. In addition, the implications of the analysis results for engineering practice are discussed from several different perspectives. To our best knowledge, comprehensive analysis and in-depth mining of the long-term data, with a focus on all major SCADA temperature parameters from multiple perspectives, has not been previously done.
The remainder of this paper is organized as follows. Part 2 presents the basic structure of the WTs involved in this study and the sources of data. The data processing and analysis methods used in the study are given in Part 3. Part 4 presents the results of the analysis. Part 5 uncovers, from several perspectives, the information contained in the analysis results that is useful for the development of condition monitoring and operational maintenance technologies. Finally, this paper is concluded in Part 6.
Data sources
The SCADA data used in the study are derived from 2-MW inner rotor permanent magnet direct drive WTs, located in a mountainous wind farm in Southern China. They have a diameter of 96 m, a cut-in wind speed of 3 m/s, a rated wind speed of 11 m/s, and a rotor speed of 6–17 rpm. The SCADA system records 10 min averages of 1 Hz-sampled WT condition and external environment parameters, including the wind speed, rotational speed, power, nacelle vibration, yaw angle, ambient temperature and temperature of several key components. The wind farm has a total of 24 WTs. This study used 5 years (from 1 January 2013 to 31 December 2017) of SCADA data from four WTs (WT #1, WT #5, WT #15, and WT #24) since the wind farm was in stable service.
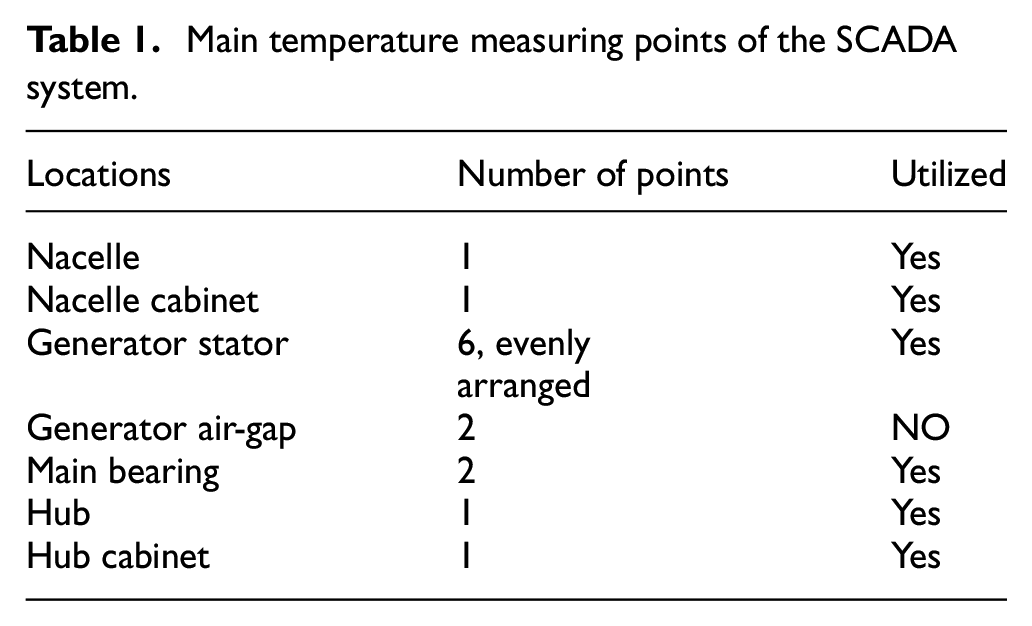
The body structure of the WTs involved in this study is shown in Figure 1. The traditional component, the gearbox, is removed because the rotor inside the motor of this type of WT is directly connected to the impeller through the main bearing. The temperature measuring points of the SCADA system are distributed in such specific locations and quantities as shown in both Figure 1 and Table 1, in the three assemblies: the nacelle, the generator, and the hub. The main drive system, pitch system, yaw system and several electrical cabinets are all in these three assemblies, therefore the temperature signals from the three, which all are collected by platinum thermal resistance sensors (PT100), are correlated with the dynamic behavior, control system characteristics, and overall machine performance of the WTs. Some of these parameters have been used by scholars for performance evaluation or condition monitoring of WTs. In order to obtain more comprehensive results, all temperature signals in Table 1 were taken into account at the beginning of this study.
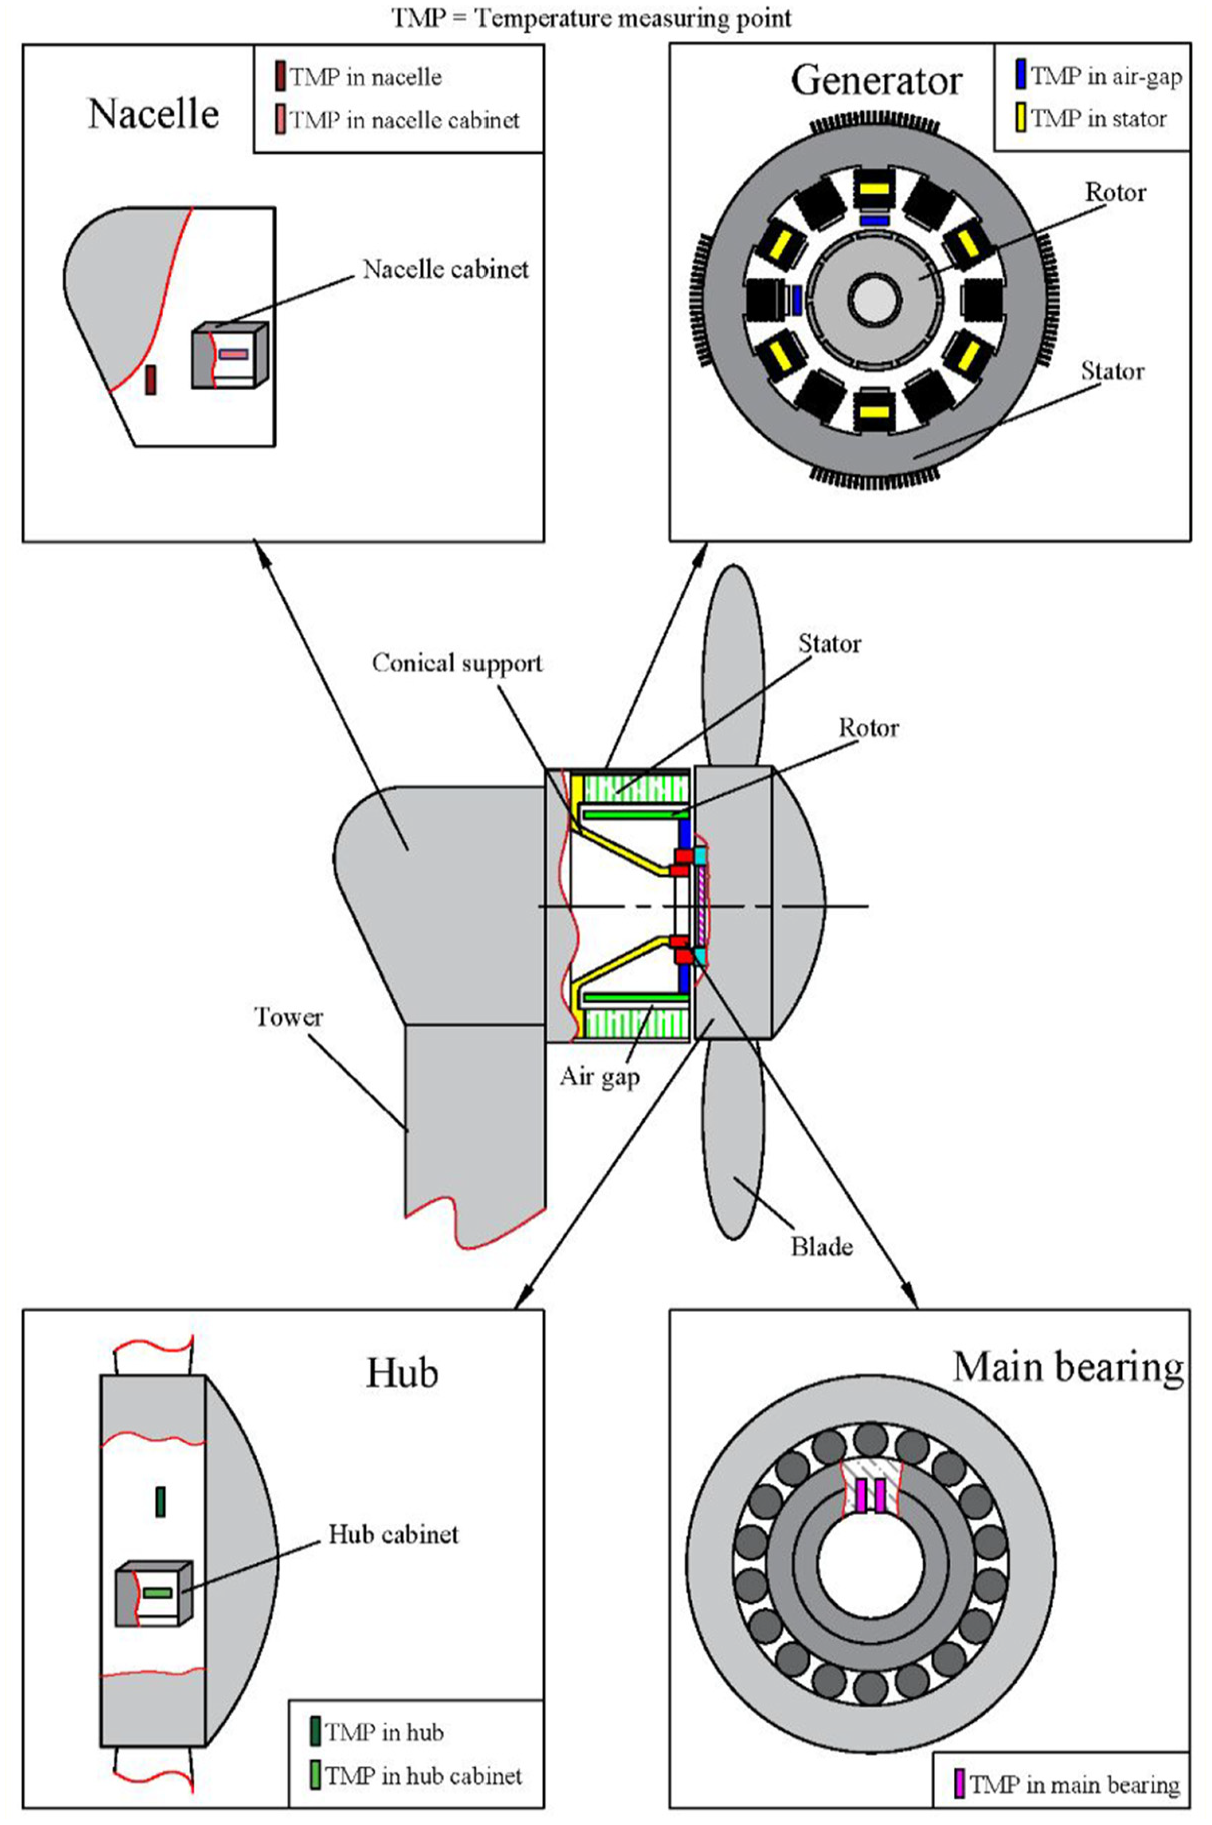
Overview of inner rotor permanent magnet direct drive WT and layout of temperature measuring points.
Main temperature measuring points of the SCADA system.
Methods
In addition to the health condition of the WTs, two kinds of parameters have a significant impact on the temperature signals of their key assemblies: one is the external environment, including ambient temperature, humidity and air density; and the other is the working conditions of the WT, including power, rotor speed, and torque. These two kinds of parameters were considered in the analysis when mining valuable information about the WT performance from temperature signals. We analyzed the variation patterns of the temperature signals of several WTs over time, which involved a considerable amount of data, making it appropriate to single out the parameters to be considered. Among the external environmental parameters, the ambient temperature has the most direct and significant impact. The active power, as the final outcome of the whole system operation, broadly reflects the working conditions of the WT. 4 In addition, the above two types of parameters are recorded in the SCADA system. So, we began by analyzing the temperature of key components in relation to active power and ambient temperature.
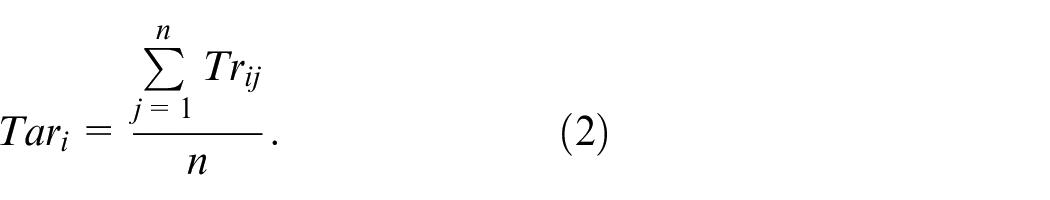
The analysis of the relationship between the above two parameters on one hand and the temperature of key components on the other is still relatively complicated. Therefore, in this study, the temperature rise

where
A scatter plot that visualizes the relationship between the temperature values in certain key locations of the WTs and active power is given in Wang et al.,
26
from which it is known that there is a complex relationship between the temperature in the key locations of the WT and the active power. The relationship between temperature rise and active power is also very similar to the above situation, yet the scatter plot is too complex to analyze and it is necessary to process the data by a single-valued processing method. The bins method is commonly used in data mining and performance evaluation of WTs, and its effectiveness has been confirmed by numerous studies, which makes it reasonable to subject the temperature signals to this method in this study. The method first discretizes the analyzed active power range with the interval (bin) length of
Considering that in addition to the average, the dispersion of data under certain conditions is another important statistical indicator that helps uncover more useful information, we used an extended version of the conventional bins method by calculating the standard deviation (SD)

The bins should cover, to the extent possible, all recorded active power values for all WTs in service. The size of each bin should be appropriately small provided that the number of sample points within each bin is large enough to be statistically significant. For the purpose of this study, the bin ranges were set to be [0, 2000 kW] and the increments
Due to the extremely harsh working environment of the WT SCADA system, it is necessary to check the validity of the temperature signals in Table 1 before they are put into use. The time sequence curve of every signal is first examined to exclude invalid signals. Most of the signals fluctuated within a reasonable range and were related to seasonal changes and wind turbine operating conditions (such as time sequence curve of a temperature signal in the generator stator shown in Figure 2(a)) which were shown to give them the characteristics of normal temperature signals so they could be used for data mining studies. However, there is no effective signal output from any sensor located in the generator air gap (shown in Figure 2(b) is a time sequence curve of the temperature in the generator air gap, to which the curves of the other WTs and in other years are similar, all staying at around 50°C throughout the year, which clearly do not match characteristic of a normal temperature signal). Therefore, the temperature signal from this location was ultimately not used in this study. The collected date was also cleaned to ensure that only dates in operation were used, as temperature signals collected in standby or shutdown conditions contain little valuable information.
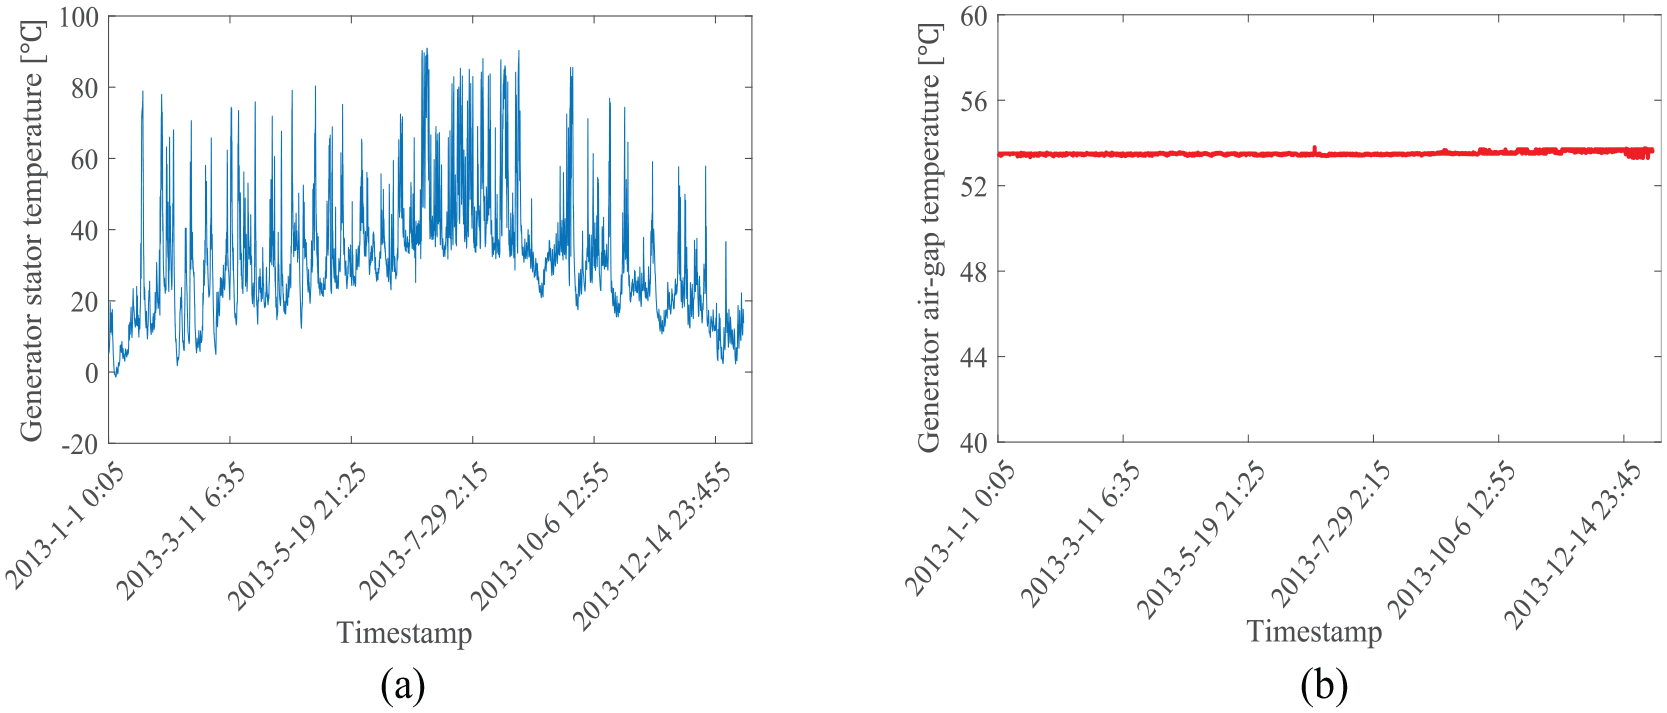
Signal curve of the temperature sensor of WT #1 in 2013: (a) a generator stator temperature signal and (b) a generator air gap temperature signal.
In addition, as can be seen from Table 1, several measuring points are arranged in the generator stator and main bearing, accordingly, the average temperature of multiple points distributed at a single location will be taken as the temperature value at that location in the data processing process when these data thereon are used.
In summary, the data processing process of this study is shown in Figure 3. Every curve of relationship between the annual temperature rise (and standard deviation) of each temperature signal and active power obtained by the uniformization processing method is analyzed and compared from many different angles to mine useful information from the data in this study.
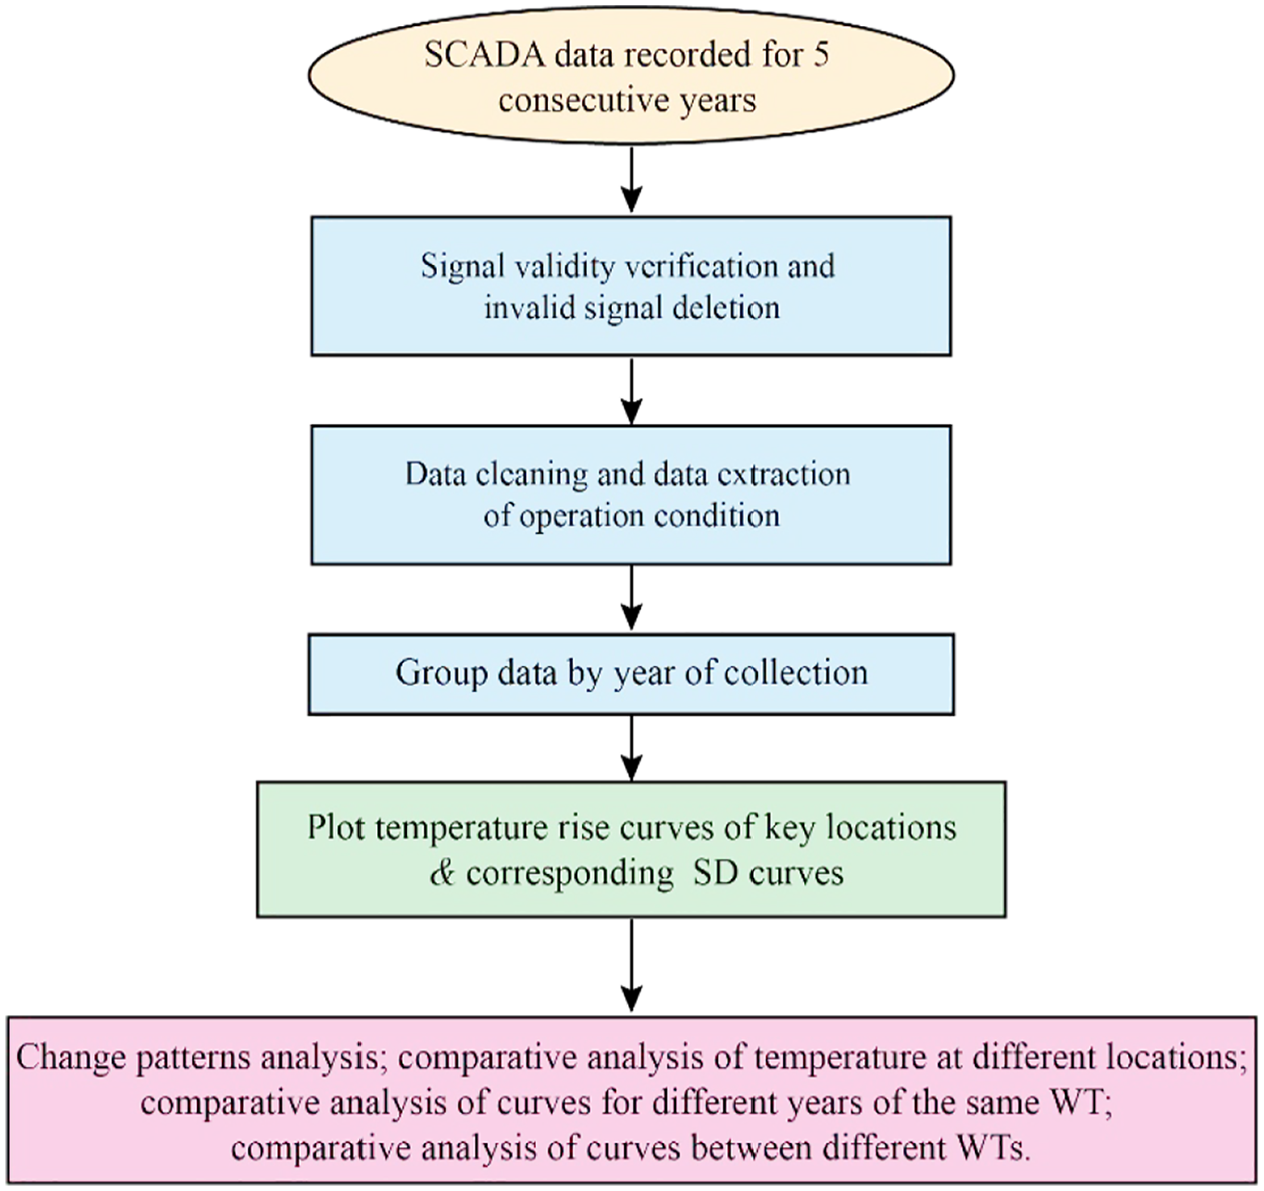
Data analysis process.
Results
The relationship between the temperature rise of the main bearing and the active power under operating mode are shown in Figure 4. The rise of the main bearing temperature and the active power is positively correlated in such a manner that if the active power is below about 500 kW, the main bearing temperature rise increases fast when the active power increases, and if the active power is above 500 kW, the main bearing temperature rise increases at a decreased rate. The curves of the same WT differ relatively little from year to year for WTs #1 and 24, but they differ a lot for WTs #5 and #15. The temperature rise curves of the main bearing of WT #1 mainly fluctuates in the range of 18°C to 36°C. The upper limit of the fluctuation range of other WTs is about 5°C higher. The SD curves of the main bearing temperature rise are shown in Figure 5. The SD of the main bearing temperature decreases slowly while active power increases. The SD value of the temperature rise in 2014 for WT #15 and #24 was about 2°C greater than in other years, due to the fact that there were moments in 2014 when the temperature rose too high for both WTs (the raw data shows that the main bearing limit temperature rise in other years was about 51°C, while the 2014 temperature rise limit for both WTs exceeded 58°C).
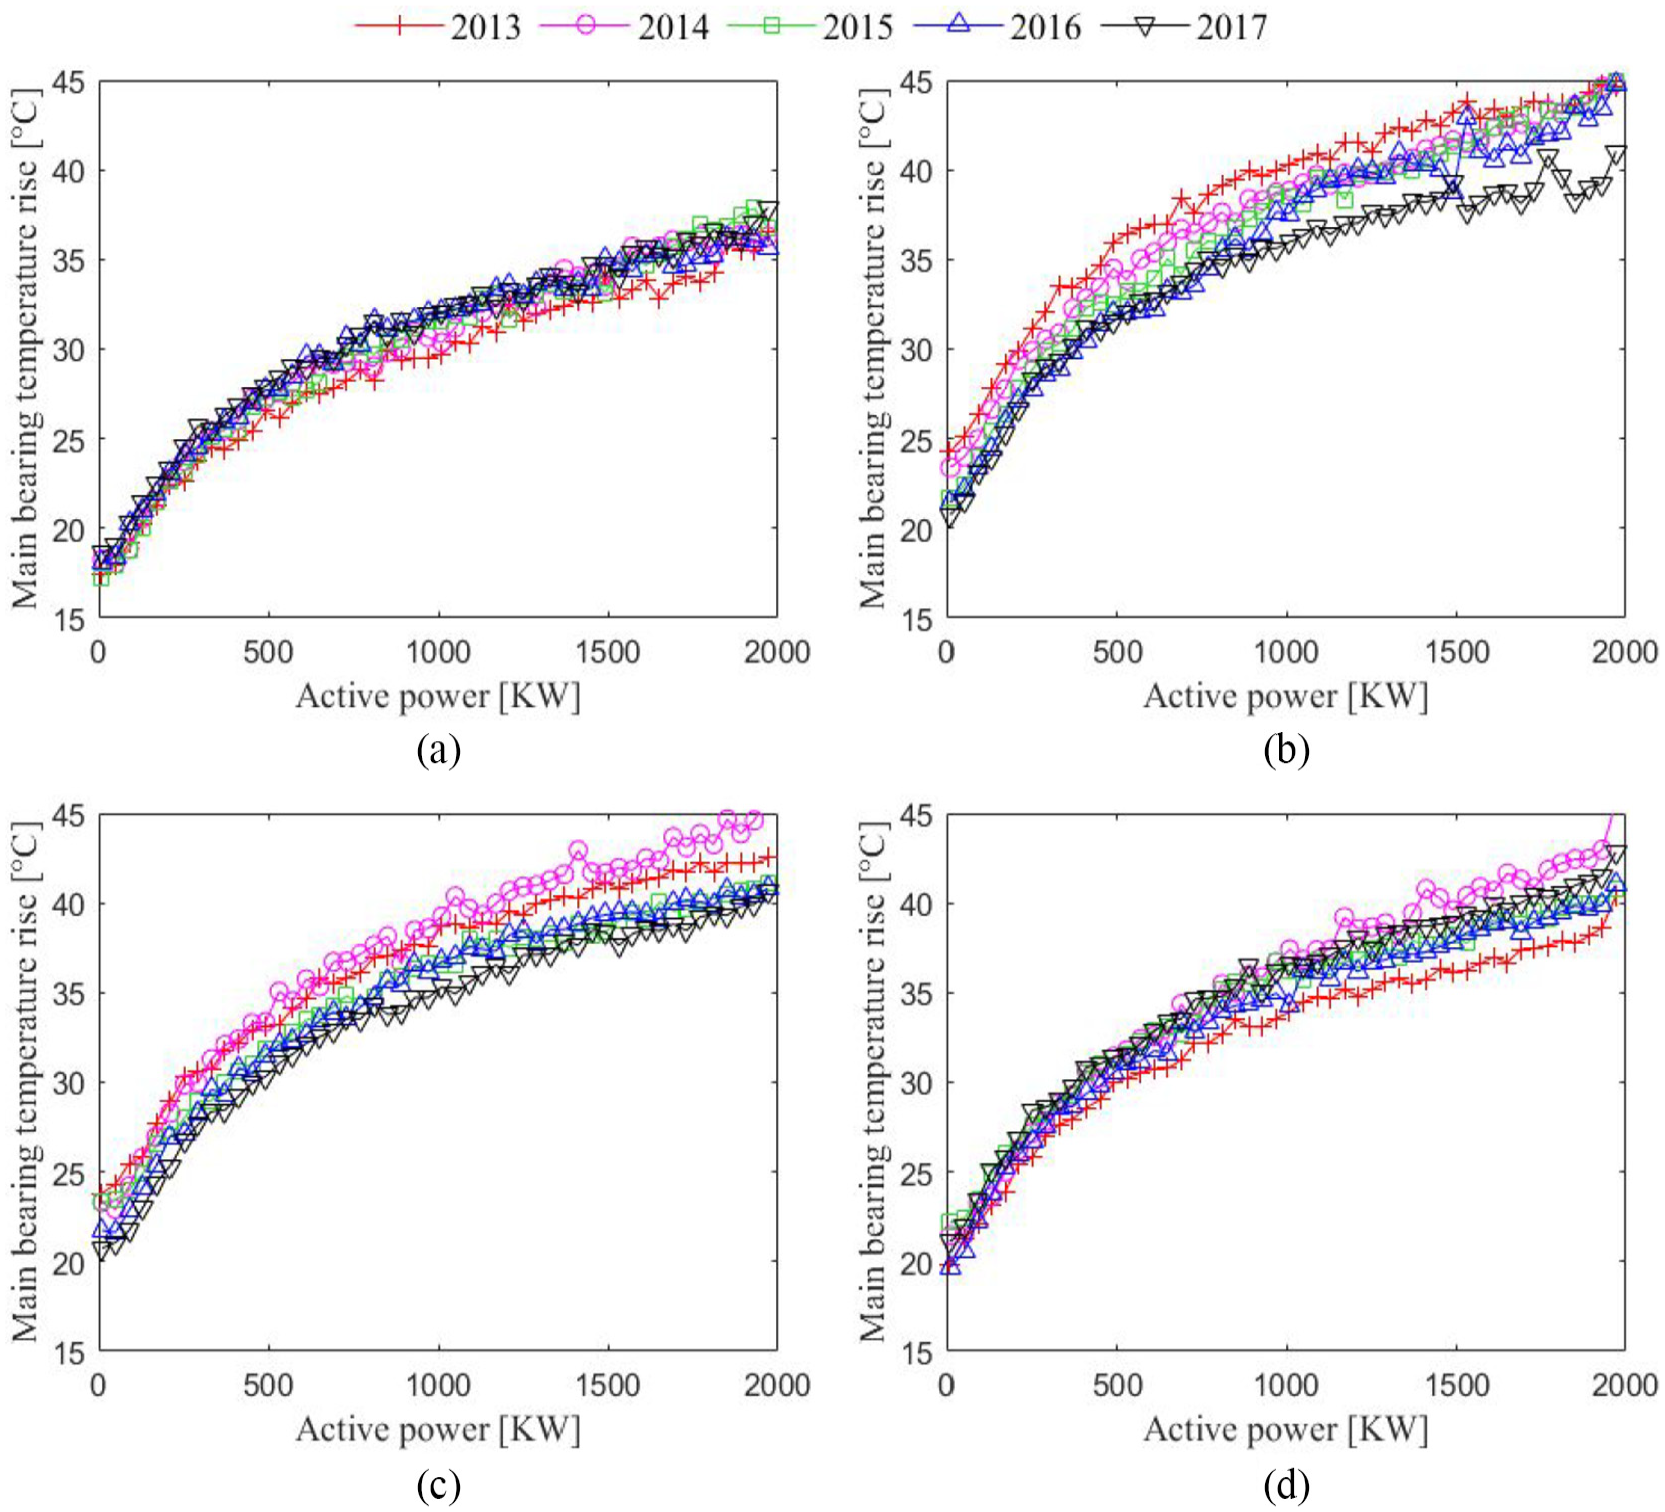
Relation between the rise of the main bearing temperature and the active power: (a) WT #1, (b) WT #5, (c) WT #15, and (d) WT #24.
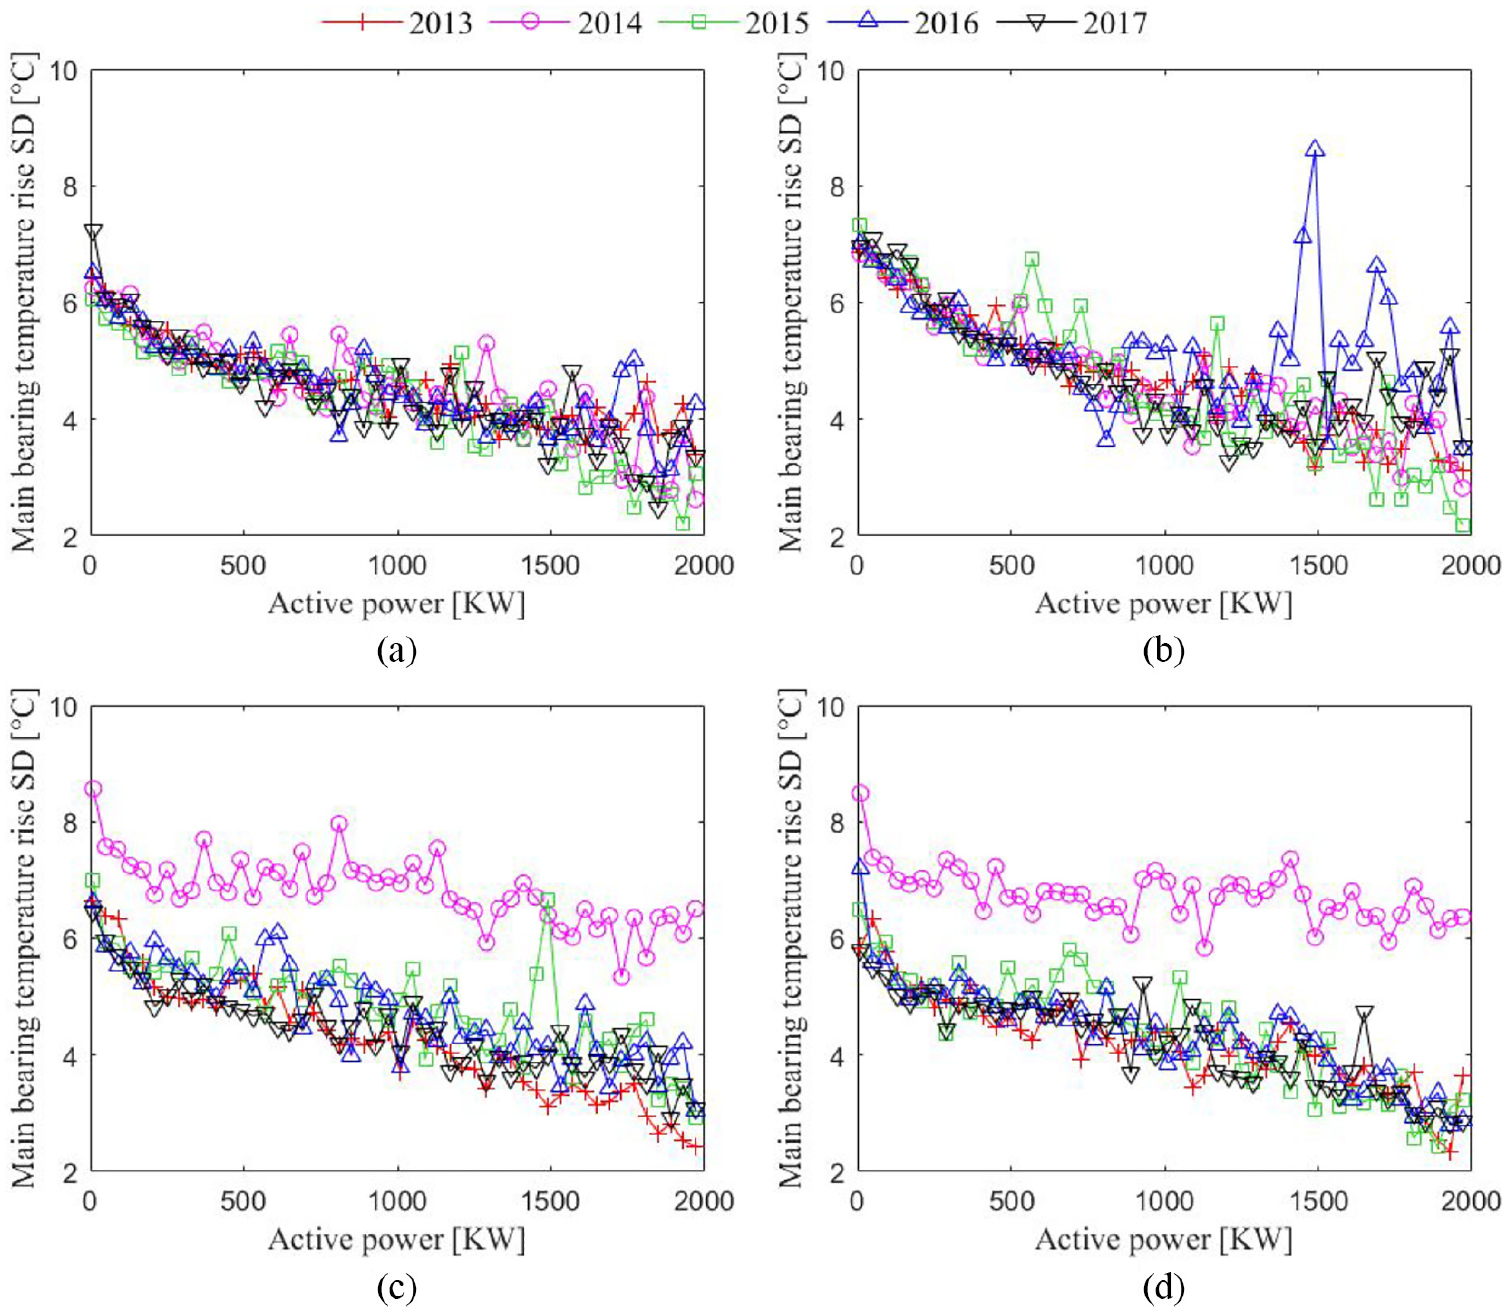
Relation between the SD of the main bearing temperature rise and the active power: (a) WT #1, (b) WT #5, (c) WT #15, and (d) WT #24.
Figures 6 and 7 set out the analysis results of the relationship between the temperature rise of the generator stator, which is located in the generator, as the main bearing is, and the active power. The stator temperature rise of all WTs increases from about 10°C to about 60°C with an increase in active power. The growth rate of the temperature rise also tends to increase gradually when the active power increases. Compared with the main bearing temperature rise, the stator temperature rise increases faster and the differences between WTs are smaller. The SD of the temperature rise increases first when the active power goes up (when the active power is below about 1300 kW) and then decreases even though the active power continues to climb.
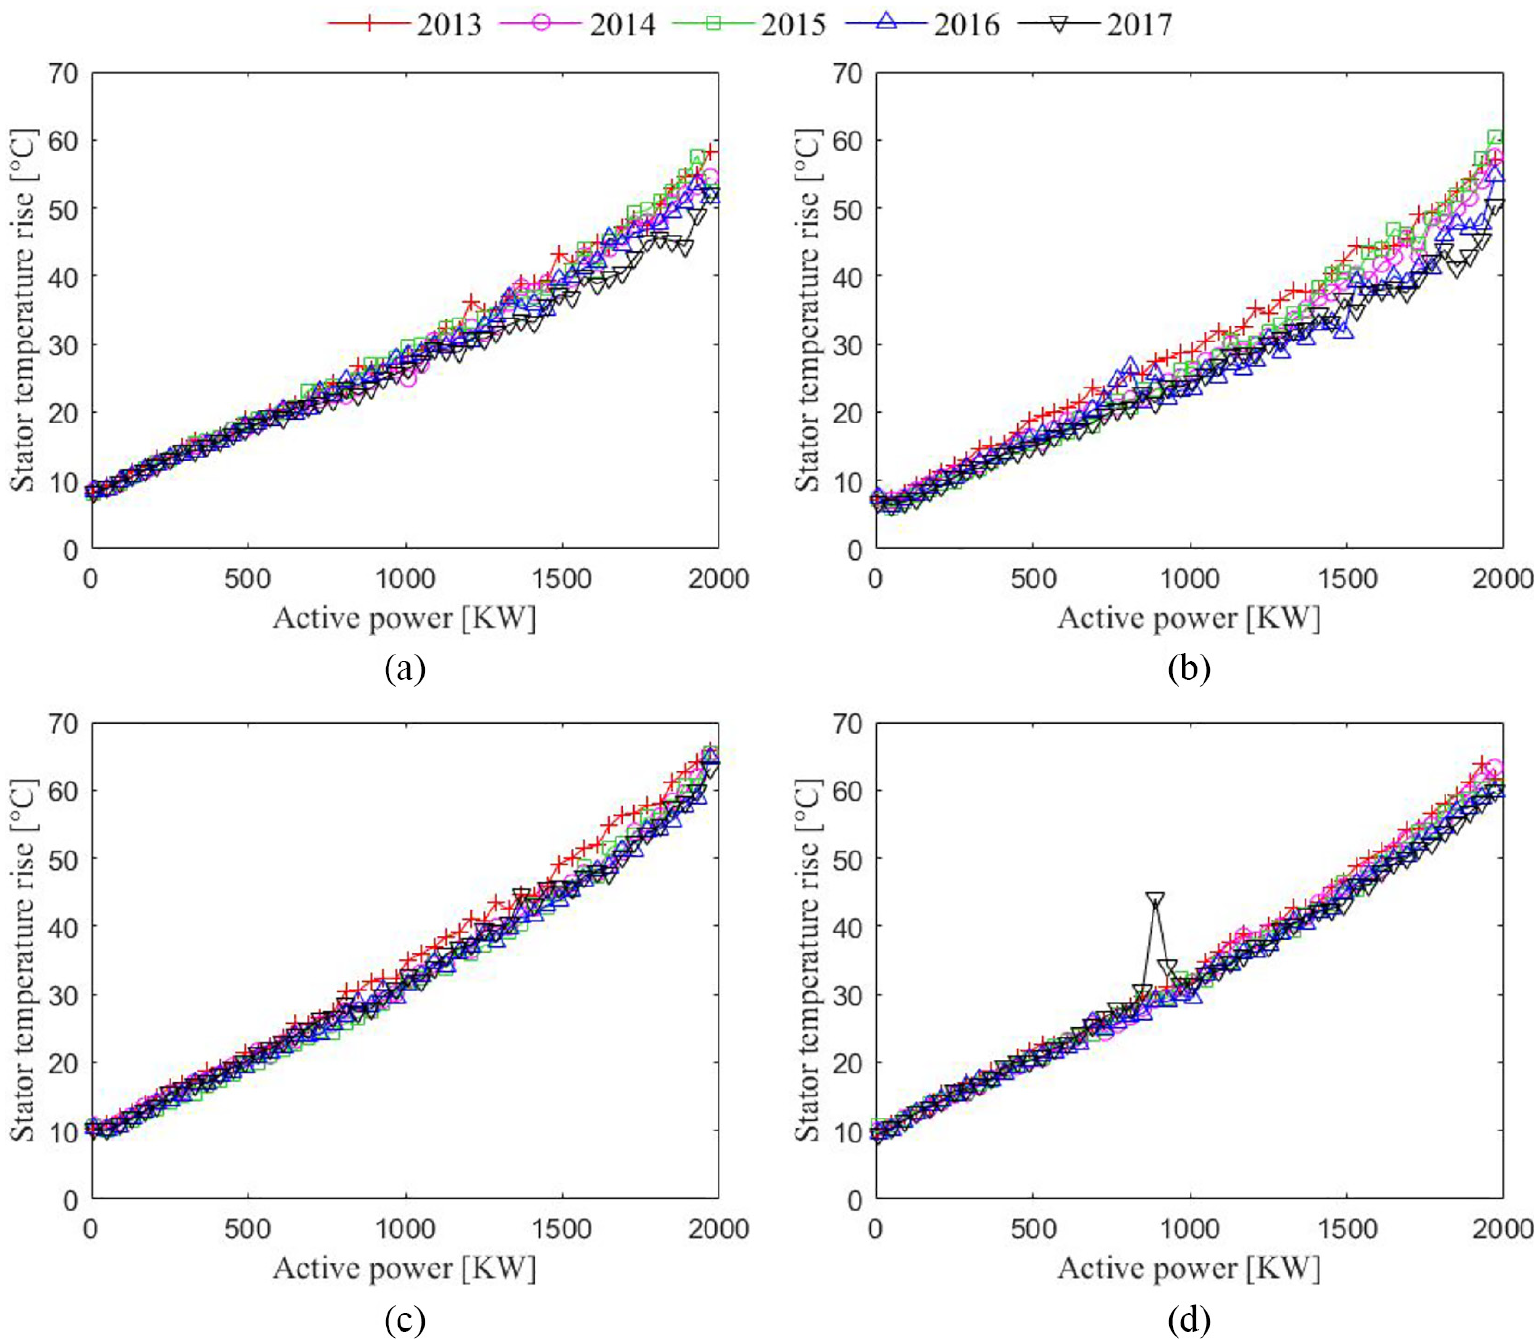
Relation between the rise of stator temperature and the active power: (a) WT #1, (b) WT #5, (c) WT #15, and (d) WT #24.
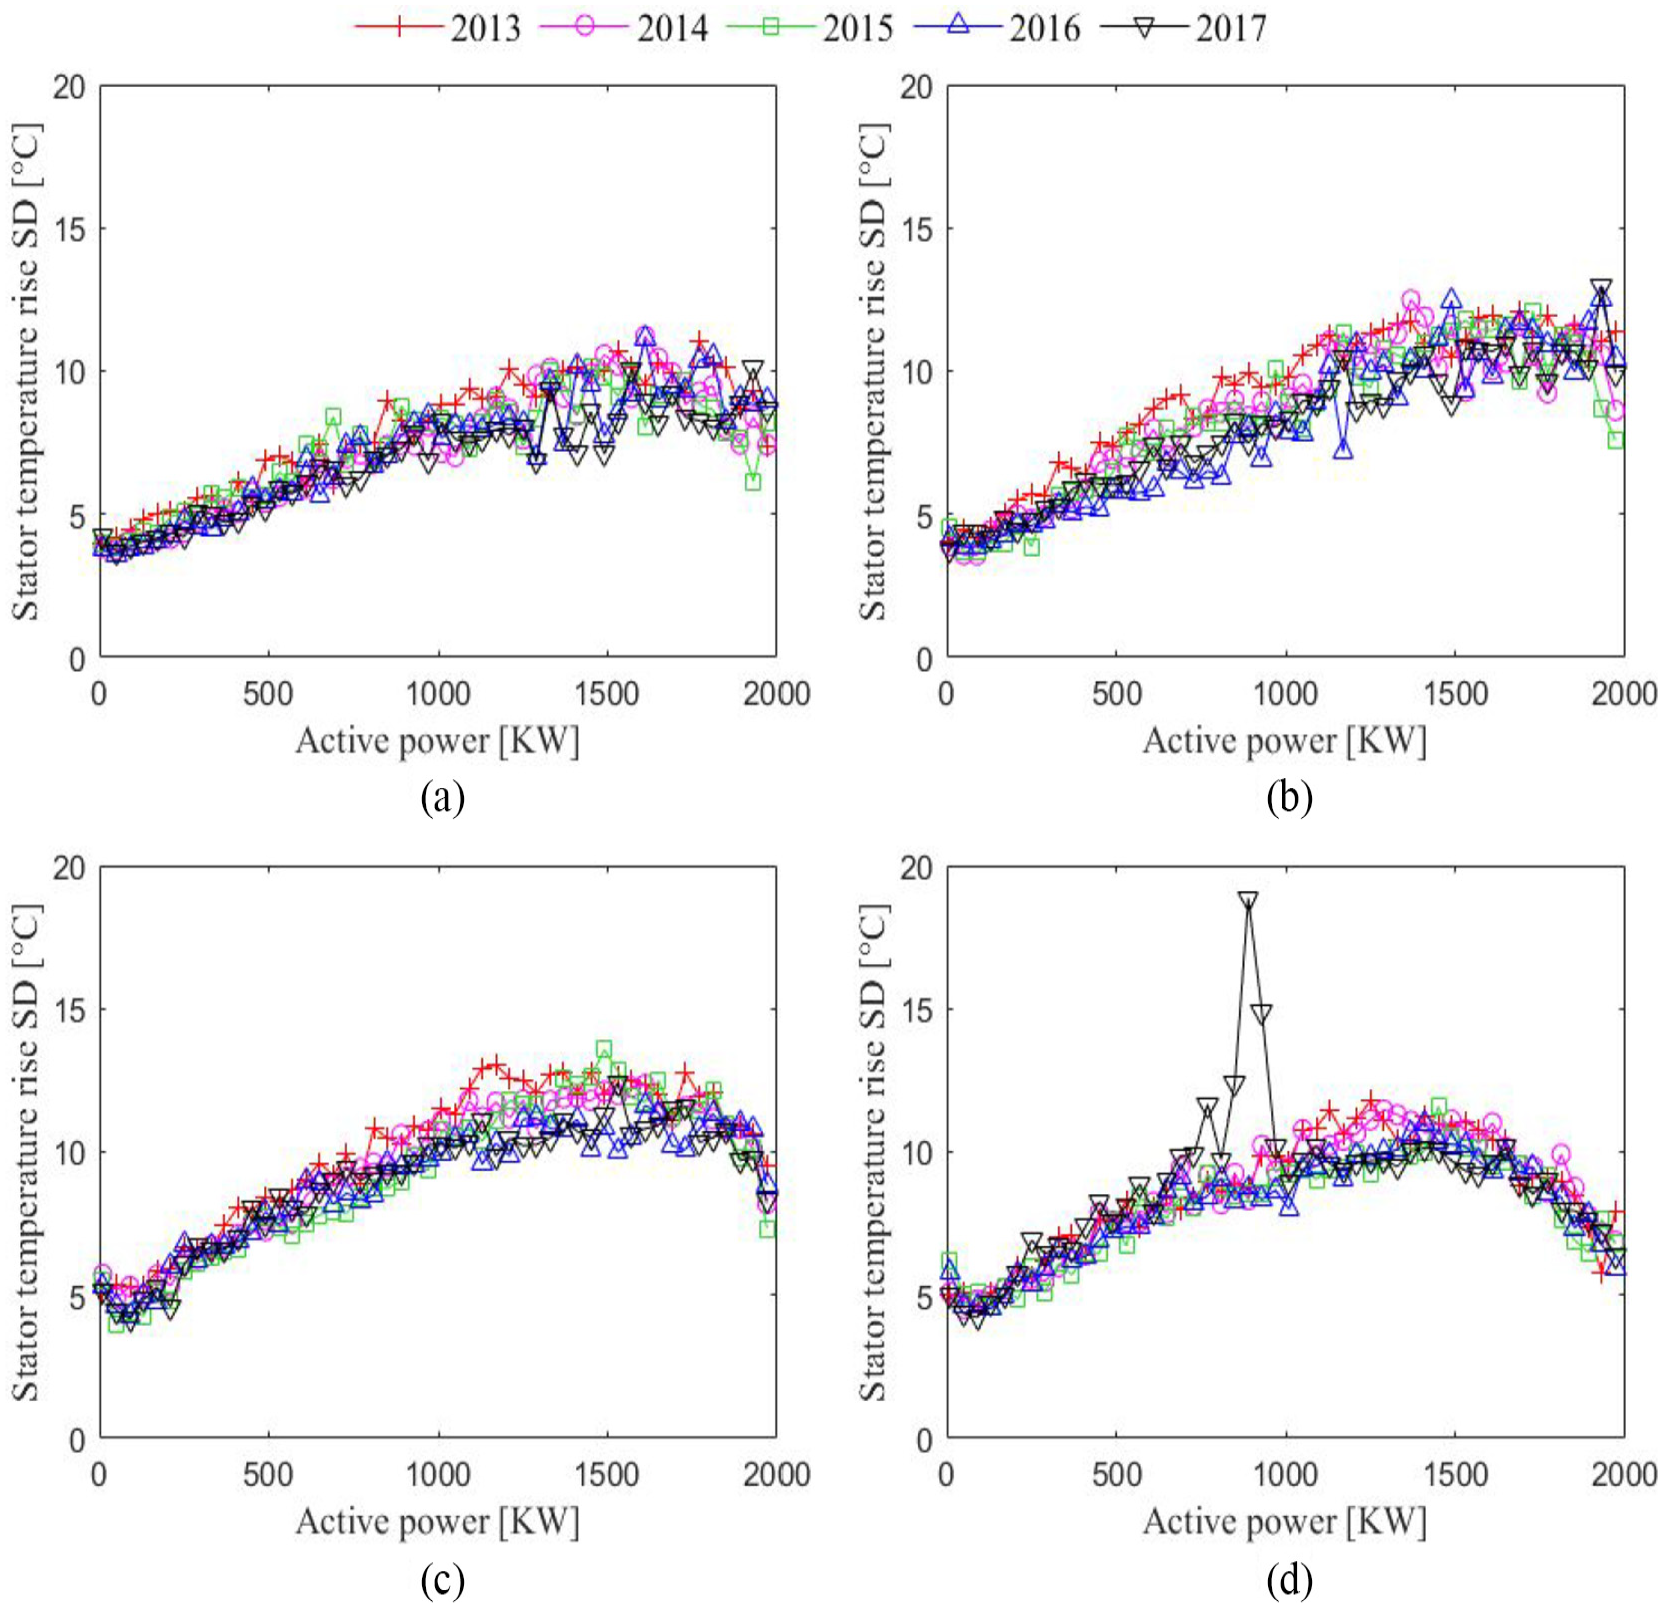
Relation between the SD of the stator temperature rise and the active power: (a) WT #1, (b) WT #5, (c) WT #15, and (d) WT #24.
The results of the analysis of hub temperature rise, hub cabinet temperature rise, nacelle temperature rise, and nacelle cabinet temperature rise are shown in Figures 8 to 15. When the active power increases, the temperature rise of the hub and the hub cabinet hardly changes, but the temperature rise of the nacelle and nacelle cabinet slightly increases. The SD of the temperature rise of these four signals all decreases slowly when the active power increases. The two kinds of curves of all WTs, one for the hub and hub cabinet and one for the nacelle and nacelle cabinet, are very similar.
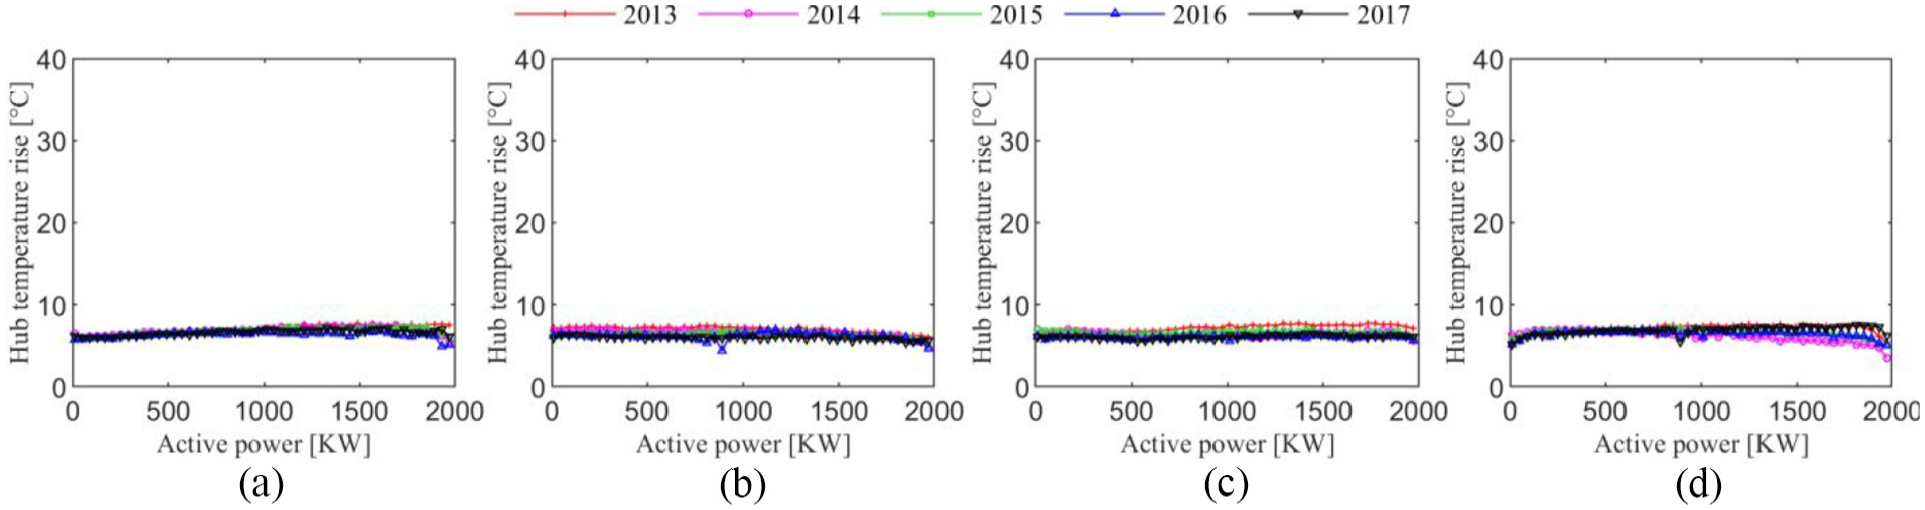
Relation between the rise of the hub temperature and the active power: (a) WT #1, (b) WT #5, (c) WT #15, and (d) WT #24.
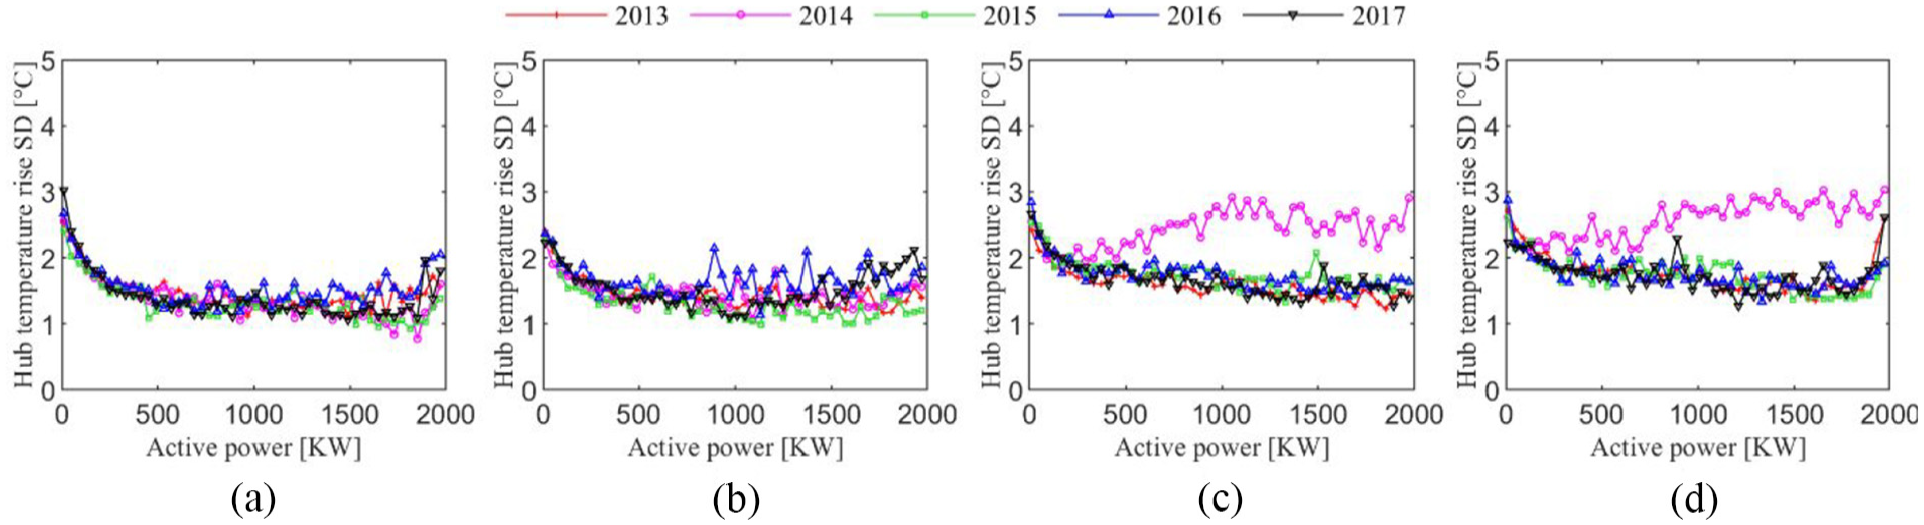
Relation between the SD of the hub temperature rise and the active power: (a) WT #1, (b) WT #5, (c) WT #15, and (d) WT #24.
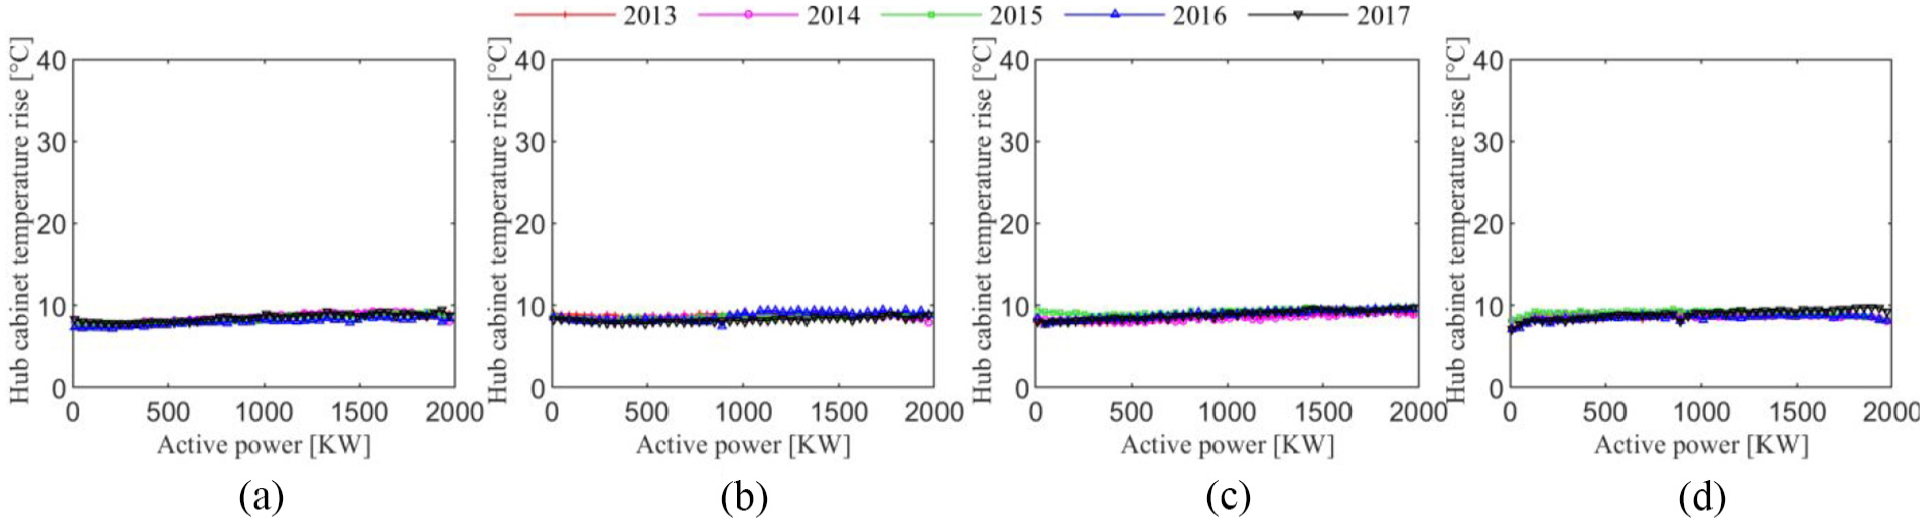
Relation between the rise of the hub cabinet temperature and the active power: (a) WT #1, (b) WT #5, (c) WT #15, and (d) WT #24.
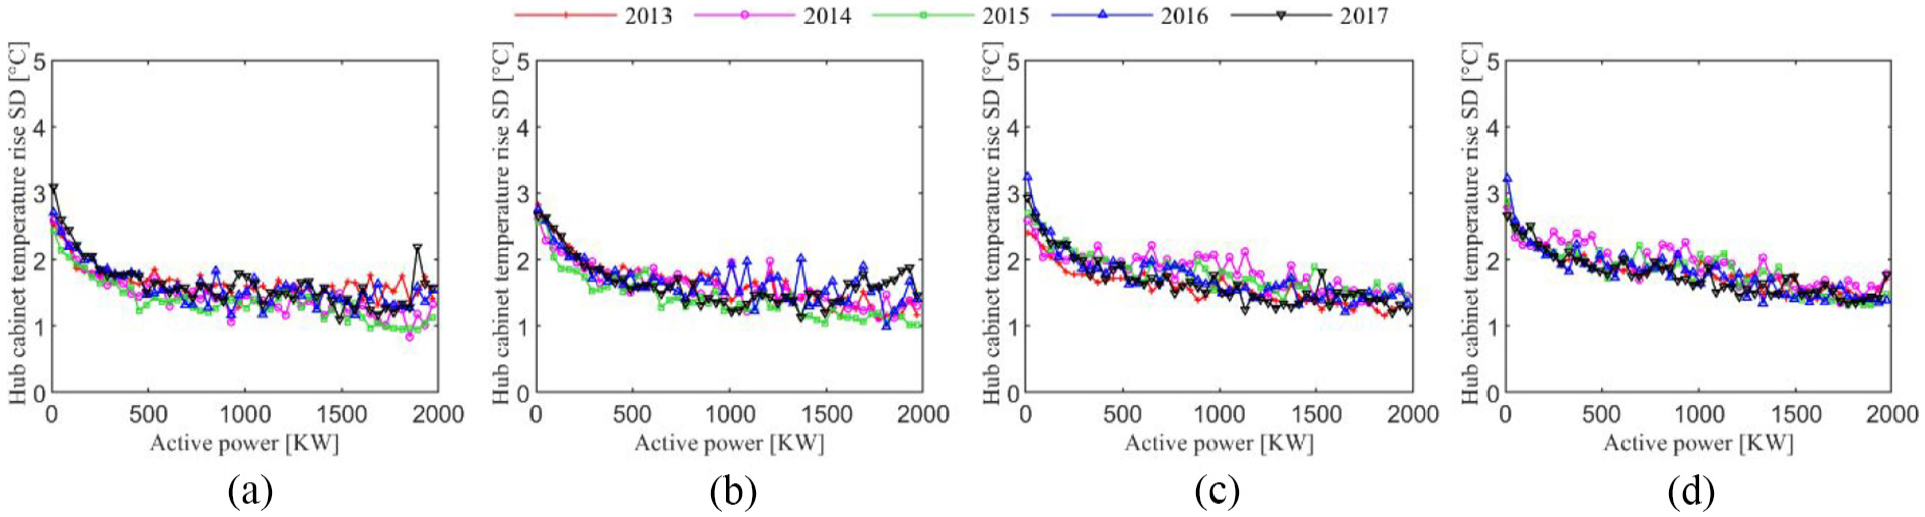
Relation between the SD of the hub cabinet temperature rise and the active power: (a) WT #1, (b) WT #5, (c) WT #15, and (d) WT #24.
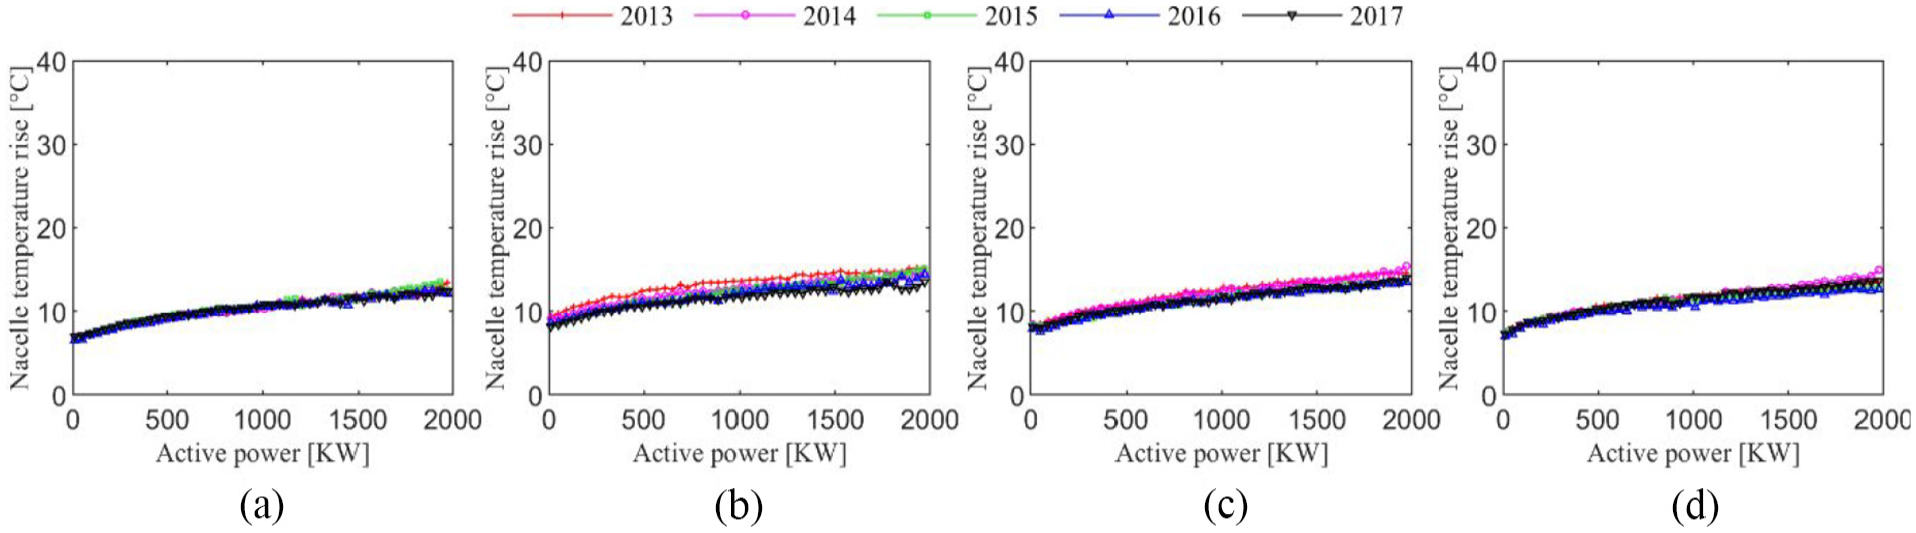
Relation between the rise of the nacelle temperature and the active power: (a) WT #1, (b) WT #5, (c) WT #15, and (d) WT #24.
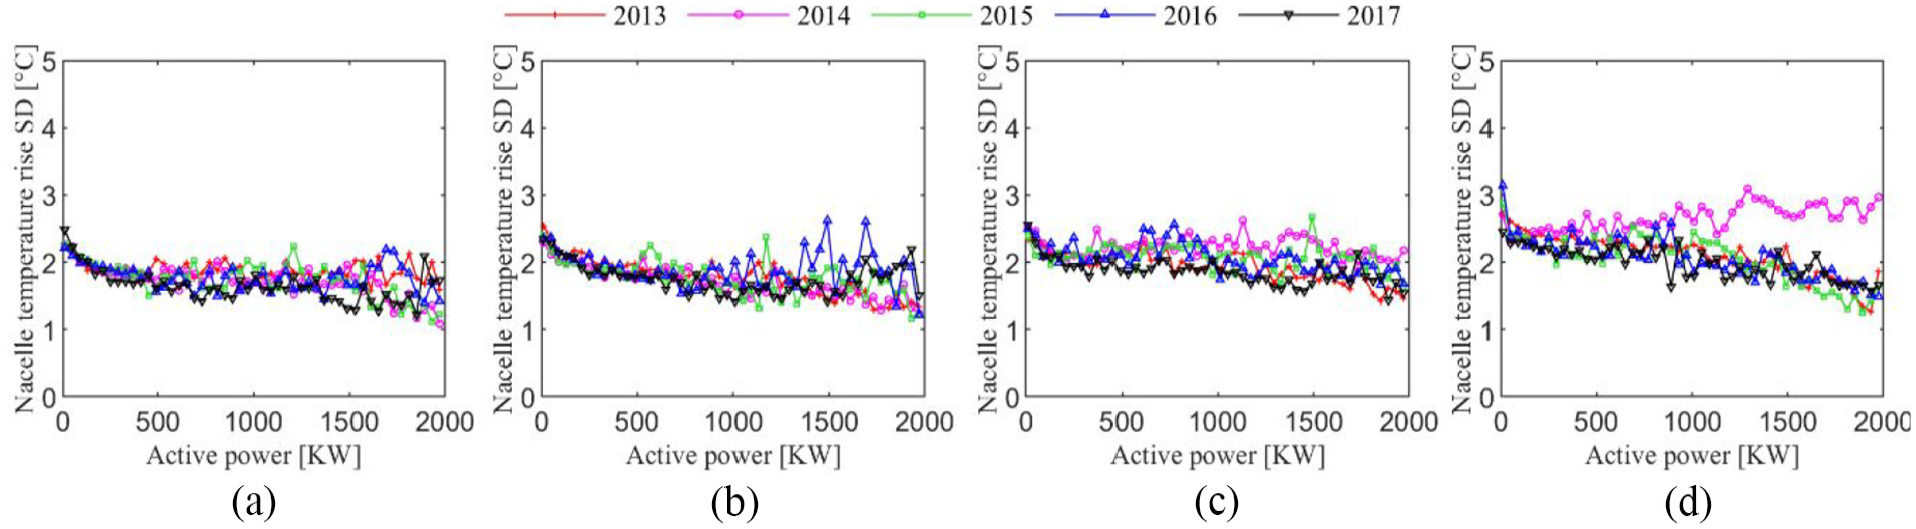
Relation between the SD of the nacelle temperature rise and the active power: (a) WT #1, (b) WT #5, (c) WT #15, and (d) WT #24.
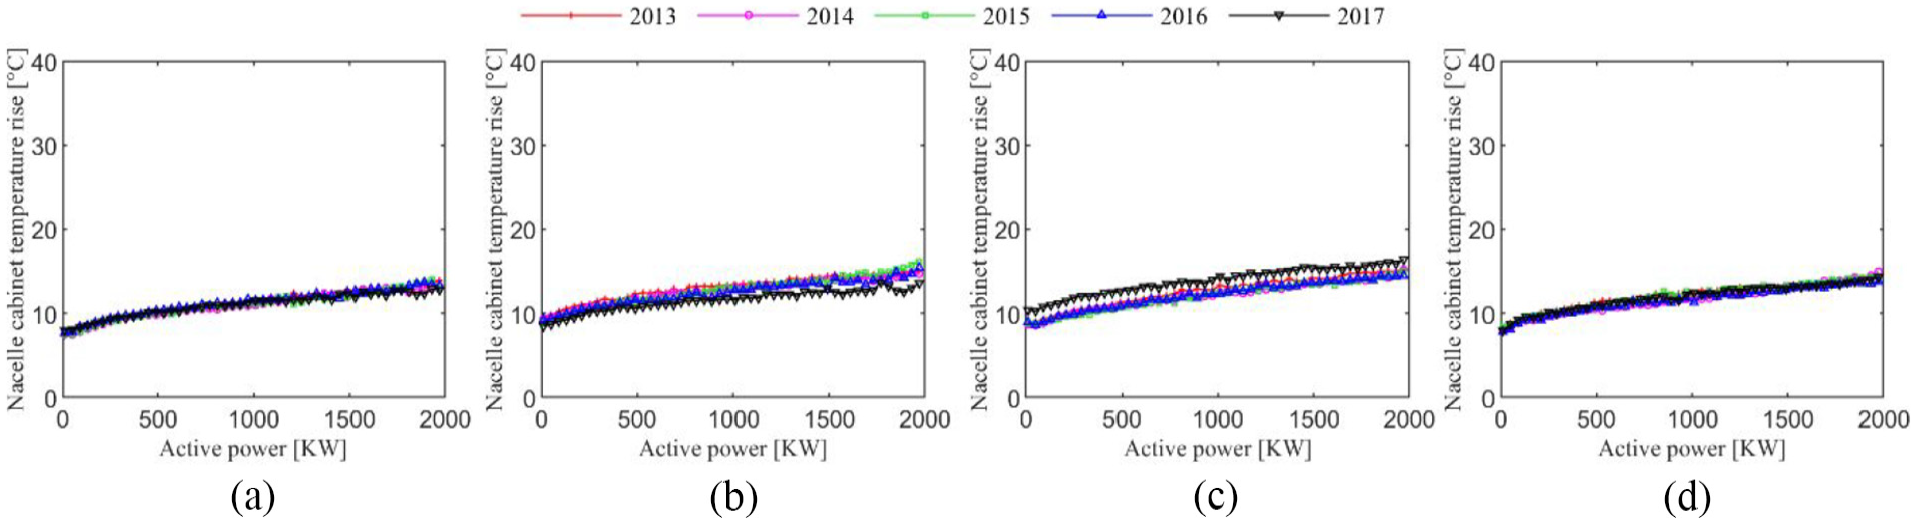
Relation between the rise of nacelle cabinet temperature and the active power: (a) WT #1, (b) WT #5, (c) WT #15, and (d) WT #24.
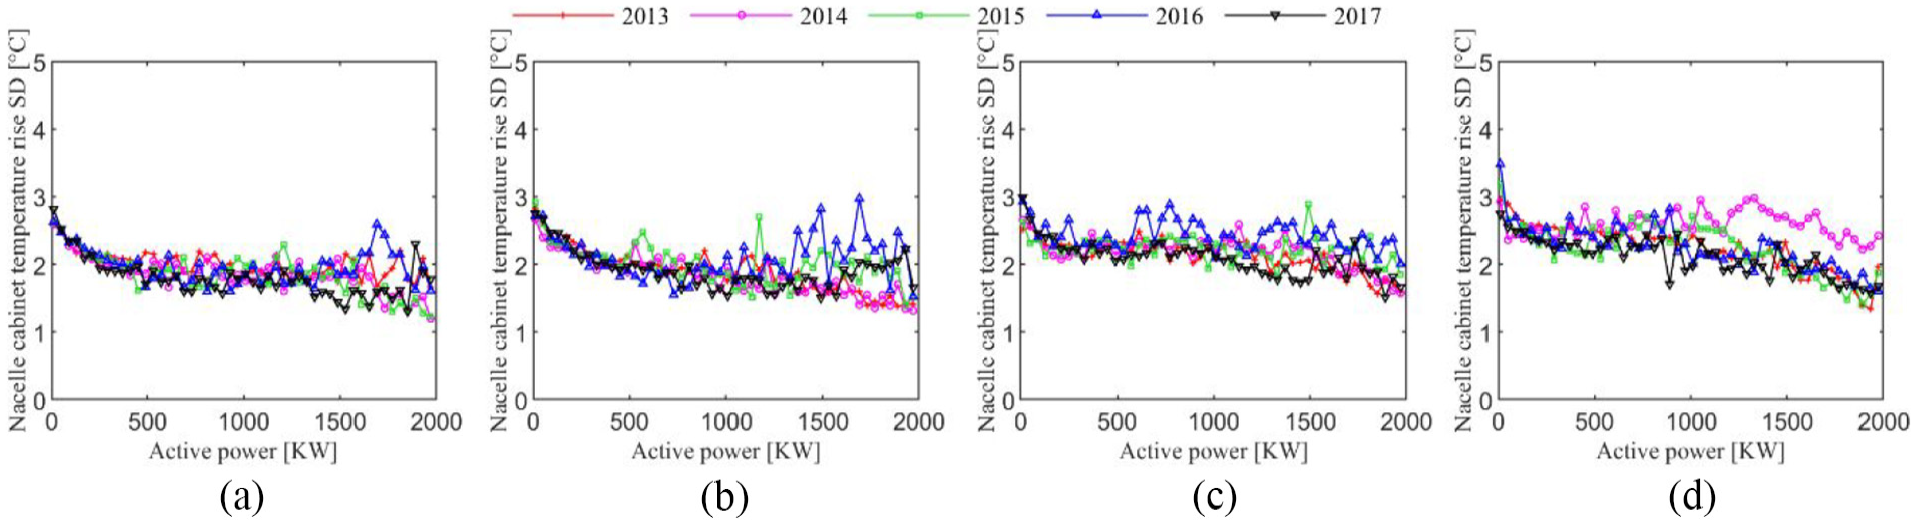
Relation between the SD of the nacelle cabinet temperature rise and the active power: (a) WT #1, (b) WT #5, (c) WT #15, and (d) WT #24.
Similar to the patterns of the main bearing temperature rise, anomalies can be observed in the SD of the hub and nacelle temperature rise for WTs #15 and 24 in 2014, that is, they are significantly higher than in other years. This phenomenon indicates that, due to the strong coupling effect of the WT multi-physical field, there is a strong correlation among these temperature parameters, and the temperature signals from several different parts of the WT are simultaneously reflective of the change in the WT condition.
Discussion
The results of the analysis of the relationship between the main temperature signals and the active power for five consecutive years of stable service of the four WTs was presented in Part 4 of this paper. Although long-term monitoring data from the actual wind farm is too complex to provide a reasonable explanation of all the trends, much information is gleaned from the available analyses to help develop condition monitoring and O&M techniques for large WTs, followed by a discussion from different perspectives.
Change patterns
The analysis in Part 4 reveals the change patterns of the main temperature signals in the real wind farm, helping to deepen the understanding of the internal condition of the genset and to develop practical methods for condition monitoring. The change patterns where the key temperature signals vary with the active power are summarized as shown in Table 2. The active power has a significant effect on both analytical indicators, the main bearing temperature rise and the generator stator temperature rise. It should be noted that when the active power is low (below 500 kW), the main bearing temperature rises faster as the active power increases; and when the output power is high (above 1500 kW), the generator stator temperature rises faster as the active power increases. For the optimization of the O&M strategy of WTs, the above conclusion calls for more attention to be paid to the active power range within which the temperature rises faster at these two locations.
Change patterns where the key temperature signals vary with the active power.
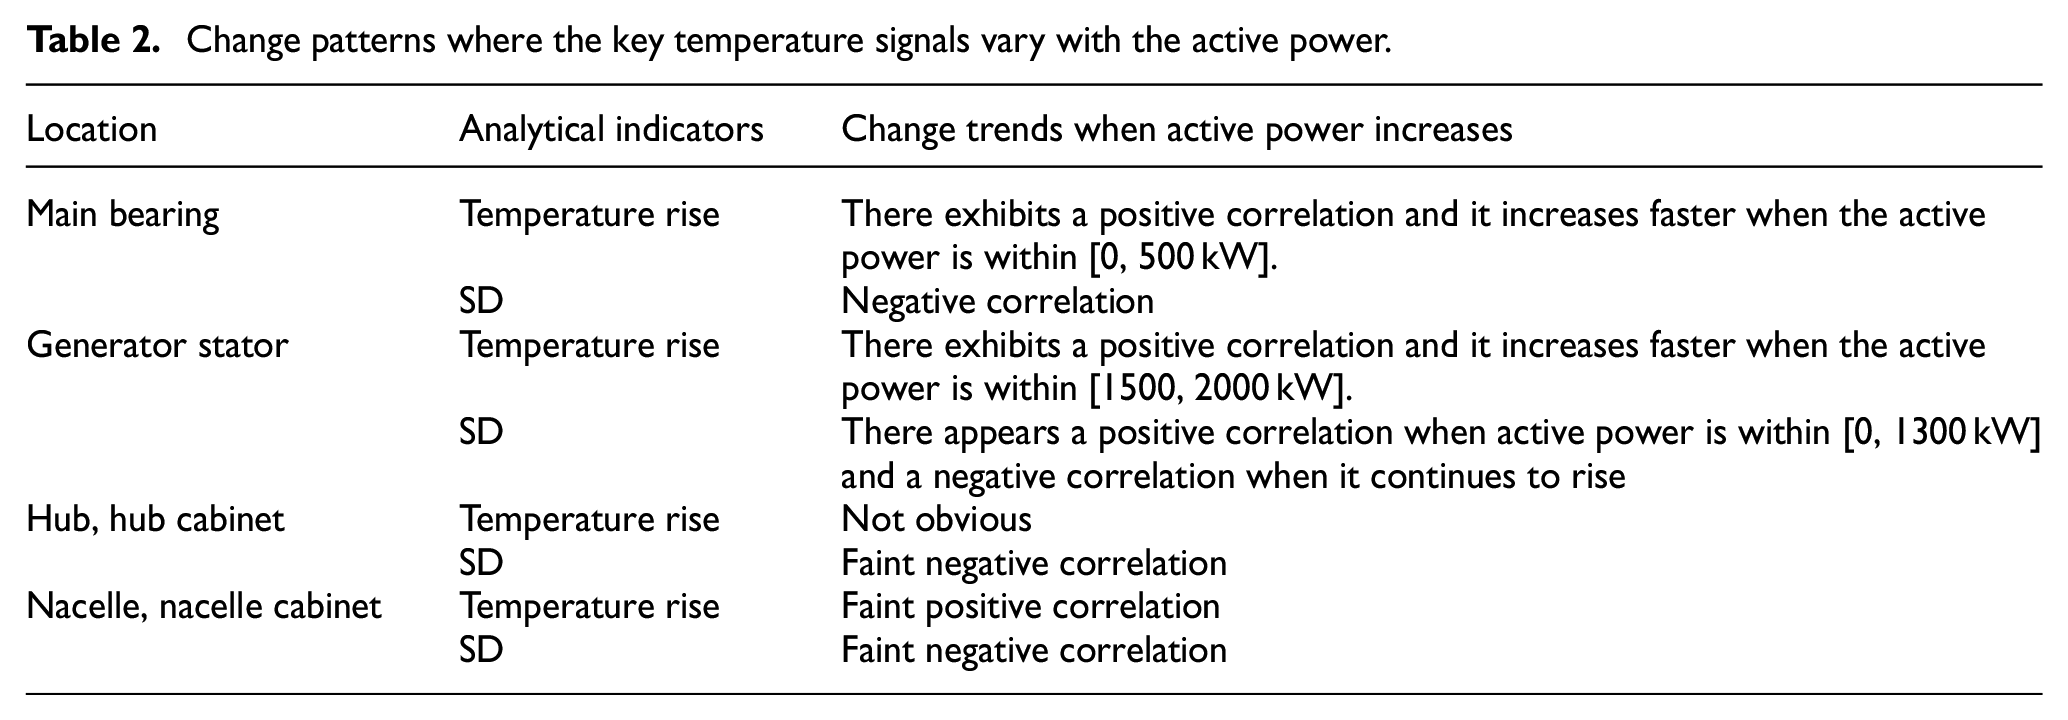
When the active power increases, the SD of the main bearing temperature rise gradually decreases. The variation pattern of the SD of the temperature rise of the generator stator is more complicated. There appears to be a positive correlation when the active power is between 0 and 1300 kW and a negative correlation when it continues to rise. The lower temperature rise SD means that the temperature rise of this location within the same active power intervals (bins) shows a relatively larger difference at different times, and the influencing factors other than the output power have a relatively greater impact on the temperature rise.
Active power has an extremely weak impact on the temperature rise of the hub and hub cabinet, and the temperature rise of the nacelle and nacelle cabinet, albeit to a slightly stronger extent, which is attributable to the fact that the main internal source of heat for the two assemblies, the hub and the nacelle, is the electrical control system and the heat generation is less related to the active power.
Correlation of signals at different locations
The correlations of the internal temperature signals of the three main assemblies, the generator, the hub, and the nacelle, are shown in Table 3. The data in Part 4 show that the temperature signals collected from the hub and hub cabinet, as well as the nacelle and nacelle cabinet, of the same WT are extremely similar regardless of which perspective they are analyzed from. The gradients of the temperature field inside the hub and inside the nacelle are gentle and the existing temperature measuring points in the SCADA system are well arranged to monitor the temperature status of these two assemblies. The situation inside the generator is different; there is a clear difference in the temperature signal between the main bearing and the generator stator locations (especially under operating mode), indicating large gradients in the temperature field inside the generator. Temperature conditions in some other important locations of the generator (e.g. air gap, rotor) are not reliably monitored. The existing measuring points fail to give readings for a complete grasp of the internal temperature of the generator.
Correlation of internal temperature signals of main assemblies.
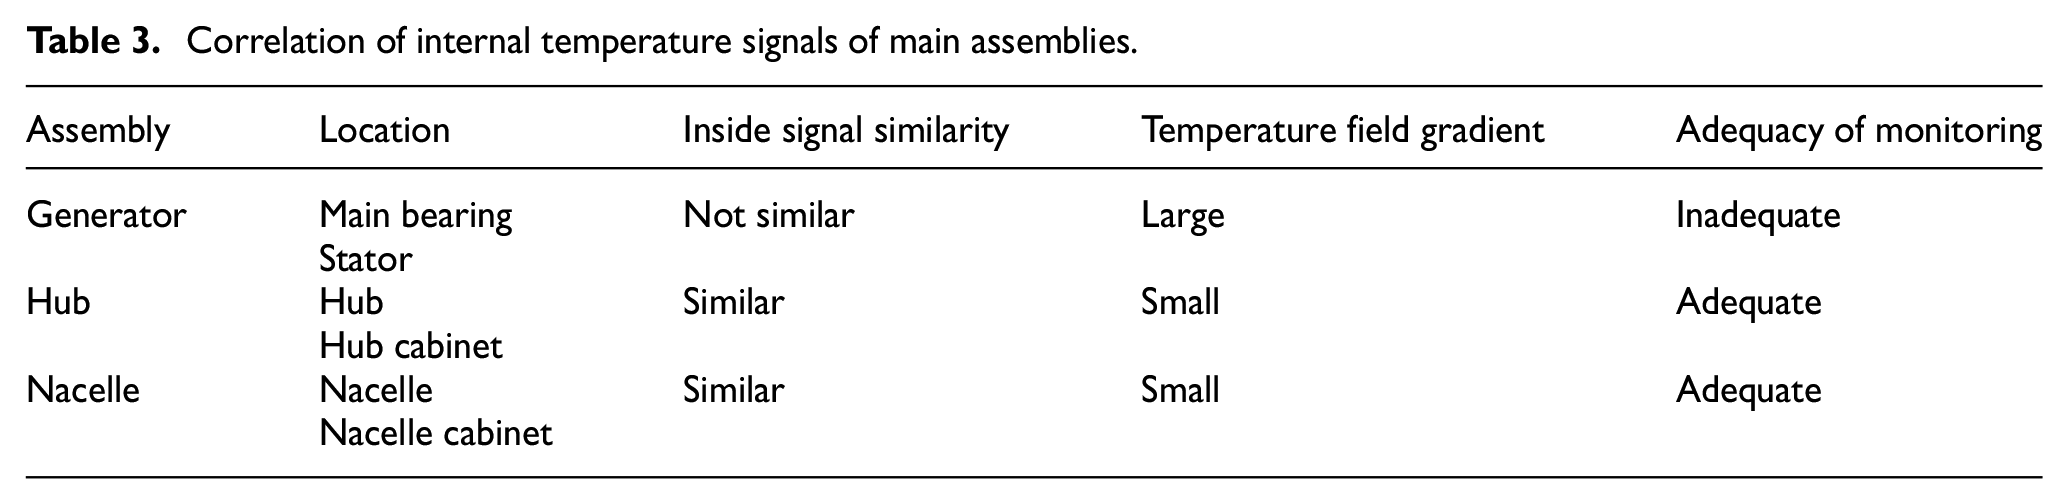
Although the nacelle and the hub are quite far apart, the characteristics of the temperature signal taken from the two assemblies are similar, showing that they have similar internal thermal states. By directly looking at the temperature rise value and SD, one will see that the temperature signal inside the generator differs a lot from the temperature signal taken from the nacelle and hub. However, it can be noted in Part 4 that the main bearings of WTs #15 and 24 in 2014 had such a high temperature rise at some moments that the resulting SD curves of the main bearing temperature rises in these 2 years are higher than those in other years. Such an anomaly is also observable in the SD curves of the hub and nacelle temperature rise in the same year. This indicates that, due to the strong coupling of the WT multi-physical field, the temperature signal from the generator is also implicitly intrinsically correlated to the temperature signal collected from the hub and nacelle. In order to improve the effectiveness of CM systems in real wind farms in the future, the correlation of temperature signals at different locations can be used, based on data fusion theory, to further develop self-confirmation and self-calibration techniques for measuring point signals as well as integrated decision-making techniques for WT health conditions.
Year differences and individual differences
The same set of data curves for the same WT in different years roughly follow the same trend after anomalous data of individual years is excluded. None of the curves show any trend of variation correlated to length of service, suggesting that the normal aging of the WTs is not clearly reflected by temperature signals during the first 5 years of service. A model is expected to be valid for use for 5 years or more if a temperature signal modeling approach is employed for CM.
The data of the same set of different WTs, after anomaly data of individual years is excluded, basically follow the same trend. Given a reasonable modeling approach and some adjustable model parameters, it is possible to establish a uniform temperature estimation-based CM model for the same type of WT operating in a similar environment.
The temperature rise curves for the main bearing difference between different years and different WTs is relatively significant in terms of fluctuation amplitude or range of values, followed by the temperature rise curves for the stator, indicating that the condition of these two positions is relatively unstable. In addition, the inter-annual difference in temperature rise curves is smaller than that in the case of SD curves, indicating that SD is a numerical feature that is more sensitive to condition than the average is.
Similar to the case where temperature signals are taken from different locations, the correlation among temperature signals of different years and of individual WTs is capable of being further exploited to develop self-confirmation and self-calibration techniques for measuring point signals as well as integrated decision-making techniques for WT health conditions.
Conclusions
The SCADA system is installed in most WTs in service, and as a result, a considerable amount of historical SCADA data is generated as more and more WTs serve for many years. These historical data contain a great deal of useful information related to the characteristics of WT. The potential is there to use these data to improve the technology of WT, CM, and O&M strategies by mining the historical SCADA data for WTs.
Temperature is one of the basic parameters logged in the SCADA system and is closely related to the condition of the WT. In this study, the relationship between all main temperature variables and active power obtained from four WTs in a mountain wind farm over 5 years is analyzed and discussed using an extended version of the bins method. The main conclusions and contributions that can guide engineering practices are as follows. (1) This article reveals the change patterns of the main temperature signals in the real wind farm, helping to deepen the understanding of the internal condition of WTs. (2) The gradients of the temperature field inside the generator is too steep for the existing measuring point to fully reflect the internal temperature of the generator, and because of which, it is necessary to develop techniques of direct monitoring of rotor temperature and more reliable monitoring techniques of air gap temperature, and further add temperature measuring points to the generator. On the other hand, the temperature condition obtained at the temperature measuring points in other parts of the WT is comprehensive enough to save additional measuring points. (3) The aging of the WTs is not reflected by the temperature signals during the first 5 years of service. A model is expected to be valid for use for 5 years or more if some temperature signal modeling approach is employed for condition monitoring. (4) There is a close correlation among different temperature measuring points of the same WT, among different years at the same measuring point, and among different individual WTs at the same location, and these correlations can be further exploited to develop self-confirmation and self-calibration techniques for measuring point signals, as well as integrated decision-making techniques for WT health conditions.
In the next step, some of the findings of this study will be applied to develop a practical method of long-term condition monitoring for WT clusters, and to optimize the control and O&M strategy of WTs based on more analyses.
Footnotes
Declaration of conflicting interests
The author(s) declared no potential conflicts of interest with respect to the research, authorship, and/or publication of this article.
Funding
The author(s) disclosed receipt of the following financial support for the research, authorship, and/or publication of this article: This research was funded by the National Natural Science Foundation of China (grant number 51875199), the National Key Research and Development Program of China (grant number 2016YFF0203400), and the Program of Key Technologies R&D and Major Technological Achievements in the Transformation of the Strategic Emerging Industry of Hunan Province (grant number 2018GK4024).