
Abstract
This paper presents a performance analysis of predictive models for the generator module which can be used as a reference for improvement in the condition monitoring system using wind turbines in a wind farm in Taiwan. With the generator being a critical component prone to failures, it is important to perform data analysis on its parameters that could be used for condition monitoring. The main innovative feature in this framework is the conduct of performance analysis before the development of the condition monitoring system. Also, the consistency of the performance between the different wind turbines in the wind farm is evaluated. The predictive models are generated using the neural network algorithm with a different combination of parameters from the SCADA system. The correlation of the parameters as well as the mean square error of the predictive models were then computed for analysis. Results showed that pairing of input parameters with a higher correlation to the output parameter would give better performance for the predictive model. Furthermore, the performance of the different models was consistent throughout the different wind turbines in the wind farm which indicates that the same model can be developed and used for wind turbines belonging to the same wind farm. Employing a preliminary performance analysis of different combinations of component parameters could help in optimizing predictive models for condition monitoring.
Keywords
Introduction
Wind energy is the energy generated from the movement of the wind. The wind turbine converts the kinetic energy from the wind to mechanical energy then to electrical energy. Through the mechanism of the different components of the wind turbine, it can harness wind power from the motion of the wind. 1 Direct drive wind turbine assembly removes the gearbox configuration that connects the rotor to the generator. This means that for direct-drive wind turbines, the speed of the generator is the same as the speed of the rotor. 2 The main difference for the direct drive assembly compared with the gearbox configuration is the design of the generator.
The generator is an integral part of the wind turbine which converts the mechanical energy to more usable electrical energy. For direct drive assemblies, the most common type of generator used is the permanent magnet synchronous type. 3 Furthermore, to compensate for the required high torque, direct drive assembly generators have a significantly larger diameter. This design is fit for an application where electrical energy is being produced at significantly lower rotary speed. Eliminating the gearbox configuration for the turbine, the generator then becomes the most frequent cause of faults for direct drive assemblies. Possible causes of these failures are generator over-speeding and overheating of both generator stator and the main bearing. Condition monitoring greatly improves the reliability of wind turbines by preventing downtimes to happen. This monitoring involves checking components to determine and prevent possible resulting failures. 4
The use of SCADA data in condition monitoring is now an emerging method that could give quite an advantage compared to other methods. The SCADA system or the supervisory control and data acquisition system gives an isolated control of the wind turbines helping minimize the time delay for operators to operate the turbines. Furthermore, the SCADA system also holds data from important parameters involved in the wind turbine operation. Figure 1 shows different modules of a wind turbine and their corresponding SCADA parameters. Using these data that are readily accessible in condition monitoring is quite advantageous.
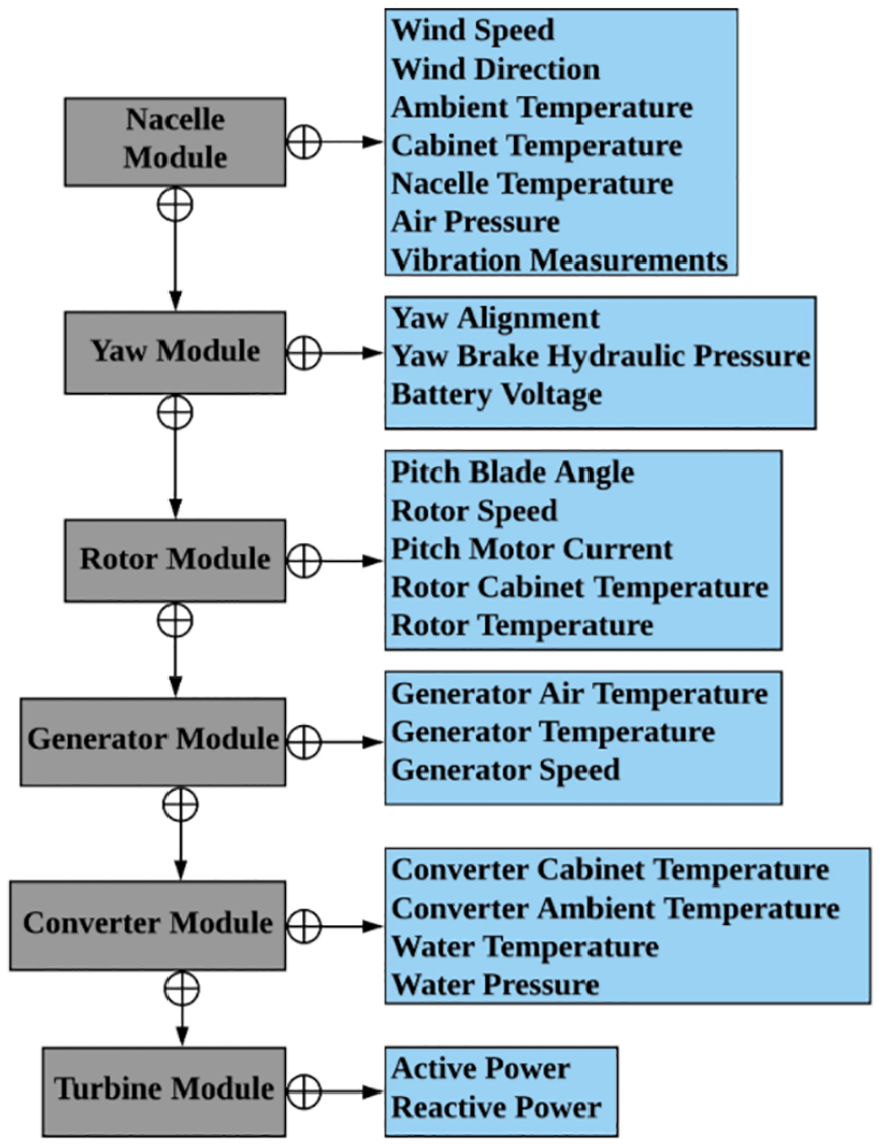
Wind turbine modules with corresponding SCADA parameters.
The main innovation employed in this research is the conduct of a preliminary performance analysis before the development of the condition monitoring system. Analyzing the predictive model’s performance in a wind farm scale is also an innovation presented in this study.
The purpose of this study is to analyze the performance of the predictive models generated from the different input-output combinations from the generator module of the SCADA system. The researchers also aim to compare the performances of the wind turbines in a wind farm in Taiwan. The main contribution of this study is to serve as reference to further improve the performance of future condition monitoring systems based on predictive models from SCADA data. By initiating a performance analysis on the pre-development stage of the predictive models, improvements can be done in the future. This research focuses on the generator module of a direct drive wind turbine farm.
Literature review
There has been a lot of research regarding wind turbines suggesting that there has been a significant increase in reliability requirements for wind turbines. In Hoxha et al., 5 the author used available SCADA data for condition monitoring of wind turbine components. The classification method used here is found to be effective in detecting anomalies in wind turbines. Another research involving SCADA data is that of Schlechtingen et al. 6 which uses the Adaptive Neuro-Fuzzy Interference System for the analysis. This showed a novel design of analysis using SCADA data. In Wang et al., 7 the use of the temperature parameter from the SCADA was emphasized by the author resulting in a condition monitoring using health index. These health indexes can effectively reflect early problems in wind turbines. The use of SCADA data in condition monitoring in Helsen et al. 8 shows that failure indication increases as the failure progresses. A similar conditioning method is also used in Roy 9 but this time focused on the power curve as the core parameter in the predictive models using SCADA data.
A review paper on condition monitoring system was developed in Tautz-Weinert and Watson 10 where SCADA data was used. This paper focuses on methods that proved their ability in detecting turbine anomalies. Furthermore, another review paper in Tchakoua et al. 11 showed that neural networks and fuzzy logic are some of the usually used tools in SCADA data analysis. Another method proposed in Wang et al. 12 is focused on the use of artificial intelligence in creating predictive models for fault diagnosis and prognostics. This method uses data from the SCADA in generating predictive models. A more specific method using a neural network is used in Strączkiewicz and Barszcz 13 in detecting damage for a gearbox of a wind turbine. Using SCADA data from parameters for a gearbox, predictive models are generated and used for fault detection. On the other hand, for Zhao et al., 14 the generator component of the turbine was the focus in the condition monitoring using SCADA data.
All these are methods using SCADA data in condition monitoring of wind turbines. The issue that is most common in these studies involves the standardization of parameters that can be used in the predictive model training and generation. In Sakib and Wuest, 15 it is emphasized that for the future, condition monitoring using SCADA data should set standard methods in optimizing the parameters to be used in the system. This study aims to help in the standardization method by developing a performance analysis of different predictive models generated from different SCADA parameters of the generator of a direct drive wind turbine.
Theories on neural network
A neural network algorithm is a good fit for the generation of predictive models because of its ability to generalize the non-linearity nature of data parameters. According to Fausett, 16 the artificial neural network has been developed to perform the generalization of mathematical models similar to or comparable to human cognition or neural biology with some assumptions.
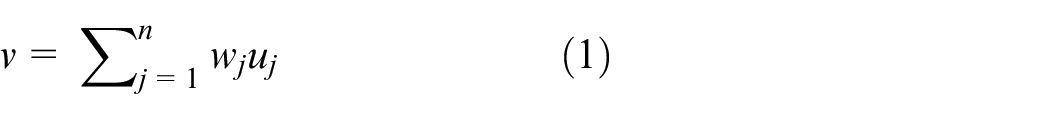
A neuron is considered the fundamental building block of a neural network. It functions by generating a corresponding output for a given set of input variables. As shown in Figure 2, the weighted sums of the inputs and the corresponding bias are processed through the activation function generating the output.
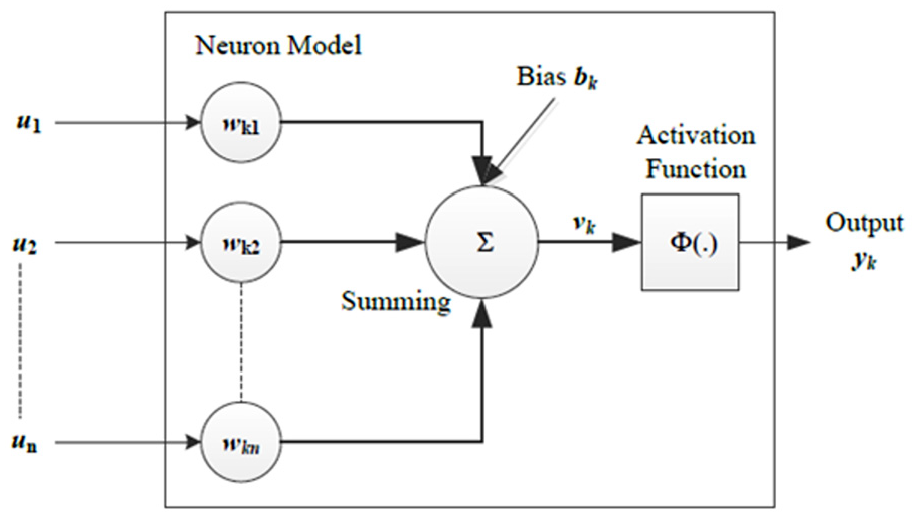
Model of a typical neuron – adapted from Haykin. 17
The input variables

The activation function which defines the output of the neuron can be classified into two types. The threshold function can have an output of either 1 or 0 depending on the inputs given. This is shown in Figure 3 and represented mathematically by equation (3).
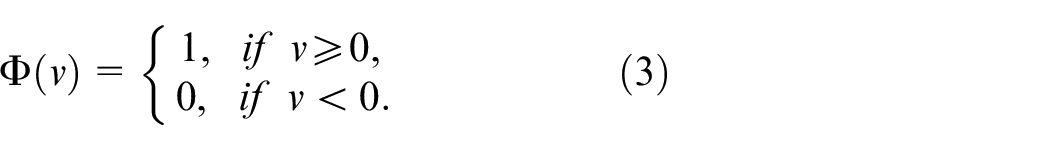
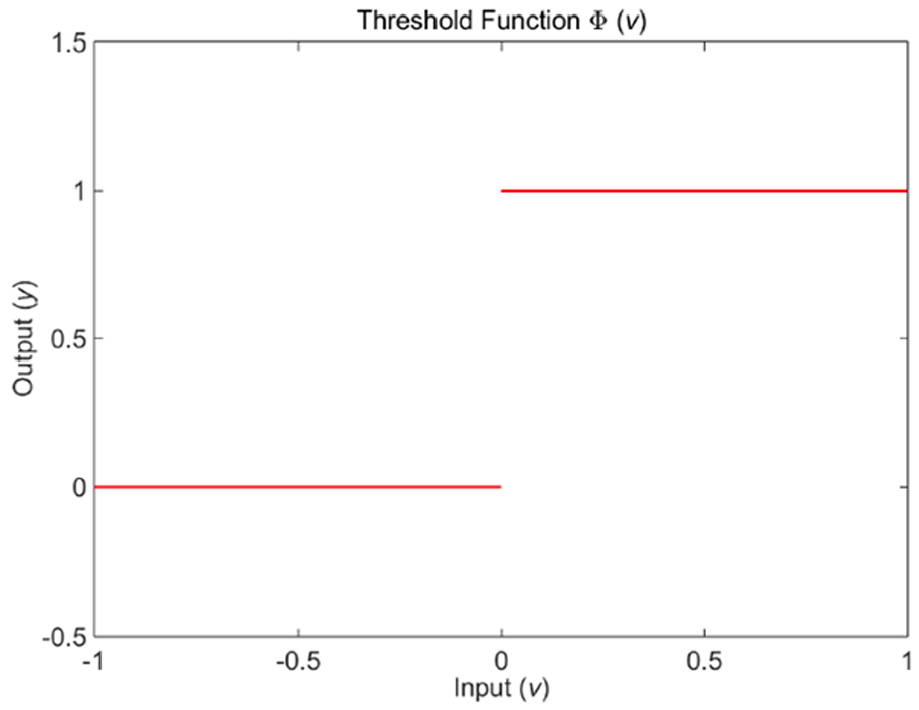
Threshold type of activation function – adapted from Haykin. 17
On the other hand, the sigmoid function is a non-linear activation function commonly used in applications where nonlinearity is a requirement. This function is shown in Figure 4 and is represented mathematically by equation (4).
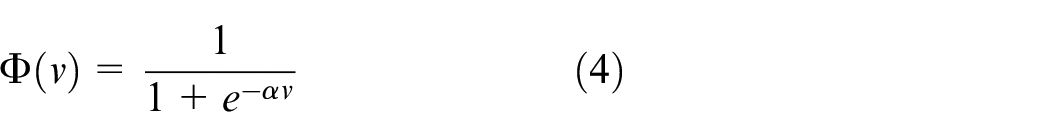
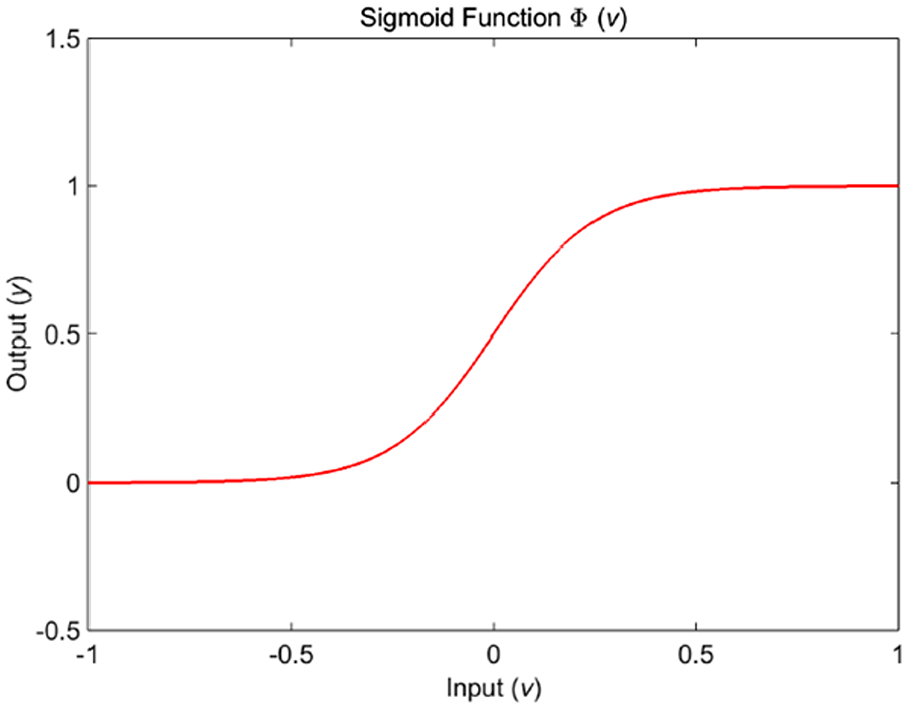
Sigmoid type of activation function – adapted from Haykin. 17
The neural network architecture consists of information about the number of neurons in the layers as well as the interconnections between them. One neural network architecture commonly used is the recurrent neural network which is distinguished by its feature of at least one feedback loop. Figure 5 shows the looping structure in this neural network architecture.
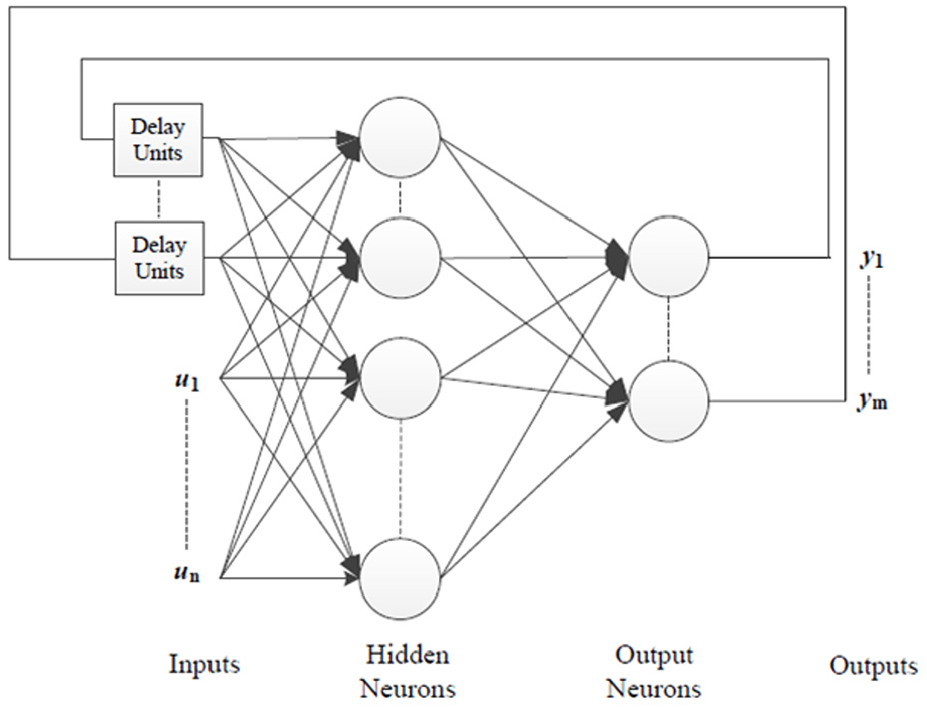
Multilayer recurrent network structure – adapted from Haykin. 17
Using the recurrent nature of the neural network algorithm, data analysis in the input, and the output layer composition is important in improving the performance of the models.
Performance evaluation metrics
The mean square error is the most common performance function that could be used for predictive models generated using neural networks. 18 This is applicable for such models to determine how disperse the data values are which implicates the performance of the models. It can be calculated by getting the average of the squared differences between the predicted and actual values. Equation (5) can be used to calculate the MSE of the predictive models.
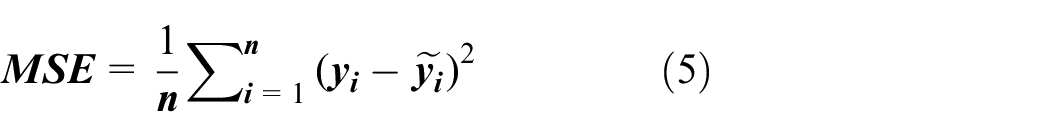
where
Linear correlation is one method to analyze the relation between variables of interest. It is considered to be the normalized covariance which is commonly used as an indicator in parameter relation assessment. Equation (6) can be used to calculate the value of correlation coefficient r.
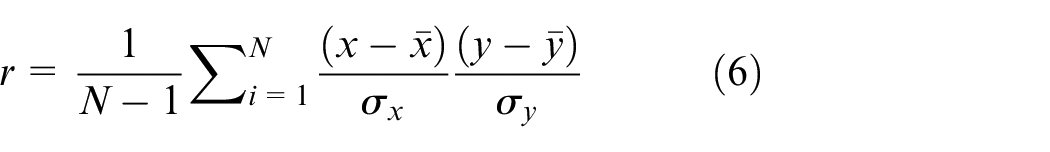
where N represents the total number of elements,
Research methodology
The research framework suggested to be used for condition monitoring using SCADA data is presented in Figure 6. The framework is designed to be able to measure parameters that are an important consideration for predictive model condition monitoring. This could serve as a standard framework for developing condition monitoring systems using SCADA data.
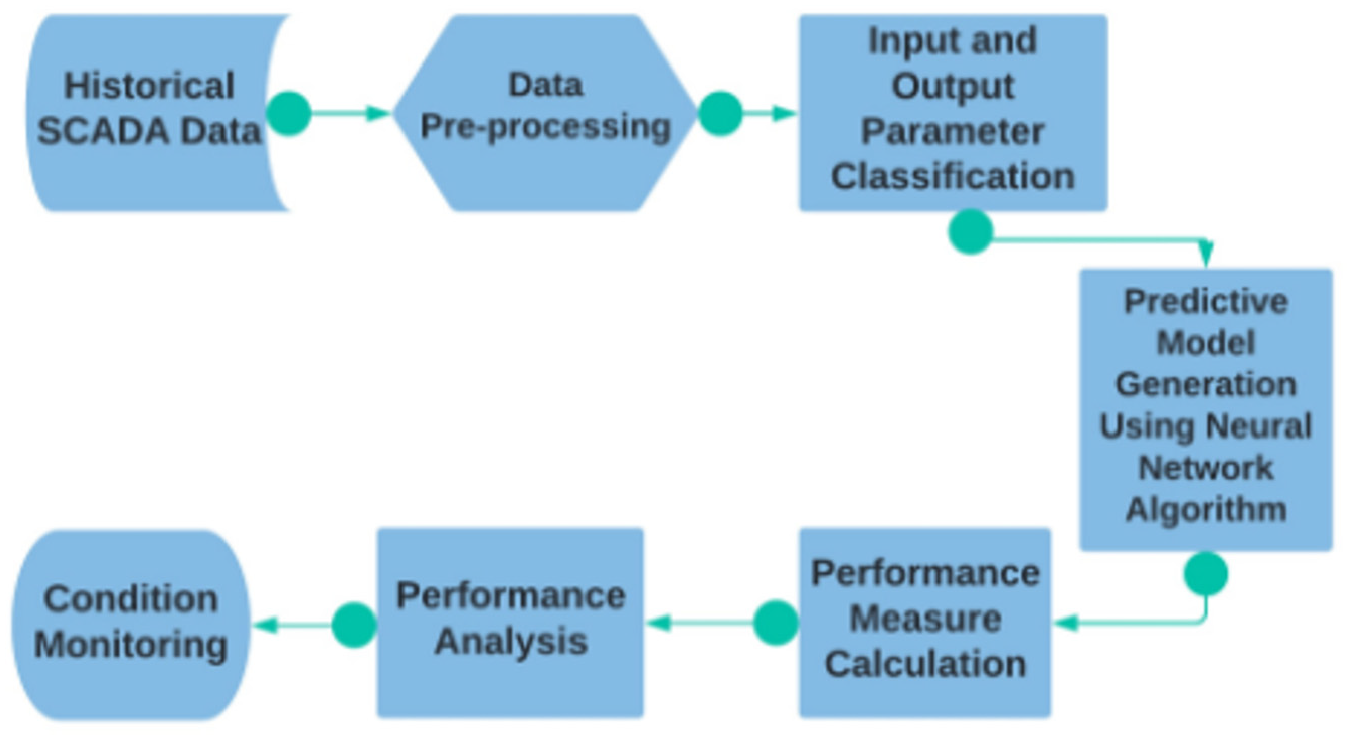
Research framework suggested for use in SCADA data condition monitoring.
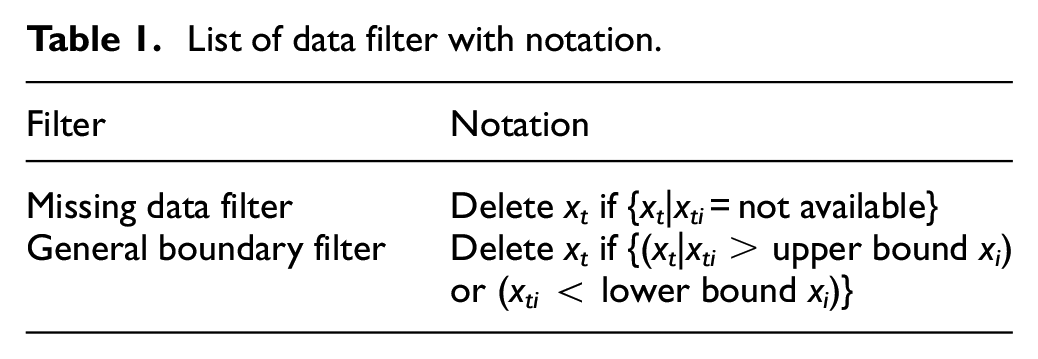
The data to be used for this study includes the full data for the year 2019 of 14 direct drive wind turbines inside a wind farm. Before using the data for predictive model generation, data preprocessing is conducted to minimize the inclusion of abnormal data of the wind turbines. Table 1 shows the two filtering methods referenced from Mazidi et al. 19 done to the data for pre-processing which are the missing data filter and the general boundary filter.
List of data filter with notation.
The parameters to be used in a predictive model generation are those from the generator module including the active power. These include the air gap temperature, the bearing temperature, the stator temperature, and the generator speed. The temperature parameters refer to various locations within the generator module while the speed parameter refers to the rotation of the generator.
These parameters are considered vital to the operation of the generator and are the operational parameters that can be generated from the generator module. Thus, these parameters need to be considered in the condition monitoring of the generator component.
Using the availability of the SCADA parameters for the generator component, the following input and output combinations are made and are shown in Table 2. These combinations will be used in generating predictive models that will be used in the performance analysis. Since the common failures found in the generator are the generator over-speeding and the bearing and stator overheating, then three models are created namely generator speed model, stator temperature model, and bearing temperature model. Having five parameters available in the generator module, a total of 15 different combinations can be generated for each output model.
The three output models and list of corresponding input-output combination of parameters.
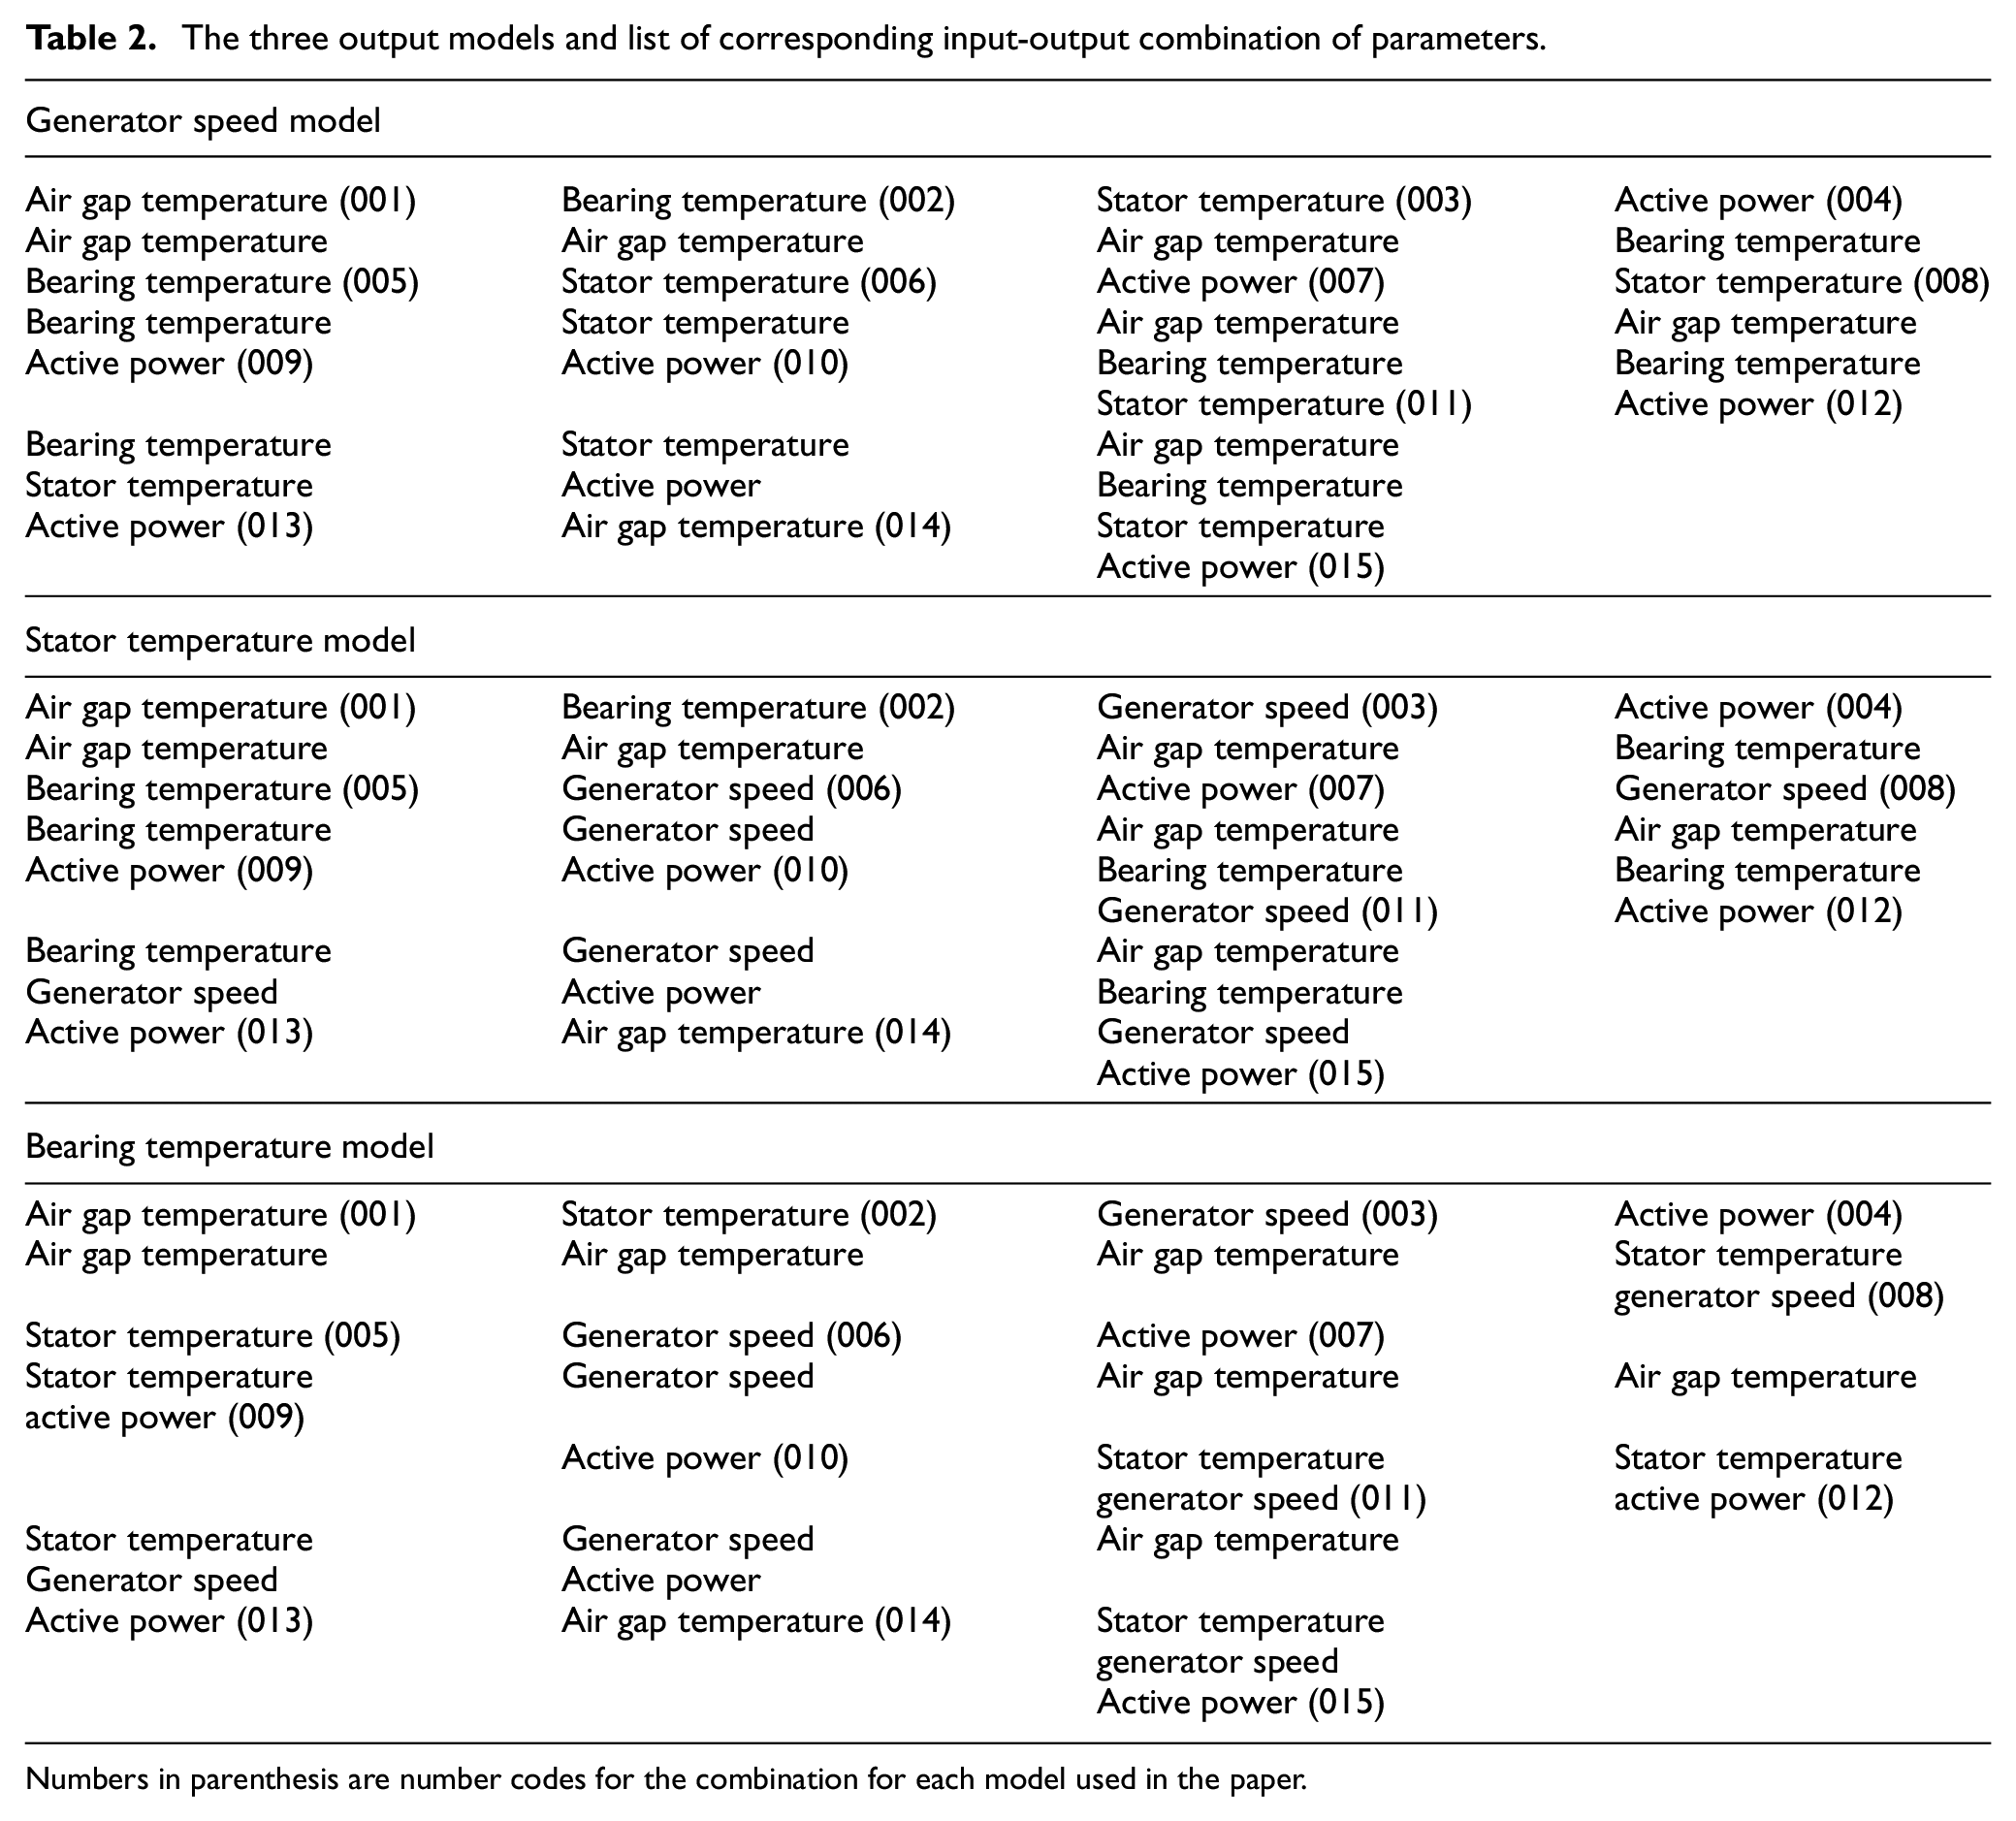
Numbers in parenthesis are number codes for the combination for each model used in the paper.
Using all the different combinations of the parameters for the generator component, a total of 45 predictive models are generated for each turbine. These predictive models are generated through the use of a neural network interface in the MATLAB computing program. To have a better comparison of the performance of the models, the same model architecture was used in the generation of the models. The type of neural network used is a NARX model with a sigmoid type of activation function. 20
The performance measure used for the predictive models is the mean square error (MSE). Using the MATLAB computing software, the MSE can be calculated for each model generated.
A comprehensive performance analysis was done to the different predictive models generated for the 14 wind turbines used in the study. Input parameters that can improve the performance of the models were noted for each of the three models. Furthermore, a comparison of the behavior of these performances was assessed for all the wind turbines.
The linear correlation coefficient of the input parameters was also calculated for each model to serve as the identifying measure for any improvement in the performance. The linear correlation coefficient was calculated through the use of the computing tool MATLAB and its function “fitlm.” The function is useful in creating a linear model for the two variables. From the linear models created, the correlation coefficient was then calculated. This value is used to compare and verify any improvement in the performance of the models with the corresponding input parameter.
Results and discussion
The analysis is divided according to the three output models for the generator component.
Generator speed model
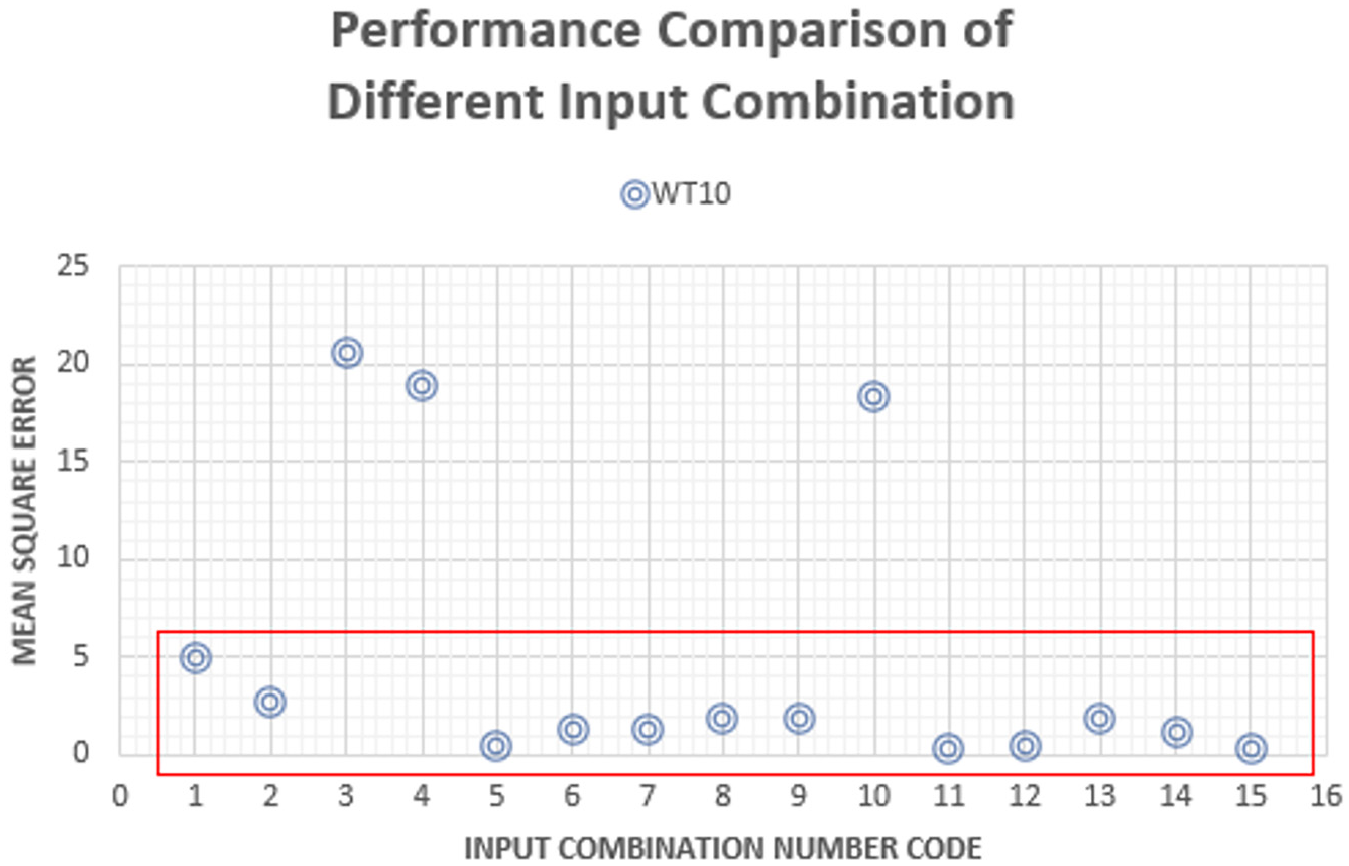
Generator speed is a critical parameter that needs to be monitored closely. The input combination that gives the optimal performance to the generator speed model is the four-input parameter combination of air gap temperature, bearing temperature, stator temperature, and active power. However, other combinations also resulted in a performance comparable to the optimal combination. Figure 7 shows a graphical comparison of the performances of the different input combinations for the generator speed model of WT09. The graph shows good performances for combinations having the number code 004, 007, 009, 010, 012, 013, 014, and 015. Looking at the different input parameters in these number code combinations, it can be seen that the common parameter among these combinations is the parameter “active power.” It implies that the active power parameter improves the performance of the generator speed model.
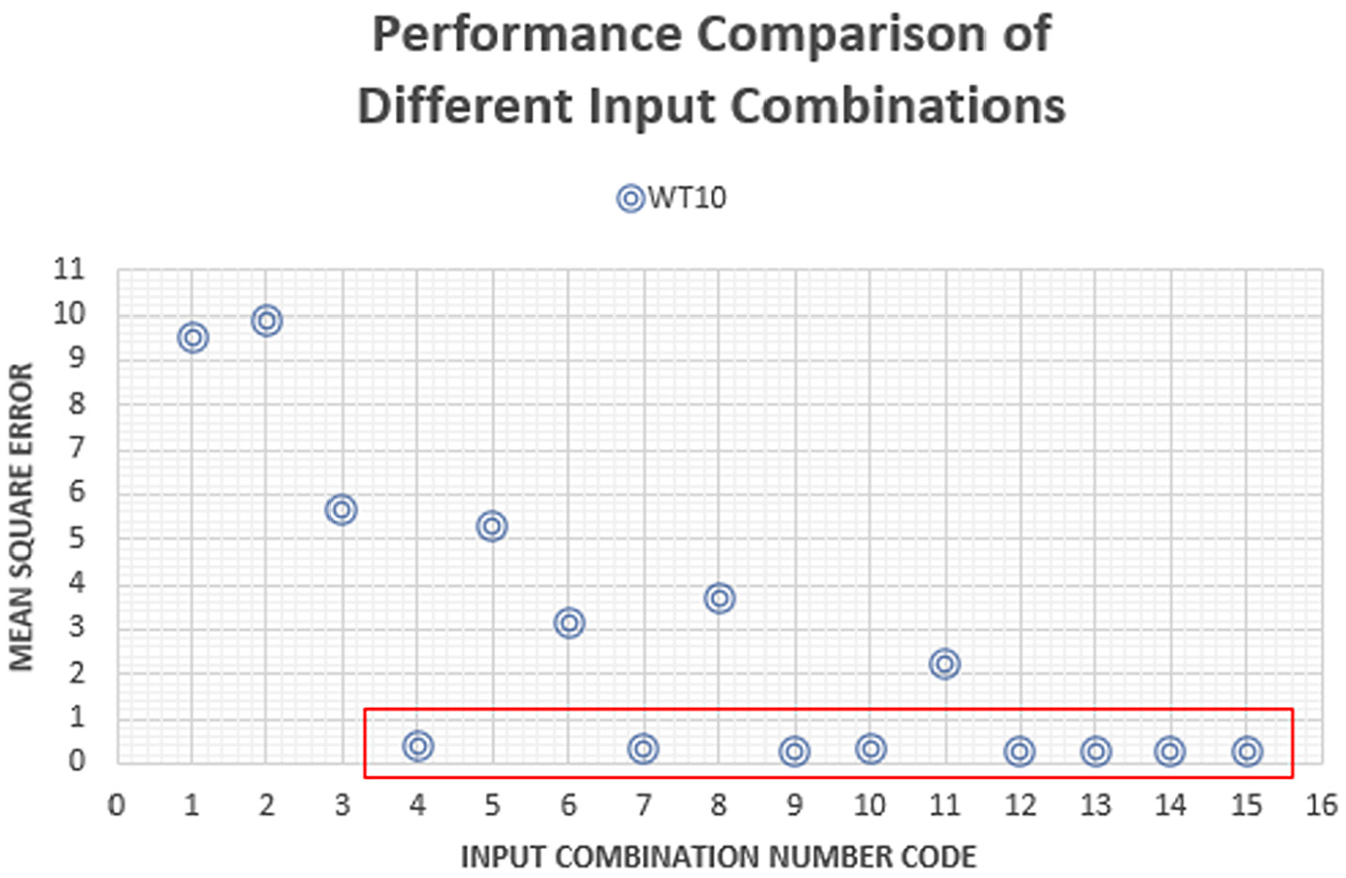
Performance comparison of the different input combinations for generator speed model.
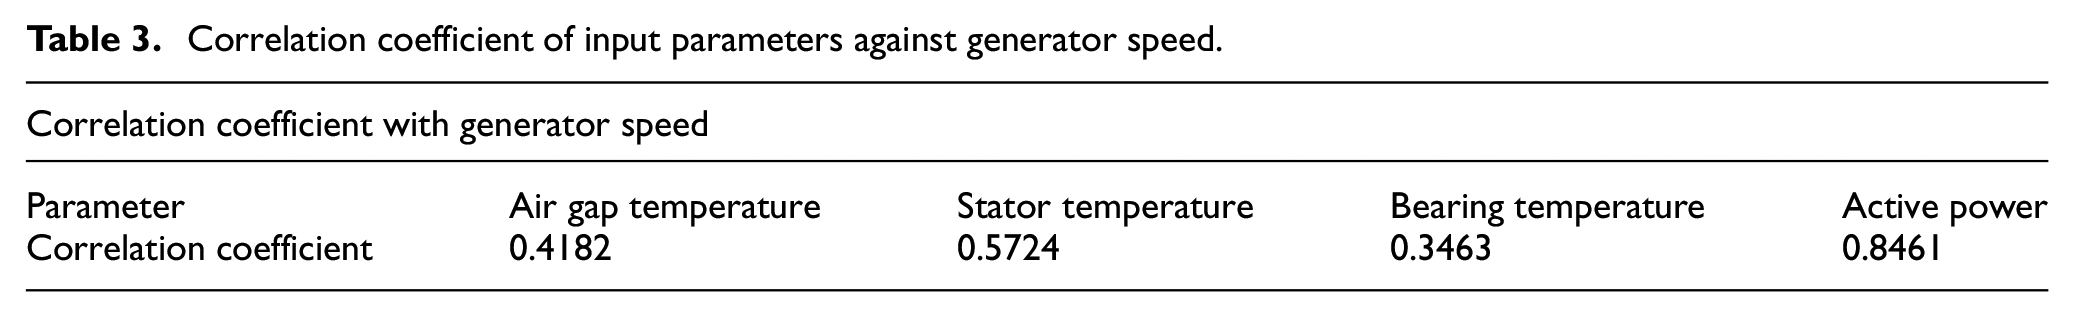
With the improvement of the performances using the active power parameter, it shows that the relation between the data set of the active power and generator speed shows a good correlation. Table 3 shows a comparison of the correlation coefficient of all the input parameters with generator speed. It can be seen that the active power has a better correlation with generator speed resulting in improved predictive performance.
Correlation coefficient of input parameters against generator speed.
The performance behavior was also compared for different turbines in the wind farm. This is to test any consistency between the behavior of these performances for different wind turbines. In this case, the input combinations with good performance were the ones used in comparison to other wind turbines. The comparison shows no significant difference between the performance of the generator speed model for the wind turbines in the same wind farm as shown in Figure 8. There is no significant outlier in the set of data values. This is an indication that the predictive model of a wind turbine behaves in the same way as that of other wind turbines in the same wind farm.
Performance comparison for different wind turbine head for generator speed model.
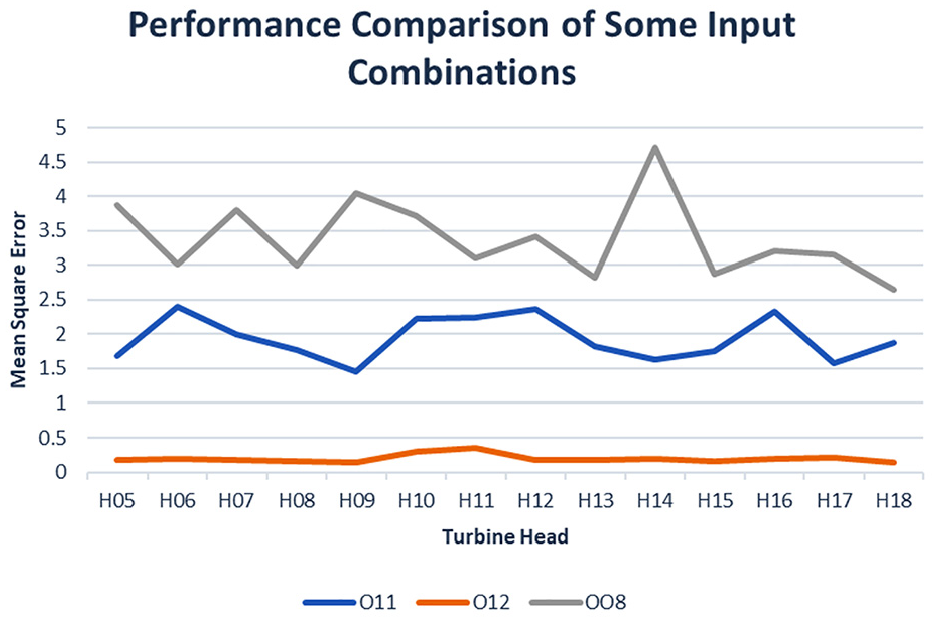
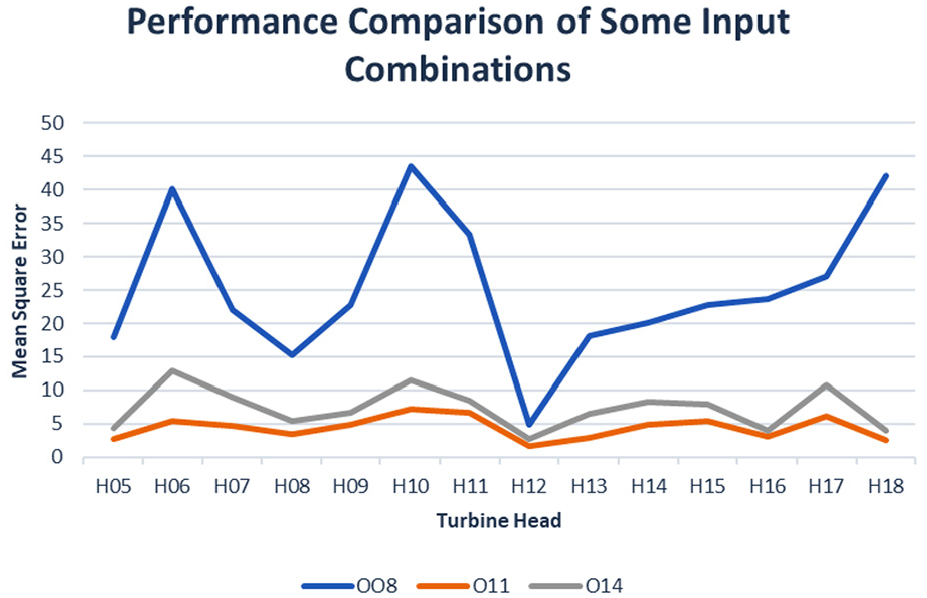
Further observation can be made relating the behavior of some predictive models within different wind turbines. Figure 9 shows a graphical comparison of the performances of predictive models having the input combinations 008, 011, and 012 between the different wind turbines. It shows that for all wind turbines, there is a consistent increase in performance from combination 008 to combination 011 and also with the performance from 011 to 012. The consistency in their behavior implies that changing the input parameter combination to improve the performances of the predictive models of one turbine can also be used for other wind turbines in the same wind farm.
Performance comparison of some input combinations for generator speed model.
Stator temperature model
The stator temperature model is used to monitor overheating in the stator which is one of the common failures in the generator. The input parameter combination that gives optimal performance for the stator temperature model is the three-input parameter using air gap temperature, bearing temperature, and active power. Figure 10 shows input combinations showing good performances for the stator temperature models which are combinations 005, 006, 007, 011, 012, 014, and 015. The common input parameter for these combinations is the parameter “Air Gap Temperature.” Thus, it shows that the air gap temperature parameter improves the performance of the stator temperature model.
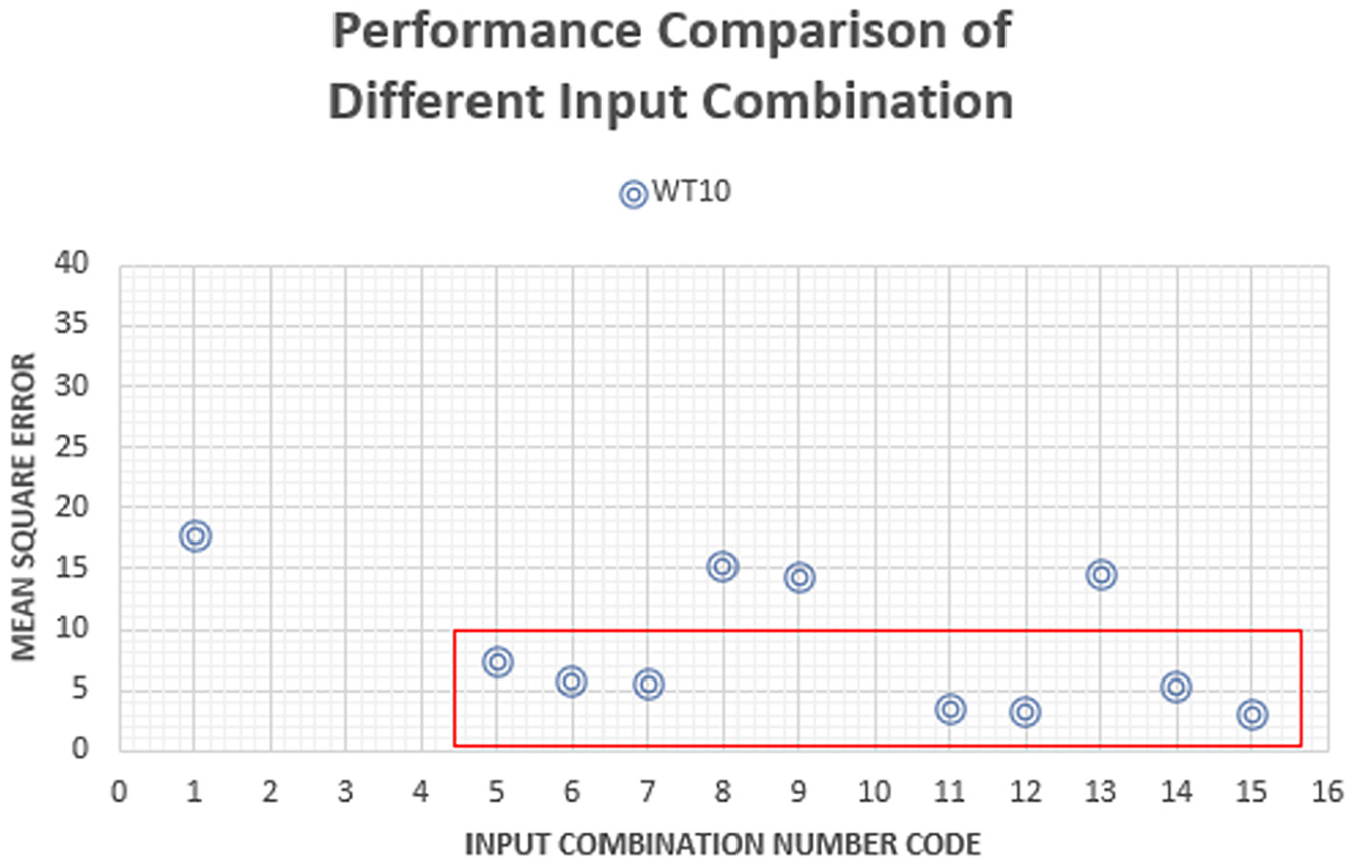
Performance comparison of the different input combinations for stator temperature model.
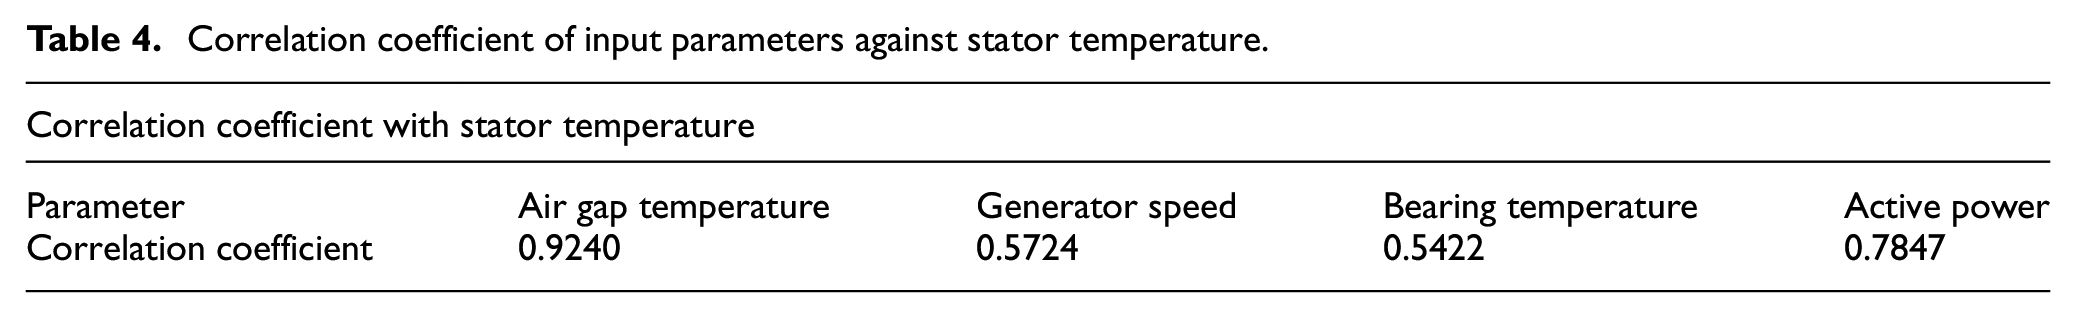
The performance of the stator temperature model is improved with the use of the air gap temperature parameter. Table 4 shows that air gap temperature has a higher correlation with the stator temperature implying that a parameter with a higher correlation to the output parameter can improve the predictive model’s performance.
Correlation coefficient of input parameters against stator temperature.
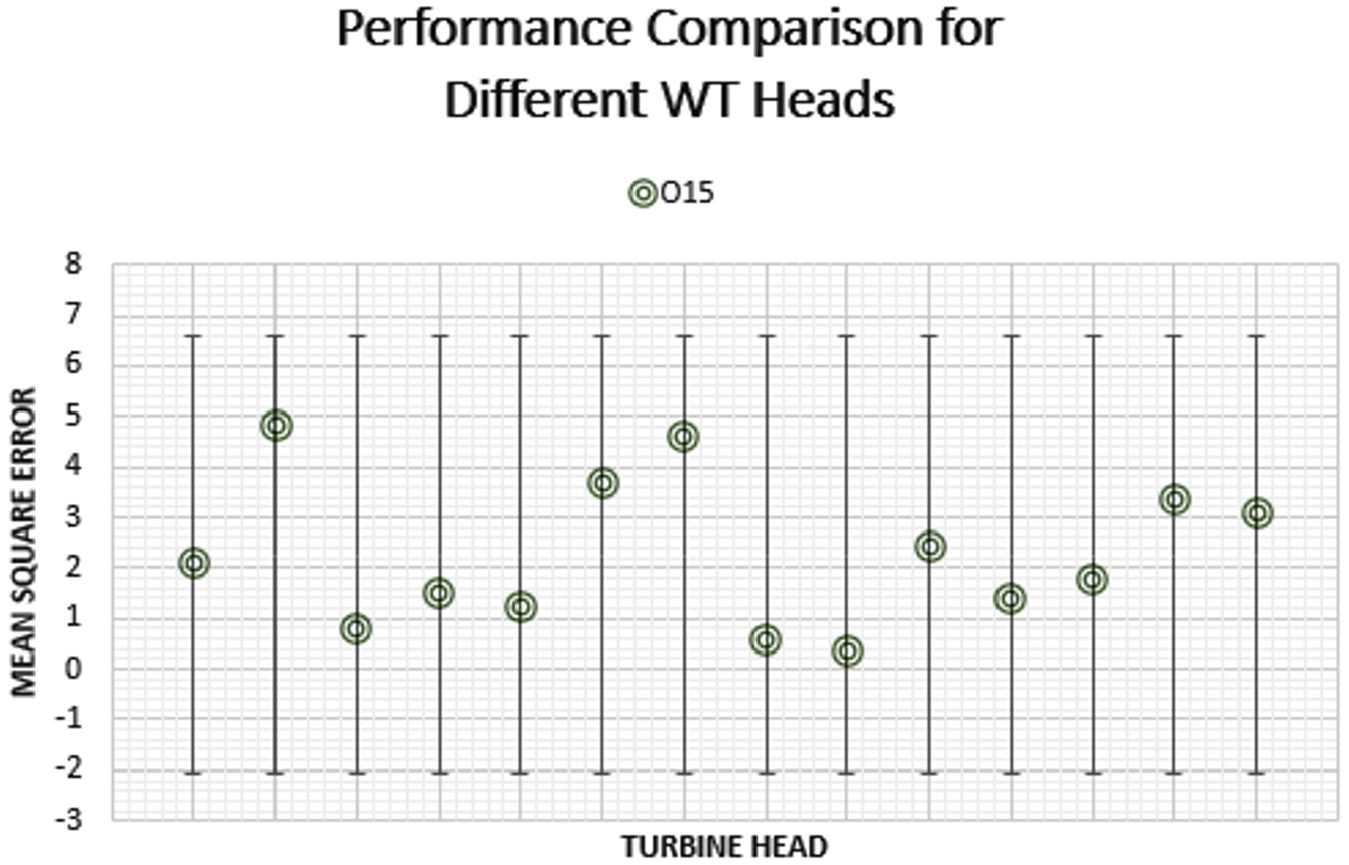
The performances of the stator temperature models were also compared within the 14 turbines in the wind farm. Using the input combination 015, Figure 11 shows the performances of all the wind turbines in the wind farm. No outlier can be observed in the data set implying that there is a consistency between performances for different turbines in the same wind farm.
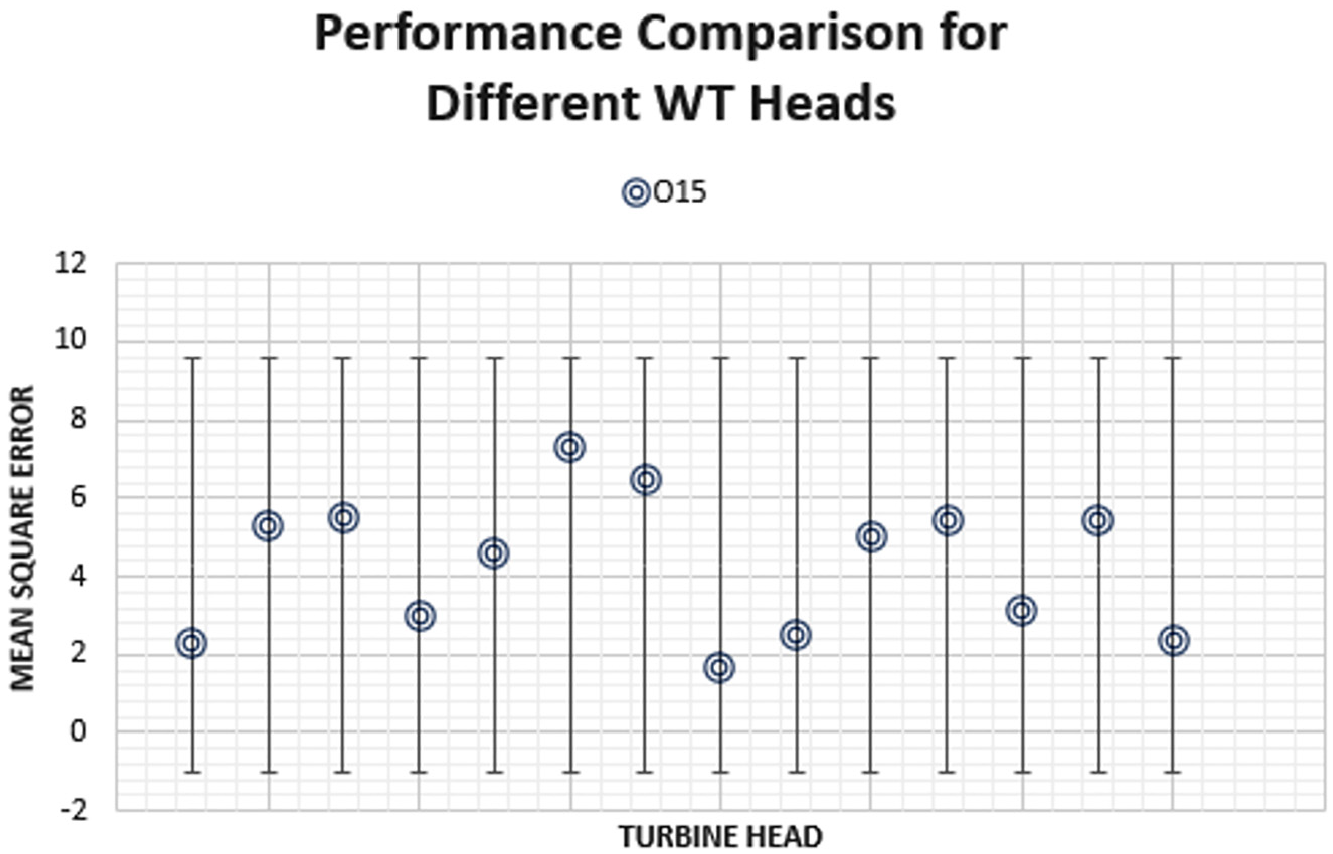
Performance comparison for different wind turbine head for stator temperature model.
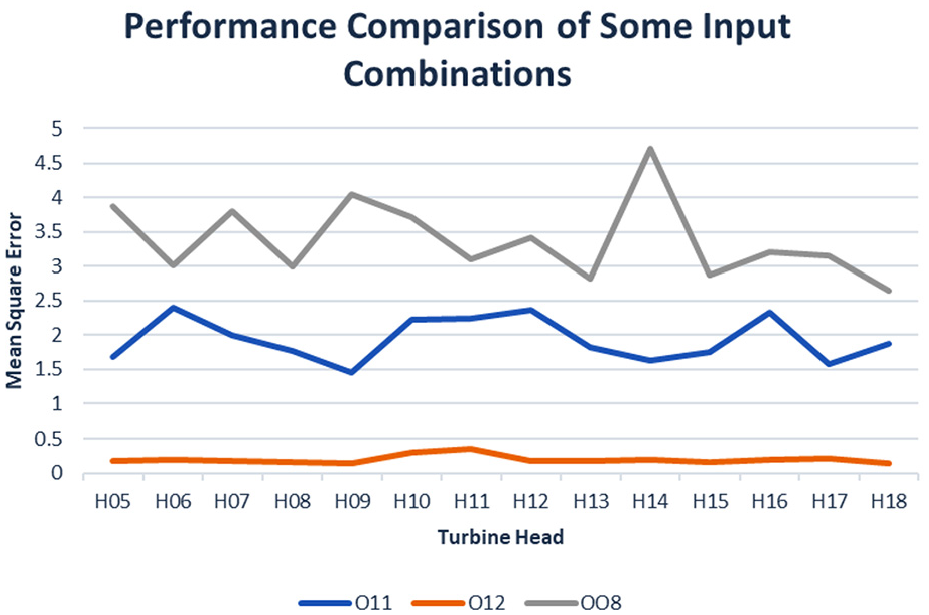
Figure 12 shows a performance comparison of the behavior of the predictive models of different wind turbines for input combinations 008, 011, and 014. A consistent increase from input combination 008 to combination 011 can be observed. Also, for all turbines, an increase in performance can be observed from using the input combination of 011 to combination 014.
Performance comparison of some input combinations for stator temperature model.
Bearing temperature model
The bearing temperature is an important parameter in the generator that needs monitoring because overheating could cause serious problems and failures for the generator. The input parameter combination of air gap temperature, stator temperature, active power, and generator speed gives the optimum performance for the bearing temperature model. Other combinations of inputs that produced a good performance for the bearing temperature model are 001, 002, 005, 006, 007, 008, 009, 011, 012, 013, 014, and 015. Figure 13 shows a graph of these input combinations with their corresponding mean square error. It could be observed in the set of input combinations that both parameters “Air Gap Temperature” and “Stator Temperature” contribute to an improved performance for the bearing temperature model. Any combination that includes air gap temperature or stator temperature would result in a better performance compared to other input combinations.
Performance comparison of the different input combinations for bearing temperature model.
Table 5 gives the correlation coefficient of all the input parameters with bearing temperature. It shows that the air gap temperature has the best correlation coefficient with bearing temperature and close to it is the stator temperature. For comparison, the air gap temperature parameter gives a better improvement in the performance compared to the stator temperature parameter. It can be observed for input combinations without air gap temperature but with stator temperature that there is a lesser improvement in performance compared to those combinations with air gap temperature parameters.
Correlation coefficient of input parameters against bearing temperature.

Figure 14 shows the comparison of the predictive model’s performances for the input combination 015. It can be observed that performance is consistent relative to other turbines of the same input parameter combination. There is no significant difference between the performance level within the wind turbines.
Performance comparison for different wind turbine head for bearing temperature model.
Figure 15 shows improvements for some input combinations relative to other wind turbines in the wind farm. It can be seen that there is an increase in performance from input combination 006 to combination 005 for all wind turbines. Furthermore, the performance for input combination 005 is improved for input combination 015 observed in all wind turbines.
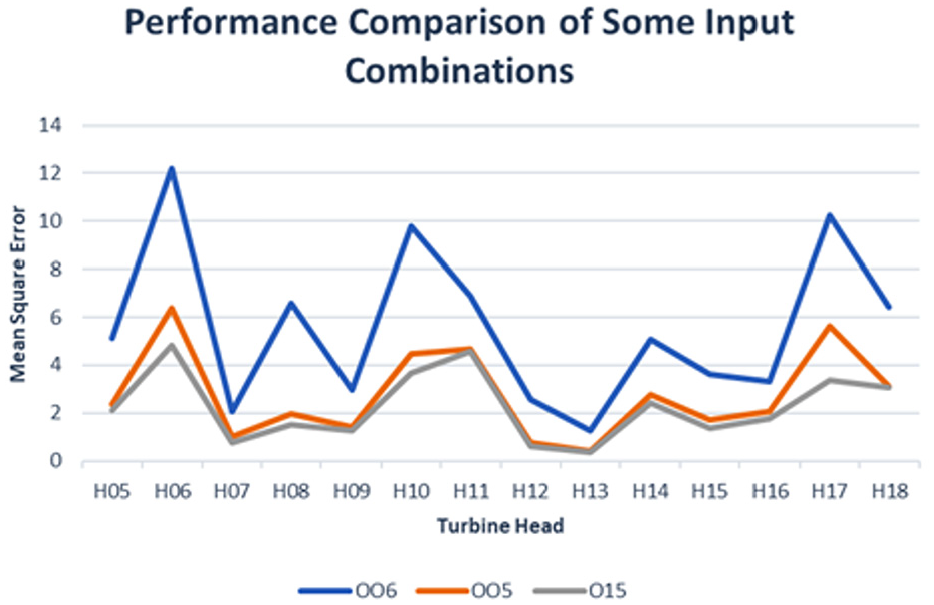
Performance comparison of some input combinations for bearing temperature model.
The mean square error as a model evaluation index only covers the evaluation of the performance of the predictive models. It does not intend to fully evaluate the overall performance of the condition monitoring system. Other aspects of condition monitoring particularly prognosis cannot be measured by the mean square error. Thus, for this study, the performance of the condition monitoring system was limited to the performance of the predictive models as evaluated by the mean square error.
Conclusions and future applications
Wind turbine condition monitoring using SCADA data could be improved with proper assessment and analysis of its parameters. It is important to consider the proper input parameter combination that would improve the performance of the predictive models. One method to check which input combination would give the best result is to run a simulation of all possible combinations of parameters and check which combination gives optimal performance. It is also important to check the correlation of parameters to be able to have a quick overview of which parameter combination would give a better performance. The linear correlation coefficient is a good contributing factor in improving the performance of predictive models. This finding is useful for SCADA systems with a lot of parameters involved in the wind turbines. Checking the correlation coefficient of the parameters would classify parameters that could be useful for the improvement of the predictive models.
It is also found out that the behavior of the performance of the different predictive models for each output model is consistent with all other wind turbines in a single wind farm. Thus, in the case of wind farms with a very large number of wind turbines, the simulation of different input combinations for the predictive models can be done on a single turbine and could be applied to all turbines in the wind farm.
Footnotes
Declaration of conflicting interests
The author(s) declared no potential conflicts of interest with respect to the research, authorship, and/or publication of this article.
Funding
The author(s) received no financial support for the research, authorship, and/or publication of this article.