
Abstract
The measurement of low-frequency vibration signals is a very important job in the fields of earthquake early warning, health monitoring of large-scale engineering structures, and geological exploration. Aiming at the problem of Fiber Bragg Grating (FBG) acceleration sensors’ cross-sensitivity to temperature and strain when measuring low-frequency vibration signals, this paper developed an M-shaped double cantilever beam structure that can produce chirp effect with its own structural characteristics, thereby making the sensor insensitive to temperature. Through theoretical analysis and simulation, the paper obtained the relationship between the reflection spectrum bandwidth of the chirped FBG and its acceleration. It adopted a spectrometer and a vibration test system to detect the reflection spectrum bandwidth of the FBG, and then obtained the acceleration. The experimental results showed that, compared with bare fiber grating, the temperature sensitivity of the proposed sensor was significantly lower, and its reflection spectrum bandwidth was not sensitive to temperature changes, moreover, there are good linear relationships between the reflection spectrum bandwidth, the power of the light, and the acceleration. The sensitivity was about 256 pm/g, the natural frequency was 66 Hz; therefore, the proposed sensor had realized high-performance detection of low-frequency vibration signals.
Introduction
The measurement of low-frequency vibration signals plays an important role in the fields of earthquake early warning, health monitoring of large-scale engineering structures, and geological exploration. By measuring the structural vibration caused by external factors, the development trend of structural damages of the equipment, the environment, and the engineering projects can be mastered in real time.1–3 However, traditional electronic acceleration sensors are susceptible to external electromagnetic interference, the signal attenuates quickly in the cumbersome wiring and long-distance transmission environment; therefore, its application is greatly limited in case of engineering practice with high requirements in wiring.4,5 Therefore, in such context, the FBG acceleration sensors emerged victorious in the field of low-frequency vibration measurement due to its many advantages such as high sensitivity, high accuracy, low power consumption, small size, strong anti-interference ability, and easy for arraying and multiplexing, etc.6–8
In recent years, domestic and foreign scholars have carried out in-depth research on FBG acceleration sensors. 9 For example, Dai YT et al. 10 proposed a cantilever beam type FBG acceleration sensor based on wavelength demodulation; in the structure of the proposed sensor, when the mass block at the free end vibrates, the center wavelength of the FBG changes accordingly, the wavelength change has a linear relationship with the acceleration of the structure to be tested; and the measurement of acceleration could be achieved by measuring the wavelength change. However, the wavelength is also very sensitive to the temperature change, and the measurement result is easily distorted by the cross-interference of the temperature. Ye T et al. 11 developed an acceleration sensor based on the bending characteristics. In the structure of the proposed sensor, the mass block vibration drives the lever to deform the arched beam, and gratings are pasted to both the upper and bottom surfaces of the arched beam to achieve temperature self-compensation. Parida et al. 12 proposed a novel mechanical sensor structure based on T-shaped cantilever beam, in their design, two fiber gratings were integrated in a differential sensing device, which realized the temperature self-compensation of the optical acceleration sensor, but this temperature compensation method used multiple fiber gratings, which had increased the cost of the system and the complexity of the demodulation system. For this reason, Xinyong et al. 13 proposed a new FBG acceleration sensor temperature self-compensation method based on the strain chirp effect, the method made use of the temperature insensitivity characteristics of the reflection bandwidth and the optical power when FBG generates the chirp effect to reduce temperature interference, but the lateral anti-interference ability and stability of the single-degree-of-freedom cantilever beam structure need to be improved. Although the research on FBG acceleration sensor has achieved a series of research results in recent years, extreme weather conditions often occur before and after the actual earthquake disasters, and the sharp environment temperature changes will change the effective refractive index of the grating, resulting in the red shift of the central wavelength of the FBG, and the simultaneous sensitivity of fiber grating to temperature and vibration strain makes the measured low-frequency vibration signal susceptible to the interference of temperature signals; therefore, in order to achieve high-performance detection of low-frequency seismic vibration signals by FBG sensors, the influence of temperature must be eliminated. At present, the cross-sensitivity of temperature and strain is still a bottleneck hindering the application of FBG acceleration sensers in the high-performance detection of low-frequency seismic vibration signals.
Targeting at the problem of the cross-sensitivity of temperature and strain of FBG acceleration sensors, this paper proposes a temperature-insensitive FBG acceleration sensor based on the strain chirp effect. Then, in this study, an M-shaped double-cantilever beam structure is developed, and the FBG is pasted in the non-uniform strain area of the beam, and a tensile load is applied to make the FBG produce the chirp effect; after that, this paper gives a theoretical analysis on the natural frequency and reflection bandwidth of the sensor, and optimizes the structural parameters; moreover, this paper also uses the finite element software to simulate and analyze the structural strain and modal characteristics of the sensor, fabricates a physical sensor prototype and tests its performance.
Sensor design
Sensor structure and principle
The M-shaped double-cantilever beam FBG acceleration sensor is composed of a mass block, an M-shaped cantilever beam, a base support, optical fibers, optical gratings, and other parts, as shown in Figure 1, wherein the M-shaped cantilever beam is acting as the main elastic component of the system, and it is consisted of two symmetrical triangles with equal strength. Compared with single cantilever beam, the proposed structure has stronger twisting resistance. With the help of the phase mask technology, Bragg grating was written in the optical fiber, and a full adhesive packaging method was adopted as the assembly method, that is, the fiber grating is in direct contact with the sensor structure, which makes the fiber grating produce the chirp effect more easily. The weight method was adopted to fix the fiber grating, that is, one end of the fiber was fixed to the plate on the left by a pressure block, on the other end, a weight of 2 g was used to prestress the fiber grating, and the UV glue was used to paste the fiber grating on the non-uniform strain gradient area of the M-shaped beam, wherein the angle between the axial direction and the neutral plane of the beam was noted as
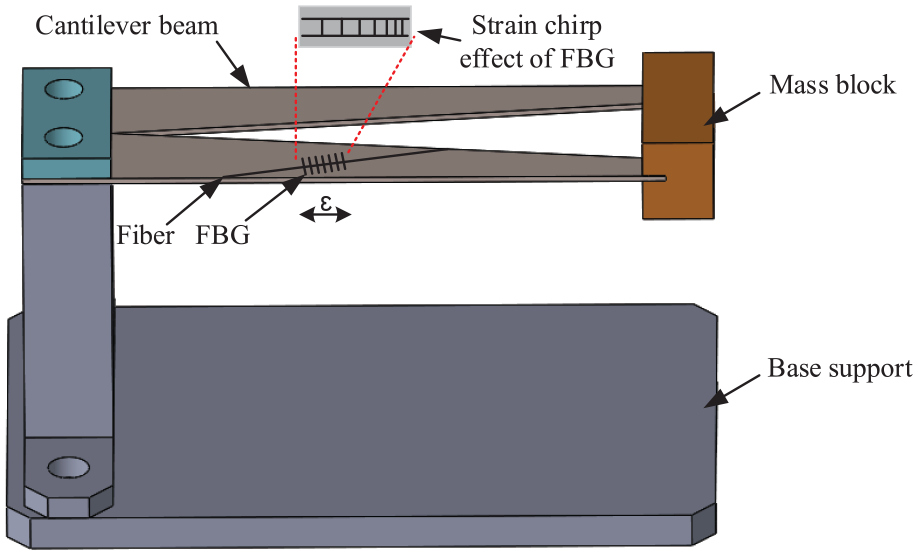
Structure of the proposed sensor.
When the sensor is excited by an external vibration signal, the mass block at its free end will vibrate with the inertial force, and the vibration will induce strain in the cantilever beam. When the beam is bent, gradient strain distribution will generate on the layers of different thickness, and the non-uniformly distributed strain will be transferred to the FBG, causing it to produce the chirp effect. The theory of FBG chirp effect sensing is that its microcosmic structure can be regarded as a collection of many effective sub-grids which are interrelated, closely connected, and have independent sensing capabilities within the length range of the grating area, that is, it divides the grating area into grating grids corresponding to many sub-areas, as shown in Figure 1. When the surrounding of the FBG is subjected to non-uniform strain, the sub-grids of each micro segment will expand and contract non-uniformly, corresponding to different central wavelengths. The superposition of each sub-reflection spectrum shows a chirp spectrum with decreased peak power and widened bandwidth. Since the temperature change would cause changes in the refractive index of the gratings, and thus causing a certain shift in the reflection wavelength of each part of the FBG, it makes the traditional optical acceleration sensors using wavelength demodulation extremely susceptible to temperature cross-interference, but the temperature has no effect on the bandwidth. Therefore, such chirp effect sensing method is not sensitive to temperature.
Principle of sensor tuning
The key to realize temperature insensitivity of the sensors is to make the fiber grating produce the chirp effect. As shown in Figure 2, the FBG was obliquely pasted on the surface of the cantilever beam. When the beam was bent, the reflection bandwidth of the FBG was broadened under the action of gradient strain, thereby triggering the chirp phenomenon, and the greater the bend of the beam, the stronger the chirp effect of the fiber grating, and the wider the reflection bandwidth.
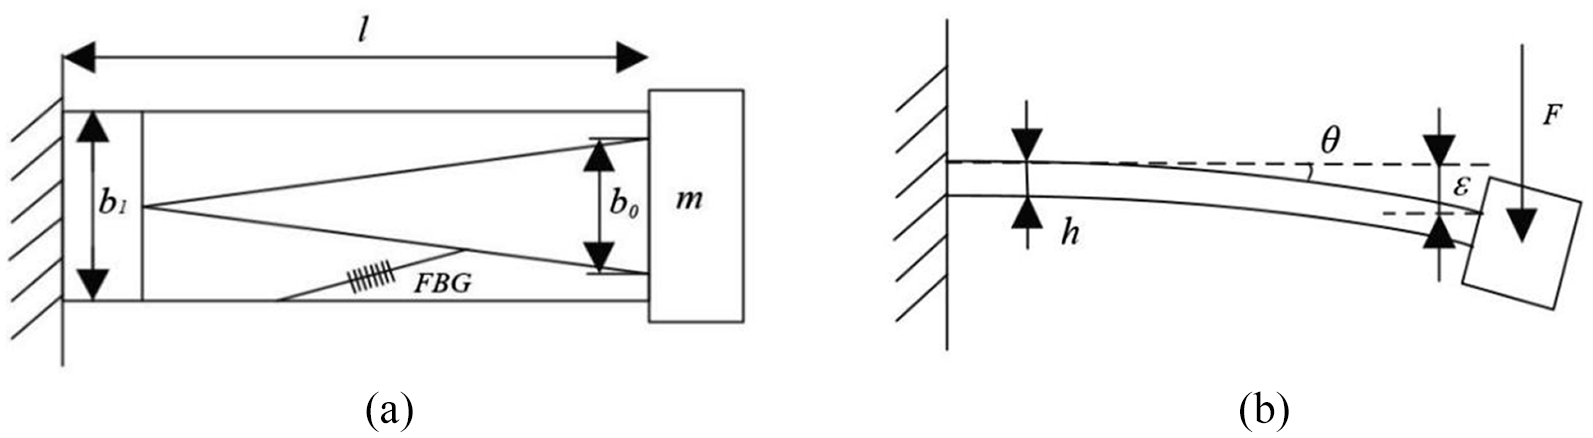
Mechanical analysis of the sensitivity structure of the sensor: (a) top view and (b) front view.
To facilitate the description of the layers with different thicknesses on the beam, the z-axis was defined as the coordinate axis perpendicular to the neutral plane and the neutral plane was taken as the zero point, z was the distance between any point on the grating and the neutral plane,
According to the analysis of material mechanics, the axial strain
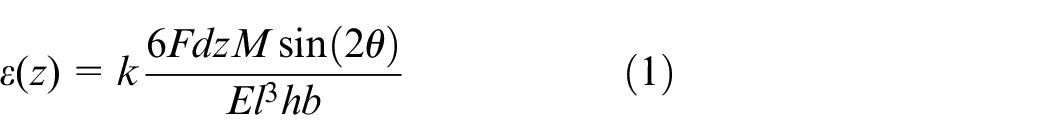
Where,
For a fiber grating with a uniformly distributed initial grating pitch, under the action of a non-uniform environmental field, the reflection spectrum of the grating will produce the chirp effect. Under the action of the axial non-uniform strain field, the variation of the FBG wavelength difference is:
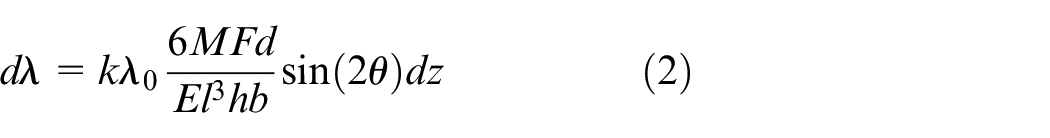
Where,
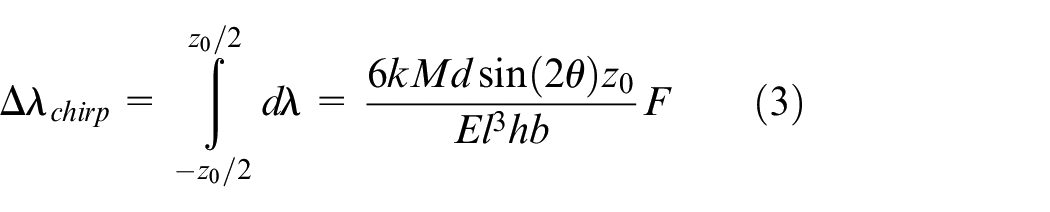
In the formula,

Where,
Formulas (3) and (4) indicate that the grating reflection spectrum bandwidth and reflected light intensity both have a linear relationship with the acceleration, and both have nothing to do with temperature changes. Therefore, the bandwidth tuning technology can eliminate the temperature cross-sensitivity effects, thereby obtaining automatic temperature compensation.
Analysis of natural frequency
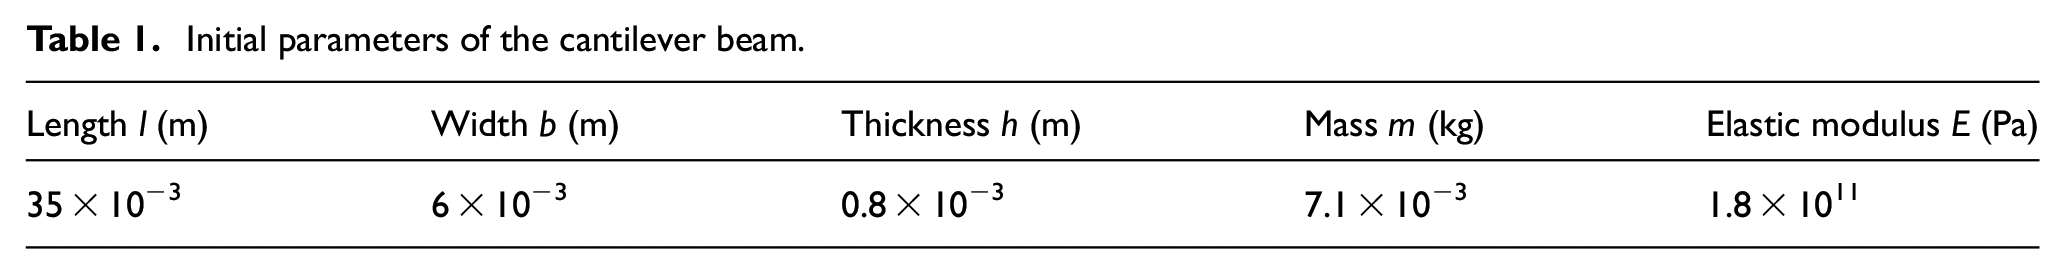
The natural frequency of the FBG acceleration sensor determines the input signal frequency that can be measured. The natural frequency reaches the optimal when it is greater than 1.5 times the frequency of the seismic signal. The health monitoring of large structures and infrastructures generally takes the seismic signals as the excitation source. Since seismic signals are generally low frequency below 40 Hz, the optimal natural frequency of the sensor is about 60 Hz.4,14 To obtain the natural frequency, the initial parameters of the cantilever beam are shown in Table 1.
Initial parameters of the cantilever beam.
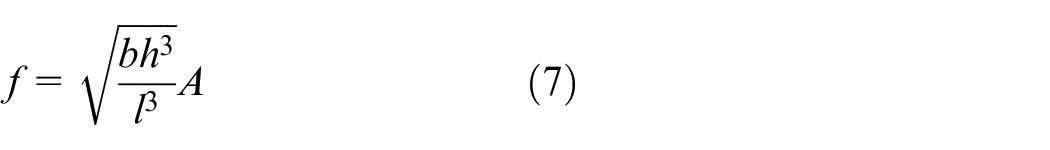
The natural frequency
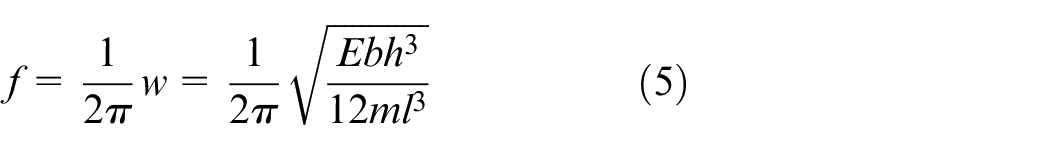
It can be seen from Formula (5) that the natural frequency
Calculate the partial derivatives of the natural frequency
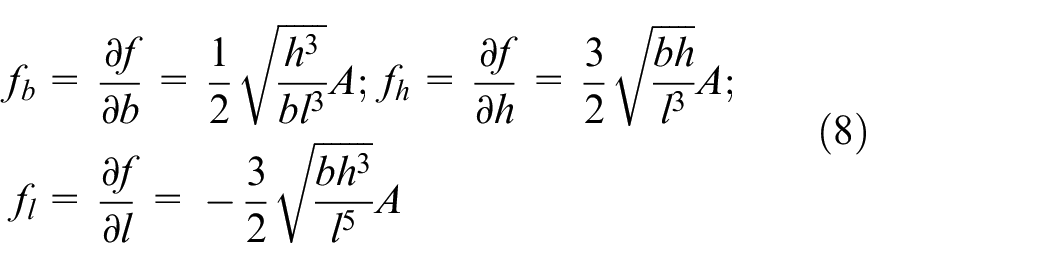
Substituting the relevant parameters into the above formulas, we can get:
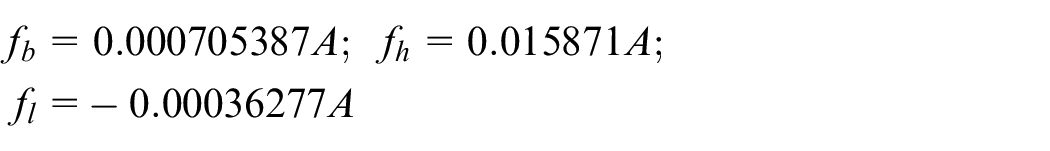
It can be seen from the results that the geometric parameters of the cantilever beam have different influence on the natural frequency
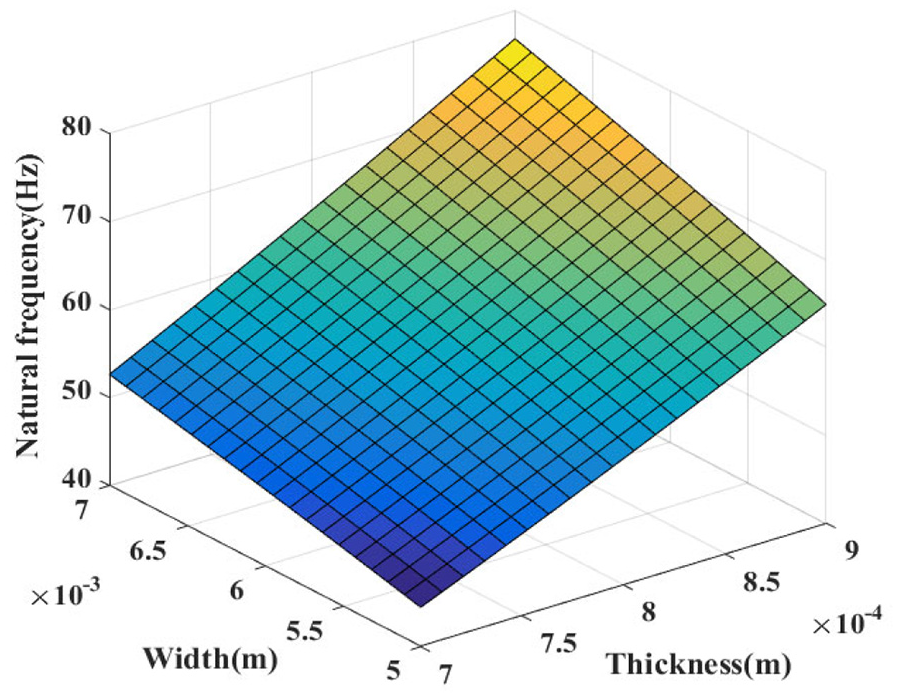
Effects of the width and thickness of the cantilever beam on the natural frequency.
Analysis of sensitivity
The sensitivity of FBG acceleration sensor can be understood as an expression method for resolving the smallest seismic signal. In order to obtain low-frequency vibration signals, the sensor needs to have good sensitivity within a certain frequency band. Similar to the principle of the mechanical model shown in Figure 2, when the sensor moves with the object to be measured, its acceleration a produces an opposite inertial force F on the mass block, then the mass block is forced to vibrate, causing the center of the cantilever beam to shift.
According to the definition of the sensitivity of acceleration sensor, combining with Formula (3), the sensitivity S of the sensor acceleration can be expressed as:
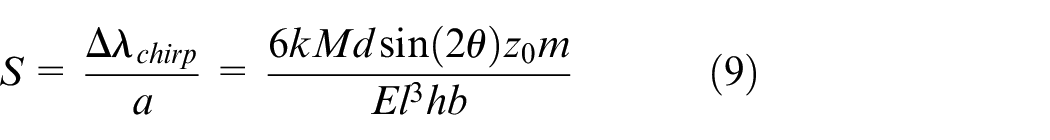
The sensitivity referred to in this paper is the peak-to-peak sensitivity 2 S.
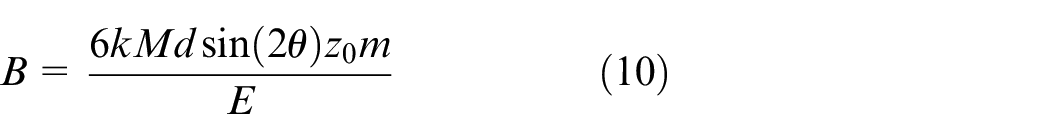
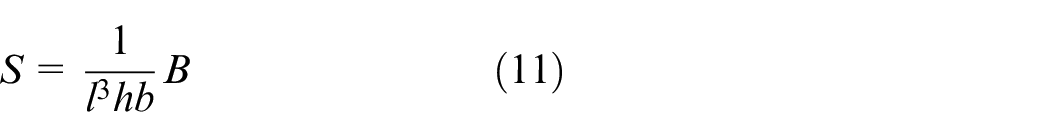
It can be seen from Formula (9) that the sensor sensitivity is related to the geometric parameters of the cantilever beam and its material characteristics, therefore, there are:
Respectively calculate the partial derivatives of the reflection bandwidth with respect to the width, thickness, and length, then the influence of the parameter changes on the reflection bandwidth is:
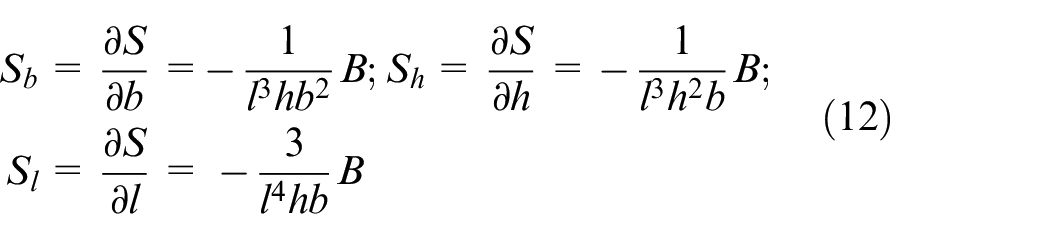
Substitute the relevant parameters into the above formulas, then we can get:
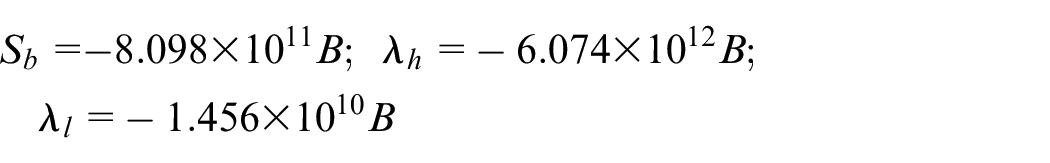
It can be seen from the results that the influence degrees of the geometric parameters of the cantilever beam on the sensitivity are different, wherein the influence of thickness on the sensitivity is the greatest, and the influence of length on the sensitivity is the smallest. Then the width and thickness of the cantilever beam were selected to analyze their influence on the sensitivity, the sensor cantilever was set as: length l = 35 mm, width
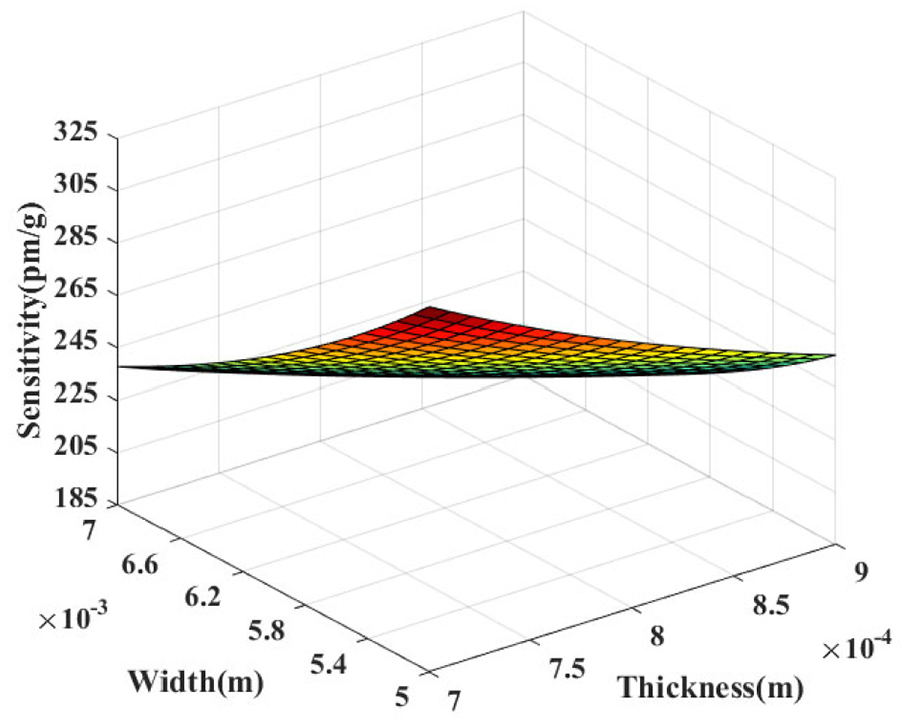
Influence of the width and thickness of cantilever beam on sensitivity.
Structural parameter optimization
According to above analysis, the width and thickness of the cantilever beam are positively correlated with the natural frequency, and negatively correlated with the sensitivity. For acceleration sensors, the two most important parameters, the sensitivity and the natural frequency are mutually restrictive. The increase in sensitivity must be accompanied by a decrease in the resonant frequency, and vice versa. The improvement of the overall performance of the sensor can not only pursue high sensitivity or low natural frequency. Therefore, the sensitivity and natural frequency were integrated into a same coordinate system through Matlab fitting, the influence of the width and thickness of the cantilever beam on the natural frequency and sensitivity, and the fitting curve are shown in Figure 5.
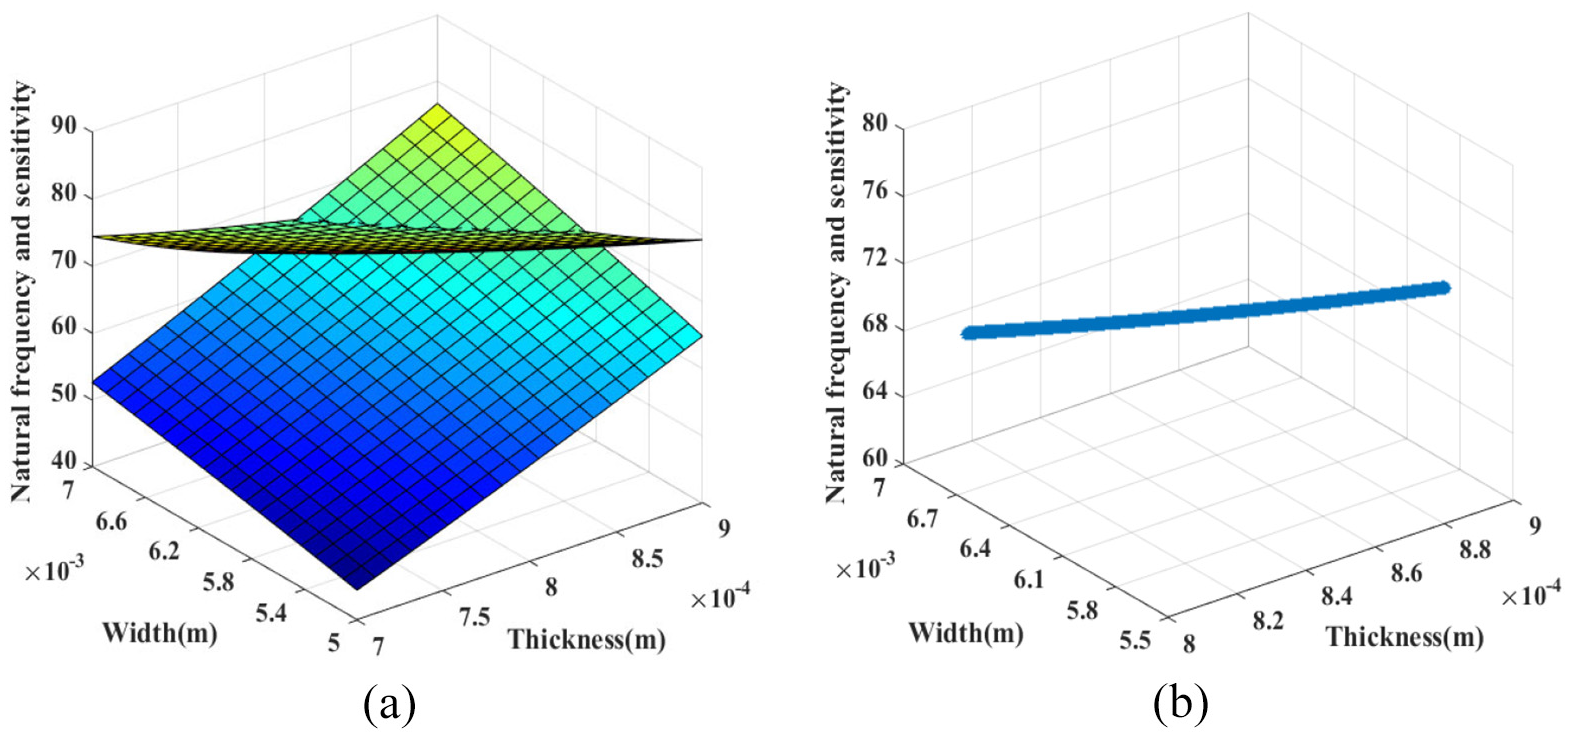
(a) Influence of the width and thickness of the cantilever beam on the natural frequency and sensitivity and (b) fitted curve of the changes of the width and thickness of the cantilever beam.
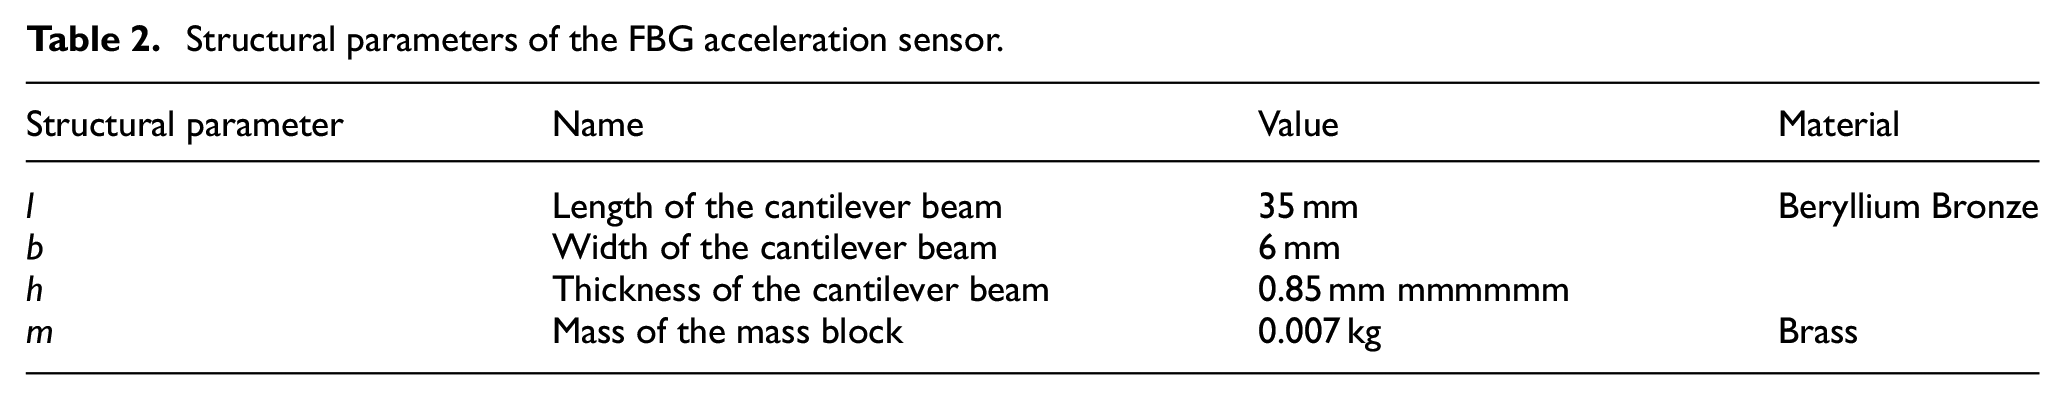
The above analysis gives the influence of key parameters on sensitivity and natural frequency of the sensor. When the width and thickness values of the cantilever beam were selected from the points on the fitting curve shown in Figure 5(b), the natural frequency and sensitivity of the sensor could reach the optimum; at this time, the natural frequency on the fitting curve was about 68 Hz. After comprehensively considering the performance requirement, manufacturing process, size, and materials of the sensor, the structural parameters of the sensor were selected as shown in Table 2.
Structural parameters of the FBG acceleration sensor.
Finite element simulation
Strain analysis of sensor structure
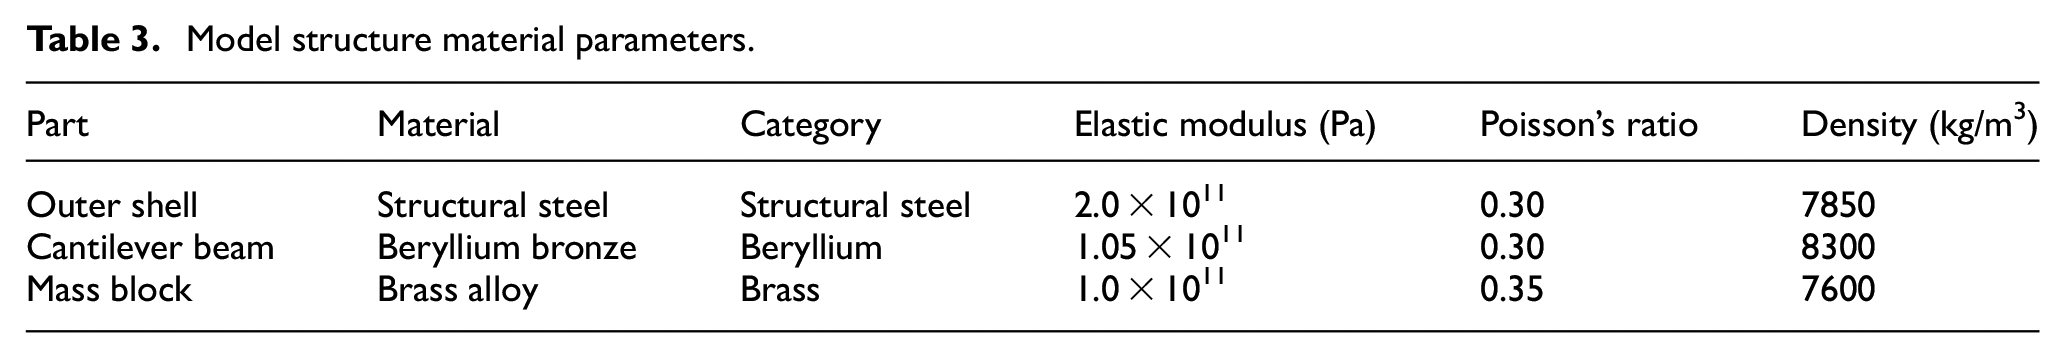
The ANSYS software was adopted for the finite element simulation analysis. First, relevant constraints were established, a fixed constraint was applied to the left end of the cantilever beam, it’s set that the connection surface of the cantilever beam and the mass block was a fully-binding support constraint, and a concentrated load of the standard gravity acceleration of the earth (g = 9.8 m/s2) was added at the free end of the cantilever beam, and the parameters of the model material were set according to Table 3.
Model structure material parameters.
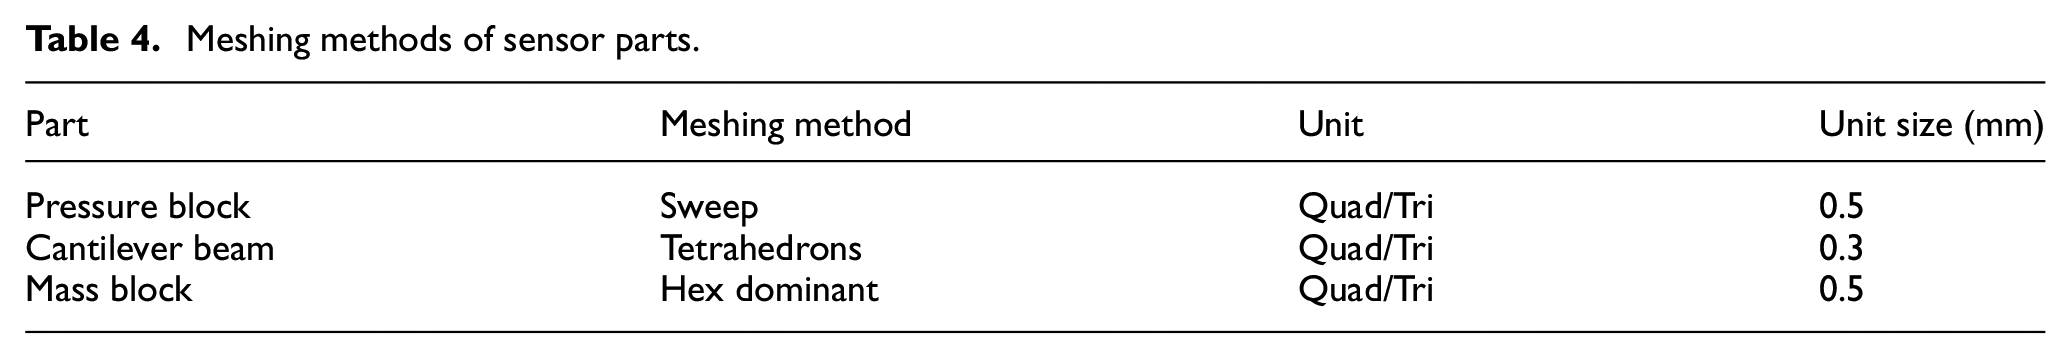
In order to get high precision simulation calculation results of the sensor, the meshing methods, and unit size of each part were customized to perform static stress simulation analysis on the model, as shown in Figure 6. For different parts, the meshing methods included the sweeping method, the tetrahedron method and the hex dominant method, as shown in Table 4. According to Figure 6, the strains generated on different layers of the cantilever beam showed gradient distributions, the maximum deformation at the free end was 69.075 µm, when the beam is bent, the grating will deform.
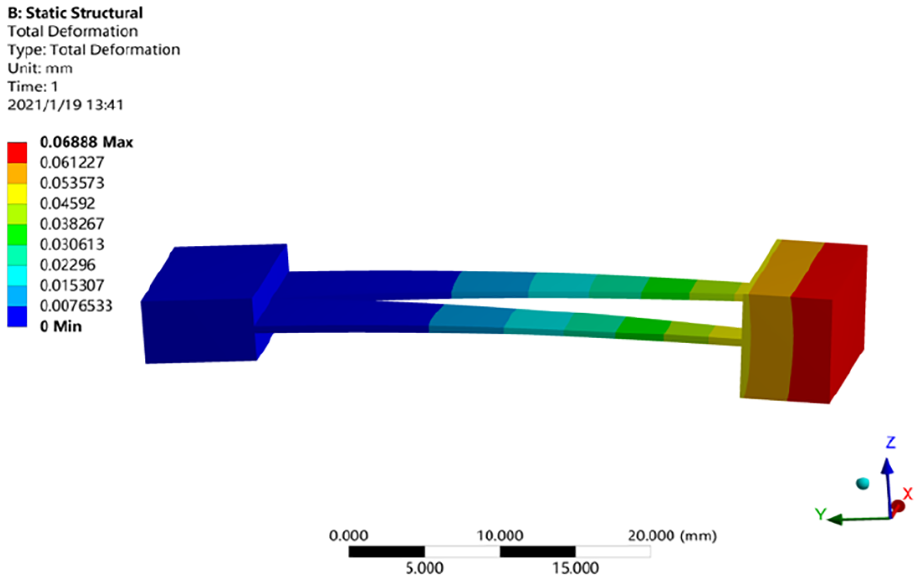
Static stress simulation.
Meshing methods of sensor parts.
Modal analysis of sensor structure
Modal is an inherent property of the sensor structure. According to analysis results of the static stress of the sensor, the sensor model was subject to modal analysis. The calculation order was set to four, then the first-order, second-order, third-order, and fourth-order modal frequencies were 65, 339, 739, and 1054 Hz respectively. The first-order and second-order modal analysis diagrams are shown as Figure 7 below.
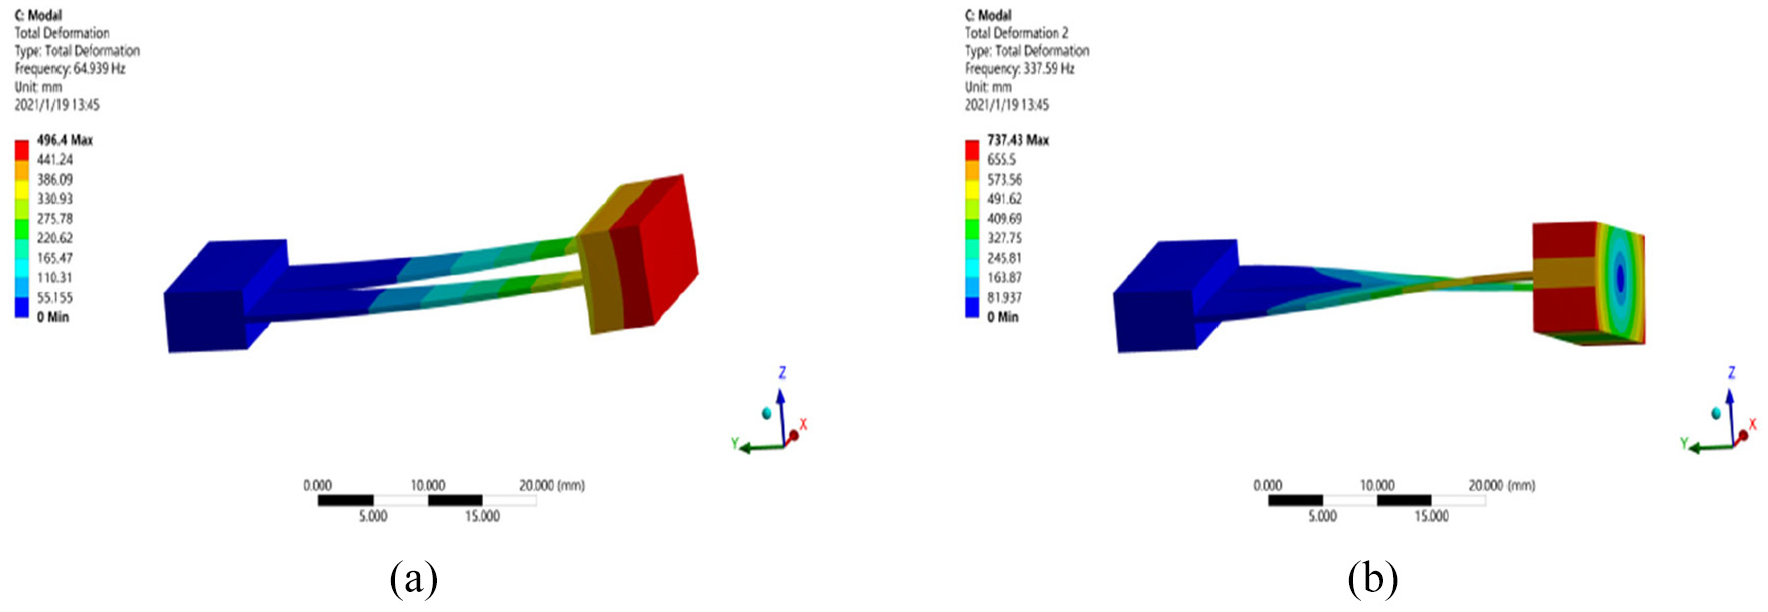
Modal analysis diagrams: (a) first-order modal and (b) second-order modal.
As shown in Figure 7, the first-order modal is the working vibration mode, indicating that the model vibrates along the Y-axis under the action of external vibration. The frequency of the first-order modal was about 65 Hz, which was close to the numerical calculation result of 68 Hz; The second-order modal is the twisting vibration mode, indicating that the model twists around the X-axis under the action of external vibration. By comparing the frequencies of the modals of each order, it can be known that, the frequency of the first-order modal was quite different from the frequencies of the second-order, third-order, and fourth-order modals, indicating that the structure has smaller cross coupling.
Sensor test
The sensor test system consisted of broadband light source, coupler, vibration table system, optical power meter, spectrum analyzer, and computer, as shown in Figure 8. The calibration platform of the vibration table system adopted the MWY-JZQ50 model produced by Beijing Weiyun Technology Co., Ltd., its maximum amplitude is 12.5 mm and the maximum acceleration is 45.5g; the signal function generator adopted the RIGOL series DG1022 model produced by Rigol Technology Co., Ltd., its sampling rate is 1 GSa/a, the generator has 14 kinds of quasi-waveform functions and various standard configuration interfaces, and it supports users to remotely control the instrument and data transmission of the USB port through the Web; the signal amplifier adopted the MYW-TZQ50 model produced by Beijing Weiyun Technology Co., Ltd., its frequency response range is 1–15,000 Hz, the signal-to-noise ratio is greater than 75 dB, together with the signal function generator, it can amplify the function signals. The spectrum analyzer adopted the AQ63700 model produced by the Japanese company Yokogawa Electric Corporation, and its detection accuracy is 0.1 pm. The light wave of the broadband light source was delivered to the acceleration sensor on the vibration table system through the 3 dB coupler. The reflected light of the FBG entered the spectrum analyzer or optical power meter through the same fiber coupler, the reflection spectrum bandwidth of the sensor was measured by the spectrum analyzer, and the changes of the bandwidth were used to verify the occurrence of the chirp effect; the reflected light power of the sensor was measured by the optical power meter, and the measurement of the acceleration was achieved combining with the grating chirp method. Then the amplitude-frequency response characteristics, the linear response characteristics, and the temperature performance of the sensor were studied, and the data were analyzed and normalized to obtain the performance parameters of the sensor.
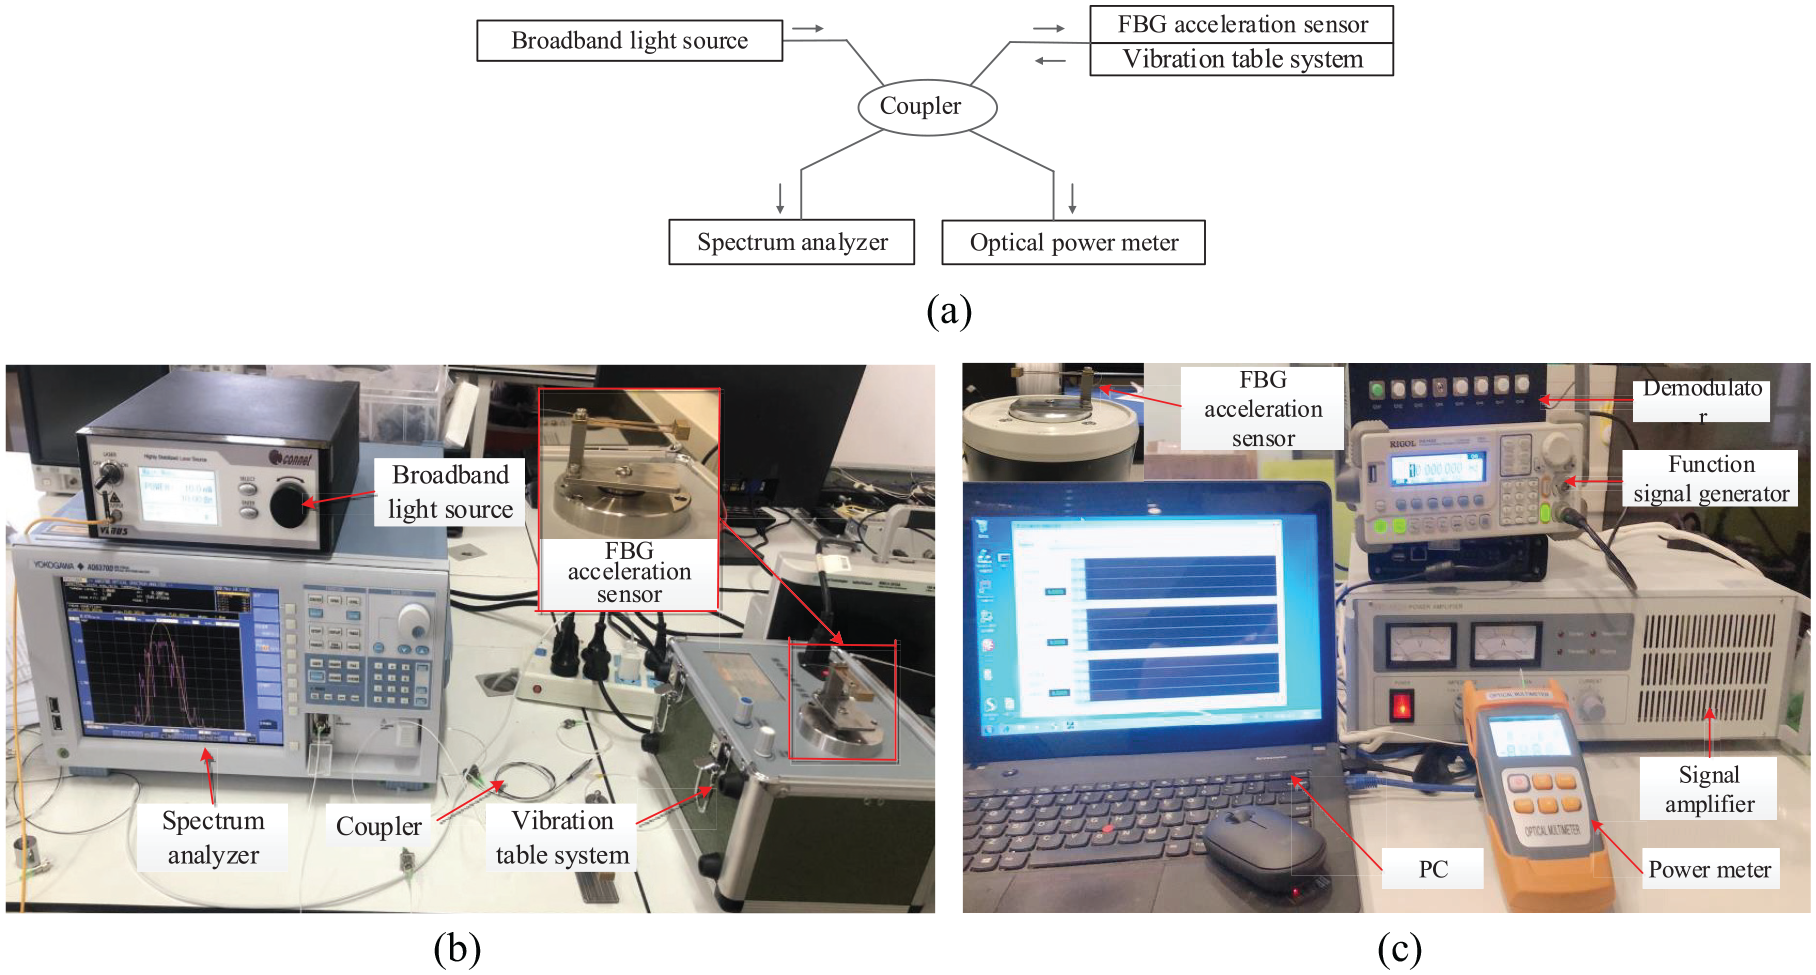
Sensor test system: (a) a schematic diagram of the test system, (b) reflection bandwidth measurement, and (c) reflected light power measurement.
Sensor reflection spectrum test
In the experiment, the static measurement method was adopted, and the sensor was fixed on the vibration table. The center wavelength of FBG was 1549.5 nm, its reflectivity was 0.999, and the initial bandwidth was 0.2 nm. The temperature of the optical grating part was constant at 25°C, and the reflection spectra of the FBG when subjected to different accelerations (0g, 1g, 2g, and 4g) are shown in Figure 9.
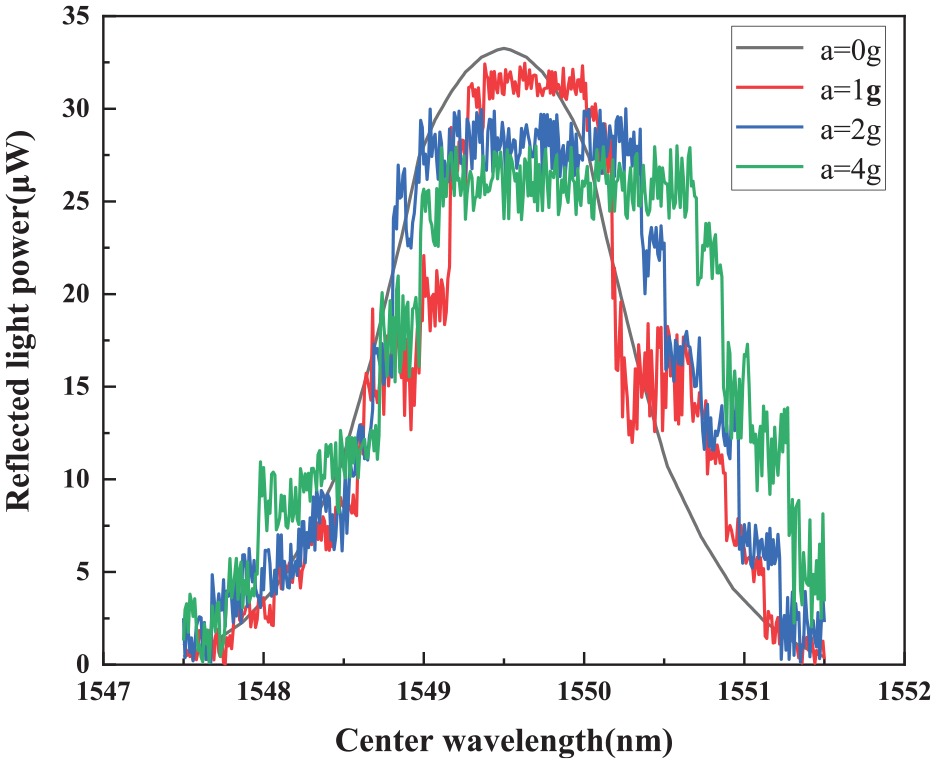
Reflection spectra under different accelerations.
Figure 9 shows that, under different accelerations (0g, 1g, 2g, and 4g), the corresponding 3 dB reflection bandwidth of the sensor was 0.82, 1.08, 1.34, and 1.85 nm, respectively. With the increase of acceleration, the bandwidth of the reflection spectrum increased by about 1 nm. In addition, the grating reflection spectrum appeared deformation and multi peak phenomenon, namely the chirp effect of uniform period FBG.
Amplitude-frequency response characteristic test
In the test, firstly, the amplitude of the vibration signal was fixed, and the acceleration sensor was subject to the sweep check. The frequency range was from 5 to 120 Hz in 5 Hz steps. In order to accurately analyze the sensitivity amplitude-frequency response, the dynamic response coefficient C corresponding to each frequency was defined to be the ratio of the measured bandwidth of the FBG acceleration sensor to its acceleration on the vibration table. The amplitude-frequency response curve of the FBG acceleration sensor obtained by calibration is shown in Figure 10.
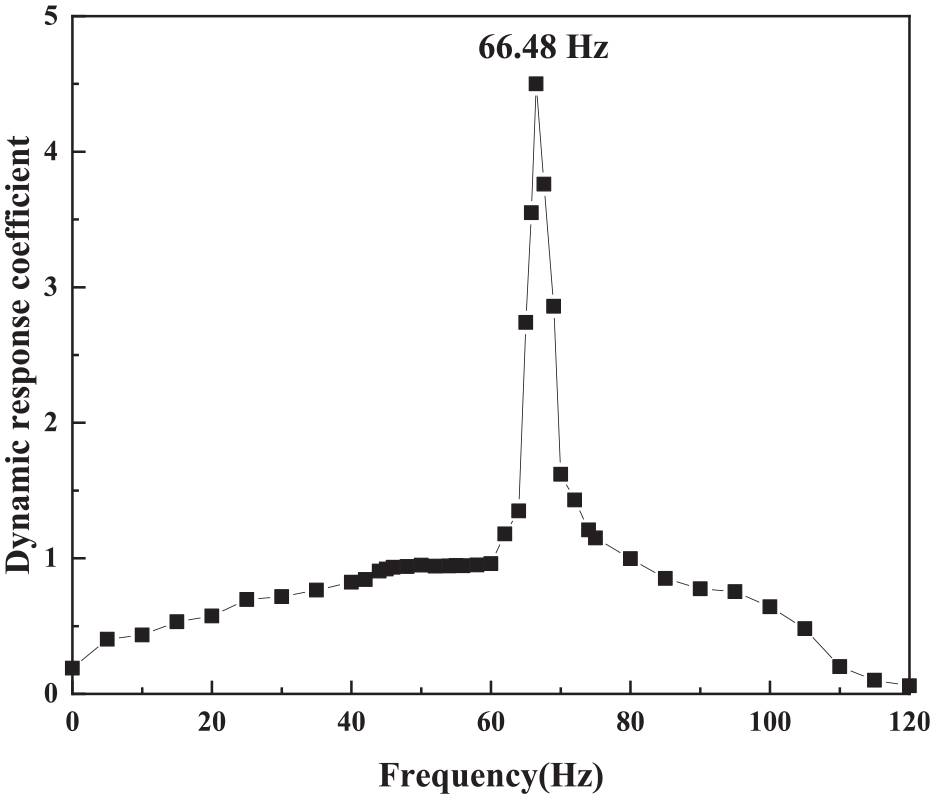
Sensor amplitude-frequency response curve.
The frequency response characteristics obtained are shown in Figure 10. The flat response range of the sensor was from 40 to 60 Hz, and the natural frequency was about 66 Hz, the two values were similar to the previous numerical calculation value of 68 Hz and the simulation calculation value of 65 Hz, which had met the measurement requirements of low-frequency seismic signals, and it also gave the sensor a certain advantage in this frequency response range. At the same time, since the whole sensor was packed and sealed, the impact of the external environment was minimized, thereby ensuring a longer service life and enabling it to make a stable response to the vibration acceleration signal after long-time operation.
Sensor linear response test
The linear response of the acceleration sensor refers to the change in the sensitivity of the sensor with the acceleration within the measurable range of the acceleration. In the sensor linear response test, the frequency of the vibration table was set to 40 Hz to apply sinusoidal excitation signals to the sensor, the test range of the acceleration was from 0g to 5g, and the step size was 0.2g. By fitting the linear relationship between the reflection bandwidth and acceleration, the fitted curve of the sensitivity of the sensor was obtained, and the slope of the curve represented the sensitivity of the sensor. Figure 11 shows the linear fitted curve of reflection spectrum bandwidth and the reflected light power at different accelerations.
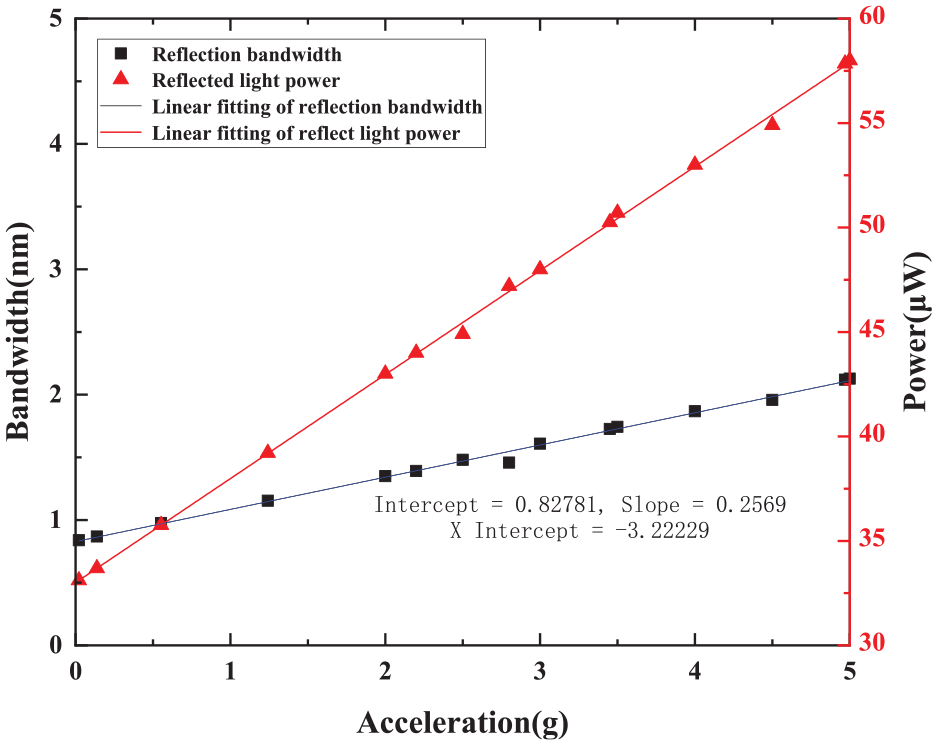
Fitted curve of reflection bandwidth at different accelerations.
It can be seen from Figure 11 that at a frequency of 40 Hz, the linear fitting result of bandwidth and acceleration yielded that the measured sensitivity of the sensor acceleration reached 256 pm/g, the linearity between the reflection spectrum bandwidth, the reflected light power and the acceleration was 0.9959 and 0.9992 respectively. The results showed that there’s a good linear relationship between the reflection spectrum bandwidth, the reflected light power and the acceleration.
Sensor temperature stability experiment
A temperature control equipment was added in the temperature experiment, the selected temperature control box was produced by Zhongke Meiqi Technology Co., Ltd., it can set temperature change program in advance, including temperature change, change time, and hold-time, and the temperature control can be accurate to 0.5°C. The temperature experiment was conducted under the condition that the sensor was subject to different accelerations (1g, 2g, and 4g), and the temperature control box was adopted to change the temperature of the environment. The initial temperature was set to 5°C and the final temperature was set to 50°C, the temperature change of each step was 5°C. When the temperature reached equilibrium at each step, it was kept for 2 min, and then the reflection spectrum of the fiber grating was recorded, after that, the data was normalized to obtain the fitting curve of the change of FBG reflection spectrum bandwidth with temperature; the slope of the fitting curve was the temperature sensitivity of the FBG, then, it was compared with the temperature sensitivity of the traditional wavelength demodulation type acceleration sensor, as shown in Figure 12.
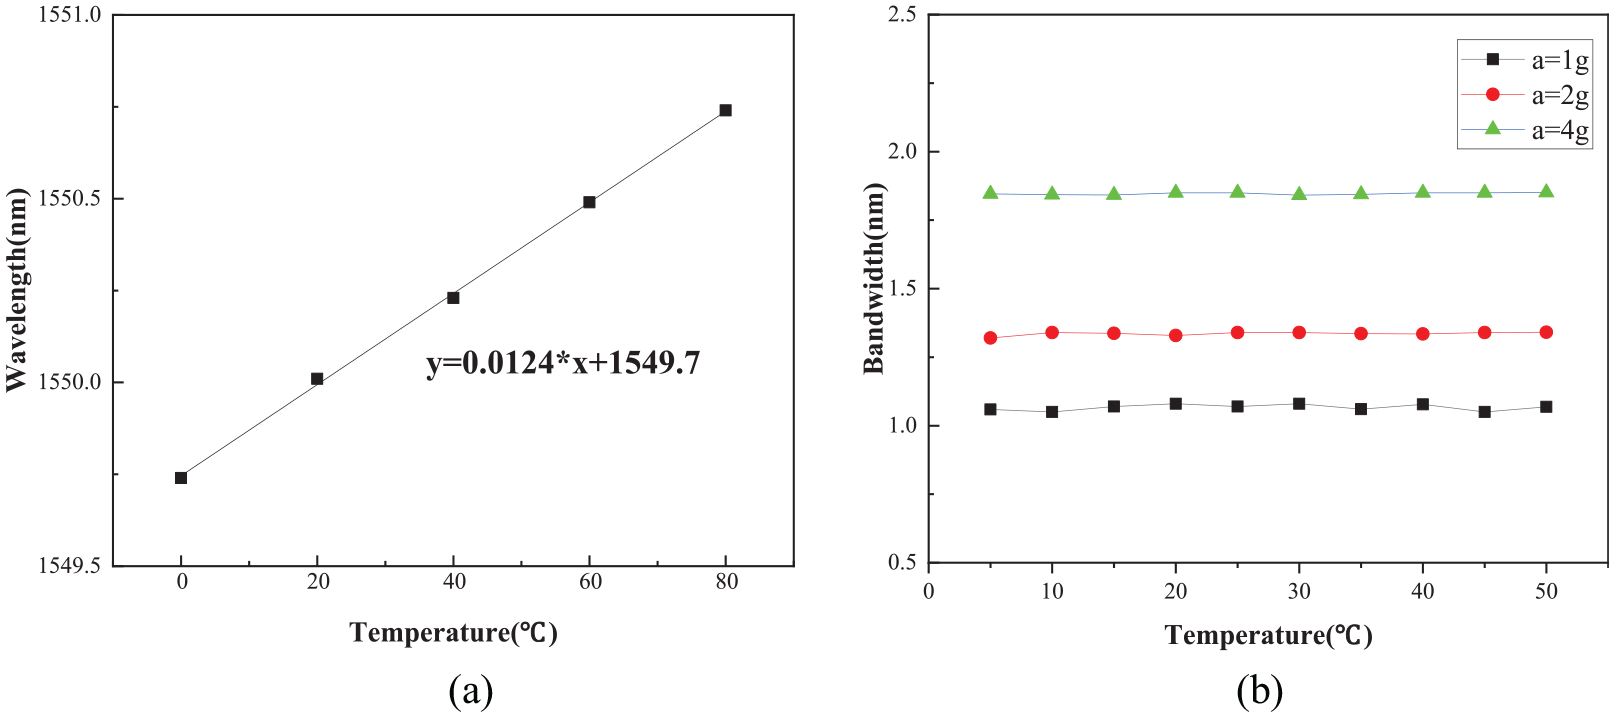
(a) Relationship between center wavelength and temperature of traditional acceleration sensor and (b) change of bandwidth with temperature at different accelerations in terms of chirp effect method.
It can be seen from Figure 12(a) that the relationship between center wavelength and temperature of traditional acceleration sensor, for traditional optical acceleration sensor using wavelength demodulation, as the ambient temperature around the grating area increased, the center wavelength of the FBG moved toward the longer wavelength direction, the FBG temperature showed a linear relationship with the center wavelength, and the temperature sensitivity was 12.4 pm/°C. Figure 12(b) shows the temperature sensitivity of the proposed sensor. The spectrometer observed that, as the temperature increased from 5°C to 50°C, under different accelerations, the change in the reflection bandwidth of the FBG basically stabilized. After calculation, the temperature sensitivity was only 0.5 pm/°C, which was significantly lower than the traditional optical acceleration sensor, and the slight fluctuation might be caused by the mismatch between the center of the fiber and the neutral layer of the cantilever beam. The results can prove that, in the vibration measurement process, the influence of temperature drift on the sensor can be ignored, and this has provided a new idea for solving the problem of temperature cross-sensitivity in seismic low-frequency vibration signal measurement.
Conclusion
This paper proposed a temperature-insensitive FBG acceleration sensor based on strain chirp effect. In the study, the uniform FBG was obliquely pasted to the surface of the cantilever beam, and the FBG acceleration sensing and temperature self-compensation had been realized by using the gradient strains and the chirp effect generated in different layers of the cantilever beam when the cantilever is bent; after that, the method was verified through theoretical calculation, simulation analysis, and tests, and the research results showed that, the proposed sensor has good performance and stability, its sensitivity can reach up to 256 pm/g, the natural frequency of the sensor is about 66 Hz; the temperature sensitivity of the proposed fiber grating is significantly lower than that of the bare fiber grating, and it is not sensitive to temperature changes, which is suitable for the high-performance detection of seismic low-frequency vibration signals. However, this research still has certain limitations and shortcomings. For the sensor proposed based on the FBG chirp method, as the reflection bandwidth widens, the reflectivity would decrease, and thus resulting in a decrease in the sensitivity. Therefore, adopting this method to realize temperature self-compensation while improving the sensitivity is of great significance for improving the sensing performance of the sensor, and this is an aspect worthy of further in-depth research in the future.
Footnotes
Declaration of conflicting interests
The author(s) declared no potential conflicts of interest with respect to the research, authorship, and/or publication of this article.
Funding
The author(s) disclosed receipt of the following financial support for the research, authorship, and/or publication of this article: This study was financially supported by the Fundamental Research Funds for the Central Universities (Grant No ZY20180241), Educational Research and Teaching Reform Project of Disaster Prevention Science and Technology Institute (Grant No JY2020A12) and the National Key Research and Development Programme of China (Grant No 2018YFC1503801).