
Abstract
State of charge (SOC) and state of health (SOH) of batteries are the indispensable control decision variables for online energy management system (EMS) in modern internal combustion engine vehicles. The real-time and accurate determination of SOC and SOH is essential to the reliability and safety of EMS operation. Obtaining good accuracy for the SOC estimation is difficult without considering SOH because of their coupling relationship. Although several works on the joint estimation of SOC and SOH of lithium–ion batteries are available, these studies cannot be applied to lead–acid batteries because of the differences in physical structure and characteristics. This study handles the problem of modeling the relationship between SOC and SOH of lead–acid battery and their online collaborative estimation. First, the structure and control strategy of a bus-based EMS is discussed, and the improper energy control actions of EMS due to the inaccurate SOC estimation are analyzed. Second, an instantaneous correlation factor β for SOC and SOH is defined as a new state estimating variable, and the simplified linear relationship model between β and open circuit voltage is established through the battery experiments. Third, a discretized augmented system equation of β is deduced according to the relationship model and the Randles circuit model. The least square circuit parameter identification (LSCPI) algorithm is presented to identify the time-varying circuit model parameters, while the adaptive Kalman filter for augmented system (AKFAS) algorithm is employed to estimate β online. A collaborative estimation algorithm is proposed on the basis of the LSCPI and AKFAS to determine SOC and SOH of lead–acid battery in real time, and a demo intelligent battery sensor is developed for its implementation. The results of battery charging and discharging experiments indicate that the proposed method has high accuracy. The estimation accuracy of SOC of this method reaches 3.13%, which is 7% higher than that of the existing method.
Keywords
Introduction
Energy saving and environmental protection are currently becoming the inevitable trend in the development of internal combustion engine (ICE) vehicles due to the pressures of environment degradation and environmental regulations. 1 To achieve this goal, an increasing number of energy management systems (EMS) are applied to the vehicles and then become an indispensable vehicular control system.2,3 For these systems, fast and accurate acquisition of battery state is the basis of realizing complex energy management functions, such as energy recovery and battery protection. 4 The battery state of charge (SOC) and the battery state of health (SOH) are the two most important battery state parameters of the EMS in vehicles. The estimation accuracy of SOC and SOH has a direct relationship with the effectiveness of EMS. 5 Accurate and rapid determination of the SOC and SOH of lead–acid batteries is a necessary condition for the complex energy management of ICE vehicles. In fact, SOC and SOH of battery are closely related; achieving good results is difficult if only SOC is considered in the online estimation. Therefore, the joint estimation of SOC and SOH has attracted the attention of many researchers. However, most works focus on lithium–ion batteries, and these studies cannot be applied to lead–acid batteries because of the differences in physical structure and characteristics. Therefore, the high-precision and collaborative estimation method of SOC and SOH for lead–acid batteries needs to be explored.
A large number of SOC and SOH estimation methods for power batteries have been proposed and applied due to the rapid development of electric vehicles and hybrid vehicles. 6 An improved SOC estimation method for lithium–ion batteries is developed on the basis of a cubature Kalman filter (CKF) supported by experimental data. The proposed CKF method has good estimation robustness and high accuracy. 7 In Ahmed et al. 8 an estimation method of the battery model parameters using the genetic algorithm for the first-order equivalent circuit model is proposed. A smooth variable structure filter (SVSF) strategy is also used to estimate the battery SOC based on the optimization model. The BP neural network is developed to capture the nonlinear relation between SOC and open-circuit voltage (OCV), and a controlled auto-regressive and moving average model is constructed and uses the relation to estimate battery SOC. 9 In Wang et al. 10 a layered modeling and residual discharge time prediction method for hybrid energy storage system with lithium–ion battery and super capacitor is proposed, which fills the blank of residual discharge time prediction of hybrid power system. The estimation error of battery SOC caused by sensor noises is analyzed theoretically and systematically. These noises include the variance and bias of voltage and current sensors of battery. 11 In Wang and Chen 12 a framework for observing the SOC and remaining discharge time of the battery using the trackless particle filter is proposed. This method improves the accuracy and convergence speed of the trackless particle filter. A multi-model probabilistic fusion estimation approach is proposed to describe battery characteristics accurately and achieve precise SOC. 13 A novel model based on co-estimator and extended Kalman filter (EKF) is used to obtain high accuracy for predicting the model parameters and SOC of battery. 14 In Tang et al. 15 a multi-gain observer is presented to solve the interference of model mismatches and sensor drifts on SOC estimation accuracy for the LiFePO4 battery. Several features, such as the differences in temperature, voltage and current, are used to depict battery aging process, and Markov chain is adopted to estimate the SOH of lithium–ion batteries. 16 In Yao et al. 17 some features of lithium–ion battery are extracted from its performance data. A mathematical model is also constructed through the changes in SOH in the data, and this model describes the relationship between the SOH and battery features. For better accuracy and robustness of SOC estimation, the joint estimator based on particle filter is proposed to reduce the cumulative errors caused by noise in current and voltage measurements. 18 In Li et al. 19 a low-order degradation model based on a single particle is established for SOH estimation. This model can quickly and accurately predict the capacity decay and voltage curve with the number of cycles and temperature changes. The proportional integral observers based on simplified physical model are used to estimate the capacity, SOC, and resistance of lithium–ion battery for reducing the SOC estimation errors caused by battery capacity degradation and resistance degradation. 20 In Huang et al. 21 the instantaneous discharging voltage, cycle life, and voltage drop of lithium–ion battery are chosen as model parameters. A multiple-parameter model is also developed to determine the SOH and SOC online. An adaptive observer is designed to determine the covariance matrix of parametric noise, and the EKF mixed with the observer together is built to simultaneously estimate battery SOC and SOH. 22 Most of the abovementioned methods fully utilize the equivalent circuit model of power battery. Thus, the estimation accuracy of SOC and SOH is closely related to the selection of circuit model and the identification of model parameters. In addition to these circuit model methods, the methods using electrochemical characteristics for battery state estimation have also been studied. In Chen et al. 23 an observer based on the enhanced single-particle model is constructed. This model uses the growth of the solid electrolyte interphase layer to estimate the SOC and aging-sensitive transport parameters. Allam and Onori 24 analyzes the battery electrochemical impedance spectroscopy (EIS) and designs an H∞ observer to estimate SOC by introducing the constant phase element into the traditional time domain circuit model. The online application of these methods in vehicles needs further research due to the need to measure battery chemistry for safety and convenience.
Studies on SOC and SOH estimates of lead–acid batteries in ICE vehicles are fewer than those of power batteries. In addition, the abovementioned power battery state estimation method cannot be directly used with lead–acid batteries due to the difference in physical structure and characteristics. In Santos et al. 25 the EKF for lead–acid batteries is constructed to estimate their SOC, and the effect of the temperature from 10°C to 70°C on the estimation is discussed. A novel SOC estimator for the lead–acid battery bank is designed on the basis of an EKF and a fuzzy model. 26 The SOC–OCV curve is established, and a dual EKF is adopted to obtain the SOC for the lead–acid battery. 27 In Soomro et al. 28 an experimental study is conducted to determine the performance of lead–acid batteries at different charging–discharging currents. An algebraic equation is established to determine the battery ampere-hour capacity and SOC. In Liu et al. 29 the state of lead–acid battery is divided into the floating state and the check–discharge state. A novel SOH determination method is proposed on the basis of different SOH models as well. For aged lead–acid batteries, the measurements of periodic EIS are compared with the capacity tests. The results demonstrate that using EIS to measure battery SOH is a feasible method. 30 In Talha et al. 31 a neural network-based SOC and SOH estimation is presented, and it is easy to implement on low-cost microcontrollers. In Bressanini et al. 32 the battery internal resistance and Coulomb counting method are used to determine the SOH and SOC of lead–acid battery, respectively. Similar to that of power battery, a coupling relationship exists between SOC and SOH of lead–acid batteries. Existing methods for the state estimation of lead–acid batteries do not comprehensively consider the relationship between SOC and SOH. Thus, they still have room for improvement in the aspect of accuracy and reliability.
For the high-precision online determination of the states of lead–acid battery, the following original contributions differentiate this study from the existing literature. First, the relationship among OCV, SOC, and SOH of lead–acid battery is analyzed by experiments. A new state estimating variable β, which denotes the correlation degree between SOC and SOH, is defined. The simplified linear relationship model between β and OCV is also established. Second, a discretized augmented system model of β is deduced according to the relationship model and the Randles circuit model. Third, an online collaborative estimation algorithm is proposed on the basis of this augmented system model to determine SOC and SOH of lead–acid battery in real time. In this method, a least square circuit parameter identification (LSCPI) algorithm and an adaptive Kalman filter for augmented system (AKFAS) algorithm are presented to identify the circuit model parameters and estimate β online.
The remainder of the paper is structured as follows. The meaning of battery SOC and SOH is described and the effect on the vehicle energy management due to its low-accuracy determination is discussed in Section 2. The SOC–SOH–OCV model from the battery experiments and a linear model of β versus OCV are presented in Section 3. In Section 4, an online least square algorithm is presented for the identification time-varying battery circuit model parameters. A linear augmented system containing β and a real-time co-estimation algorithm for the SOC and SOH are established in Section 5. A demo intelligent battery sensor is designed to measure the SOC and SOH in Section 6. Experiment results and their analysis are presented in Section 7. In Section 8, the conclusions are elaborated.
Battery states and electrical energy management
State parameters of the battery
The battery SOC is used to reflect the releasable capacity of a battery at the current time. As shown in equation (1), its value equals the ratio of battery releasable capacity to battery rated capacity, which is usually written as a percentage. The range of the SOC is usually between 0% and 100%. The battery discharges completely when SOC = 0 and the battery is fully charged when SOC = 100%. In equation (1), Creleasable is the releasable battery capacity at the current time when a battery is fully discharged, and Cinitial indicates the battery rated capacity when the battery is manufactured 33 :

The battery SOH is used to reflect the maximum releasable capacity of a battery. As shown in equation (2), the value of SOH equals the ratio of battery maximum releasable capacity to battery rated capacity. It is usually identified as 100% when the battery is manufactured and decreases as time progresses. The value of battery SOH is coupled with maximum value of battery SOC. In equation (2), Cmax represents the maximum releasable capacity of battery 33 :

Electrical EMS
Similar to the lithium–ion battery in electric and hybrid vehicles, the lead–acid battery is an important part of the vehicular intelligent EMS in ICE vehicles. 34 The battery not only can provide power to the electrical loads of the vehicle in the form of an auxiliary power source but also can participate in complex energy management, such as braking energy recovery and acceleration assistance under the control of the electrical EMS. The structure of an ICE vehicle EMS is shown in Figure 1.
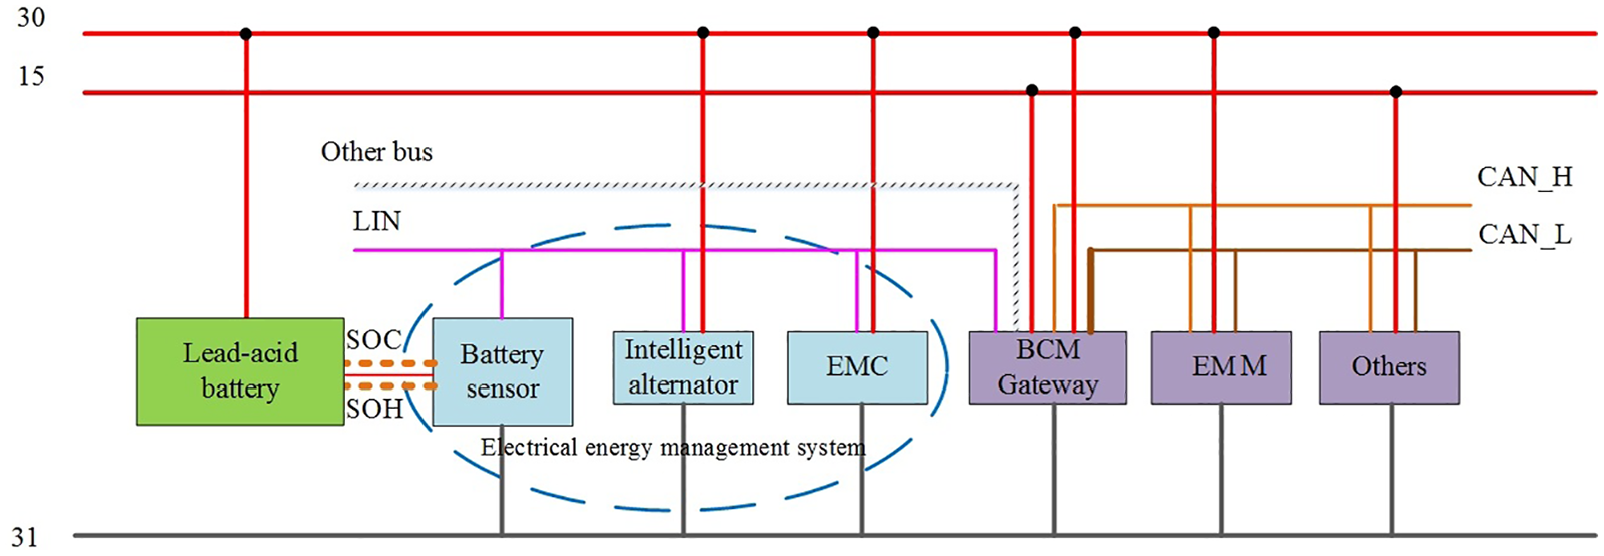
Structure of the electrical energy management system.
The electrical EMS is composed of intelligent alternator, energy management controller (EMC), and battery sensor, as shown in Figure 2(a). They can communicate with one another via the vehicular local interconnection network (LIN) bus. The battery sensor is mounted on the lead–acid battery (Figure 2(b)) and measures the current, voltage and temperature of the battery. The sensor also calculates the battery state parameters in real time. The body control module is a bus gateway, by which the EMC can collect some information, such as vehicle speed and engine torque from engine management module and some electronic control units (ECUs). The control strategies work in the EMC for electrical energy management. When the EMC obtains the SOC, SOH and other information, it dynamically adjusts the output of lead–acid battery and intelligent alternator according to these control strategies to manage electrical energy in vehicles, such as battery maintenance and braking energy recovery.
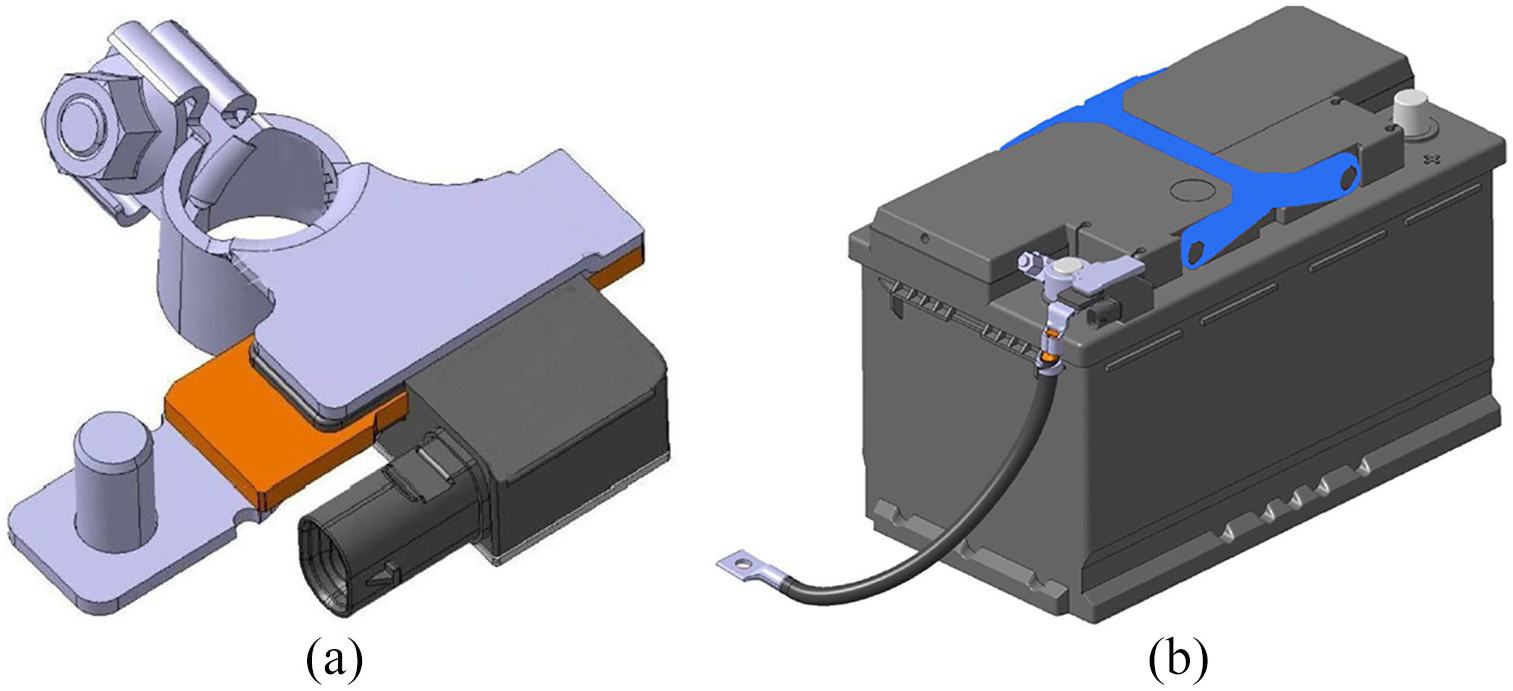
Structure of the battery and sensor: (a) battery sensor and (b) sensor mounted on the battery.
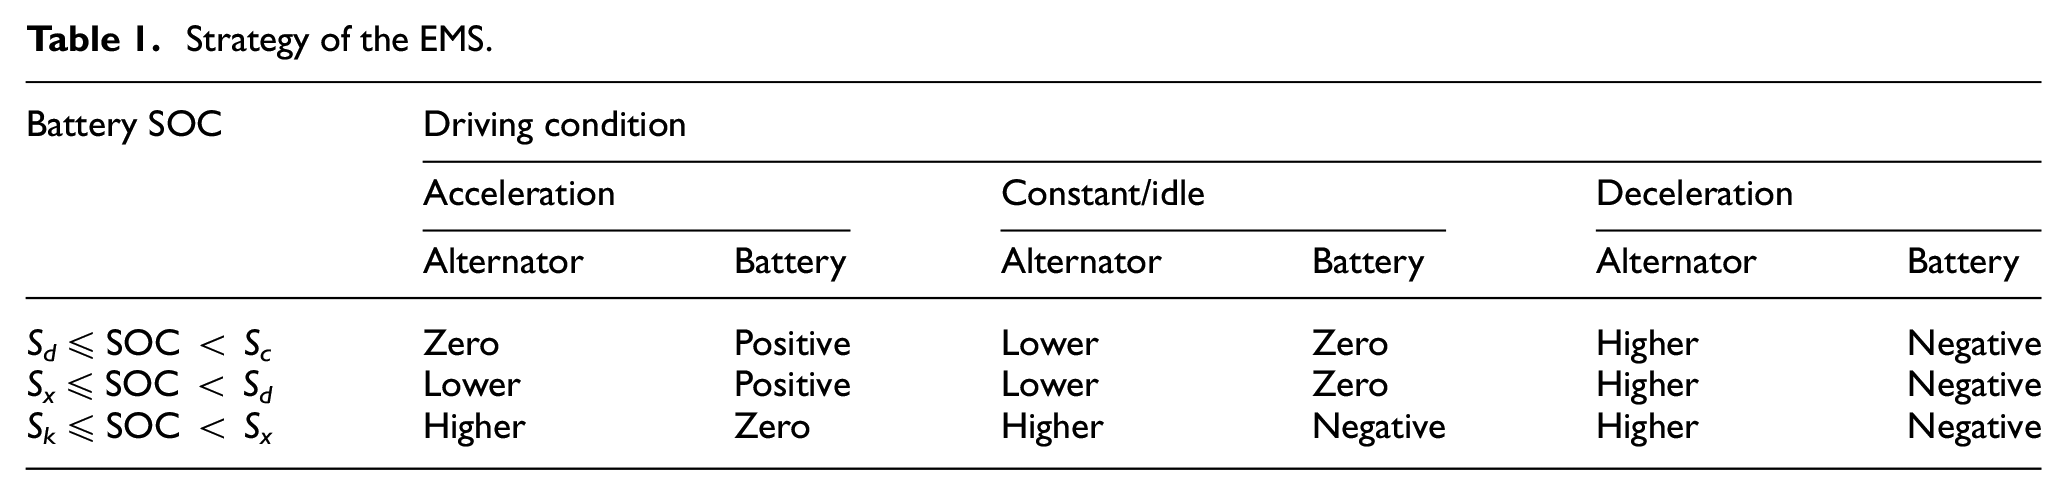
The determination accuracy of the battery state affects the actual behavior of the EMS. In Table 1, a simple energy management strategy is listed and shows the output of battery and alternator in the different driving conditions. The positive state indicates that the battery is discharging, and a negative state indicates that the battery is charging. Figure 3 illustrates that the online determination error of the SOC results in the degradation of energy management even if the strategy, driving cycle, initial SOC and alternator voltage are identical.
Strategy of the EMS.
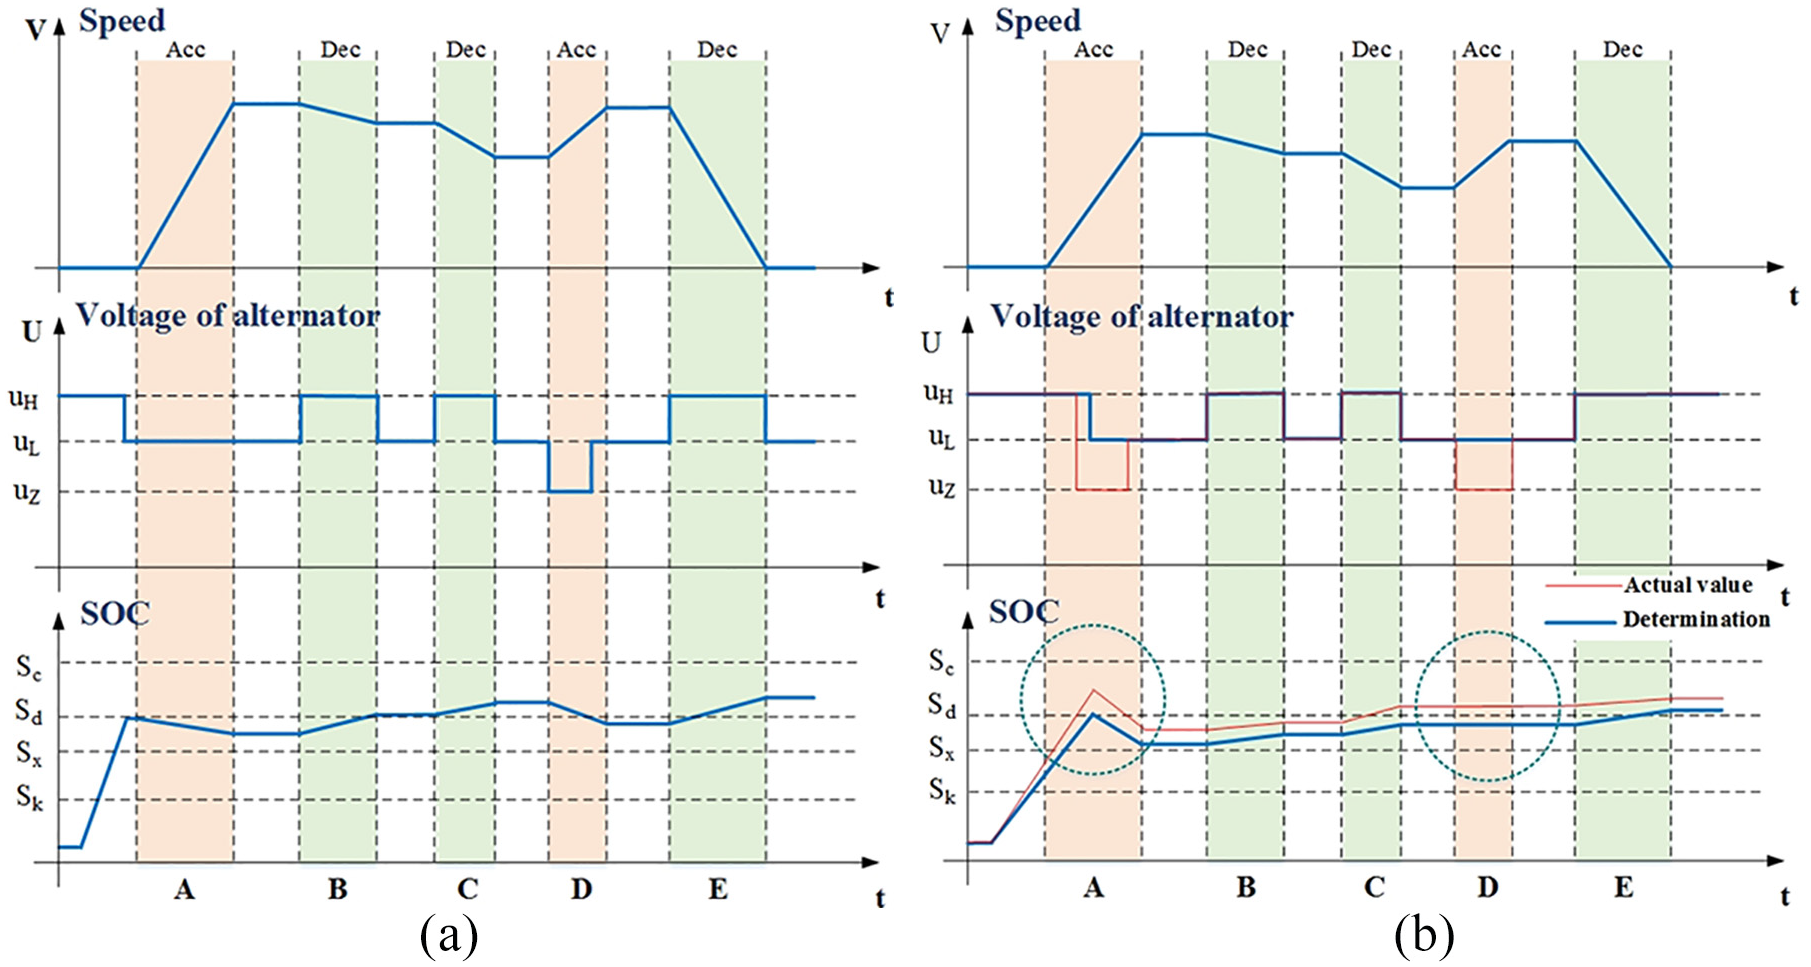
Energy management process with different SOC determinations: (a) SOC with high accuracy and (b) SOC with low accuracy.
In Figure 3, regions A and D denote that the vehicle is accelerating, whereas image regions B, C, and E denote that the vehicle is decelerating. Figure 3(a) shows the energy management process of the EMC under the correct SOC determination. When the vehicle is accelerating, the output voltage of the alternator is decreased by the EMC and the battery begins to discharge to offset the decline in the output of the alternator, thereby ensuring the need for electricity in the vehicle. The reason is that the SOC is larger than Sd, which is the threshold of the discharging state. The vehicle acceleration performance is thus improved. When the vehicle is decelerating, the output voltage of the alternator is increased rapidly by the EMC to charge the battery for the braking energy recovery if the SOC is less than the limit of the charging Sc. Figure 3(b) shows the energy management process of the EMC due to the inaccurate SOC determination.
In accelerating part A, the SOC is incorrectly considered to be below Sd, although its actual value is larger than Sd. The alternator charges the battery and does not decrease the output voltage at once until the estimation of the SOC reaches Sd. This condition results in a degraded vehicle acceleration performance compared with that in Figure 3(a). In decelerating parts B and C, the EMC increases the output voltage of the alternator to charge the battery for energy recovery and the SOC rises. However, the SOC is also considered to be smaller than Sd at the beginning of part D due to the estimation error. The battery cannot discharge, and the alternator has to keep the existing output. The vehicle acceleration performance is also degraded compared with that in Figure 3(a). The high-precision online determination of the SOC and SOH for avoiding the degradation of energy management due to a low-precision determination of the battery state is discussed in the following sections.
Correlation modeling for SOC and SOH of lead-acid battery
Correlation experiments for SOC and SOH
In general, the maximum capacity of a battery decreases with age and the battery degradation affects online accuracy of the SOC estimation. The co-estimation of SOH and SOC is necessary and beneficial to the EMS in ICE vehicles. Battery charging and discharging experiments are conducted on 25 lead–acid batteries to establish the relationship between battery SOC and SOH. The batteries are divided into five groups according to their SOH values: the groups are 100%, 72%–75%, 58%–62%, 44%–47%, and 34%–36%. All batteries are tested at 25°C. The constant voltage (CV) charging is adopted in the experiments and takes over until the battery charging current falls below 1.2 A. At intervals of 30 min, the charging process pauses, and the batteries are set aside for 1 h. Then, the OCV is measured, and the SOC is calculated. The latest maximum capacity of each battery Cmax is evaluated by the Coulomb counting method 33 at the end of every charging process. With the evaluated Cmax, the SOH can be calculated by equation (2).
The OCV and SOC of batteries in five groups of the charging experiments are shown in Figure 4(a) to (e). For each group of experiments, the battery OCV and SOC gradually increase as the battery charging process proceeds. However, the batteries with a smaller SOH have a faster SOC and OCV growth and reach their upper limit rapidly. The starting and ending OCV for the charging process decrease with the decline in SOH of battery. Therefore, in terms of the SOC, the same SOC corresponds to different OCV due to different SOH. The relationship among the SOC, SOH and OCV can be established in accordance with the previous experimental results and analysis. Their relationship model is depicted as Figure 4(f). The battery discharging experiments are similar to the battery charging experiments, and only the relationship among the SOC, SOH and OCV in the battery discharging experiments is listed in Figure 4(g) to simplify the explanation. From Figure 4(f) and (g), the coupled relationship among the SOC, SOH and OCV is clearly expressed. Evidently, the SOC is related to not only the OCV but also the SOH. The SOH is bound up with the SOC and OCV. If two of them are known, then the other can be calculated according to their relationships.
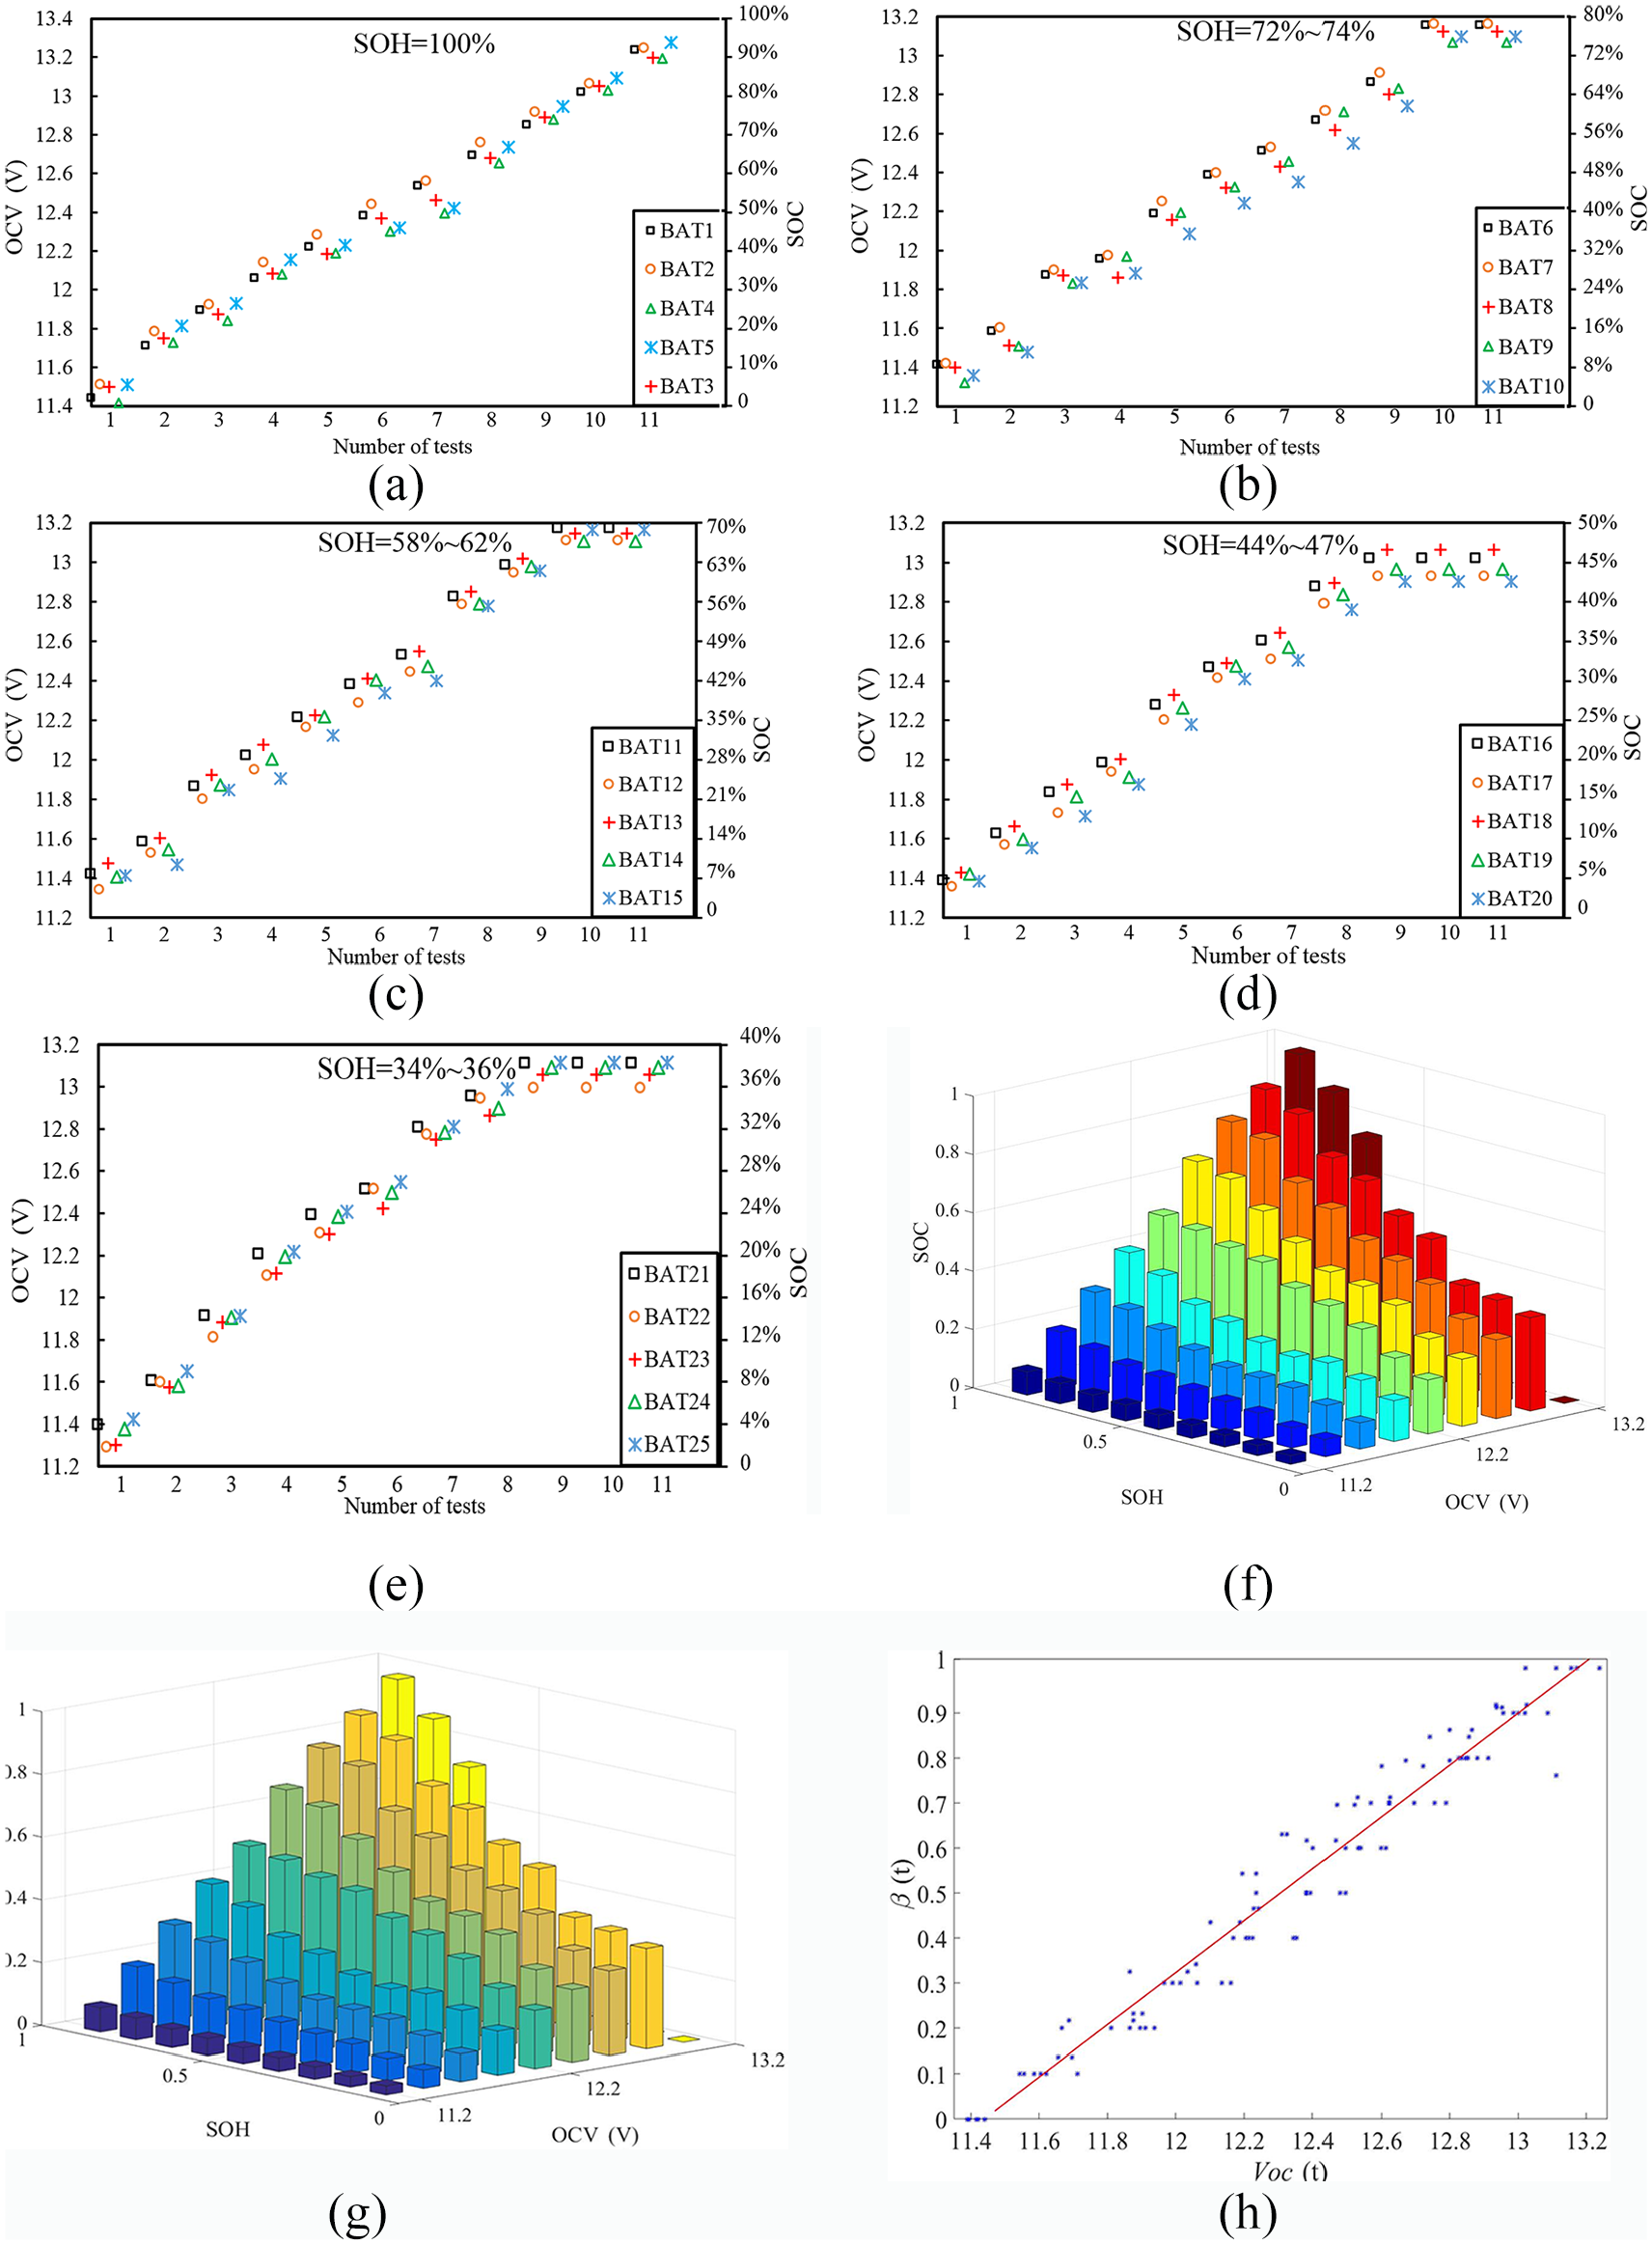
Results of battery experiments: (a) SOH = 100%, (b) SOH = 72%–74%, (c) SOH = 58%–62%, (d) SOH = 44%–47%, (e) SOH = 34%–36%, (f) coupling relation of SOC–SOH–OCV of charging, (g) coupling relation of SOC–SOH–OCV of discharging, and (h) fitting curve of β(t) versus VOC(t).
Correlation factor and linear model
The models shown in Figure 4(f) and (g) reflect the correlation among the SOC, SOH, and OCV. Therefore, the models can be used to obtain high-precision determination of battery SOC and SOH. An extra parameter β(t) is introduced for the SOC and SOH estimation to simplify the analysis and calculation. We let β(t) = SOC(t)/SOH(t). It denotes the instantaneous correlation factor, which indicates the degree of correlation of the SOC and SOH at time t. The model in Figure 4(f) and (g) can be linearized through the factor β(t). The fitting curve of VOC(t) and β(t) is shown as Figure 4(h). VOC(t) denotes the battery OCV at time t. Therefore, the linear relationship of VOC(t) and β(t) can be described as:

where KCH and

That is,

Identification of circuit model parameters
Battery equivalent circuit model
The battery equivalent circuit model is composed of networks of electrical components, such as the voltage sources, capacitors and resistors, which can simulate the electrical performance of a battery. 35 Considering the computing complexity and estimation accuracy of battery states, the Randles equivalent circuit model in Figure 5 is used for the lead–acid battery in this study. 27 In the circuit model, Rt is the polarization resistance in the battery. Cs is the capacitance between the two counter electrodes. Rd and Cb are the self-discharging resistance and the energy storage capacitor, respectively. Rt and Cs describe the instantaneous influence of polarization of the battery.
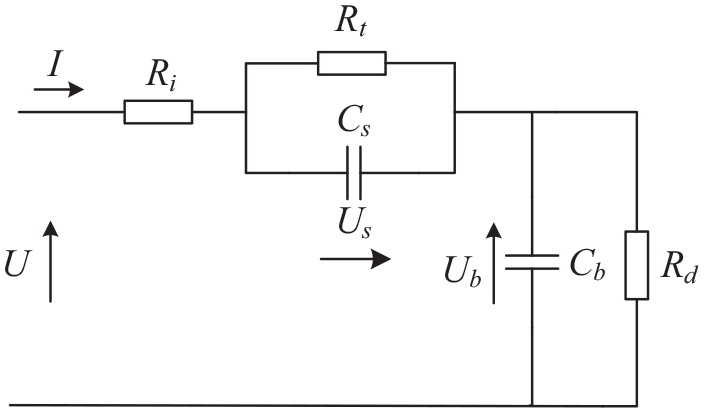
Battery equivalent circuit model.
In accordance with the circuit shown in Figure 5 and Kirchhoff’s law, the circuit equation can be expressed as:


where Ub is the voltage between the two ends of capacitor Cb, Us is the voltage of the capacitor Cs, U is the terminal voltage, I is the current across whole circuit, and Ri is the ohmic internal resistance.
Online identification of model parameters
The circuit model parameters of battery are time varying. In practical engineering applications, if the time-varying factors are ignored and fixed model parameters are used, then the estimation accuracy of the SOC and SOH will be affected. 29 Therefore, these circuit model parameters need to be identified online to obtain better determination. The Laplace transforms of the voltage U and current I in the equivalent circuit model can obtain the input–output relationship of the circuit model as follows:

Using the bilinear transformation method to a transfer function G(s), the following discrete form of G(s) can be obtained 33 :

Considering the relationship of the input and the output of (10), the following condition exists:

where d, e, a, b and c are coefficients and can be calculated using equation (12):
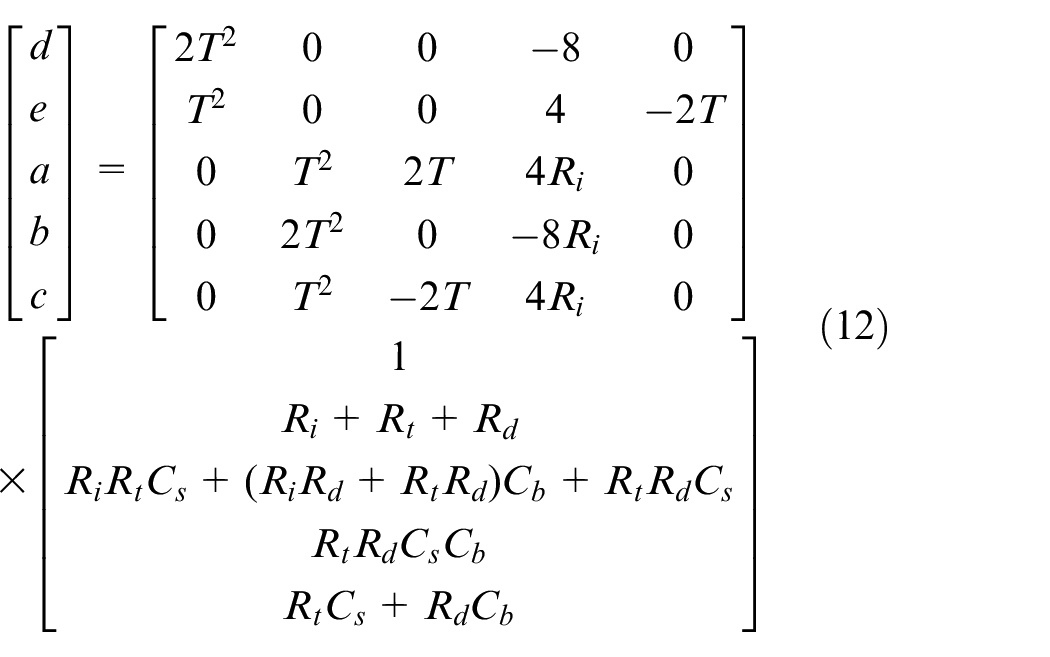
We set the coefficient vector θ = [d, e, a, b, c]
T
. If θ is known, then parameters Ri, Rt, Cs, Rd, and Cb can be calculated by equation (13), which is derived from equation (12). We denote the covariance matrix of θ as
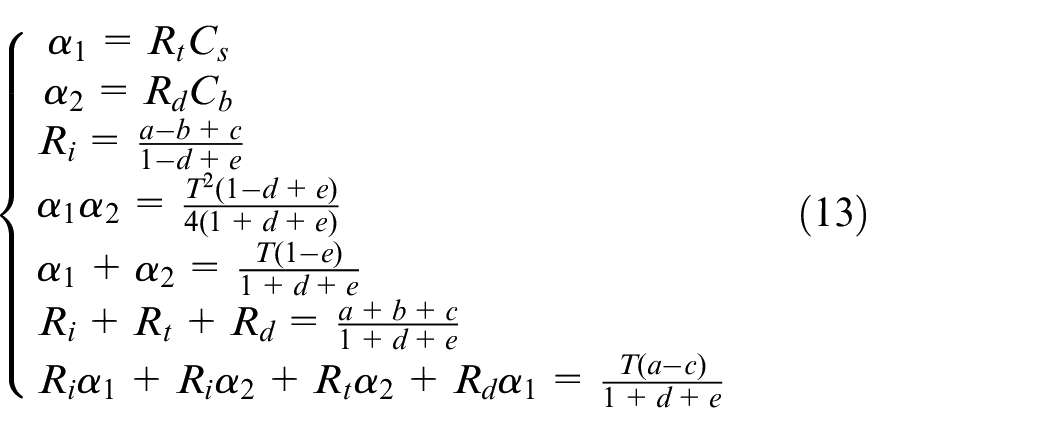

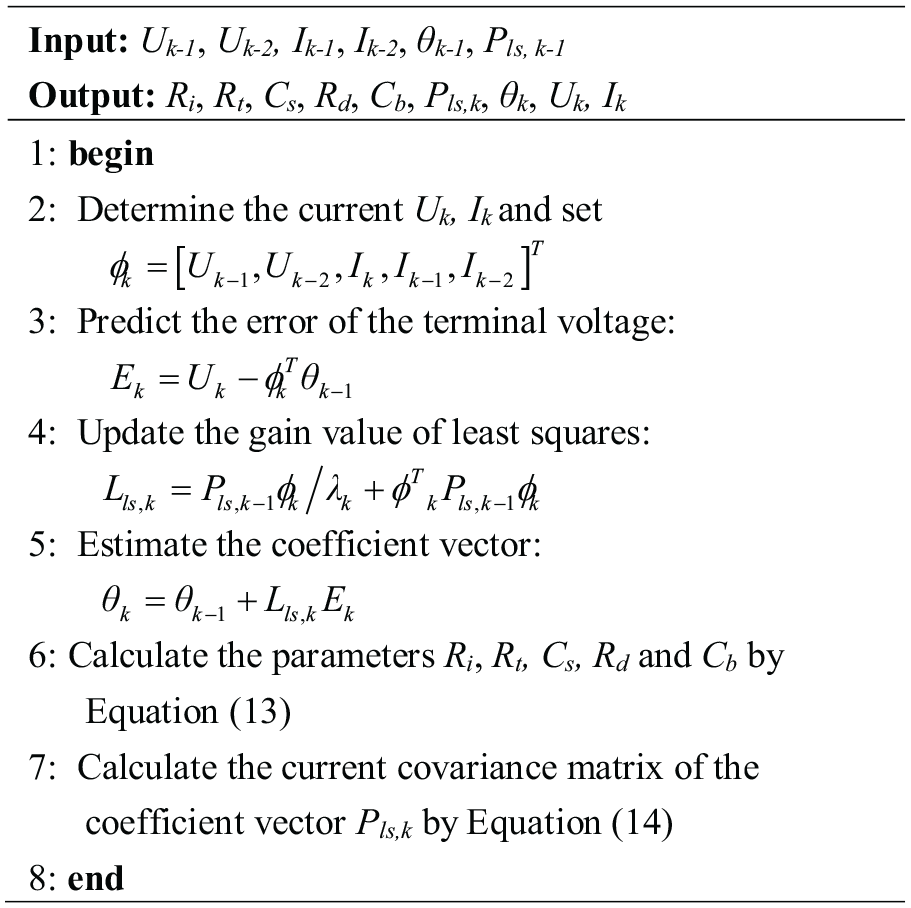
LSCPI algorithm for parameter identification.
First, the LSCPI algorithm calculates the error of terminal voltage Ek and the gain of least square Lls, k by using the covariance matrix
Co-determination of the SOC and SOH
Augmented co-relation system model
The voltage Ub at the two ends of the capacitor Cb in Figure 5 can be taken as the OCV of battery, VOC. Substituting Ub,

Introducing equation (15) into equation (8) yields:

By defining the state variables as x1(t) = β and x2(t) = Us and the system input as u(t) = I and y(t) = U in accordance with equations (6), (7), and (16), the battery system equation is expressed as:


where


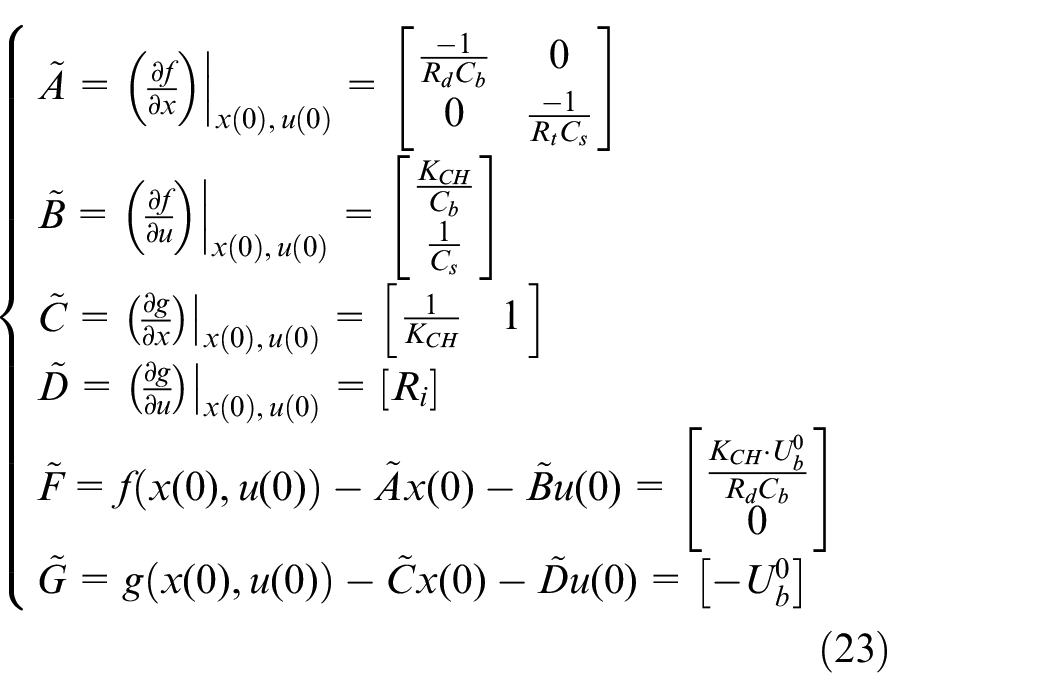
At each sample time, if a first-order Taylor series expansion is used to linearize systems (17) and (18) around the current operating point, then the linearized model of the system can be obtained as:

where
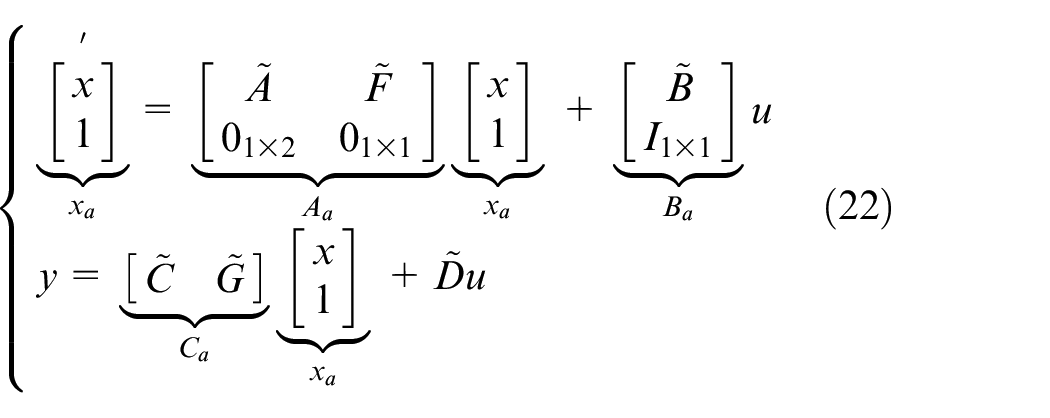
The linearized system (21) can be augmented and represented as (22) to remove the input–output direct feedthrough in accordance with the standard formulation of the Kalman filter presented in the subsequent section. In the augmented system (22), xa is the state vector, which is a three-dimensional column vector, while Aa, Ba, and Ca are the coefficient matrices. Furthermore, the matrix I is the unit matrix.
Collaborative estimation of SOC and SOH
The parameters Ri, Rt, Cs, Rd, and Cb are identified by the least square algorithm at times k. Then, Aa, Ba, Ca, and

where Ak = I+AaT, Bk = BaT, Ck = Ca, and Dk =
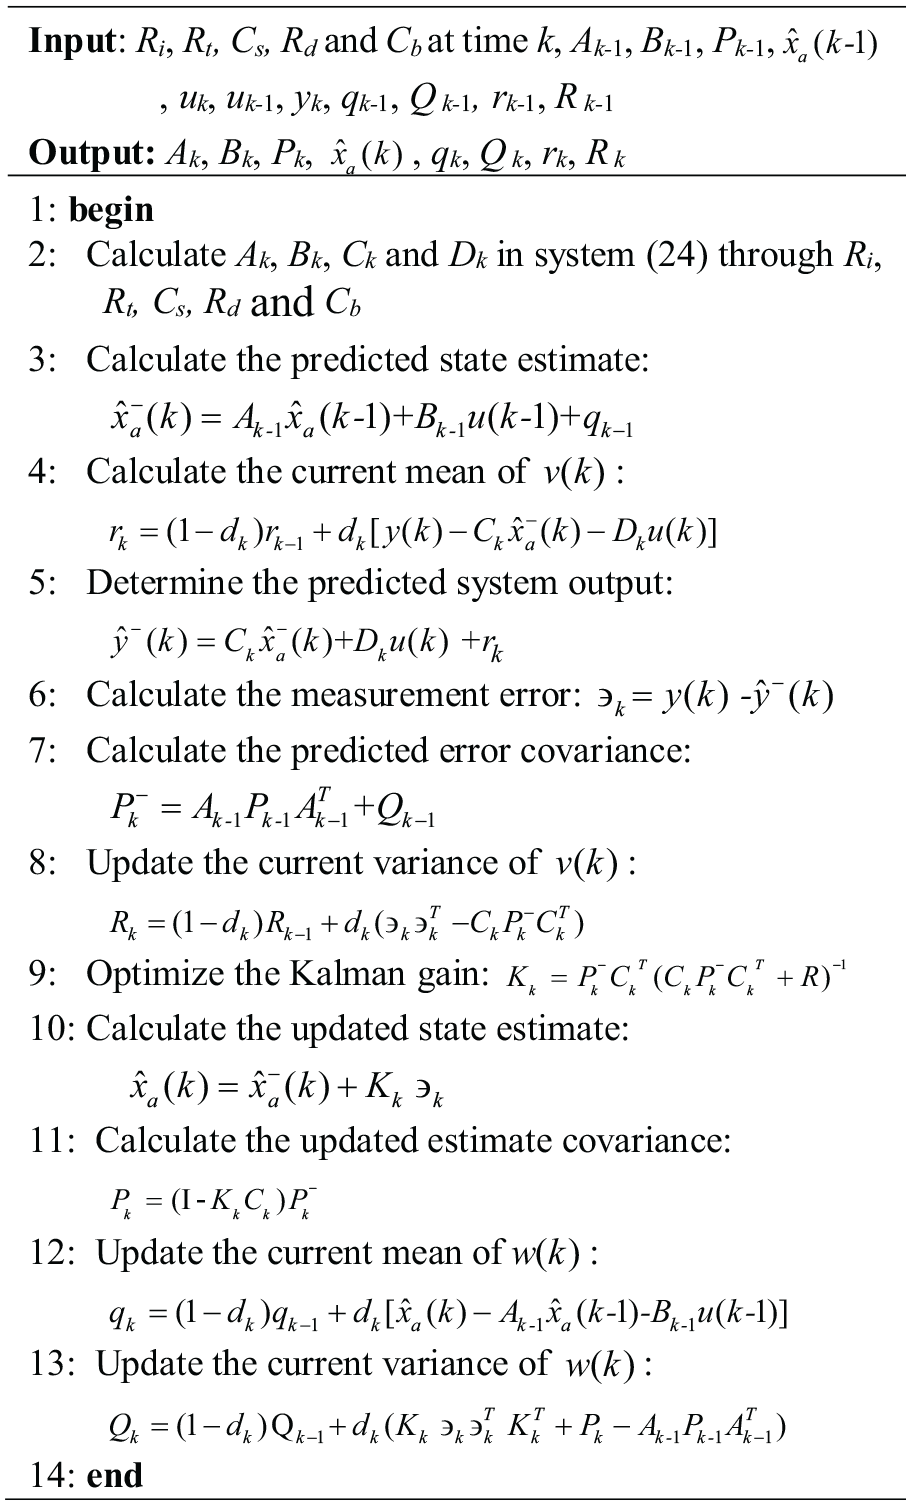
AKFAS algorithm for an augmented system.
As discussed in Tran et al. 36 a linear relationship exists between the capacitance Cb and the SOH. The relationship can be derived and represented as:

where Cb0 is the initial value of Cb, p is a constant, and Q0 is equal to the rated capacity of battery. They can be determined by the charging–discharging experiments and analysis of the battery.
At time k, the capacitance Cb is obtained from the LSCPI algorithm. Accordingly, SOH can be derived from equation (25). The state xa can be estimated by the AKFAS algorithm at time k. Given that x1(t) = β and β = SOC /SOH, SOC can be easily calculated from SOC = β·SOH when SOH is known. An online algorithm for collaborative estimation of battery SOC and SOH can be established by combining the abovementioned algorithms and is shown in Figure 8. The co-estimation algorithm uses a cascaded combination of the LSCPI and AKFAS algorithms to determine battery SOC and SOH simultaneously. Notably, steps (11)–(15) of the algorithm ensure that the variables Ak, Ak−1, and Bk−1 can be initialized.
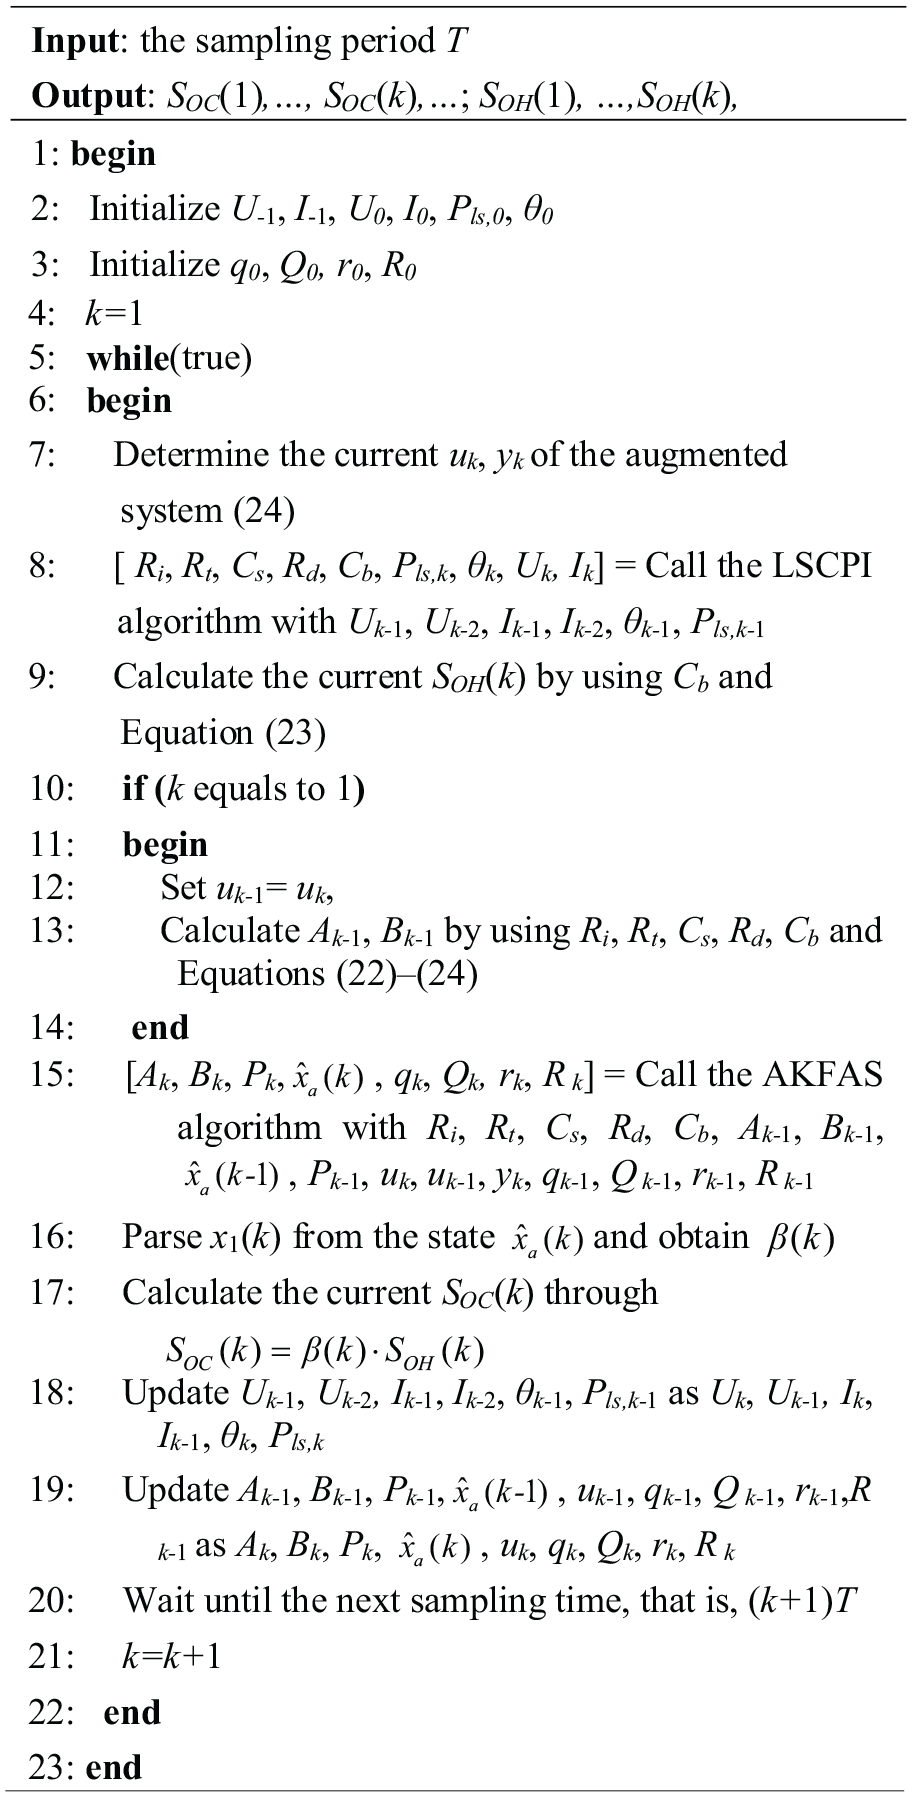
Collaborative algorithm for determination of SOC and SOH.
Intelligent battery sensor
A demo intelligent battery sensor is designed on the basis of the previous collaborative algorithm of SOC and SOH. The sensor structure is presented in Figure 9. The demo sensor consists of two parts, namely, Part I and Part II. Part I mainly measures battery voltage, current and temperature and estimates the model parameters and the SOH. Thus, this part contains the measurement circuit, the A/D converter and the MCU1. On the basis of the information from Part I, Part II estimates the OCV and SOC of the battery and sends them to other ECUs in a vehicle.
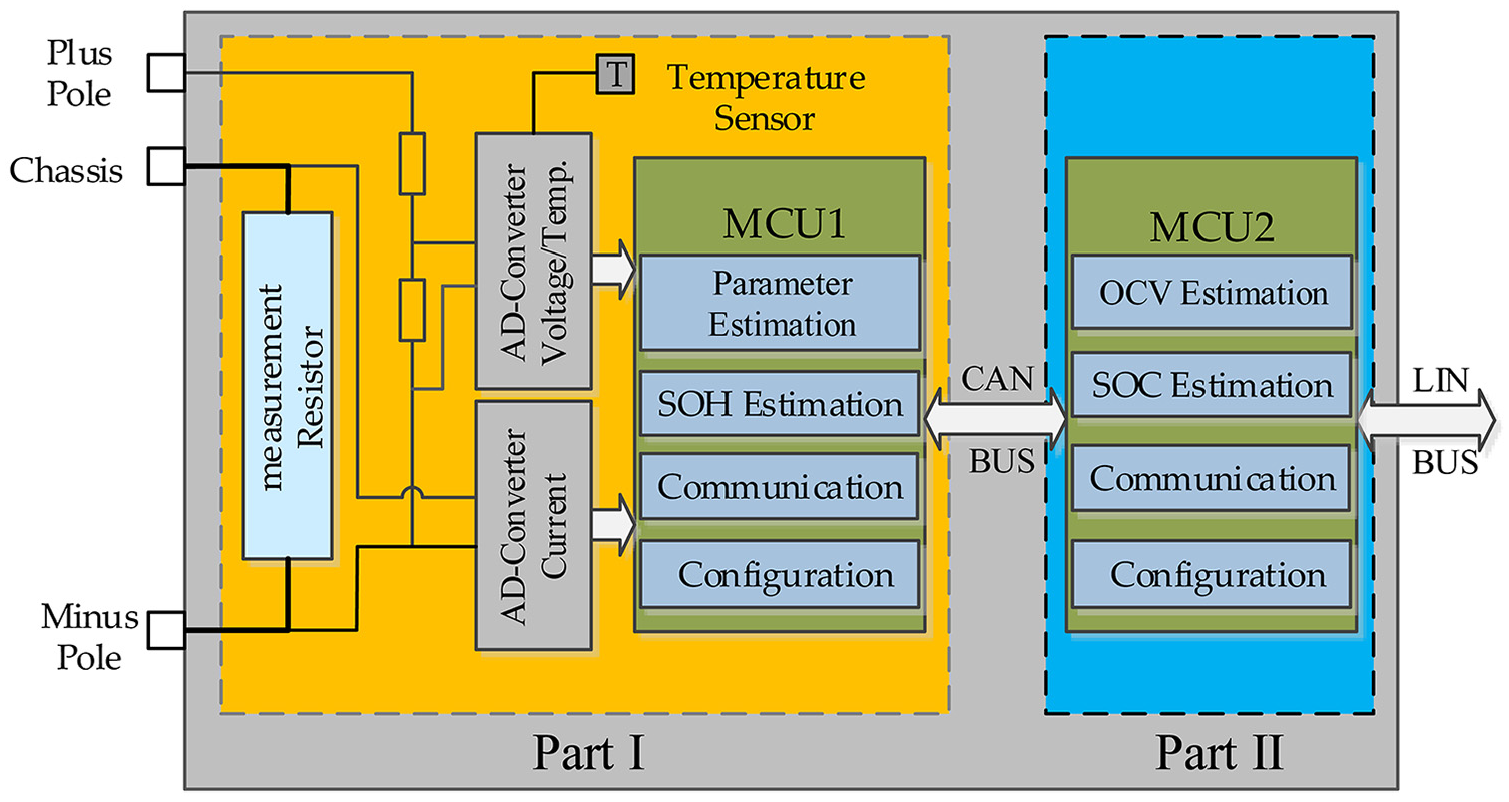
Intelligent battery sensor.
A high-speed controller area network (CAN) bus is used, and the data are transmitted at 500 kbps to guarantee real-time communication between Parts I and II. The CAN frames have two types, namely, the data and configuration frames of CAN. The data frame of CAN contains the voltage, current, temperature, parameters Ri, Rt, Cs, Rd, and Cb, and SOH of battery. The configuration frame of CAN is used to initialize the parameters and operating mode of Part I. The LIN bus is used to implement the communication between the demo sensor with the other ECUs. The baud rate is then increased up to 19.2 kbps. The LIN frames also have two types, namely, the data and configuration frames of LIN. The data frame of LIN contains the voltage, current, temperature, SOH, and SOC. By contrast, the configuration frame of LIN contains some information about the initialization and control of the sensor.
Furthermore, a supervisory system is developed in the CANoe. 37 The supervisory panel of this system is shown in Figure 10. The system communicates with the demo sensor via the LIN bus to verify the performance of the demo sensor conveniently. In the supervisory system, each LIN node simulates an ECU in the vehicle. The information, such as SOC, SOH, current and voltage, in the data frame of LIN is parsed and displayed in the panel. The total amount in the battery discharging and charging process can be calculated. The different frame IDs can be configured in the panel for different ECUs of vehicular EMS.
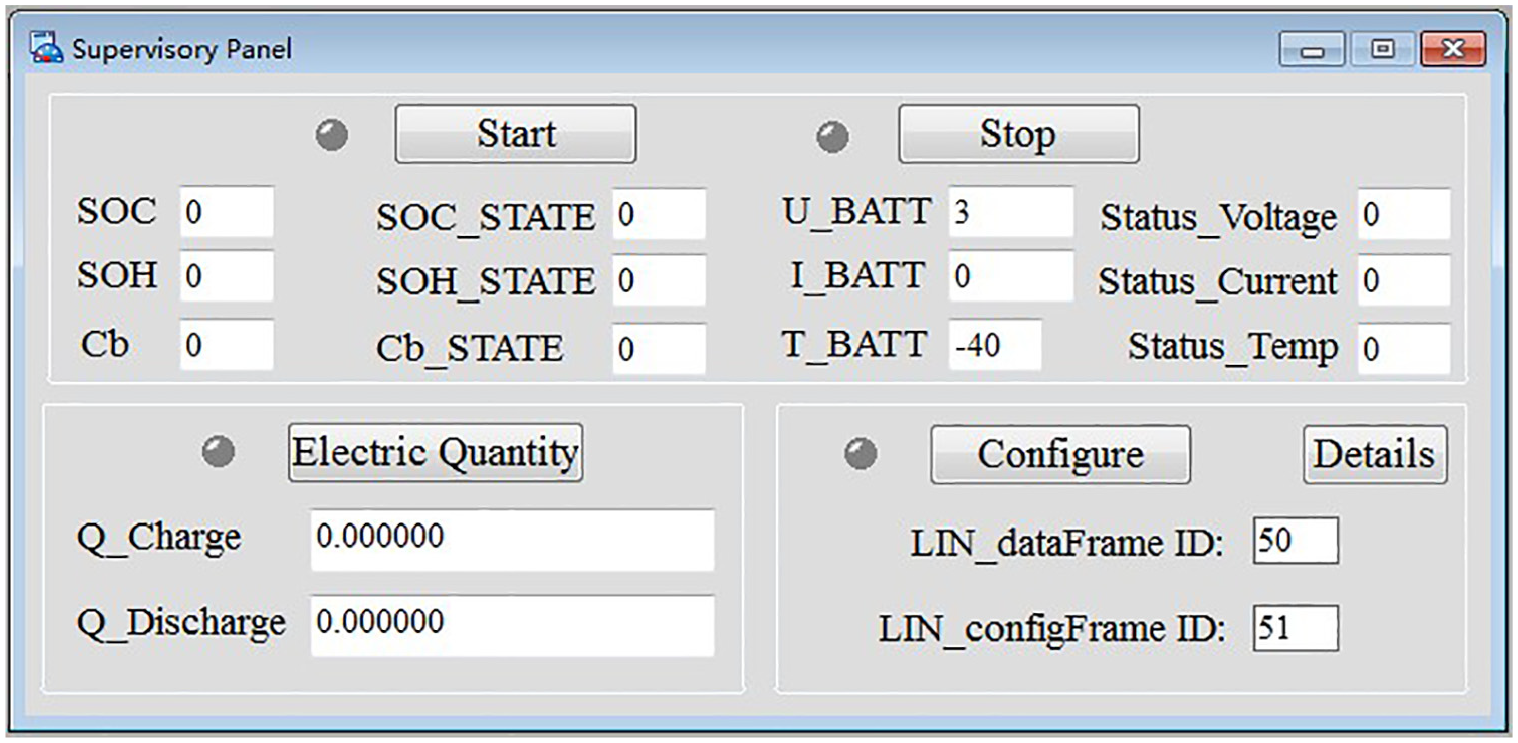
Supervisory panel in the CANoe.
Experiments and result analysis
Experimental system
The battery experimental platform in Figure 11 is established to validate the proposed method. This platform consists of a demo intelligent sensor, a supervisory system, a discharging instrument, a charging instrument, and a lead–acid battery. Part I of the demo sensor is mounted on the battery anode and connected with Part II through the CAN bus. A CANcaseXL 37 supports the LIN bus and connects the supervisory system to Part II.
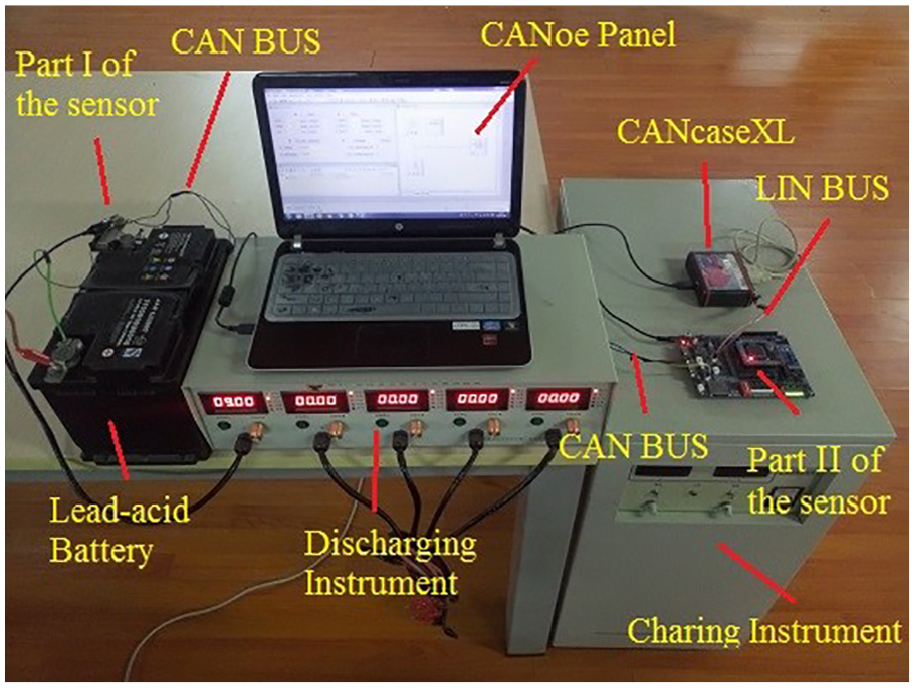
Battery charging and discharging experimental platform.
In the experimental platform, two AGM lead–acid batteries with a rated capacity of 70 Ah are subjected to a constant current discharging and CV charging test. The curve of battery current in the discharging and charging are shown in Figure 12. The whole experiment consists of four parts: a discharging process of 4500 s, a charging process of 4500 s, a discharging process of 4500 s, and a charging process of 4500 s. The SOH values of two AGM batteries are approximately 85% and 53%, receptively. The SOH and SOC are calculated in accordance with the voltage and current of the batteries.
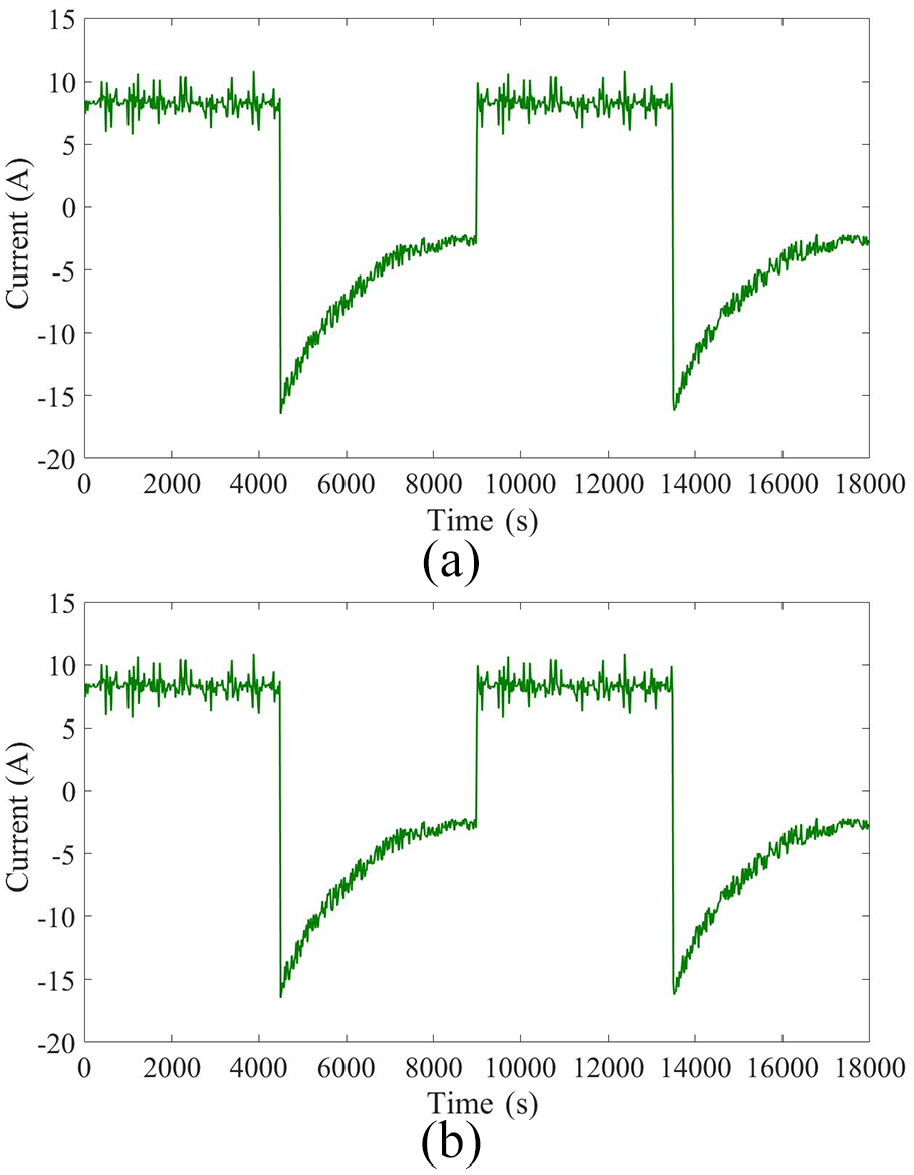
Experimental discharging and charging current: (a) current changes when SOH = 85% and (b) current changes when SOH = 53%.
SOH estimation results
Figure 13 displays the results of the parameter Cb of the two batteries with different SOH from the proposed method. As shown in Figure 13, the estimated Cb values are close to the true values in a limited time. Therefore, the estimation method of Cb based on the least square works well and can effectively identify the model parameters of the batteries.
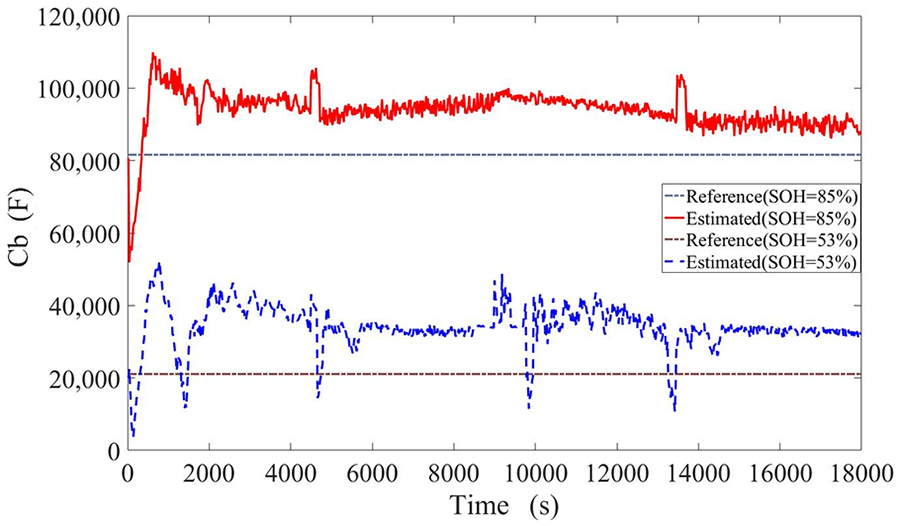
Results of the Cb estimation.
The results of the SOH estimated by the proposed method are shown in Table 2. The estimated values and the corresponding errors at nine different times are listed.
Results of the SOH estimation.
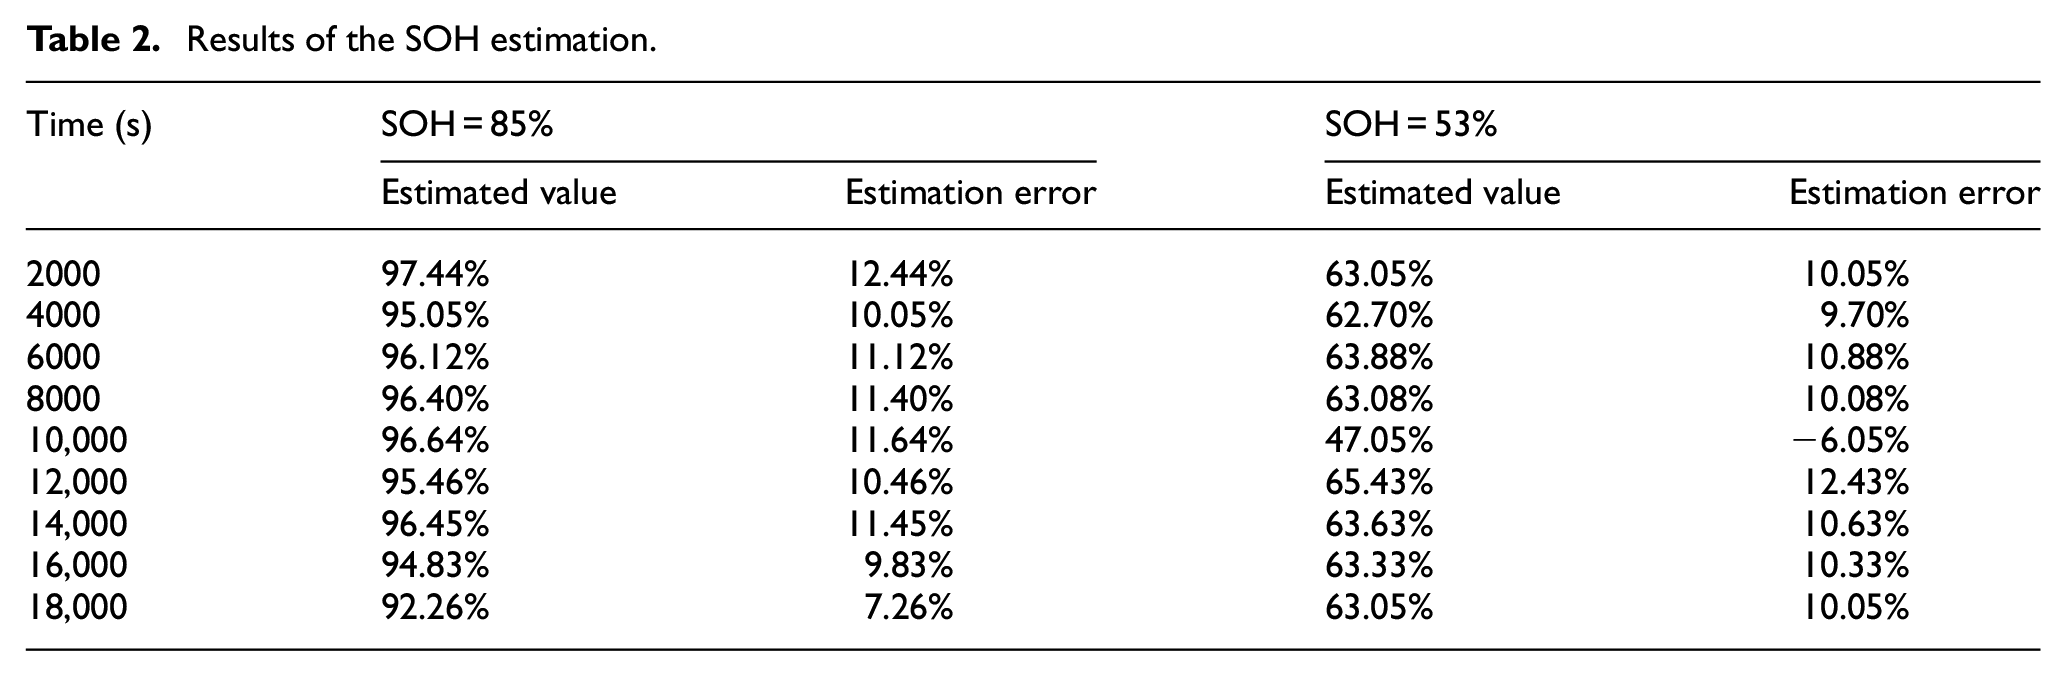
The estimated values of the SOH vary as time progresses, the estimated values of the SOH vary as time progresses, and the estimating errors of the SOH decrease. At t = 18,000 s, the estimated value of the SOH of one battery is 92.26%, whereas that of the other battery is 63.05%. The estimation errors are 7.26% and 10.05%. The estimated values of the SOH approach the reference values within an acceptable error range. This condition shows that the proposed method can quickly obtain the SOH of the battery.
SOC estimation results
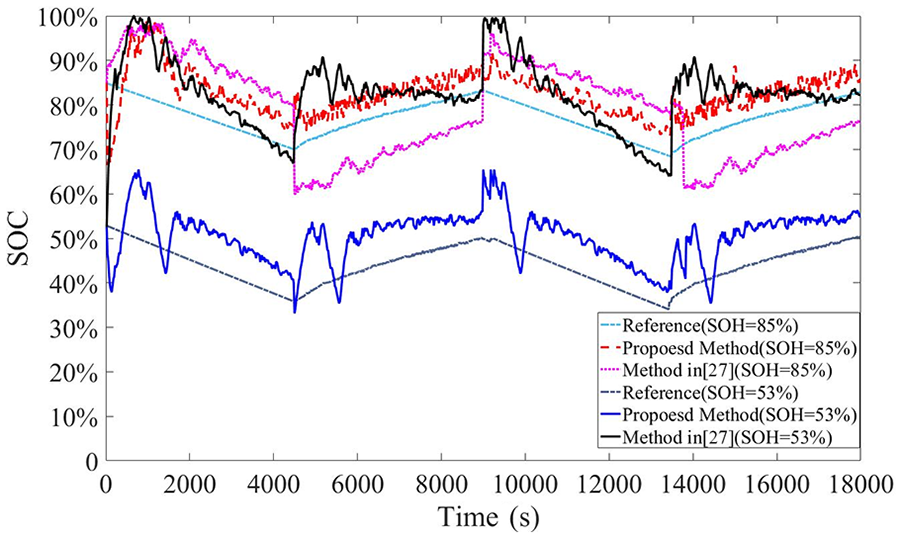
The results of battery SOC estimated by this proposed method are shown in Figure 14. For comparison, the results from the method in Wang et al. 27 are also shown in the figure. The SOC values from the two methods drop after initial fluctuations and converge to a certain value. However, for the battery with SOH = 85% and the battery with SOH = 53%, the SOC values from the proposed method are close to the references. By contrast, those from the method in Wang et al. 27 deviate far from the references. Compared with the SOC references, the estimation errors of the two methods are completely different. The estimation errors of the SOC at nine different times are selected and shown in Table 3.
Results of the SOC estimation.
Estimation errors of the SOC.
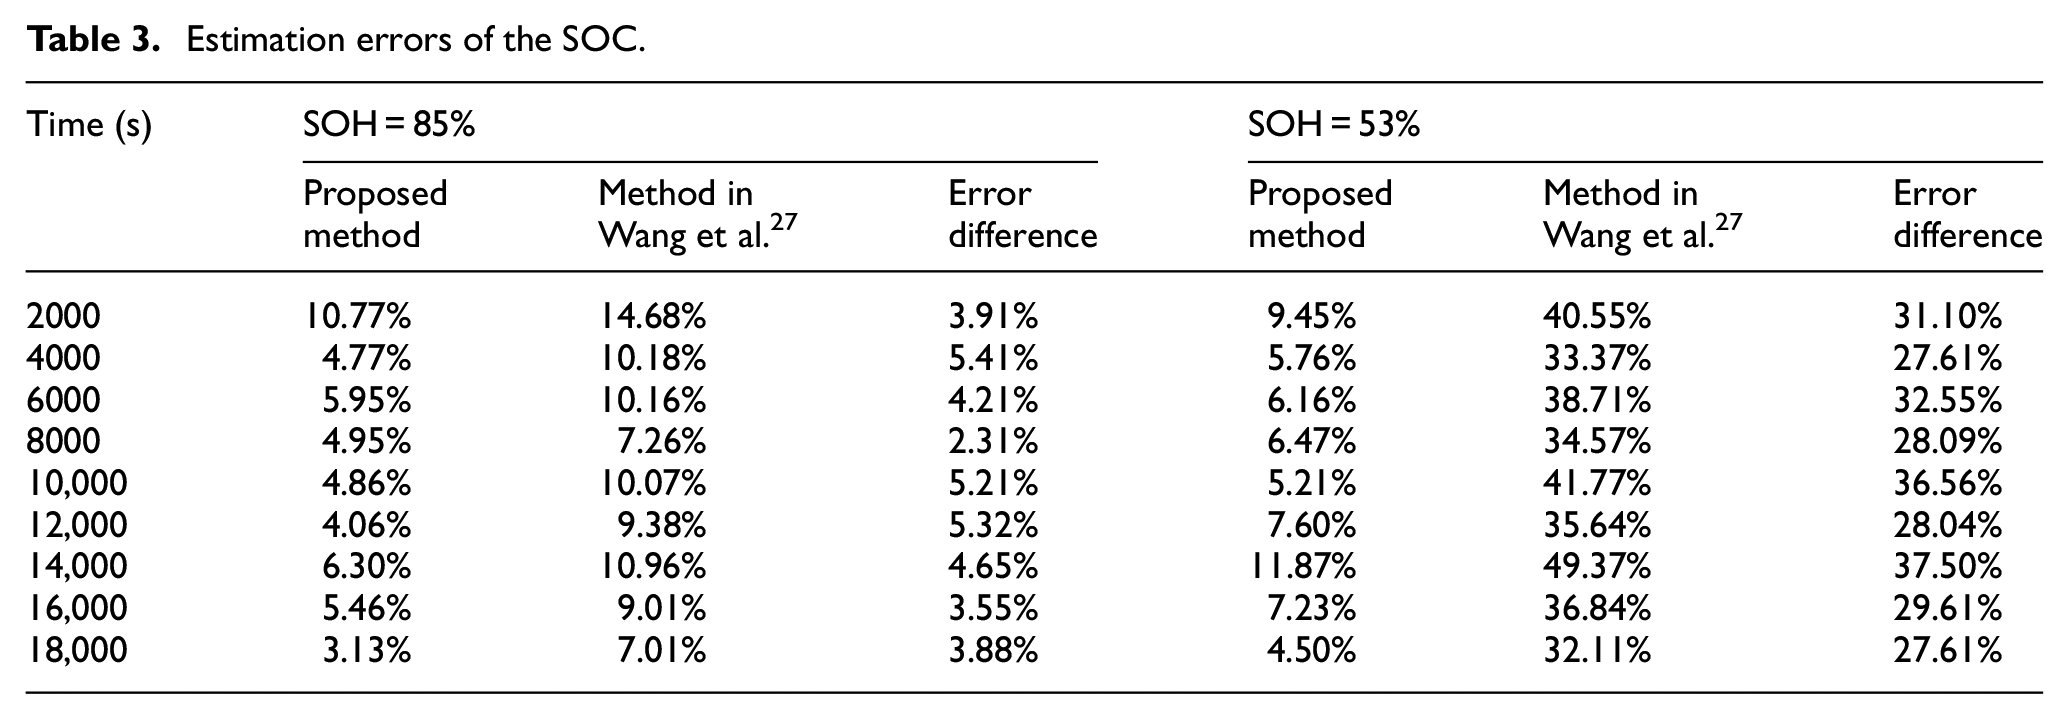
Table 3 lists the SOC errors estimated from the proposed method and the method in Wang et al. 27 When t = 18,000 s, the SOC estimation errors from the proposed method are 3.13% and 4.50% when the SOH is 85% or 53%. The errors of the method in Wang et al. 27 are 7.01% and 32.11%. The latter is larger than the former. The corresponding error differences are up to 3.88% or 27.61%, which indicates that lower battery SOH means greater SOC error estimated from the method in Wang et al. 27 Furthermore, a comparison of average estimation errors in Table 3 shows that the proposed method has 5.58% and 7.14%, whereas the method in Wang et al. 27 has 9.86% and 38.10%. Similar to this moment, the data at other moments also show the same trend. Evidently, the proposed method presents a higher SOC estimation accuracy than the method in Wang et al. 27 This result is due to that the proposed method introduces new estimating factor β and fully considers the effect of SOH on the SOC estimation, whereas the method in Wang et al. 27 does not. Such an effect intensifies with the reduction in the SOH of battery.
Conclusion
The lead–acid battery in ICE vehicles is not only auxiliary power but also one of the important parts of vehicular EMS. The accuracy and speed of online battery state estimation greatly affect the reliability and robustness of energy management. The relationship between SOC and SOH of lead–acid battery is analyzed, and a new state estimating variable β is introduced. A discretized augmented system model is established for the collaborative estimation of SOC and SOH, and the online collaborative estimation algorithm is proposed to determine SOC and SOH of lead–acid battery in real time. The algorithm considers the relationship between SOC and SOH and uses the least square method and adaptive Kalman filter to identity circuit parameter and estimate battery states. The results of battery experiments indicate that the proposed method has high accuracy and speed of online estimation.
In the future, the influence of temperature will be further studied to improve the robustness of the method. The complexity of the proposed algorithm will be further discussed to ensure its implementation in a low-cost microchip. This way facilitates its wide application in the EMS of ICE vehicles.
Footnotes
Declaration of conflicting interests
The author(s) declared no potential conflicts of interest with respect to the research, authorship, and/or publication of this article.
Funding
The author(s) disclosed receipt of the following financial support for the research, authorship, and/or publication of this article: This work was supported in part by the National Natural Science Foundation of Anhui (1708085MF157) and the Project of Jianghuai Auto.(W2020JSKF0274).