
Abstract
In this study, we have developed a thin film adhesion evaluation system for diamond coating tool, which is mainly used for CFRP processing. CFRP is widely used in aviation and automobile industries. Because of the high surface hardness of the diamond coating tool, it is difficult to evaluate the adhesive strength of the tool, and it is difficult to quantitatively evaluate the existing adhesion force evaluation method and it is costly. This study has developed an evaluation method to measure the adhesive force based on the data of the grinding process using a low-cost polishing pad. When the frictional force and the shearing force are applied to the specimen by the sanding belt, friction is continuously generated between the coating layer and the belt, and peeling occurs at the moment when a specific load is applied. Acceleration, load, and torque values that occur during each experiment are collected through acceleration sensors, load cells, and torque sensors. The data obtained through the experiments are subjected to FFT processing and analysis. As a result, the peeling point and the critical load value at this point are identified and referred to as the adhesion force of the coating layer.
Introduction
Among the carbon fiber composite materials, the carbon fiber reinforced plastic (CFRP), which is a plastic material, is lightweight, has excellent strength and rigidity and has been used in the aerospace and defense industries. In recent years, efforts have been made to improve fuel efficiency by using lightweight materials to reduce carbon dioxide emissions and solve global warming problems, especially in transport tester. Accordingly, there is a growing demand for carbon fiber-reinforced plastics, which are necessary materials for lighter weight. However, the CFRP is difficult to be cut/machined into shapes.
NCD tool can be used to cut/machine the CFRP into shapes.1–3 Diamond-coated tools are coated in the manner of Micro Crystalline Diamond (MCD) and Nano Crystalline Diamond (NCD). 4 In this paper, NCD drill was selected as the specimen.
An important factor in determining the performance and durability of diamond coated tools is the adhesion between the base material and the coating layer. The adhesive force is defined as the critical load at the time of peeling, and there are various methods such as scratch test, indentation test, and tape test. The most widely used test method is the scratch test. In the scratch test, a force is applied to diamond particles to leave scratch marks on the coating layer, and the adhesion force is measured by analyzing the scratch marks. However, there are many factors that determine the adhesion of the coating layer such as the moving speed of the indenter, the thickness of the coating layer, and the biggest problem is that quantitative values are not obtained 5 and the expensive cost of the diamond indenter is high.
In this paper, we developed a new adhesion evaluation method to measure the adhesion between the coating layer and the base metal, quantify the adhesion of the coating layer, and reduce the test cost by using a polishing pad as a substitute for expensive diamond indenter with short life span.
The coating layer adhesion test tester designed and fabricated by using the Abrasion Tester touched the rotating abrasive belt and increased the load. At this time, peeling of the coating layer occurs due to friction and shearing force generated on the tool surface. The adhesion force measurement method uses the load cell, the acceleration sensor, and the torque sensor to collect data generated during the experiment and analyze and compare using Fast Fourier Transform (FFT). As a result, it is possible to confirm the time of peeling and the load and shear force at this time, which is referred to as adhesive force.
Theoretical background
Nanocrystalline diamond (NCD) coated
The thin film deposition process is classified into physical vapor deposition (PVD) and chemical vapor deposition (CVD).
The diamond coating layer is formed by CVD and divided into single crystal diamond (SCD) and polycrystalline diamond (PCD) according to the crystal structure of the coating layer. Polycrystalline diamond is classified into Micro-crystalline diamond (MCD) and Nano-crystalline diamond (NCD) according to the crystal size constituting the thin film.
The growth process of diamond coating layer by crystal composition is shown in Figure 1. In SCD, a single crystal diamond prepared in advance is greatly grown by plasma CVD and then sliced into a thin film. In MCD, initially generated nuclei grow vertically to form a thin film. In the NCD, the first nuclei are grown and then the growth is stopped. The second nucleation is repeated, and the growth and stopping steps are repeated to form a thin film having a surface roughness with nanosecond particles. 6
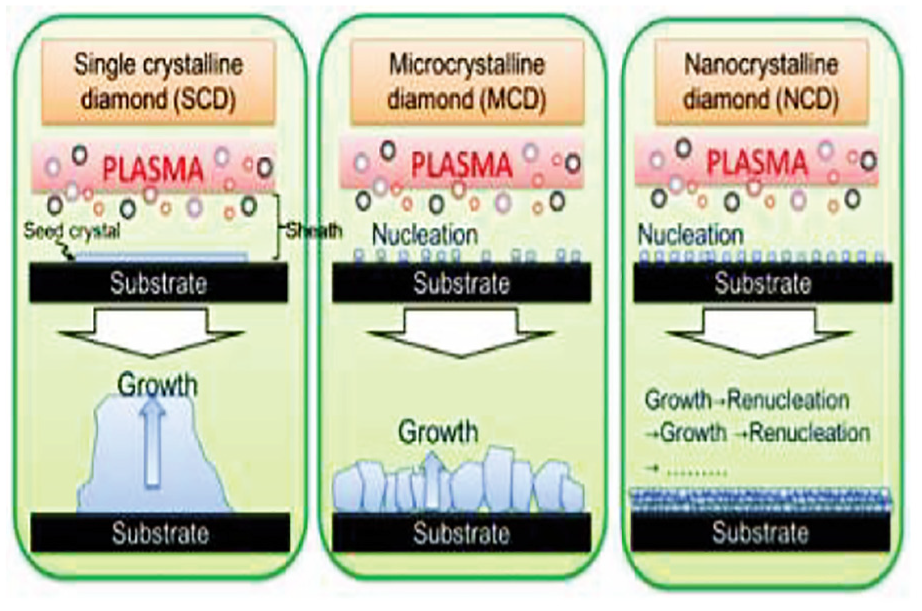
Growth process of diamond coating layer by crystal composition.
The NCD coating tool consists of the diamond coating layer, the base material, and the boundary layer as shown in Figure 2 by the above-mentioned characteristics of the diamond and the deposition process of the diamond coating layer. The base metal and the diamond coating layer are the most vulnerable because the bonding strength between the tungsten atoms and the bonding strength between the carbon atoms is very strong, while the boundary layer is the nonmetal diamond and the metal tungsten coexists. The present study was conducted after assuming that peeling would occur in this area. 7
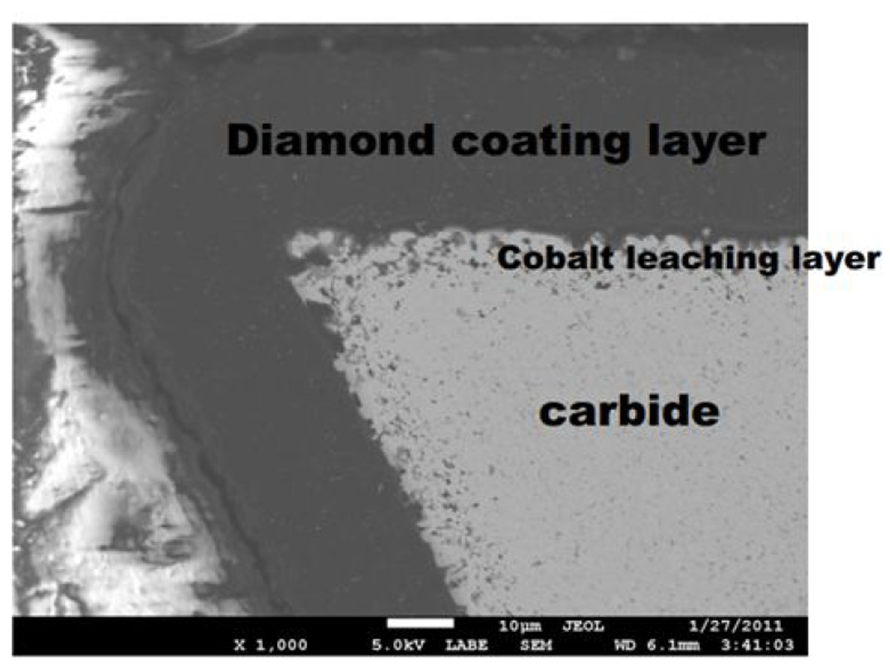
Diamond coating tool fault.
Adhesion measurement
Adhesion is an important factor determining the quality of the coating layer. Quantitative evaluation is required because it determines the life and performance of the cutting tool coating layer in particular. The interface fatigue strength of a tool coated with a nanocrystalline diamond (NCD) coating affects the milling performance and is effectively measured by an inclined impact test.8–10
The adhesion of the coating layer is evaluated by many methods such as scratch test, indentation test, tape test, and tensile test. Scratch test and indent test are mainly used.
Scratch test
The scratch test is a method to confirm the load value at the point where the coating layer is peeled off and the base material is exposed through a method of scratching by pushing gradually into the coating layer using a hard and sharp indenter having a constant radius of curvature as shown in Figure 3. The main performance is the ability to measure the adhesion between the base material and the coating layer by collecting in real time the indentation load, the front depth, and the acoustic emission (AE), which are the main factors of the scratch test, using the load cell and the AE sensor during the test.

Scratch test schematic.
The critical load when the coating layer is broken and peeled is detected by detecting the change in friction force or sound due to the fracture, and by observing the scratch marks with an optical microscope to determine the fracture point in order to increase the accuracy. The problem with this method is the detection method of peeling. Although peeling can be confirmed with naked eyes, it is difficult to determine the exact peeling point if the indenter is tapered. Using a microscope can confirm the peeling position very accurately, but there is a problem in determining the load value at the peeling position. In addition, since the material of the indenter is made of diamond, it is difficult to measure the adhesion force because it is likely to cause damage to the granules during the adhesion test of the ultra-hard coating layer.11,12
Indentation test
As shown in Figure 4, when the specimen is slowly pressed by applying a test load to a specimen having a certain shape, it is confirmed that the surface of the specimen is deformed into three strain layers. The area of part (A) causes cold deformation, the area of part (B) leads to the plastic deformation of permanent material, and the area of part (C) is the elastic area causing resistance against test load. At this time, in the region (C), the resistance of the material is changed, and the resistance value of the material changes according to the change of the test load value. At this time, the area or depth of the indentation marks generated on the surface of the specimen is measured and converted into the hardness according to the defined formula.
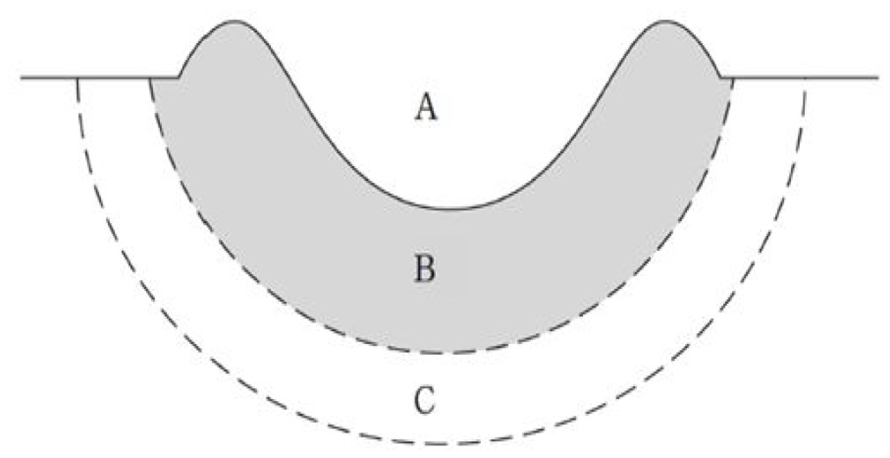
Deformation state of material during indentation test.
Indentation tests have been performed from the past by many researchers for the measurement of hardness and modulus of elasticity. Brinell, Rockwell, and Vickers hardness tests.
Friction wear test
It is generally known that friction is caused by elastic deformation, plastic deformation, and shearing of the adhered portion of the contact portion caused by the collision of the surface protrusions of the objects.
Wear refers to gradual breakdown of the surface of an object due to mechanical movement. The causes of abrasion include surface fatigue wear caused by repetitive contact of the surface, abrasive wear caused by cutting of hard material or hard surface, adhesion wear caused by shear caused by friction, Corrosion caused by corrosion and mechanical abrasion.
Due to the high hardness of the NCD coating layer that is first contacted when performing the friction and wear tests with the NCD coated tool, abrasive particles of the relatively weakly bonded polishing pad are dropped and only friction is applied to the tool surface. When this frictional force becomes equal to or higher than the adhesion force of the coating layer, peeling occurs and the base material is exposed. The base material, tungsten carbide, has a wear characteristic. Therefore, in the friction characteristics of the coating layer during the experiment, the vibration characteristics are changed by wear of the base material.
In this paper, we have developed a pin-on-disc type sliding friction wear tester structure by applying this tribological wear tester.
Evaluation tester and experimental methods
Figure 5 shows the tester developed by applying the friction and wear tester. The experimental tester consists of a load applying part, a specimen fixing and moving part, a sanding belt driving part and a measuring part.
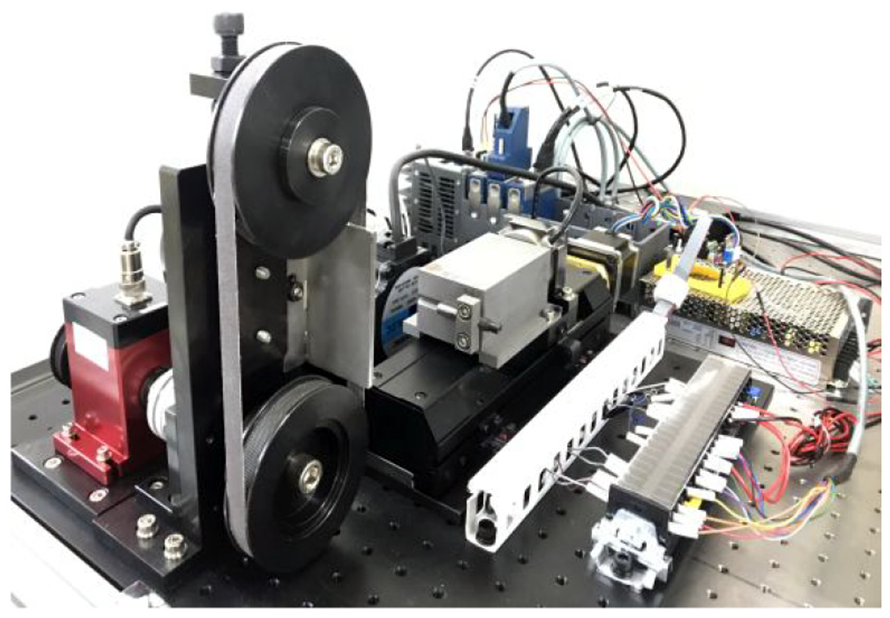
Adhesion evaluation development tester.
The purpose of the development of this tester is to remove the diamond coating layer of the specimen NCD tool from the base material and obtain the critical load at that time.
The load acting in the direction perpendicular to the line in contact with the NCD tool and the sanding belt during the test is defined as the vertical load as shown in Figure 6. This vertical load increases linearly up to a certain upper limit during the experiment and then decreases. As the load is applied to the specimen, the load and frictional force acting on the specimen increase and the coating layer peels off.
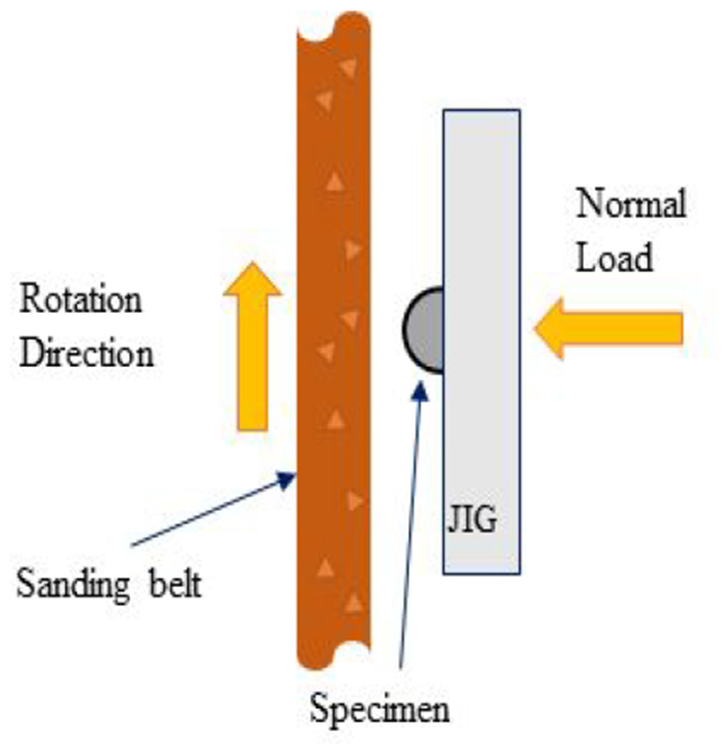
Load application method.
The test for the evaluation of the adhesion of the tester developed in this study consists of the sequence as shown in Figure 7.
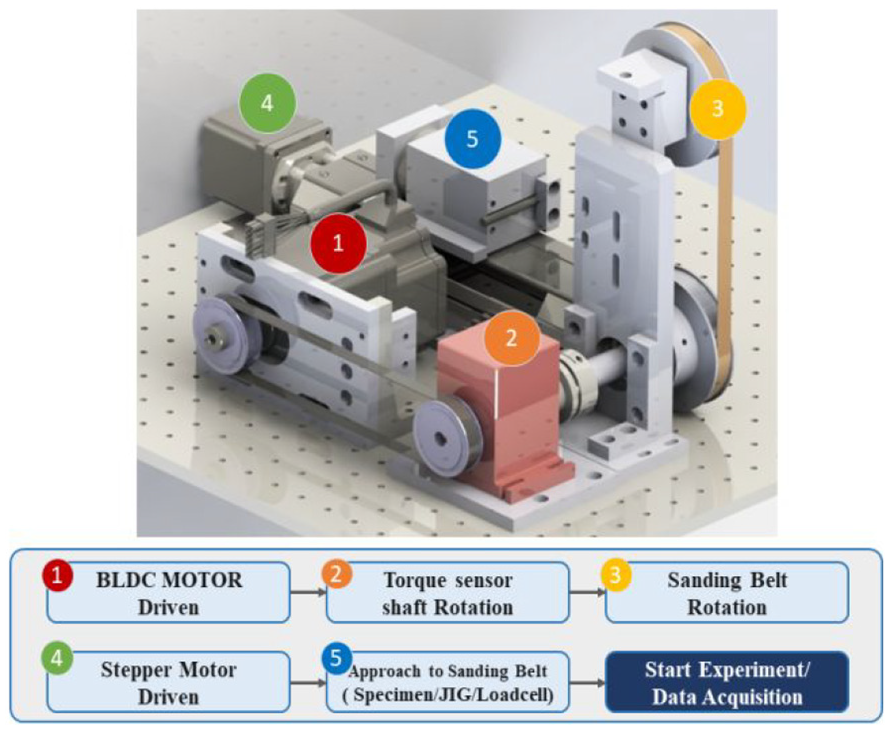
Evaluation device drive sequence.
Since foreign matter on the surface of the specimen and the sanding belt may affect the test result, it is very important to maintain the condition of the tool surface and the cleanliness of the sanding belt during the test. To rotate the torque sensor and the sanding belt, the BLDC motor is driven at a constant speed. Since the BLDC motor shaft and the torque sensor shaft are connected by a timing pulley, when the BLDC motor rotates, the torque sensor shaft rotates at the same speed as the BLDC motor. Since the shaft of the torque sensor and the shaft rotating the sanding belt wheel are connected by a coupling, when the shaft of the torque sensor rotated by the BLDC motor rotates, the sanding belt also rotates. The step motor moves the JIG back and forth to bring the diamond tool specimen fixed to the JIG and moving closer to the sanding belt to cause friction and wear. The specimen is approached until a certain load is applied to the sanding belt rotating at a constant speed, and at this time, peeling of the coating layer and abrasion of the base material occur.
Experimental results and analysis
Adhesive force measurement experiment
In this experiment, the coating layer of the specimen is peeled off by using the sanding belt while increasing the force applied to one point of the NCD tool specimen. The purpose of this study is to confirm the time of peeling and the critical load and frictional force at the point of peeling of the coating layer during the experiment.
The shape of a typical coating tool is shown in Figure 8 and the coated thickness is 7–9 µm. The part coated with diamond is referred to as Flute, and the part uncoated is referred to as Shank. The specimen used in the study is shown in Figure 9. The experiment was carried out by dividing the Flute part and the Shank part.
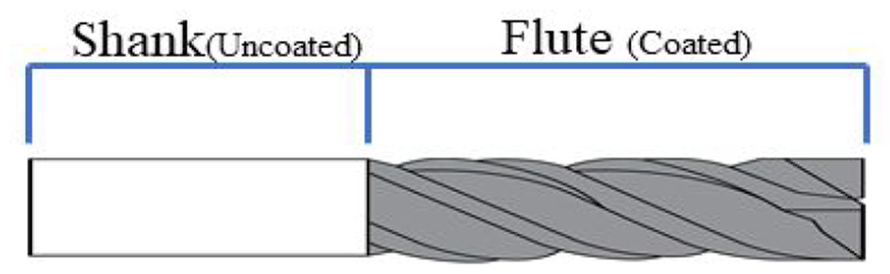
Coated tool geometry.
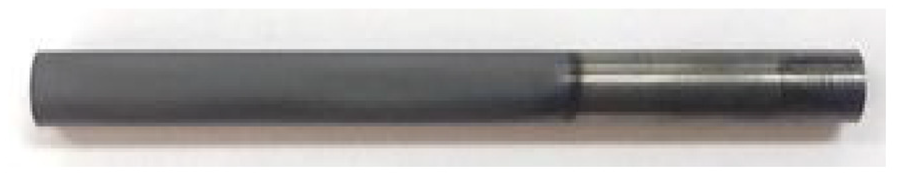
The NCD round bar used in the experiment.
Shank test
The load, torque, and friction data generated during the test of the shank part are shown in Figure 10. Figure 11 is the coefficient of friction obtained by using load data and friction force. It can be seen that the coefficient of friction varies around 0.3 over the entire experiment.
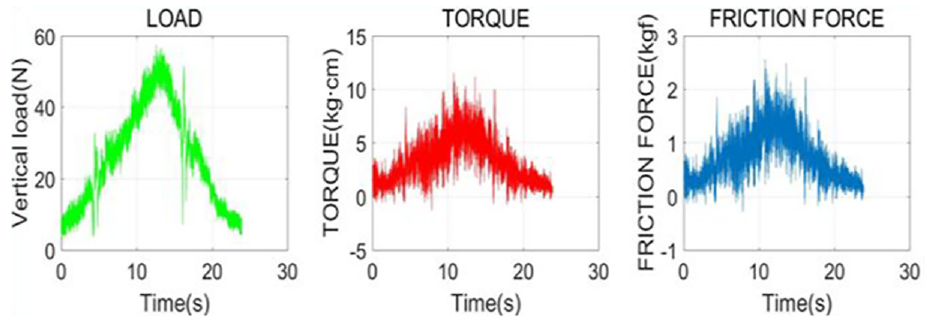
Shank part experimental result.
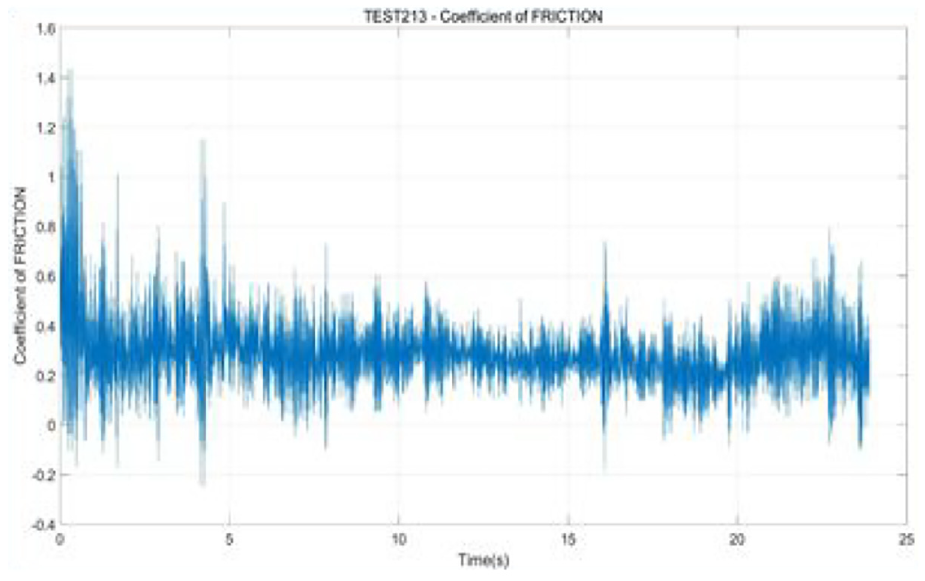
Shank friction coefficient.
Flute test
Figure 12 shows the load, torque, and friction data generated during the test of the flute part. Figure 13 is the coefficient of friction obtained by using load data and friction force. It can be seen that the coefficient of friction decreases from 0.6 to 0.3, unlike the experimental results of the shank portion where the coefficient of friction varies from 0.3.
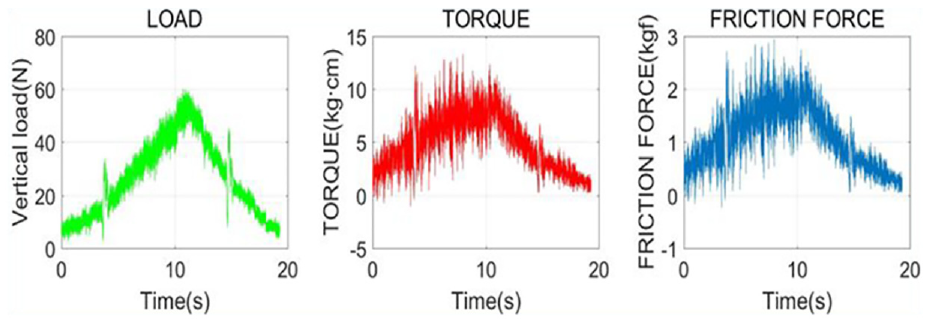
Flute part experimental result.
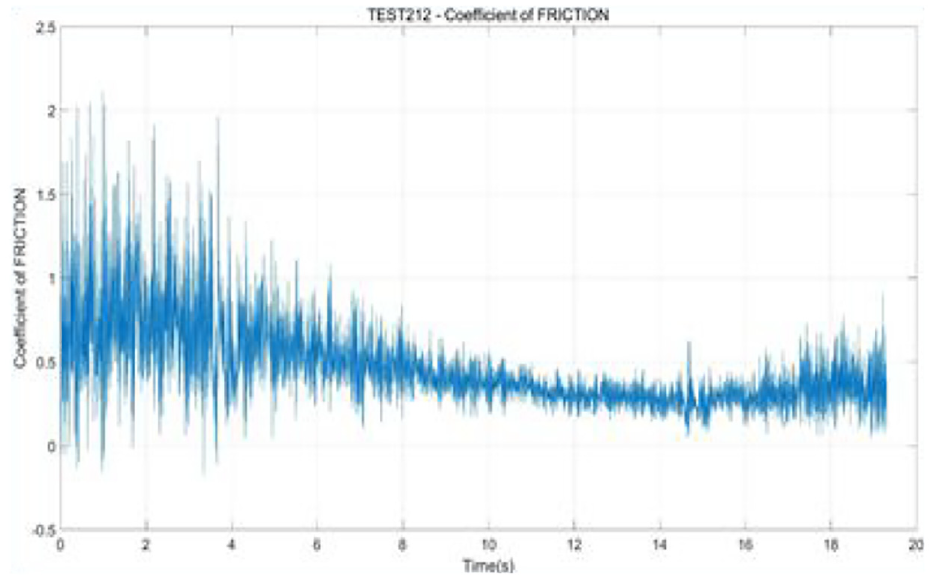
Flute friction coefficient.
Data processing
Experimental program was developed based on LabVIEW program of National Instruments to be able to experiment under various experimental conditions using experimental tester. It includes BLDC motor and step motor speed adjustment, load upper limit setting and automatic test function. It can monitor acceleration, load and torque value in real time.
We have developed a data processing program based on MATLAB to detect the peeling point by processing and analyzing the data obtained through experiments. Figure 14 shows the processing of load, torque and acceleration data obtained through experiment. The friction force and the friction coefficient can be obtained by using the load data and the torque data passed through the filter. The acceleration data obtained by attaching the single-axis acceleration sensor to the Z-axis where the vibration is greatest is cut at intervals of 1 s every 0.1 s to cover the Hamming window. This data is subjected to FFT analysis to detect the peeling point at which the coating layer is peeled off, obtain the load at the peeling point from the load graph, and obtain the frictional force from the frictional force graph. This critical load and frictional force are called adhesion forces.
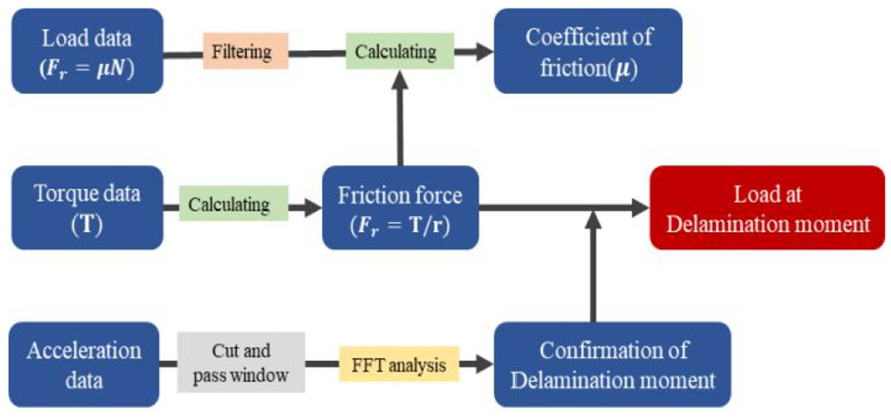
Data processing algorithm.
Peeling moment
First, as shown in Figure 15, the front part is divided into “A – load increasing section” and the rear part is called “B – load reducing section” based on the maximum value of the load applied to the specimen. When the tool surface was checked after the test, if peeling occurred, it could be deduced that peeling occurred in area A where the load increased. Therefore, in the region A, the NCD coating layer is vibrated due to friction, and there is a section where the vibration characteristic is changed into vibration due to wear of the tungsten carbide due to exposure of the base material after peeling. In the region B, peeling has already occurred in the region A, so that only the vibration characteristic due to wear of the tungsten carbide occurs.
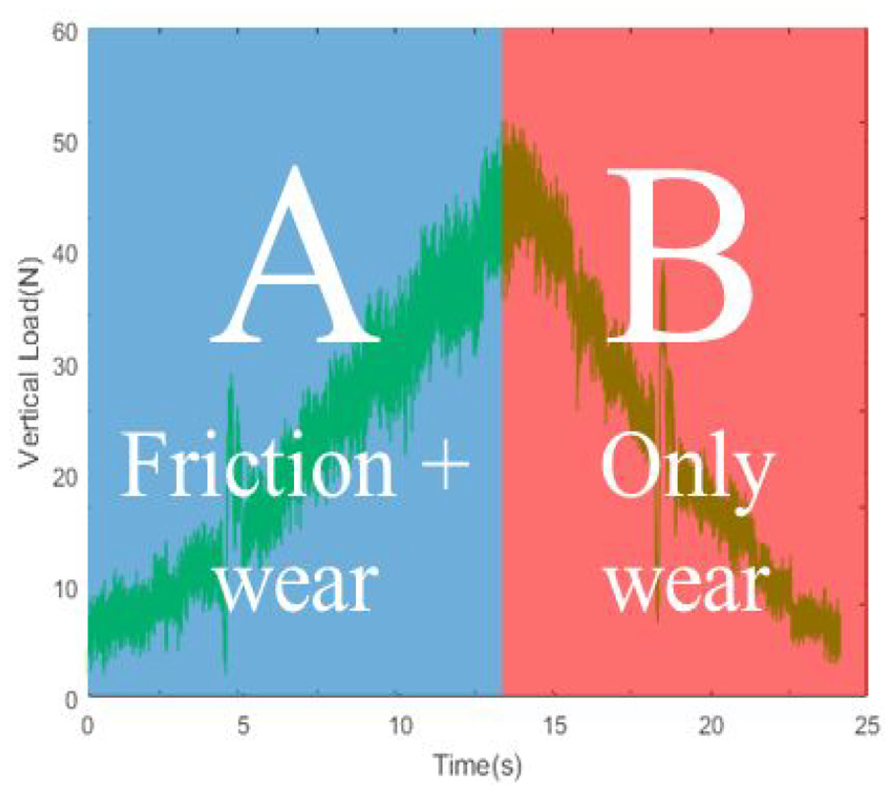
Classification of load change area.
Figure 16 shows the Z-axis acceleration data generated during the Shank part experiment. Fast Fourier transform (FFT) analysis is performed by dividing this in units of 1 s. The spectrogram is shown in Figure 17, so that it is easy to confirm the time, frequency and frequency intensity at a glance. The intensity of the frequency can be distinguished by color and the intensity is close to red.
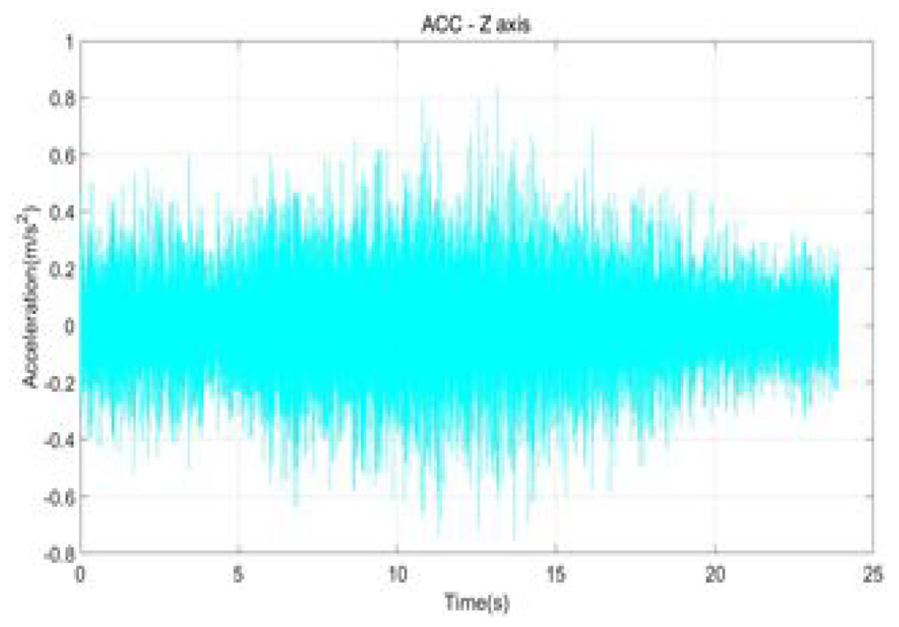
Shank acceleration data.
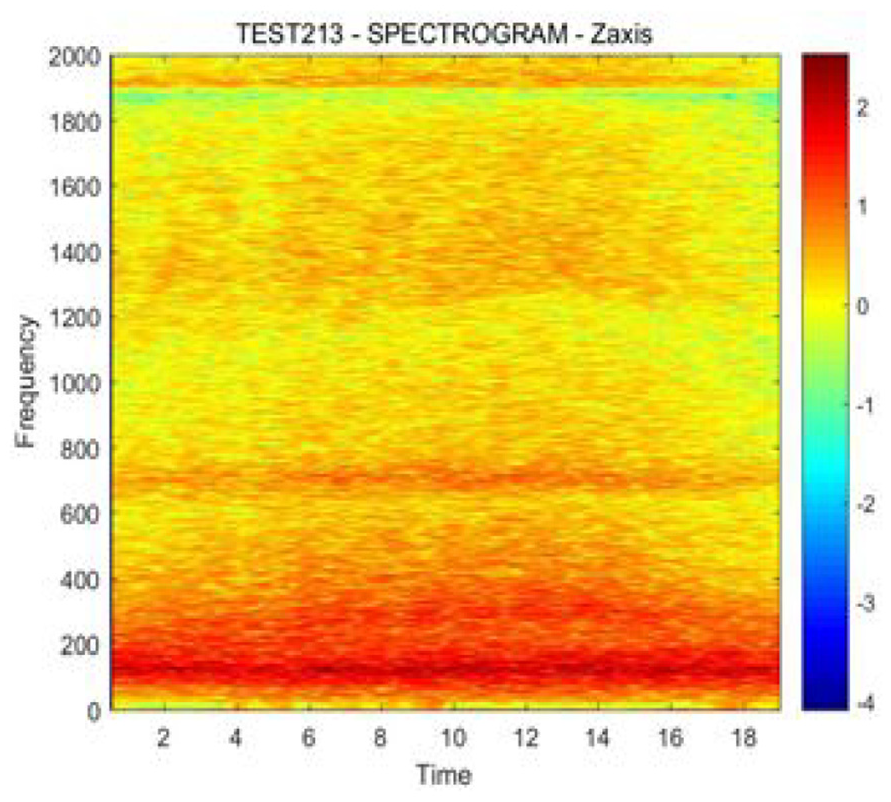
Shank Spectrogram.
Through the symmetry of the sections A and B in the spectrogram, it can be confirmed that the characteristics of the specimen surface did not change during the experiment, so that the vibration characteristics did not change.
Figures 18 and 19 show the Z-axis acceleration data generated during the Flute part experiment and the spectrogram after Fourier transform. It can be seen that the strength in the vicinity is strongly shown throughout the experiment. Unlike the experimental results of the shank section, it can be seen that the frequency intensities of the sections A and B are not symmetrical throughout the experiment. This means that the characteristics of the specimen surface changed from the NCD coating layer to the base material during the experiment.
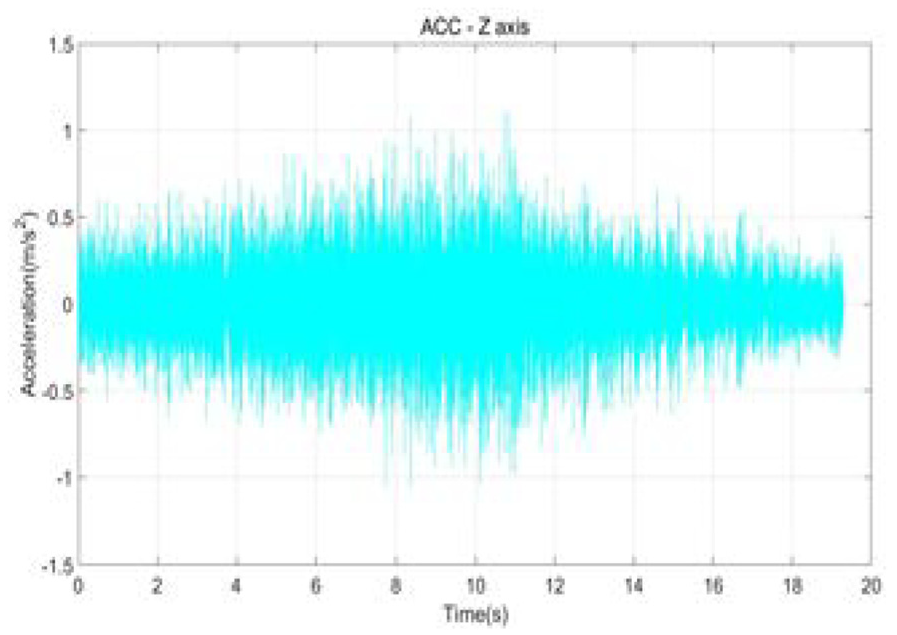
Flute acceleration data.
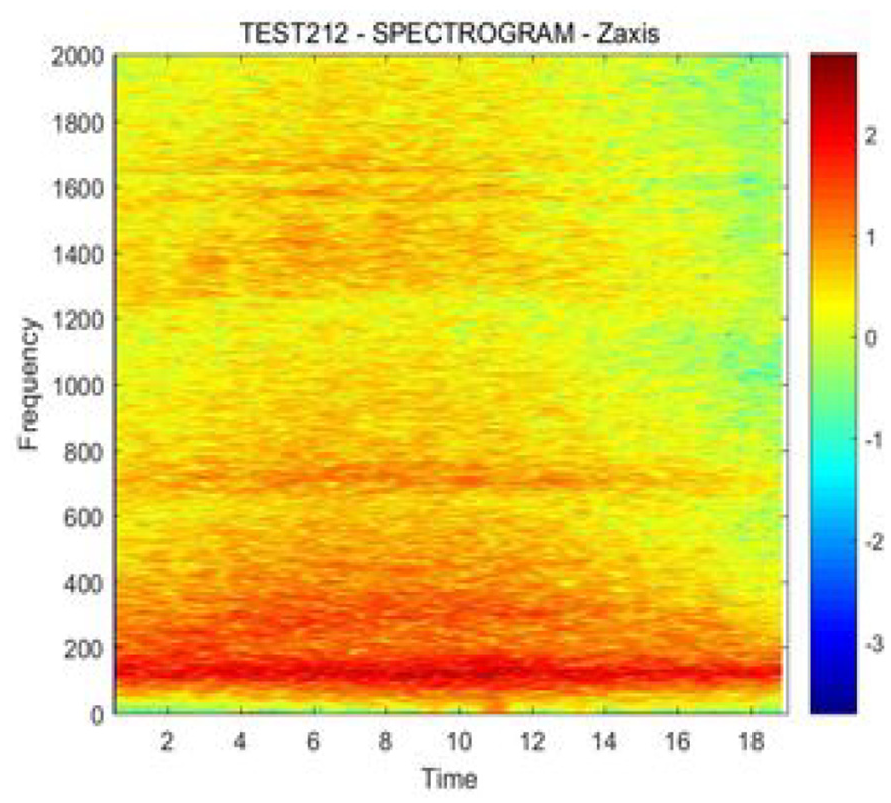
Flute spectrogram.
From the spectrogram data of the Shank part and the Flute part experiment, it can be obtained as shown in Figure 20. This is a graph in which the average value of the frequency intensities in section A and section B is averaged.
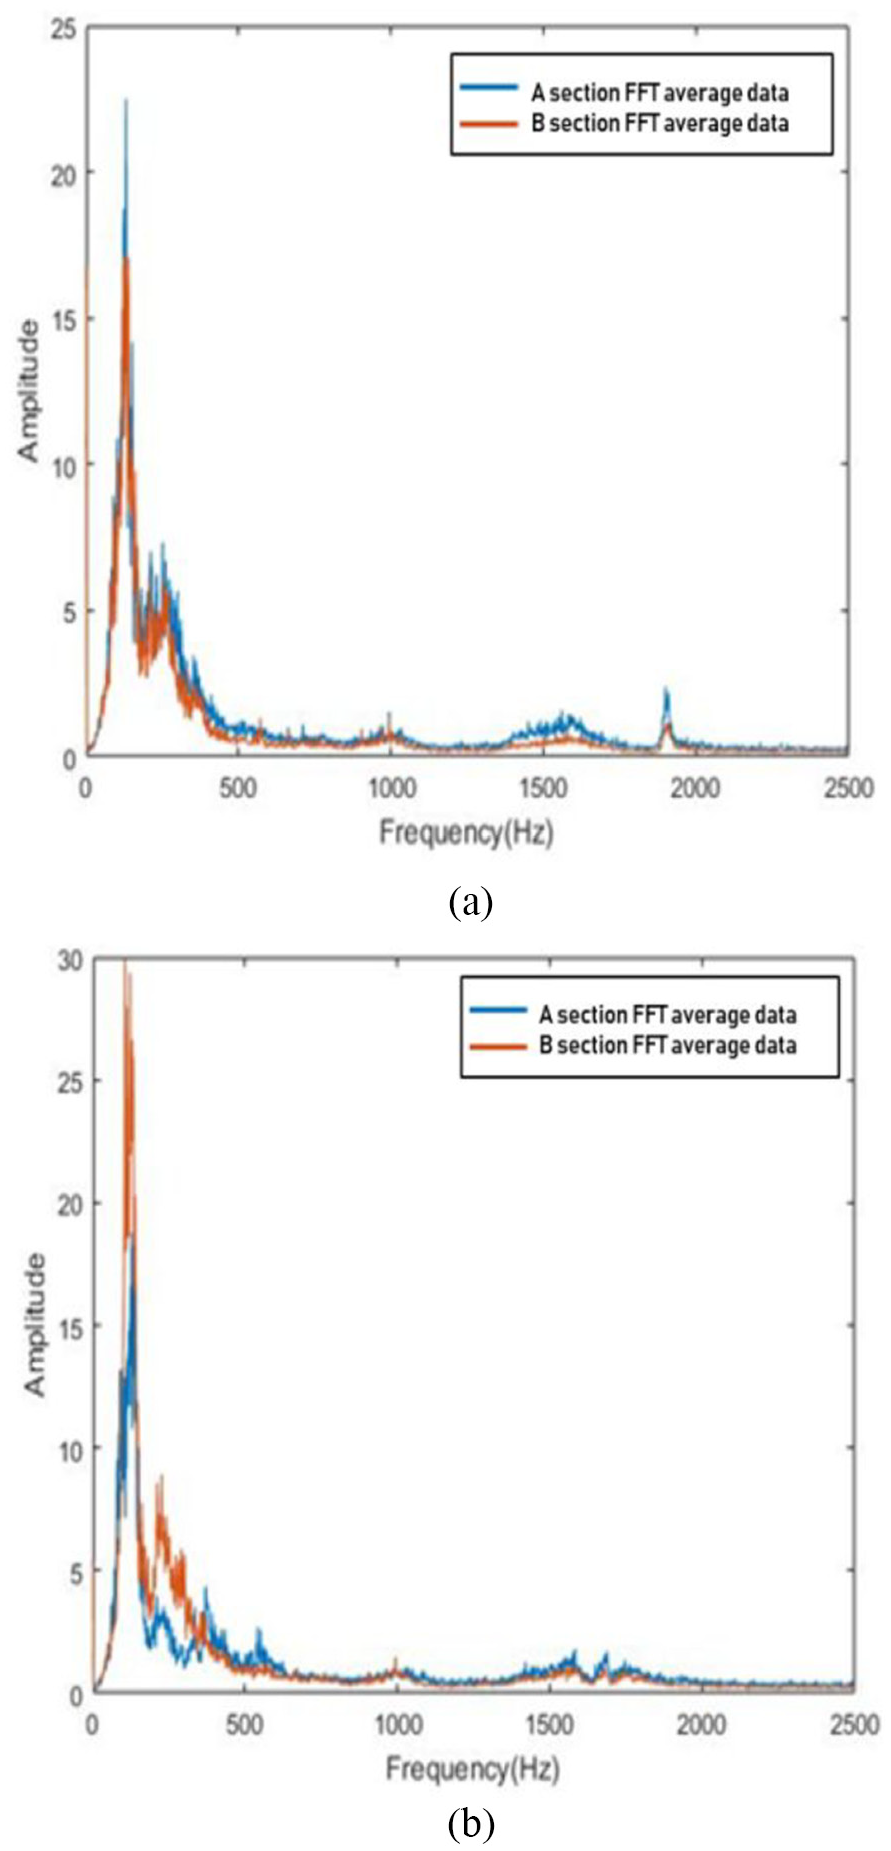
Shank and flute part A and B section FFT average data (Up: Shank, Bottom: Flute).
Since the shank part has only the abrasive wear characteristics of tungsten carbide in both the A section and the B section, it can be confirmed that the frequency characteristics in the A section and the B section are almost the same.
However, it can be seen that the frequency characteristics of the A and B sections are different because the friction of the NCD coating layer and abrasion of the base material occur in the section A and only wear of the base material occurs in the section B.
It can be judged that the peeling occurs at the point where the characteristic of the frequency changes from the friction of the coating layer to the abrasion of the base material.
In order to detect the peeling point at which the characteristics of frequency are changed, the relative error is obtained from the FFT average data of the section B and the FFT data of the sections A and B having the frequency characteristics of the wear in the shank section test results.
The relative error graph is shown in Figure 21. The relative error increases gradually and then decreases again with the maximum value around 6.1 s. At this inflexion point, the frequency characteristic is changed from abrasion and adhesion wear of the coating layer to grinding wear of the base material.
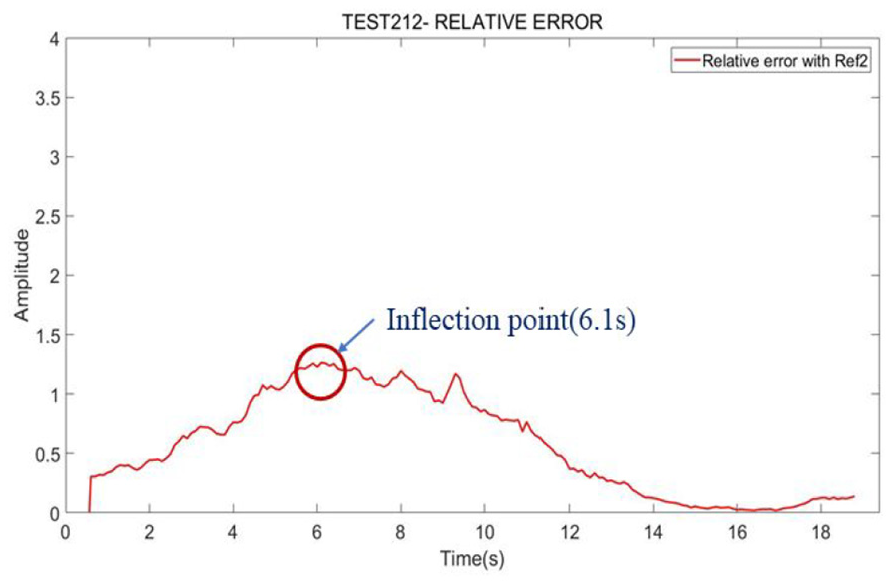
Flute relative error graph.
The critical load and the frictional force at the time of peeling can be found from the aforementioned load graph and the frictional force graph. The critical load and the frictional force are 26.5 N and 15.92 N.
Conclusion
In this study, we have developed a new adhesion force evaluation system by applying friction and wear tester to measure the adhesion of NCD tool coating layer and proposed a method to quantitatively evaluate the adhesion force by processing collected data from adhesion test.
Footnotes
Declaration of conflicting interests
The author(s) declared no potential conflicts of interest with respect to the research, authorship, and/or publication of this article.
Funding
The author(s) disclosed receipt of the following financial support for the research, authorship, and/or publication of this article: This study was supported by the research fund of the Ministry of Trade, Industry & Energy Industrial Technology Innovation Project (Project Number: 10067069).