
Abstract
In this paper, the effect of the interdigital transducer (IDT) position parameters on the surface acoustic wave (SAW) yarn tension sensor sensitivity is investigated. The stress–strain characteristic of substrate was studied by the combination of finite element simulation and regression analysis method. According to this characteristic, the function relationship between the SAW yarn tension sensor sensitivity and the IDT position parameters was built using the regression analysis method. The monotonicity of the regression function was also given. On this basis, a novel sensitivity optimal scheme was proposed and solved by the quadratic programming method. Its solution demonstrates that the optimum sensitivity can be obtained when the IDT is 8.9 mm to the left side of the substrate and the IDT is 0.3 mm to the top edge of the substrate within a domain of the IDT position parameters. The SAW yarn tension sensor with corresponding IDT position parameters was fabricated to validate the correctness of the sensitivity optimal scheme. The measured results indicate that the SAW yarn tension sensor sensitivity can reach 813.69 Hz/g, which confirms that the novel scheme is effective.
Keywords
Introduction
SAW sensors, which represent the merging of acoustic theory research, piezoelectric material achievements and electronic science and technology progress, display advantages such as high precision, simple structure, small size, easy integration, passivity, and good stability.1–4 Because SAW sensors are particularly sensitive to the environmental changes on the substrate surface, they are widely used in the detection of physical, 5 chemical, 6 and biological 7 data. With the continuous increase in SAW sensor applications, the study of the aspects of theoretical enrichment,8,9 working mechanism innovation, 10 simulation model improvement, 11 and working performance development 12 for SAW sensors has become a hot research topic.
Yarn tension is often the key factor in the process of yarn production.12–15 If too much force is supplied, the yarn will be snapped. If there is not enough force, the yarn will become loose and curled. This will result in lower quality of yarn and less production.16,17 Yarn tension is affected by so many elements that it is difficult to measure it. As a result, the accurate measurement of yarn tension is an urgent problem. 18 The SAW yarn tension sensor was proposed 19 for this purpose. It exhibits advantages such as low cost, reproducibility, and anti-interference, especially compared with traditional yarn tension sensors.
The yarn tension sensor sensitivity is of great significance to yarn production and quality. 20 As a result, the influence of the IDT position parameters on SAW yarn tension sensor sensitivity was investigated. After researching the substrate stress–strain characteristic, the regression function between sensor sensitivity and the IDT position parameters was established. Based on analyzing the function monotonicity, a novel scheme that can improve its sensitivity is proposed by optimizing the placement of the IDT on substrate.
Design
Figure 1 shows the design diagram of the SAW yarn tension sensor. A, B, C, Y, and S are the metal pedestal, the quartz spacer, the substrate, the yarn guide ring, and the sound absorbing adhesive, respectively. A mixture of epoxy resin and curing agent is used to glue them together. Y1 is a part of the Y. Glue Y1 to the bottom surface of the substrate C. The length of Y1 is about 2 mm. Because its length is small and the finite element analysis results in this paper are mainly used for qualitative analysis, it is assumed that the force bearing point of the substrate is point P. Point P is located at the midpoint of line M18N18. The substrate length is
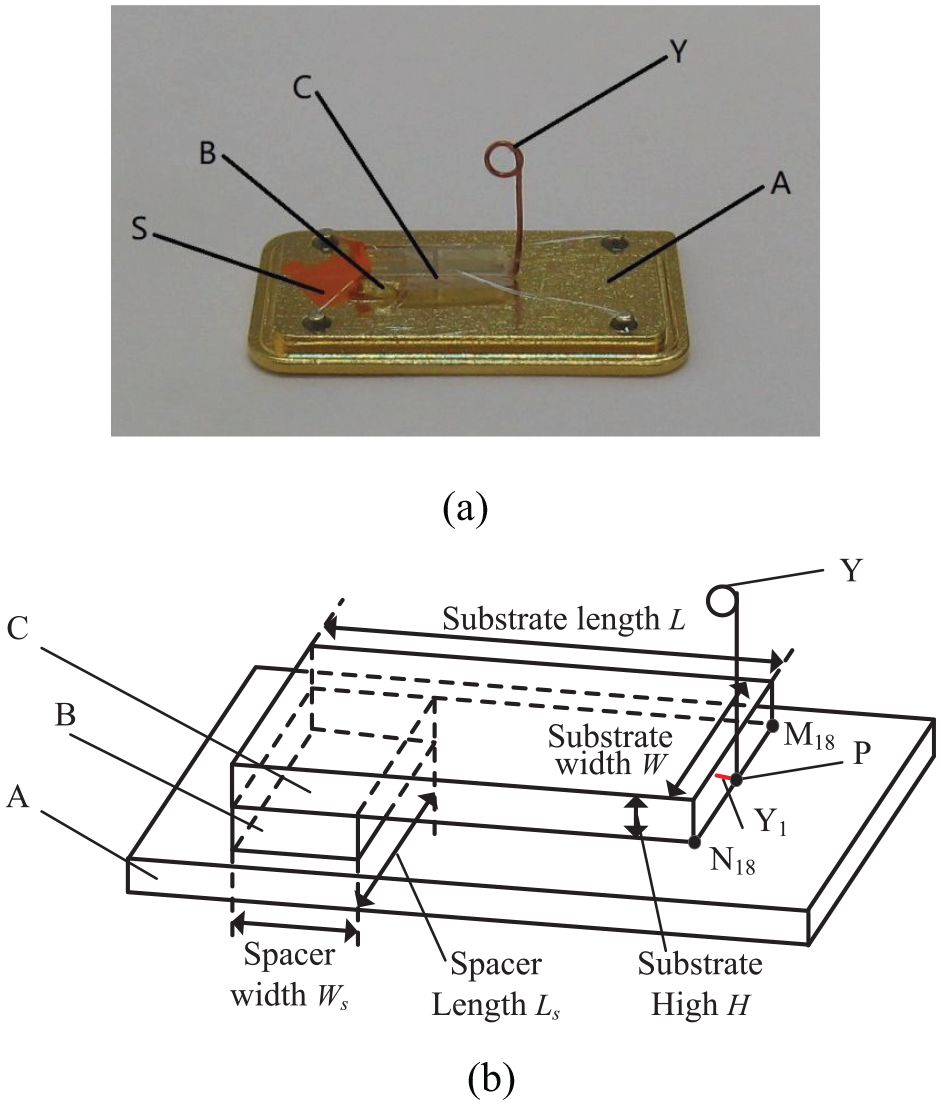
Sensor design diagram: (a) physical picture, (b) structural diagram.
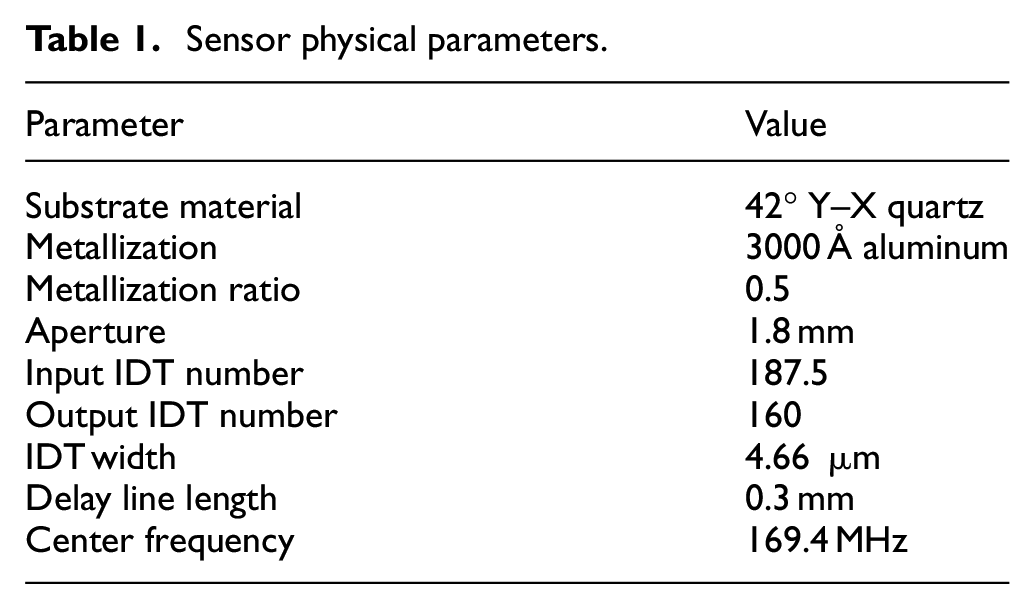
Sensor physical parameters.
When the yarn guide ring is applied to yarn tension

where
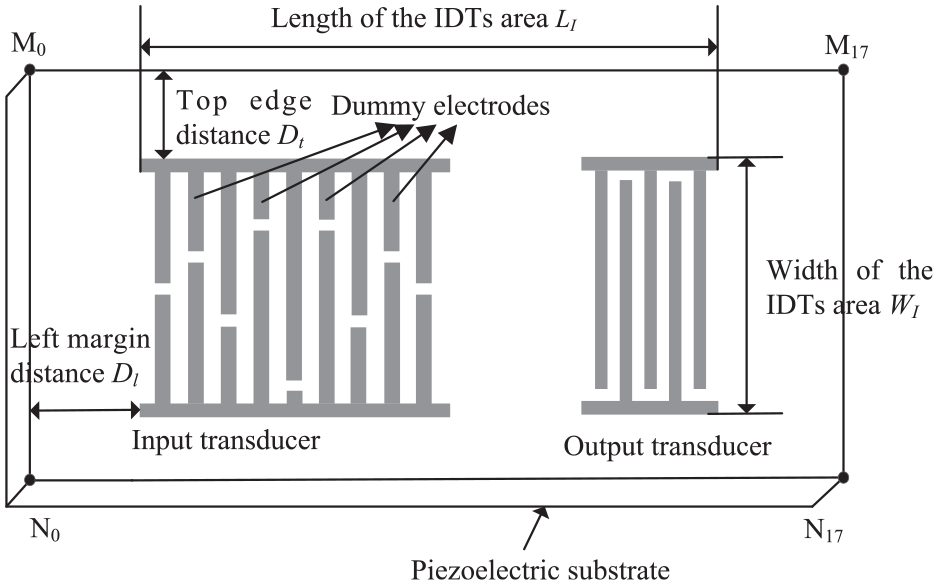
As shown in Figure 2, the electrode-overlap envelope of the input IDT is weighted.12,14,16 Dummy electrodes are used. The output IDT is the uniform transducer. The length of the area occupied by the input and output IDTs is
IDT design schematic diagram.
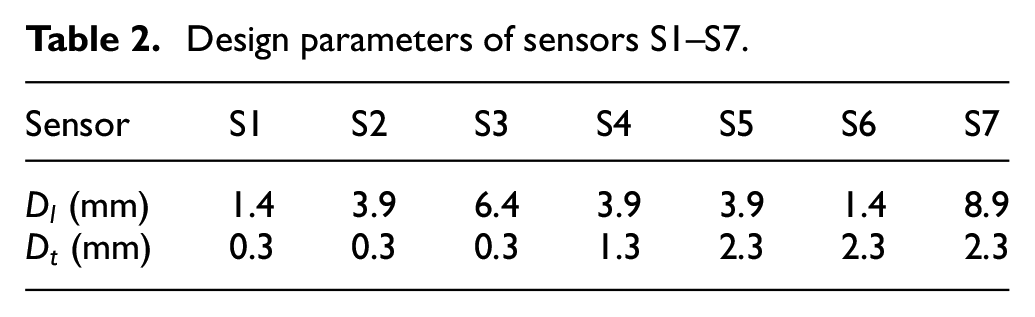
There must be a sufficient number of data samples to build the function relationship between its sensitivity and the IDT position parameters. Too many data samples may also lead to overfitting. Meanwhile, the limitation of the sensor manufacturing conditions on the difference of IDT position parameters should be considered. So we use seven SAW yarn tension sensors, whose IDTs are placed at different positions on the substrate. The diameter of quartz wafer used in the factory is 2 inches (50.8 mm). To place eight sensor substrates or more during fabrication, the substrate size parameters cannot be much larger. Nor can the IDT position parameters. The IDT position parameters are also confined by the manufacture technology of cutting substrate. In addition, these parameters are usually selected at equal intervals. The proper design parameters of these sensors are shown in Table 2. Sensors S1–S6 are used to build the regression function and sensor S7 is used to validate the function.
Design parameters of sensors S1–S7.
Effect of IDT position parameters on sensor sensitivity
Substrate stress–strain characteristic
The strain, induced by loading
The substrate strain will cause the change of the sensor output frequency, so equation (1) can be expressed as 21
where
Compare equations (1) and (3), and it is found

The substrate strain will change linearly with yarn tension because piezoelectric crystal is elastomer. Thus, we have

where
Substituting equation (5) into equation (4)

In equation (6), the term

In equation (7), because

Equation (8) needs to be solved by least square estimation. Thus, it is converted to

where
To analyze the stress–strain characteristic of substrate, the finite element model of the substrate stress–strain is simulated. The variable
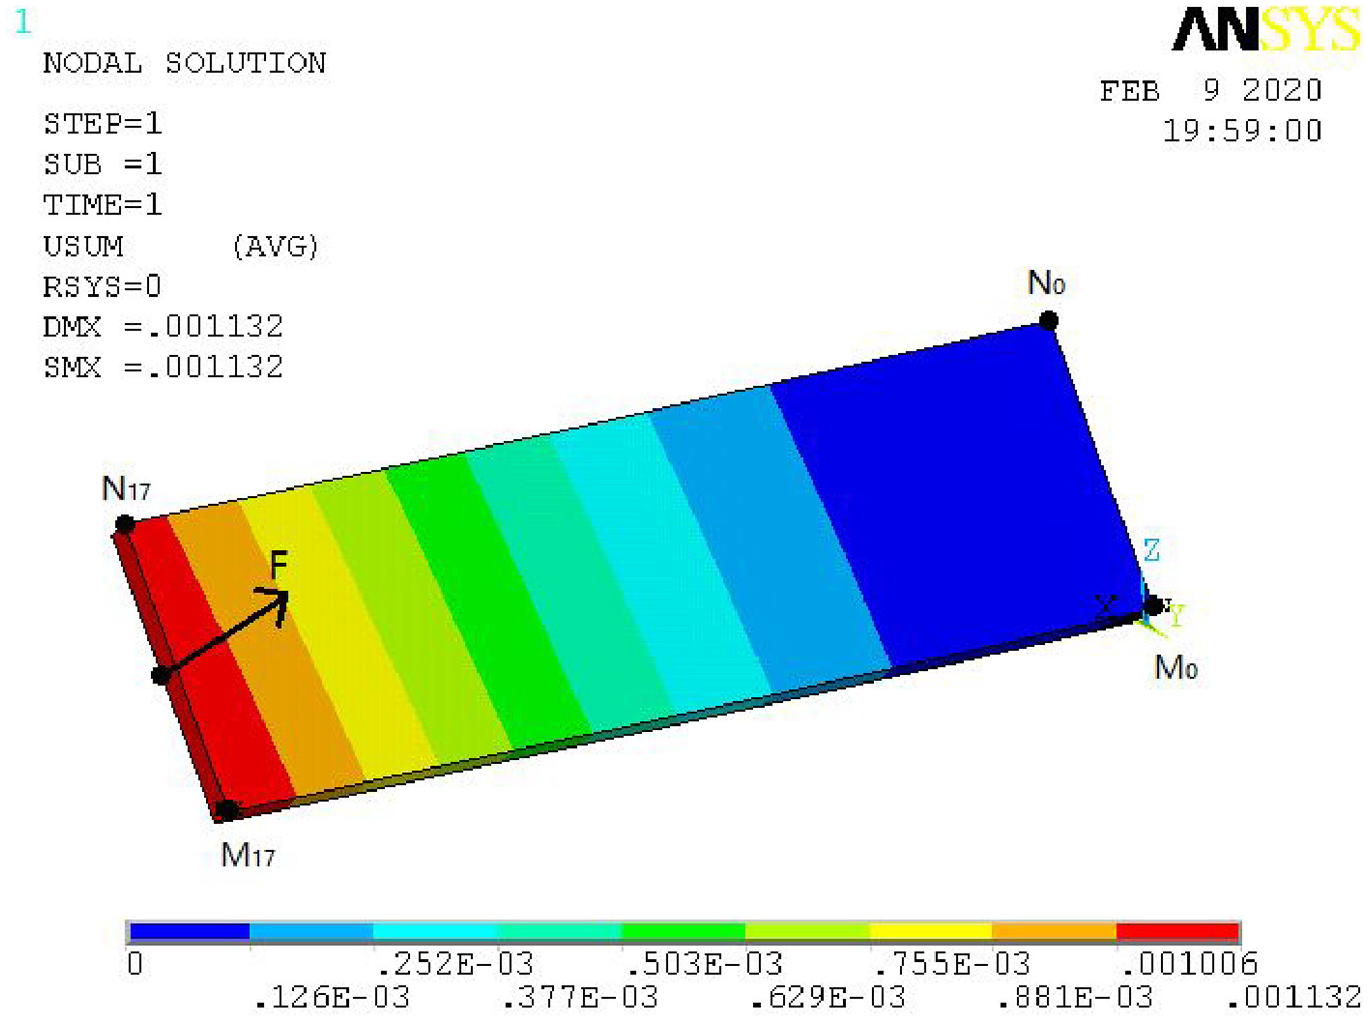
Stress–strain simulation result of substrate J1.
We use line M0M17 as an example, as shown in Figure 2. The M0M17 line was divided by 17 1-mm segments. The 16 generated points are defined as points M1–M16. M0 was defined as the origin, and M0M17 as the x-axis. Therefore the x coordinate at point M0 is 0, the x coordinate at point M1 is 1, and so on. The parameter
The simulation output data reveals that as these points on line M0M17 get further away from point M0, the magnitude of strain displacement induced by unit tension at these points increases. Therefore, the parameter

where
Based on the simulation output data, the regression coefficients in equation (10) are solved by the least square method.
Let

If

Figure 4 shows the fitting curves and the data points when

Curves between
In Figure 4, it is clear that the blue curve fits data points better than the red curve. Therefore equation (12) should be selected to reflect their functional relationship. Moreover, equation (12) is a quadratic function, which implies that the function relationship between them is nonlinear. This indicates that the distribution of the substrate strain is not uniform in the direction of the acoustic propagation path. In conclusion, according to equation (6), it is certain that this will cause the difference change of the IDT acoustic synchronous frequency at a different x coordinate. Based on the above analysis, we conclude that the IDT position parameters will affect the SAW yarn tension sensor sensitivity.
Function between sensor sensitivity and IDT position parameters
As mentioned above, there should be a causal relationship between sensitivity and the IDT position parameters. This indicates that the parameter
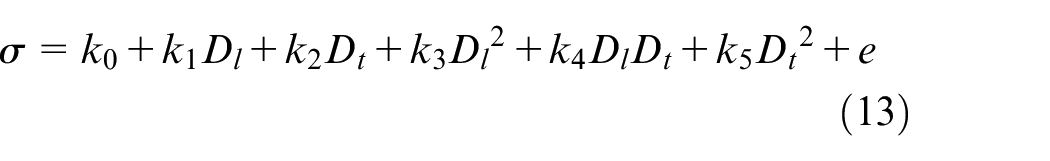
where the
To build the model shown in equation (13), the data sample
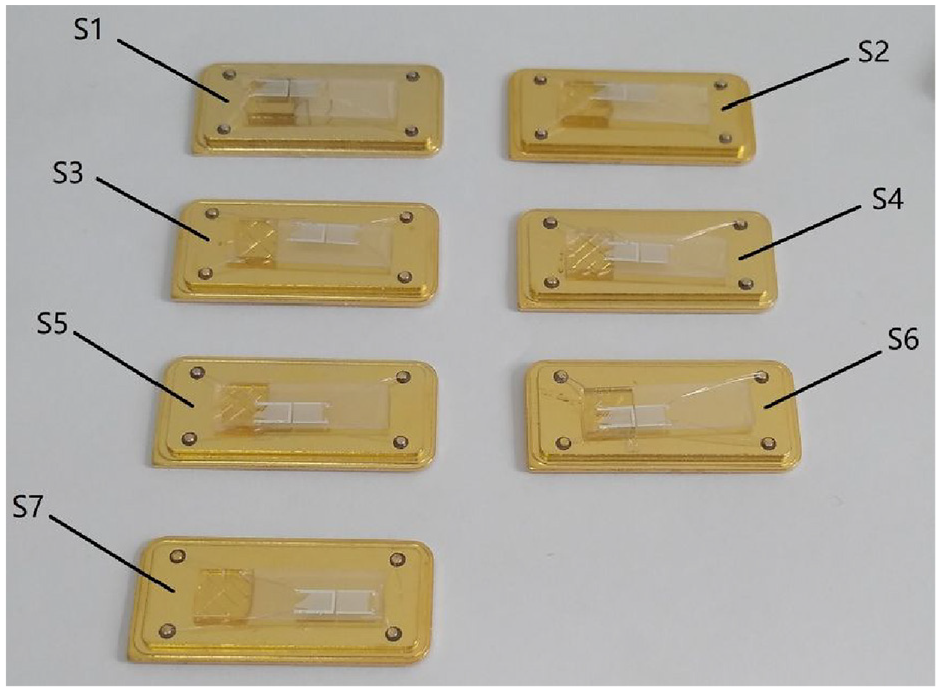
Fabricated physical form of sensors S1–S7.
Measurement data of sensors S1–S7.
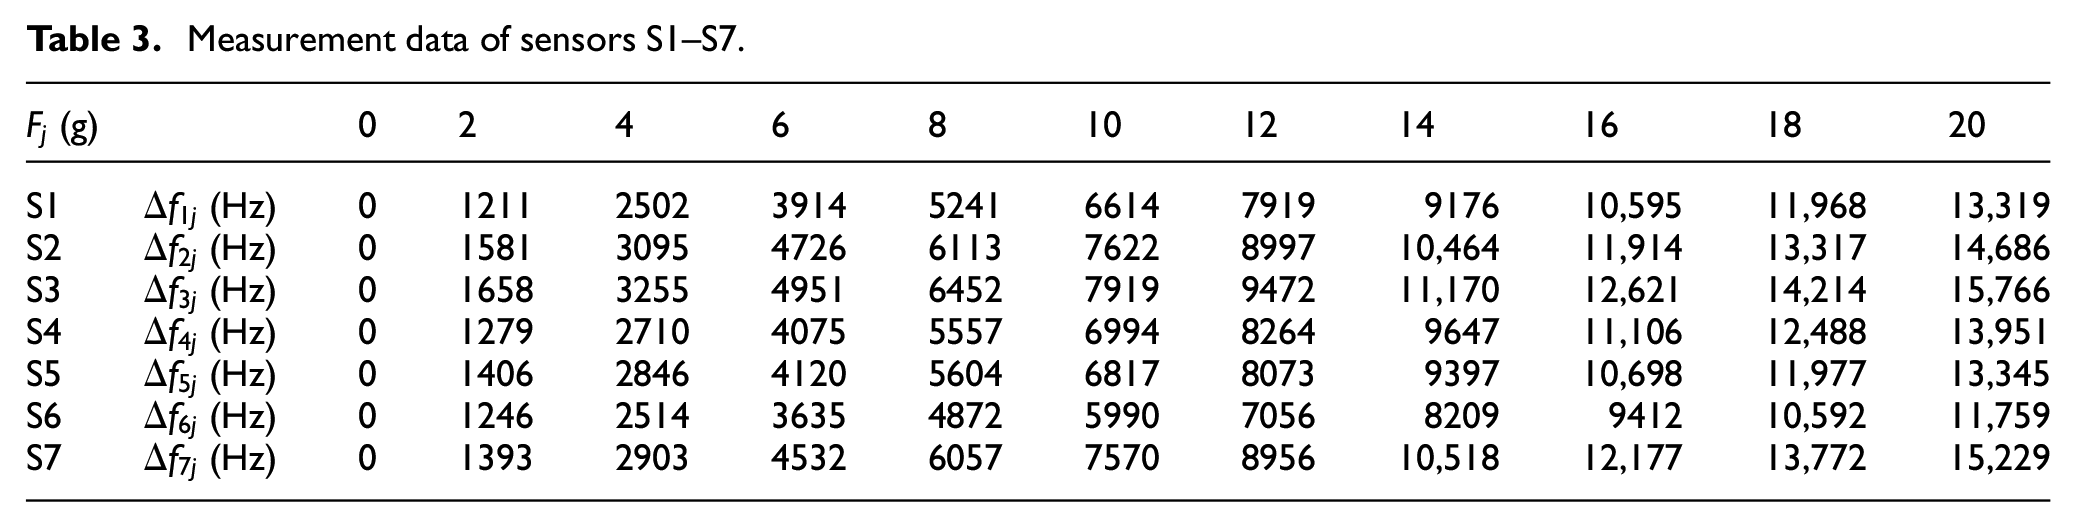
To obtain equation (13), the sensitivity of sensors S1–S6 should be obtained first. According to Table 3, it is evident that the sensors with different placement of IDT show variations in output frequency change under the same yarn tension. This shows that the previous assumption is correct. It proves that there is a functional relationship between sensitivity
Using S1 as an example, equation (9) is converted to

Based on the data sample
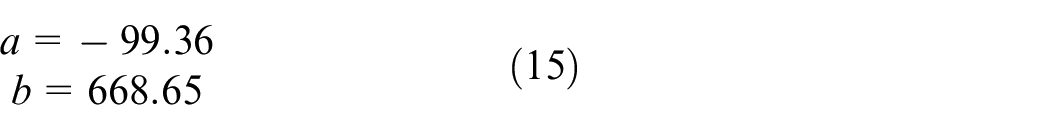
Substitute the solutions into equation (14)

For
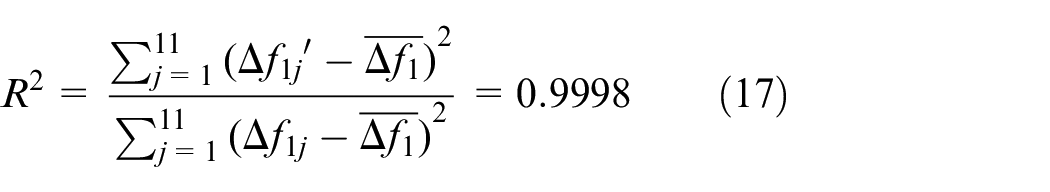
Equation (16) is the function between
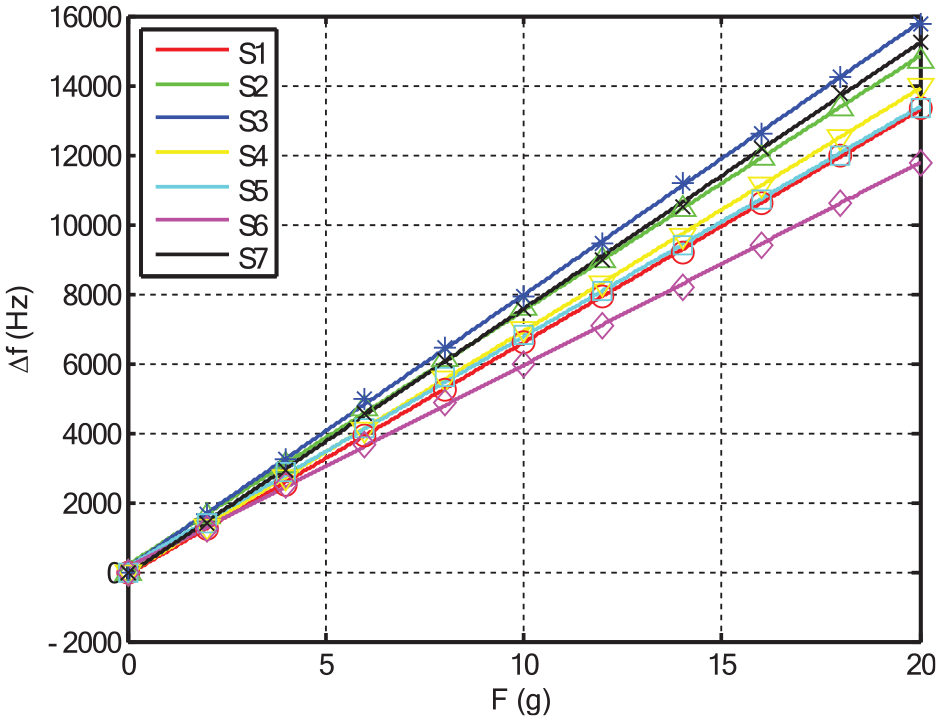
Fitting curves of sensors S1–S7.
In the same way, the sensitivity of the others can be derived. Their fitting curves are also shown in Figure 6. The calculated results are listed in Table 4.
Calculated results of sensors S1–S6.
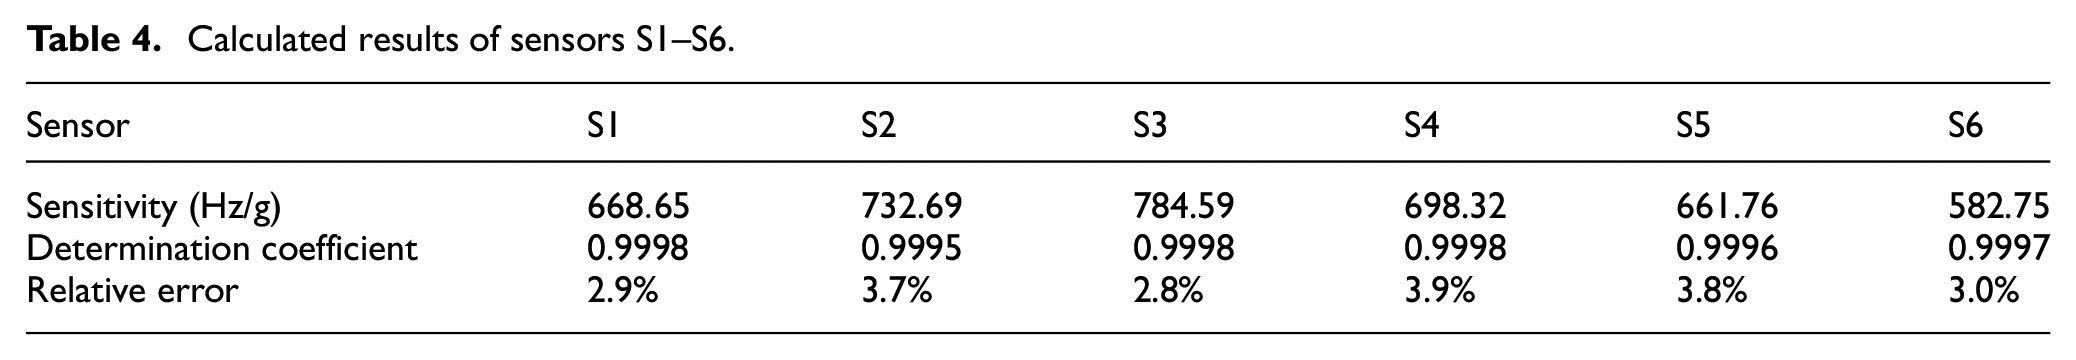
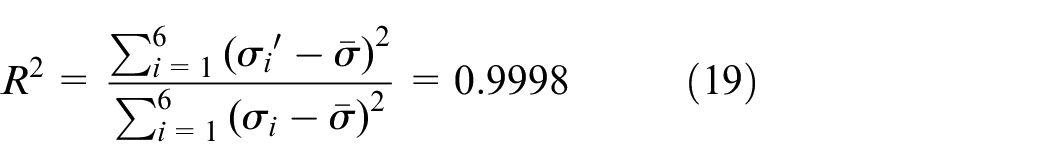
The determination coefficients shown in Table 4 are close to 1, indicating that the data are reliable. Thus, the experimental data sample
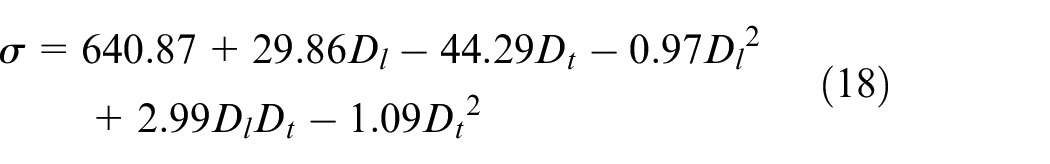
For parameter
The
Curve between parameter
However, the limitation of the substrate actual size and manufacture technology to the IDT position parameters also needs to be considered. The domain of definition for equation (18) should be

Sensor S7 is made to verify the functional relationship shown in equation (18). First, we obtain parameters

For
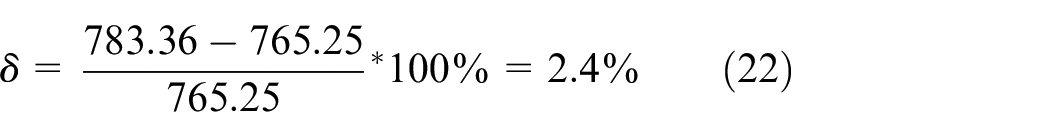
The value
It is found that equation (18) can be set up based on the IDT position parameters and the sensors sensitivity using the regression analysis method. For the other SAW force sensors, if we had related parameters, we could build the regression function too. Therefore, it can be concluded that the novel scheme can be applicable to SAW sensors with the different types of substrate material.
Effect of IDT position parameters on sensor sensitivity
For equation (18), the partial derivative
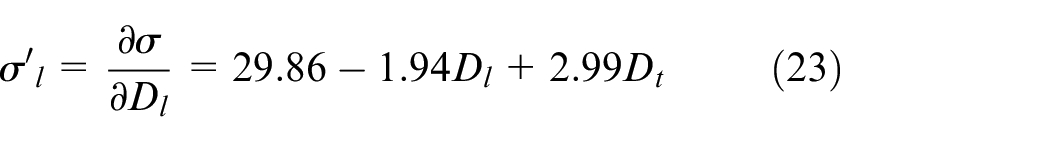
It is calculated that the parameter
Similarly, the partial derivative
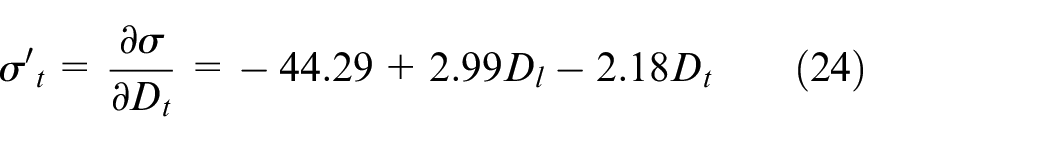
Since the value range of the parameters is
Sensitivity optimization induced by IDT position parameters
Sensor sensitivity will vary with the change of the IDT position parameters. Therefore, sensitivity optimization was achieved by optimizing the IDT location parameters. The quadratic programming method was used to implement this scheme.
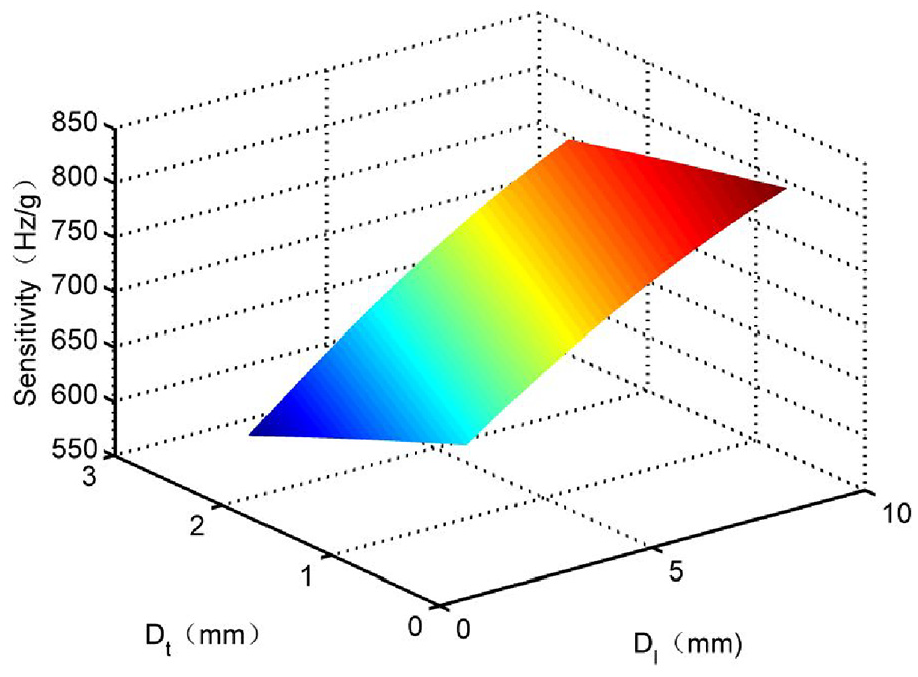
The function relationship between the dependent variable
Due to the restrictions of substrate size and manufacturing technology, we choose equation (20) as the constraint condition.
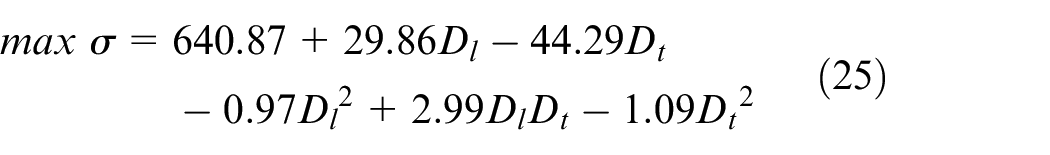
The quadratic programming model shown in equations (25) and (20) is solved by Lingo software. The optimal solution is
Sensor S8 was fabricated to verify the correctness of our scheme. Its design parameters are

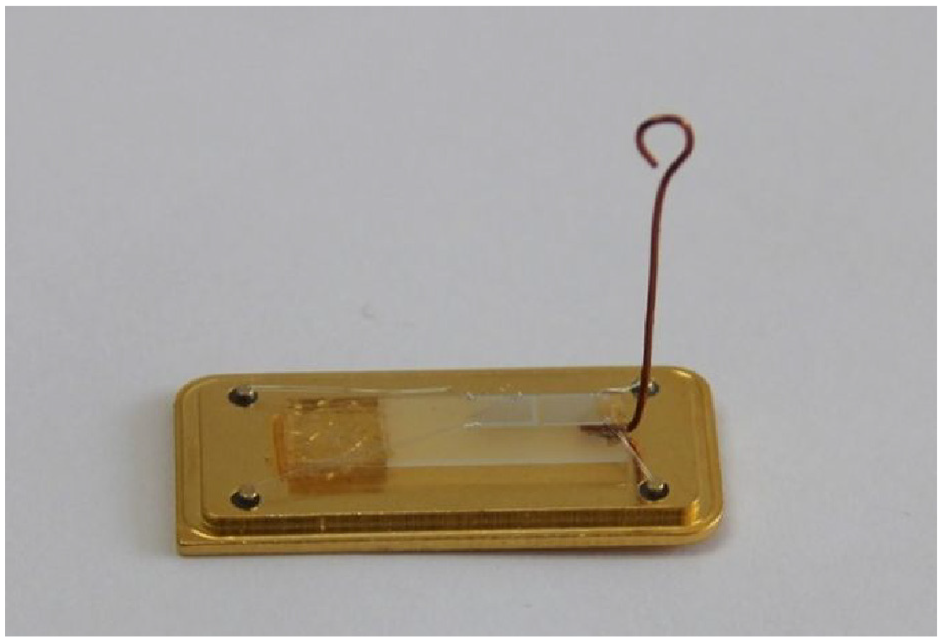
Fabricated physical form of sensor S8.
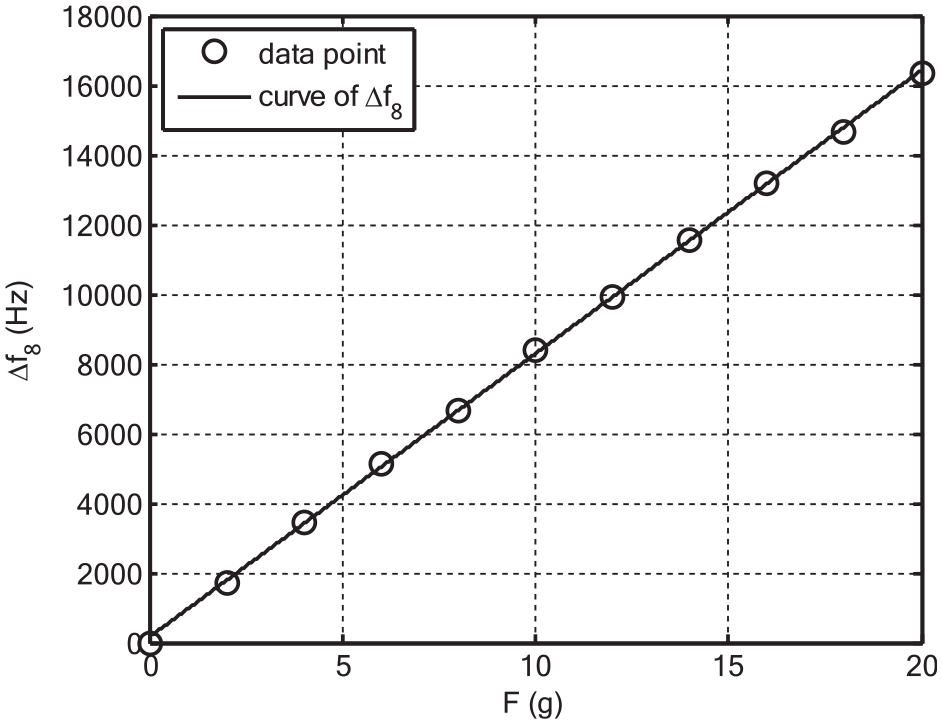
Curve between
The
Conclusion
Through theoretical research and finite element simulation analysis, it is found that there is uneven distribution of the substrate strain rate in the direction of acoustic propagation path. Based on this conclusion, the regression function between SAW yarn tension sensor sensitivity and the IDT position parameters is established and validated. Using this model, the influence of the IDT position parameters on yarn tension sensor sensitivity was analyzed. The results suggest that if IDT is farther to the left side or closer to the top edge of the substrate, higher sensor sensitivity could be achieved. According to this regression function, the optimization of sensor sensitivity was achieved through a quadratic programming model. The results show that the maximum sensitivity of 813.69 Hz/g was realized through optimizing the IDT position parameters. The modeling of substrate stress–strain characteristic is a subject worthy of further research.
Footnotes
Declaration of conflicting interests
The author(s) declared no potential conflicts of interest with respect to the research, authorship, and/or publication of this article.
Funding
The author(s) disclosed receipt of the following financial support for the research, authorship, and/or publication of this article: This article was supported by the Natural Science Foundation of Ningxia Province of China (Grant No.NZ1711, and No. 2020AAC02028), the National Natural Science Foundation of China (Grant No.61461003), the Scientific Research Project of North Minzu University(Grant No. 2020XYZJK01), the Ningxia Key Discipline Projects of “Computer Application Technology” (Grant No. PY1607) and Major Projects of North Minzu University in 2018 (Grant No. 31519040263).