
Abstract
Measurement of DC current is critically important in a wide range of applications, such as in photovoltaic power generation and DC power transmission. In this paper, the DC current measuring method based on magnetic fluids with orthogonal magnetic fields is studied. Firstly, the induced voltage of measurement coil, which contains a series of harmonics and the amplitude of its fundamental component is 2.5 times larger than that of other components, is derived and analyzed. Then, influence factors of the induced voltage are systematically studied. As a result, with a DC component injection into the exciting current, the frequency of the induced voltage becomes a half of that without a DC component, and when the DC component reaches to or exceeds the amplitude of the AC component, the induced voltage nearly has no distortion. Finally, the input-output characteristic of the measurement method is examined, and the accuracy, measuring range, and sensitivity are discussed, indicating that the linearity of the foundamental component root mean square (RMS) value curve is better than the one of the voltage amplitude curve under the same DC current range, and the sensitivities of induced voltage amplitude and the fundamental component RMS value are 5.948 and 3.717 mΩ, respectively.
Introduction
With the development of photovoltaic power generation, DC power transmission,1–3 DC distribution, railway application, 4 as well as for further improving the efficiency of DC/AC energy conversion, 5 DC power generation technology has received intensive attention recently. At the same time, DC current measurement is becoming more important.6–10 Usually, DC current measurement methods generally include shunt resistance method, 10 DC transformer method, 11 DC comparator method,12,13 Hall element method, 14 DC fluxgate sensor method, 15 circular magnetic field sensing method, 16 and optical fiber sensor method.17–20
Magnetic fluid is a solid-liquid mixture system, in which the strong magnetic particles are mixed into the base carrier liquid, and then surfactant is added to disperse the magnetic particles in the base carrier liquid uniformly. This kind of materials have good magnetization characteristics,20,23–25 and, recently, the characteristics of a magnetic fluid under an orthogonal alternating magnetic field is studied, and a model of a magnetic fluid under an orthogonal alternating magnetic field is proposed. 23 This study provides a new method for measuring DC current, however, the induced voltage in measurement coil is not derived and analyzed, and the input-output characteristic is not studied, both of which are crucial for a DC current measurement. The purpose of this paper is to provide a further study of the DC current measuring method, which provides a deep understanding of the proposed DC current measuring technique. In this paper, the induced voltage of measurement coil is derived, and influence factors of the induced voltage are also studied. The input-output characteristics of this method is proposed and studied. In section “Derivation and analysis of the induced voltage,” the induced voltage of measurement coil is derived, and its harmonics are analyzed and discussed in detail. In section “Analysis of influence factors,” the factors that affects the induced voltage are analyzed. Based on the analysis results of section “Derivation and analysis of the induced voltage,” the input-output characteristics are further studied in section “Input-out characteristics.”
At present, the researches on this novel method of DC current measuring are very few. This paper systematically studied the characteristics of the method, including induced voltage waveform features, influence factors, harmonic analysis, and the input-output characteristics, which provide new thoughts for experimental research on the DC current measuring method, and theoretical guidance for the optimal design of a DC current sensor. This work gives further promotion of the new technique applications in DC current measurement.
Derivation and analysis of the induced voltage
The geometry model of the DC current measuring method 23 is shown in Figure 1, and it mainly consists of the following nine parts, where part 1 is an AC excitation coil in the middle of the device. Part 4 is a plastic pipe, with which the AC excitation coil can be isolated from part 3, which is magnetic fluid, full filled between part 4 and part 2. Part 2 is an organic glass pipe. Part 5 is a bracket, and in this device, 4 brackets are placed uniformly to support the plastic pipe (part 4). Part 6 is an insulating pipe, which is used to fix the DC current conductor to be measured, as shown as part 7 in Figure 1. Part 8 is an insulating pallet, with which the organic glass pipe (Part 2) and the insulating pipe (Part 6) can be fixed. Part 9 is a measurement coil, in which a voltage can be induced due to a DC current in the center of this device.
Geometry model of the DC current measuring method.
For different scenarios, such as the HVDC and the PV generation system, different parameters of the device need to be designed and optimized. In this paper, the key point is the analysis of the method for DC current measuring, and a set of typical parameters are applied, as shown as Table 1.
A set of typical parameters of the model.
Mathematical model
Suppose point P is a freely chosen point in the magnetic fluid area in Figure 1, and then a axial section of the model can be determine by this point and the DC conductor, shown as Figure 2, since a point and a line can determine a plane uniquely. At point P, an area element vector


Axial section of the geometry model. 19 .
Since magnetic fluid is isotropy, the directions of magnetic induction intensity
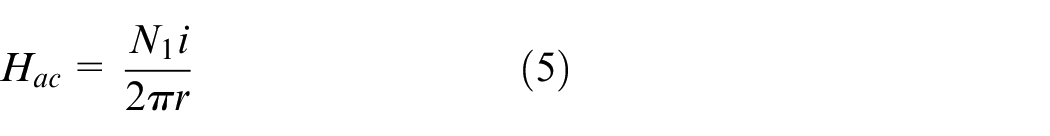
The magnetic field intensity at point P caused by an AC exciting current can be written as follows.
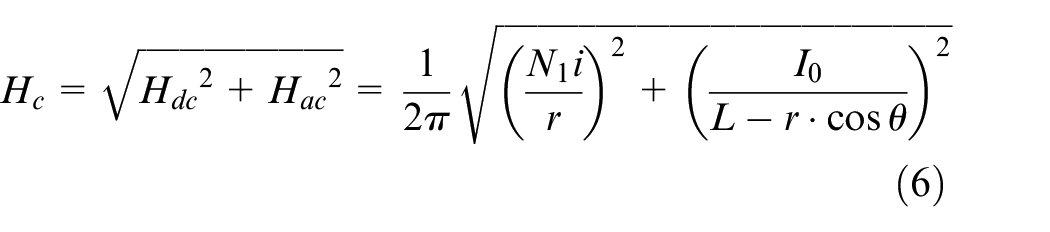
Thus, the total magnetic field intensity at point P can be written as follows.
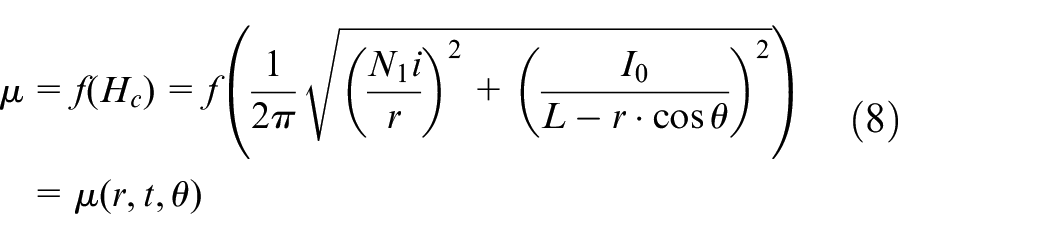
The magnetic induction intensity at point P is as follows.

Where,
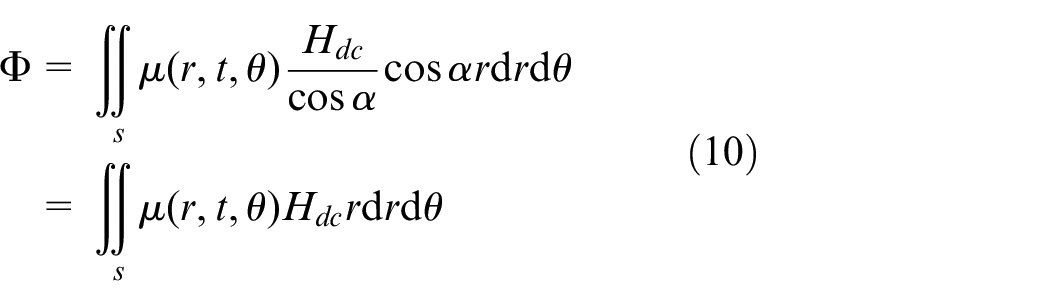
The magnetic flux of the area element is as follows.

Where α is the angle between
Thus, the induced voltage of measuring coil is as follows.
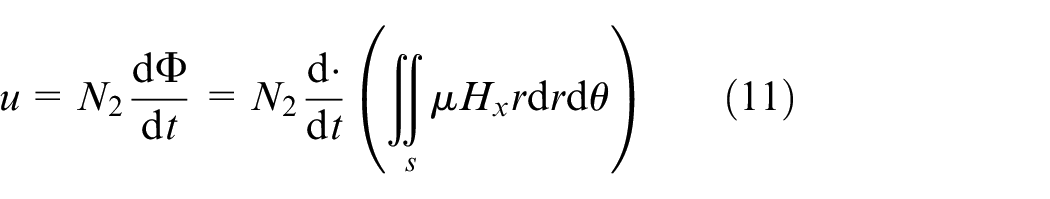
Suppose the expression of exciting current is:

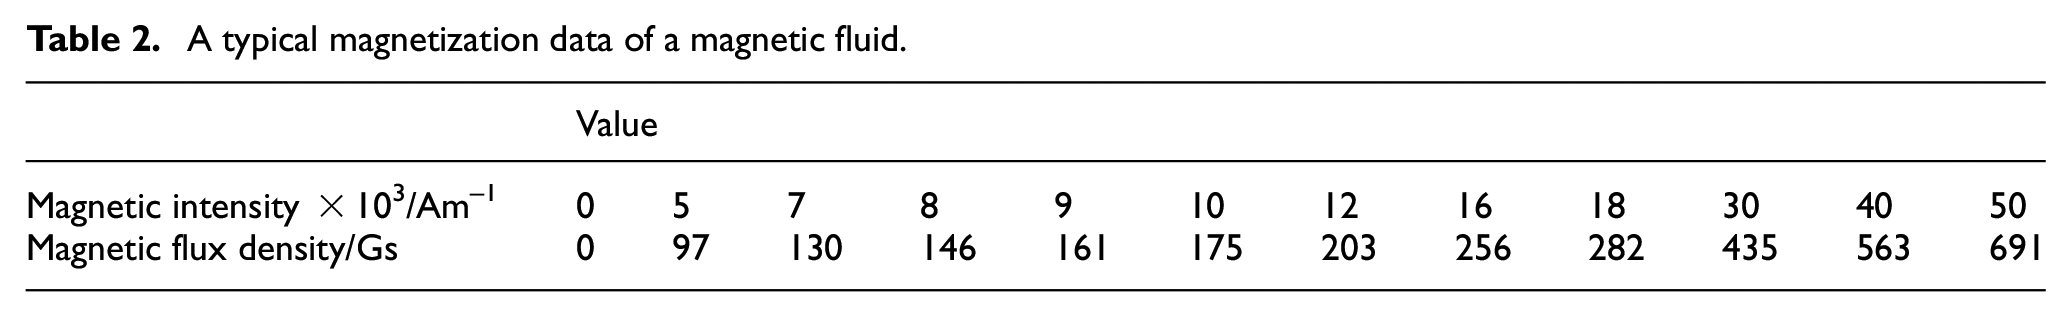
The magnetized characteristic is the most important property for DC current measurement, and a set of typical magnetization data of the magnetic fluid is shown in Table 2, and the correspoding curve 23 is shown as Figure 3.
A typical magnetization data of a magnetic fluid.
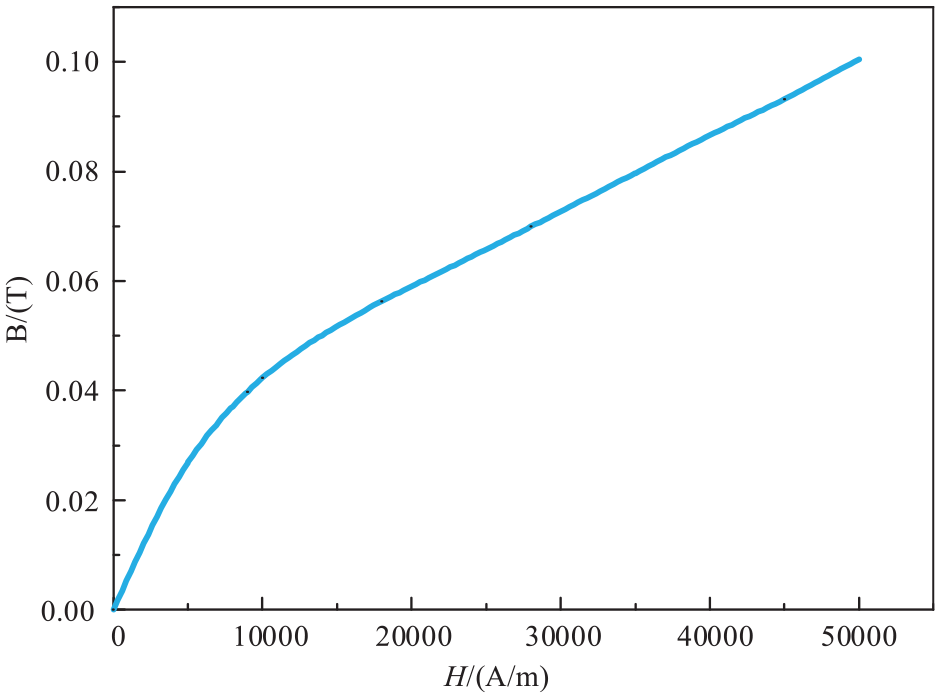
A typical magnetization curve of a magnetic fluid.
A cubic spline method is adopted to fit the magnetization curve, and thus the relationship of the magnetic flux density versus magnetic field intensity is given as:
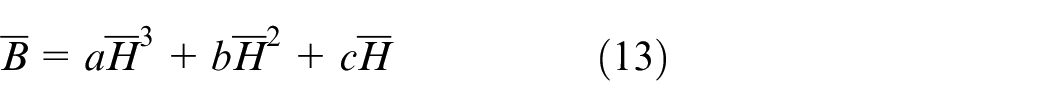
where a = 6.145 × 10⁻¹⁵, b =-3.122×10⁻¹⁰, and c = 6.741×10⁻⁶.
Substituting equations (13) and (12) into equation (10), we obtain equation (14).
Since L = 10R1 and rcosθ ≤ R1, we can suppose L≫rcosθ. Thus the following formula is workable.

Substituting equation (16) into equation (14), we obtain the magnetic flux 23 of the whole axial section as equation (16).
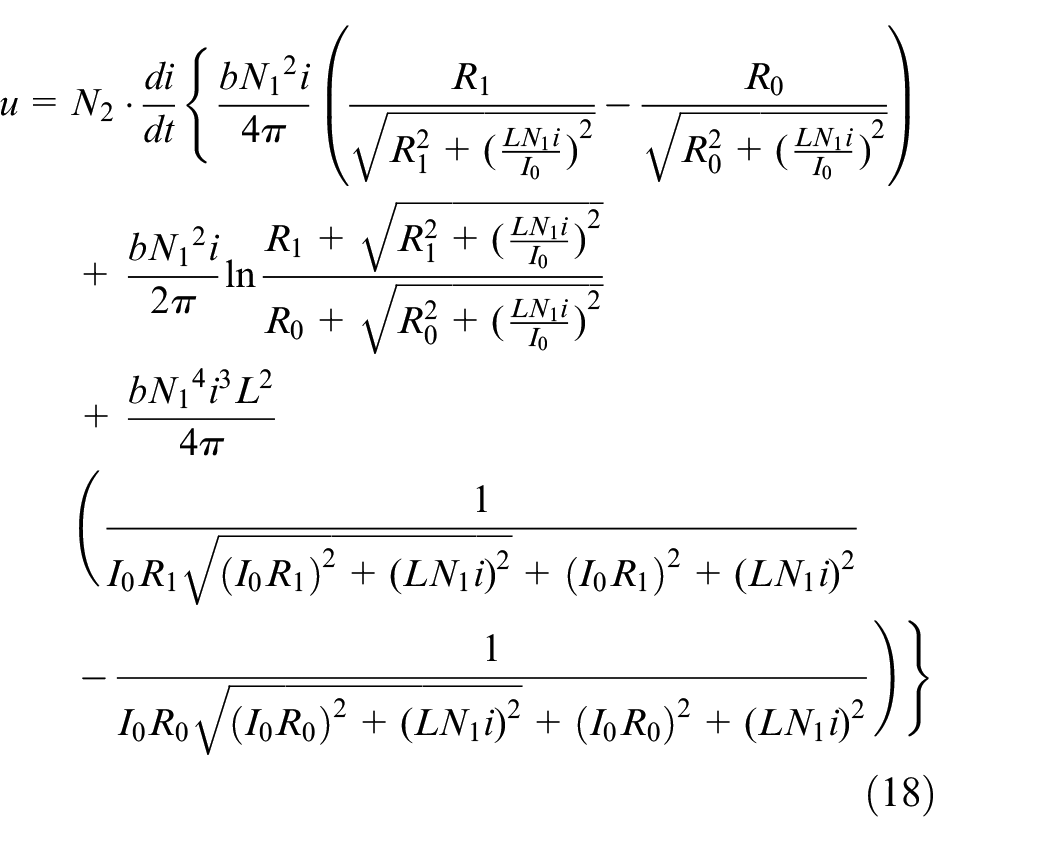
Substituting equation (16) into equation (11), we obtain the induced voltage of measuring coil, which is shown as equation (17).
Analysis of the induced voltage
The induced voltage of measuring coil is complex and it is not convenient for practical application of the DC current measuring method, and a further analysis of the induced voltage is needed. Since a≪b, the following relationship is workable,
Thus, the first term of equation (17) an be ignored, and we get
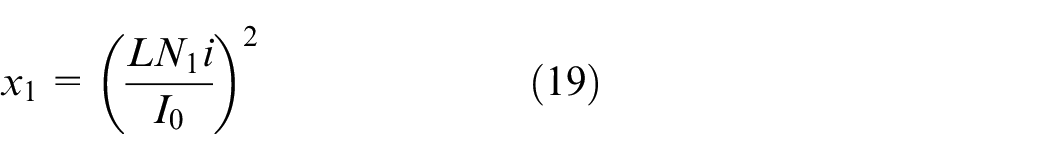
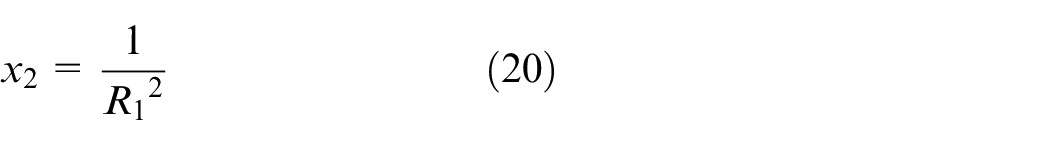
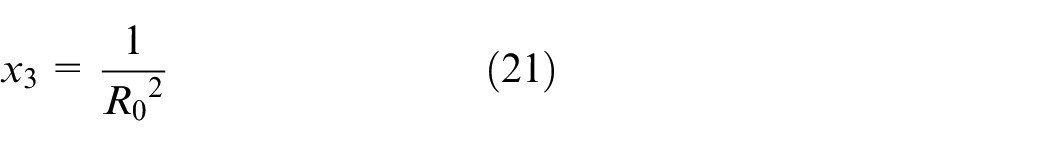
For convience of derivation, the following variable substitutions are applied, as
Thus, the first term and the third term of equation (19) can be rewritten as equation (22)
and equation (23) separately.
The sum of the first term and the third term of equation (18) is shown as follows
Thus, the equation (18) can be simplified as
Then substitute equation (12) into equation (24), we get
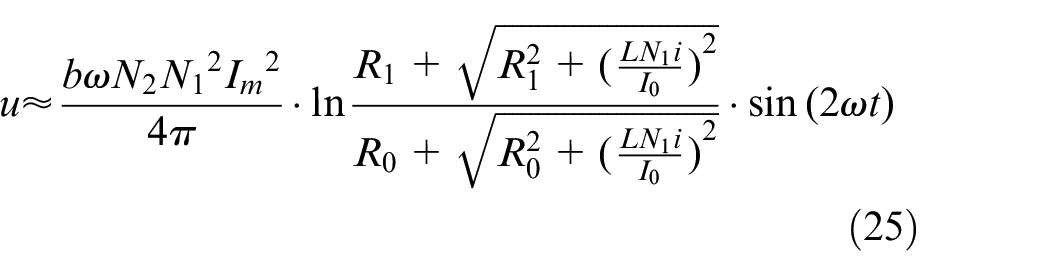
According to equation (25), the induced voltage of the measurement coil is alternating with a frequency that is twice of the one of excitating current. This is consistent with the results in paper. 23 A set of typical waveforms of the voltages induced by DC currents are shown in Figure 4. The frequency is 10,000 Hz, which is twice of the exciting current frequency.
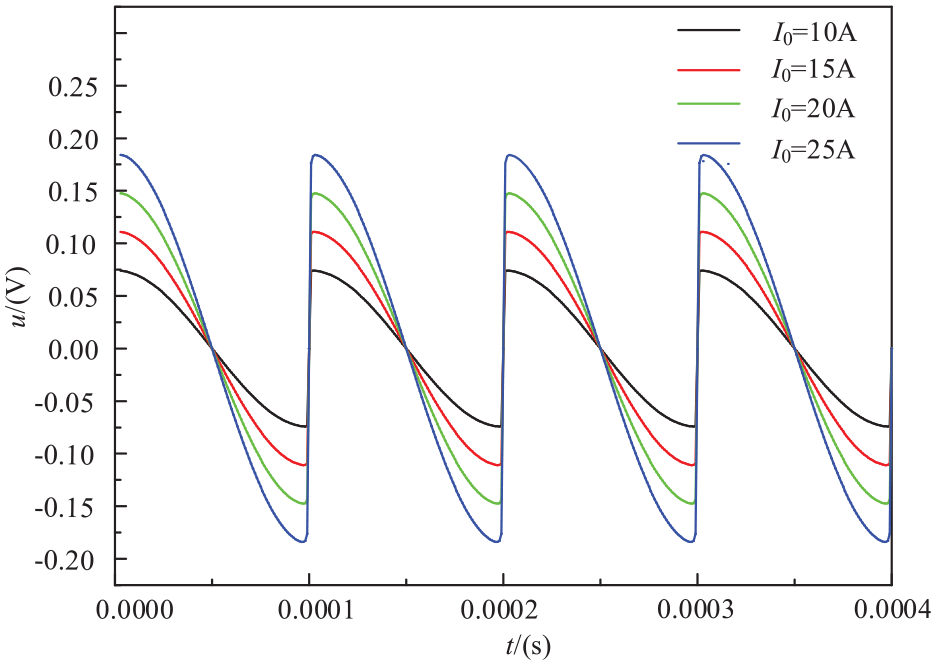
Induced voltage of the measuring coil with different DC currents.
Obviously, the waveforms in Figure 4 are distorted, which is due to the existence of a natural logarithm function in equation (10). To analyze the ingredients of the induced voltage, the Fourier Series Analysis method is adopted to process induced voltages under different DC currents. As a result, the voltage contains a series of harmonics, and the amplitude of the fundamental component is much larger than that of other components. A typical results of Fourier Series Analysis of an induced voltage under a DC current of 20 A is shown in Figure 5, which illustrates the amplitudes of harmonics from the 1st to 12th versus the frequency.
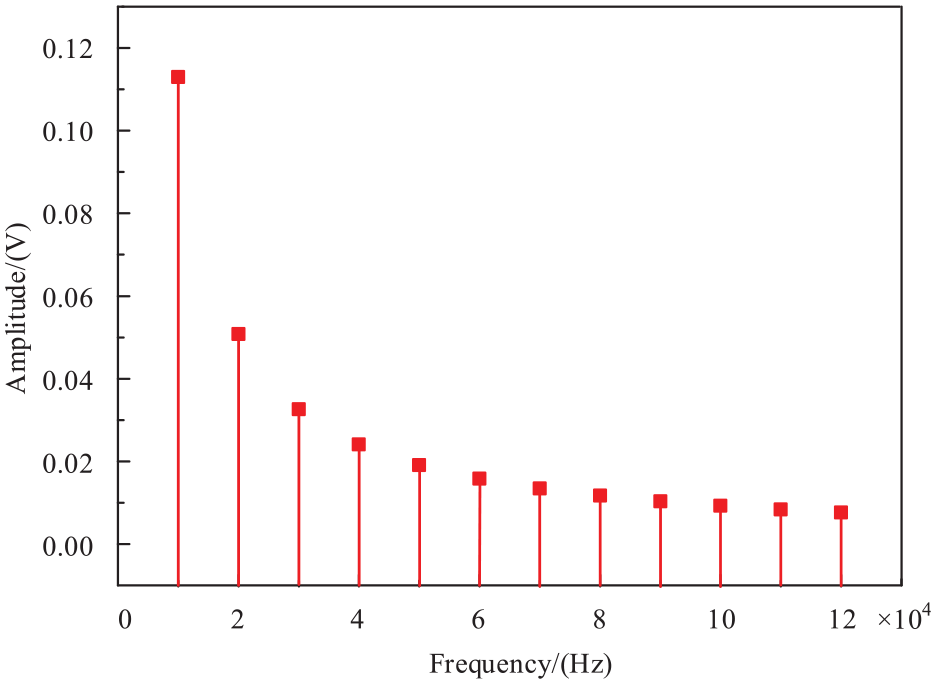
Results of Fourier series analysis (I0 = 20 A).
Analysis of influence factors
Influence of B-H characteristic of a magnetic fluid on the induced voltage
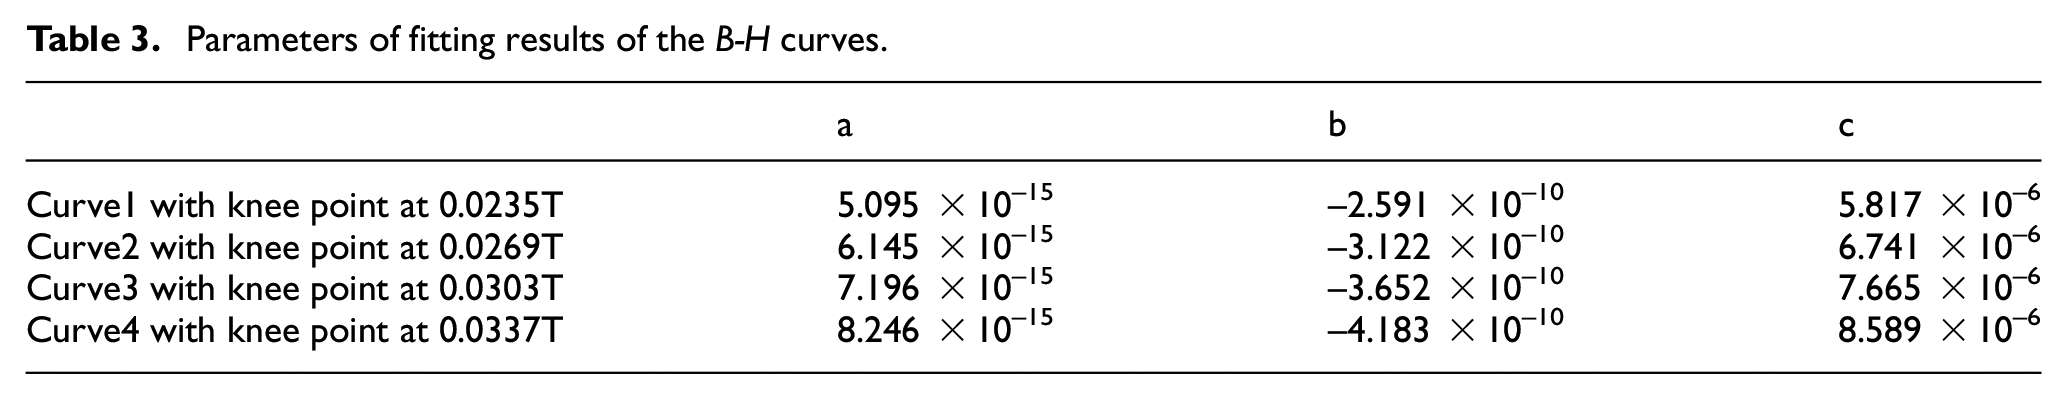
The B-H characteristic is critical to the mutual transition between the electic field and the magnetic field and it has an important influence on the induced voltage. According to the typical B-H curve of a magnetic fluid shown in Figure 3, a group of B-H curves with different knee points are obtained with the interpolation method, as shown in Figure 6. In this paper, the key point is to analyze the influence of B-H characteristics on the induced voltage, so these curves obtained through calculation can also be used. Similary, with a cubic spline method, parameters of B-H curves fitting results can be obtained, as shown in Table 3.
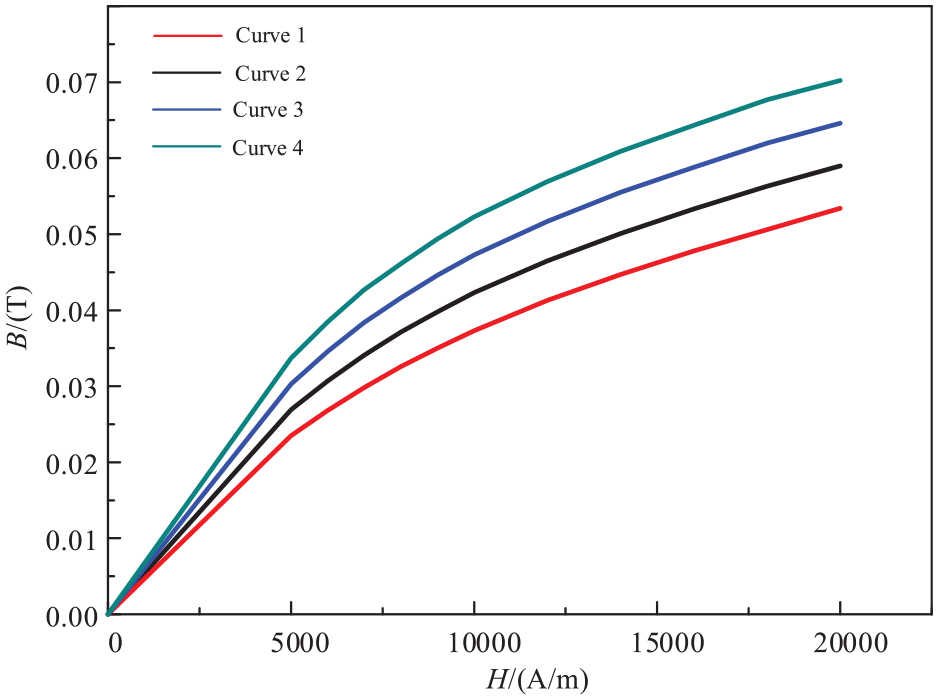
B-H curves with different knee points.
Parameters of fitting results of the B-H curves.
Waveforms of the induced voltage with different B-H characteristics are shown in Figure 7. The waveforms share a same frequency and phase, and as the knee point of B-H characteristic raises, the amplitude of the induced voltage increases as well.
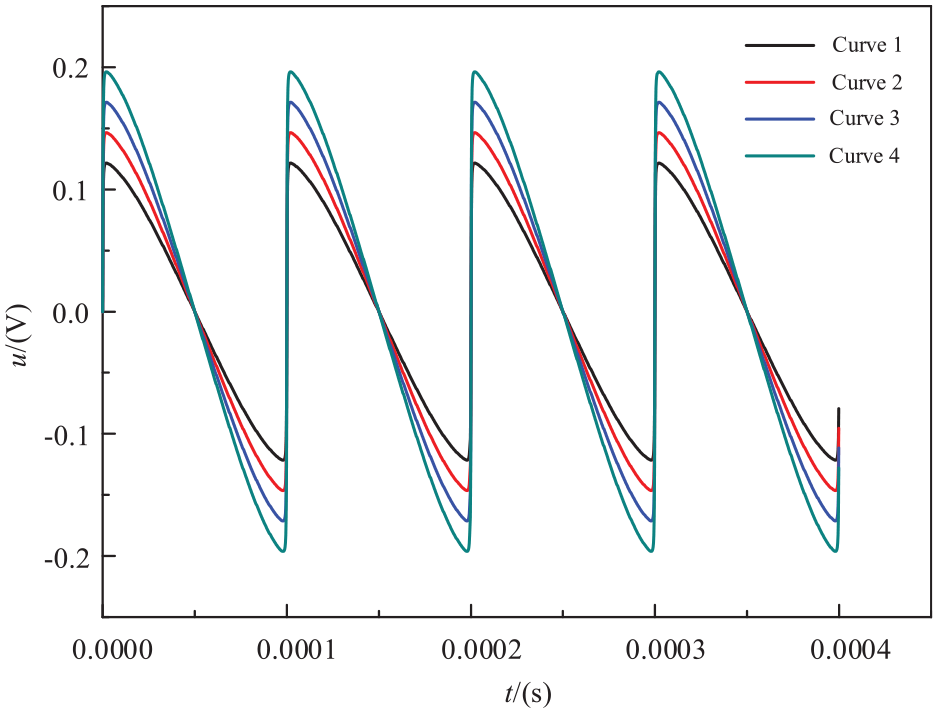
Induced voltages with different B-H characteristics.
Influence of a DC component of exciting current on the induced voltage
Exciting current is an important source of the magnetic filed in the measurement coil, and it has a great influence on the induced voltage. From equation (12), it is obviously that as the increase of amplitude or frequency of the exciting current, the amplitude of the induced voltage will increase. What is worth studying furtherly is the influence of a DC component of the exciting current on the induced voltage. Injecting different DC components into the exciting current with other conditions remain unchanged, different induced voltages can be obtained accordingly. As a result, with the injection of DC component, the induced voltage changes greatly. The frequency of the voltage becomes a half of that of the voltage without a DC component. If the DC component is less than the amplitude of the AC component, the induced voltage has a serious distortion. Once the DC component reaches to or exceeds the amplitude of the AC component, the induced voltage almost has no distortion, which means that a not very high DC component injection into the exciting current can solve the distortion problem of the induced voltage. Besides, as increase of DC component of exciting current, the amplitude of induced voltage has a slight decrease. The waveforms of the induced voltage with different DC components of exciting currents are shown in Figure 8.
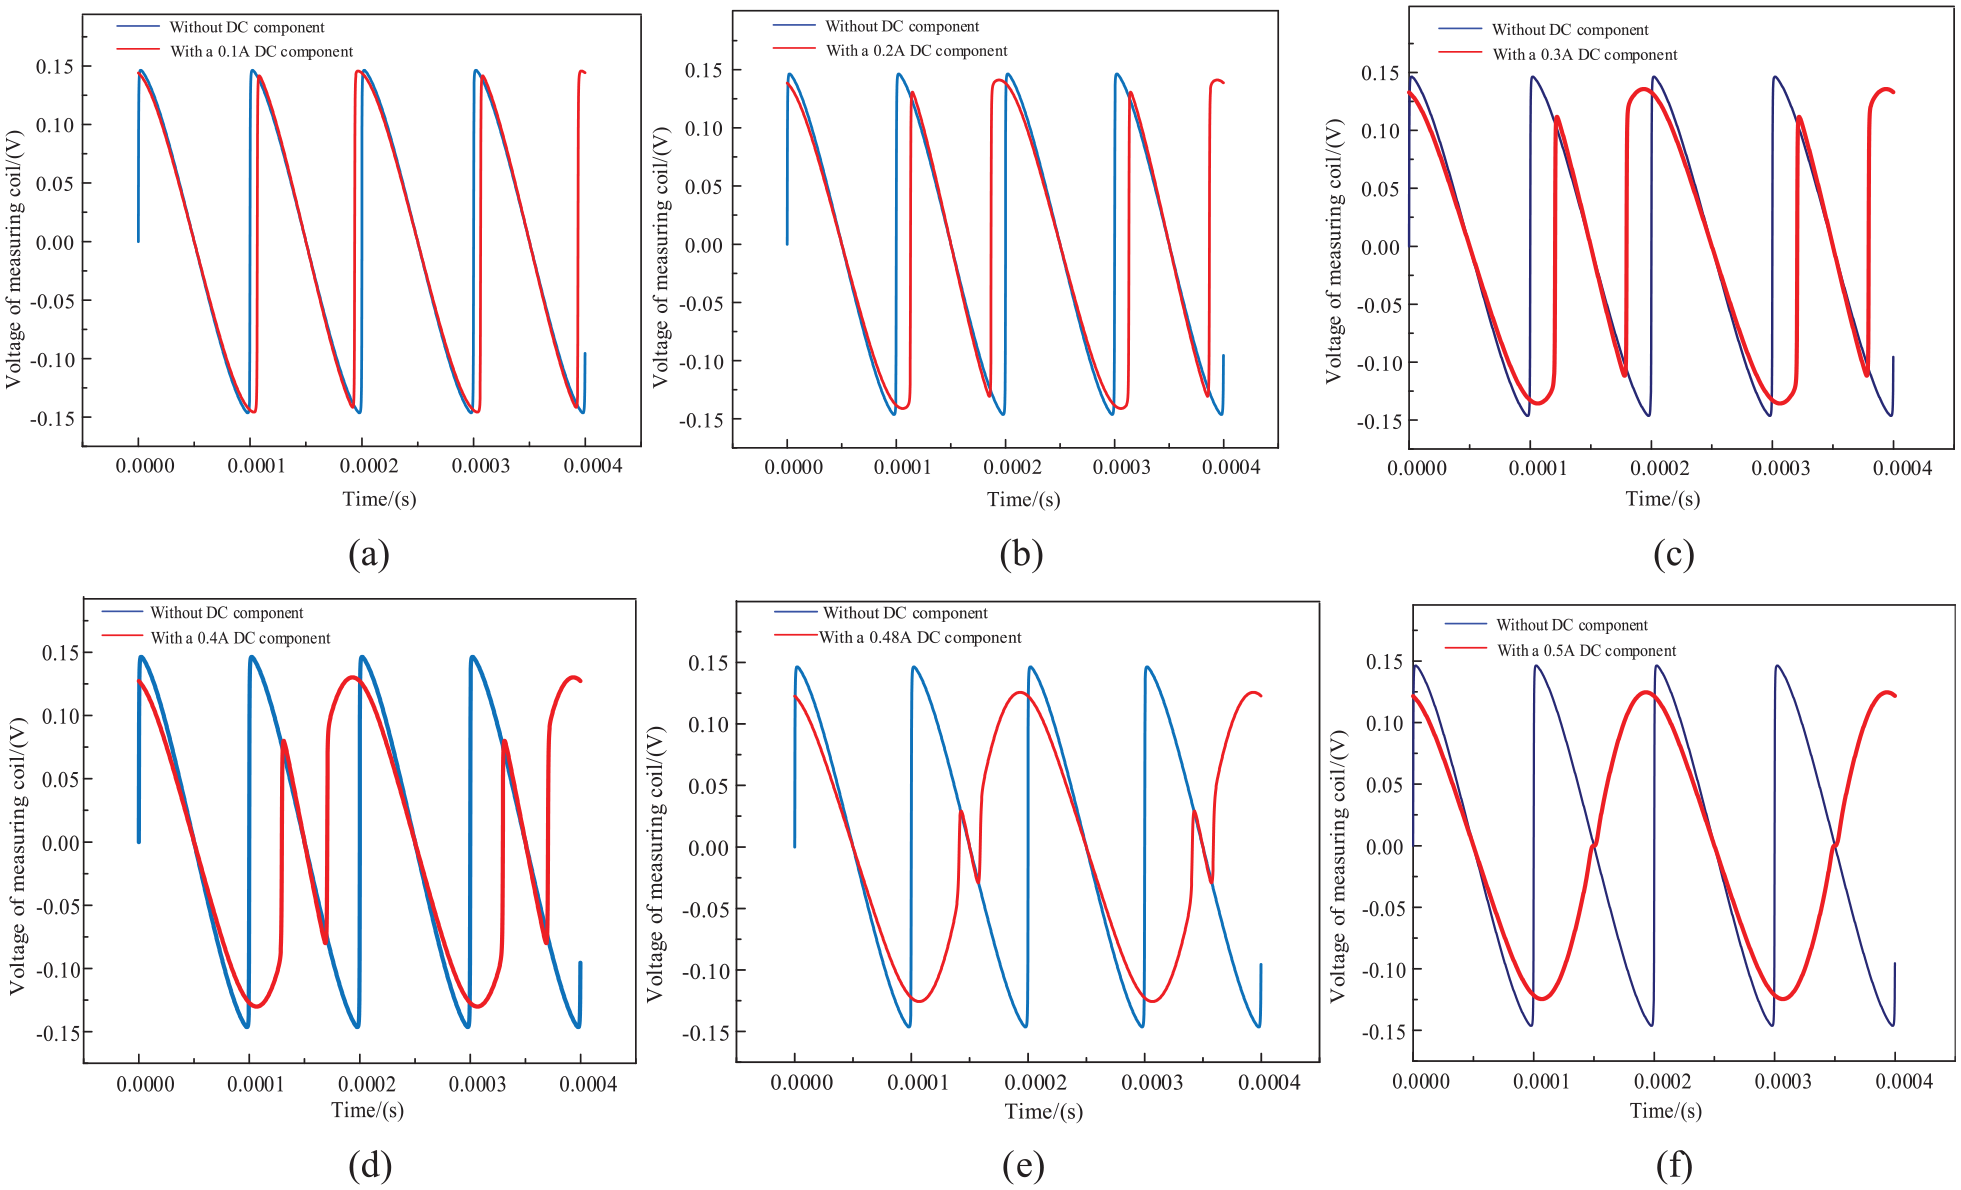
Induced voltages with different DC exciting components: (a) with a 0.1 A DC component, (b) with a 0.2 A DC component, (c) with a 0.3 A DC component, (d) with a 0.4 A DC component, (e) with a 0.48 A DC component, and (f) with a 0.5 A DC component.
The reasons are as follow: The exciting current is composed of an AC component and a DC component. The AC one causes an induced voltage component (component 1) with a frequency which is twice of that of the AC exciting current. Similarly, the DC one evokes another induced voltage component (component 2) that has the same frequency with that of AC exciting current and almost has no distortion. The two induced voltage components compose the final induced voltage. If the DC exciting current amplitude is smaller than that of AC one, the component 2 caused by the DC exciting current is less than component 1 caused by the AC exciting current, and the final induced voltage is mainly affected by the component 1 and its frequency remains the same with that of component 1 (see Figure 8(a)–(e)). Instead, if the DC exciting current amplitude is equal to, or larger than that of AC one, the component 2 caused by the DC exciting current is larger than component 1 caused by the AC exciting current, and the final induced voltage is mainly affected by the component 2 and its frequency remains the same with that of component 2 and has small distortion (see Figure 8(f)).
Input-out characteristics
A DC current is measured indirectly through the corresponding induced voltage of measurement coil with the method. Thus, the input-output characteristics are critical. According to equation (12)., we can get a series of induced voltages and DC currents. The amplitudes of the induced voltages over different DC currents are shown as the red line in Figure 9. It is clearly observed that the DC current value is small, like less than 400 A, the relationship between the amplitude of the voltage and the DC current can be approximated as a straight line, which is great for DC currents measuring. But as the DC current increases, the nonlinearity between them is more and more obvious, which is not convenient for the measurement.
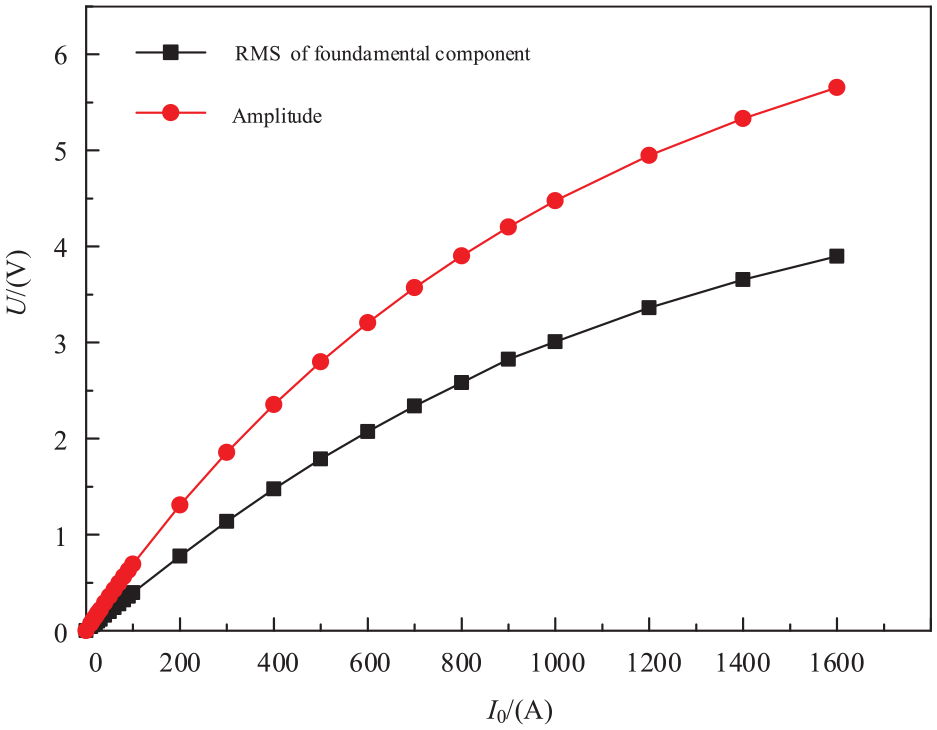
Amplitude of voltage-DC current curve.
According to the result in section “Derivation and analysis of the induced voltage” that the amplitude of the foundamental component of the induced voltage is obviously larger than that of other components, the fundamental component of the voltage can be derived to represent the DC current. Besides, the fundamental component of the voltage is a sinusoidal wave and its root mean square (RMS) value, which is convenient and widely used in measurements, can be easily calculated,which are shown as black line in Figure 9. The RMS value of the voltage is lower than the amplitude of the voltage, and the trends of the two lines are the same.
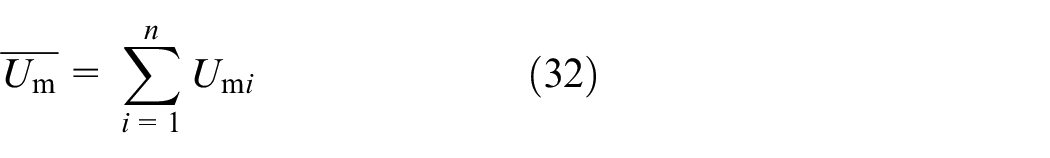
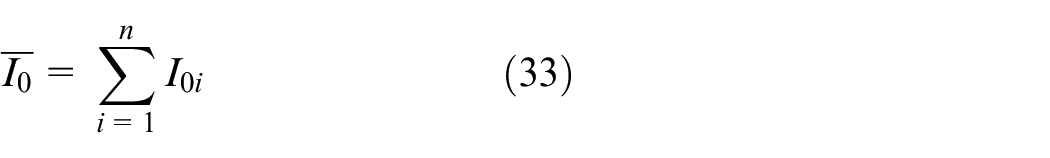
A least square fitting method is used to obtain the quantitive relationship between DC current and the induced voltage. The basic linearity regression model is as equation (26).

i = 1,2,3,…, n
Where Umi is one of the sample of induced voltage, and I0i is one of the sample of DC current to be measured. k and f are two regression coefficients to be solved in this regression model.
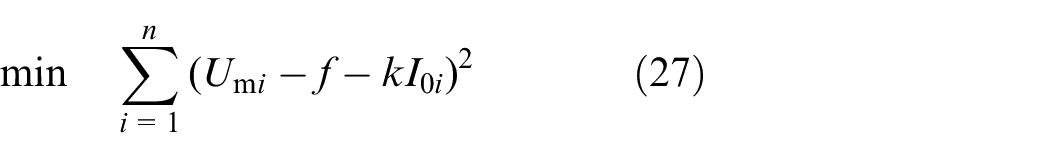
The objective function is shown as follows.
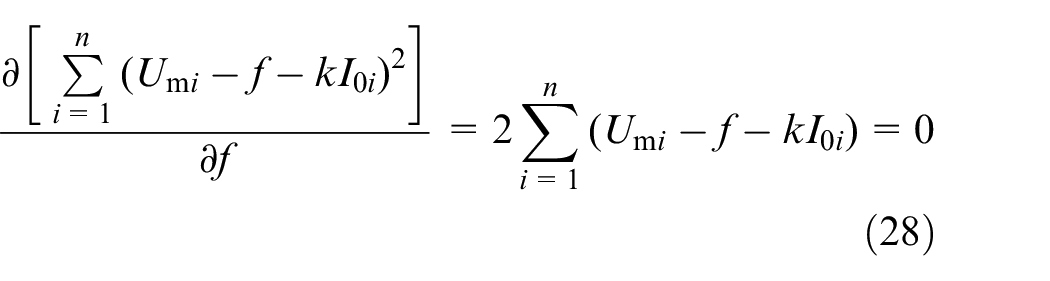
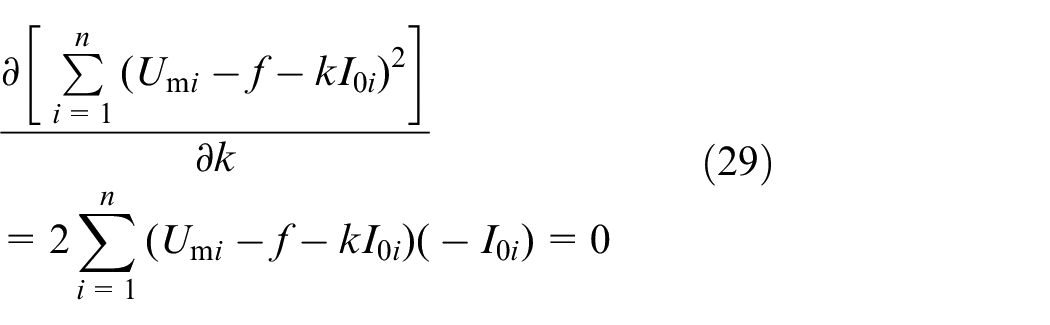
To solve this two variable extreme value problems, equation (28) and equation (29) can be obtained.
By solving equation (28) and equation (29), we get the two regression coefficients.

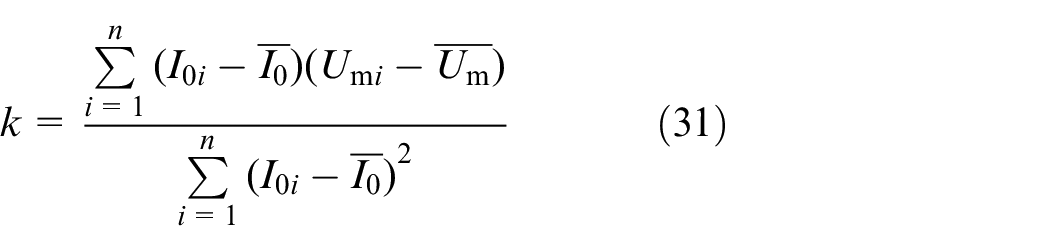
Where
Results and discussion
According to section “Input-out characteristics,” the quantitive relationship between DC current and the induced voltage can be expressed by equation (26), but as the DC current increases, the nonlinearity between the induced voltage and DC current is more and more obvious, which means that, as the the DC current measuring range enlarges, the measuring error increases. The accuracy of this method is discussed firstly.
Accuracy
Based on the results of section “Input-out characteristics,” the maximum relative error of a certain measuring range occurs at the maximum sample point. Thus the maximum relative error can be written as follows.
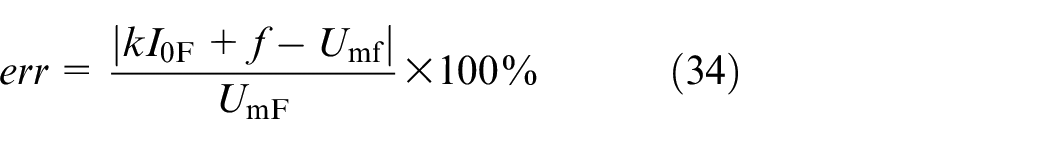
Where err is the maximum relative error of a certain DC current range; IoF and UmF are two components of the maximum sample point; k and f are two regression coefficients of a fitting result wtih the same DC current range.
According to equation (34), the maximum relative errors of the amplitudes of the voltages and the fundamental component RMS values of the voltages are obtained and shown in Figure 10. From the result, as the expansion of the DC current range, the two maximum relative errors both increase, and the maximum relative error of the amplitude fitting curve is higher than that of the fundamental component RMS value fitting curve in all ranges, which means that the linearity of the foundamental component RMS value curve is better than the one of the voltage amplitude curve.
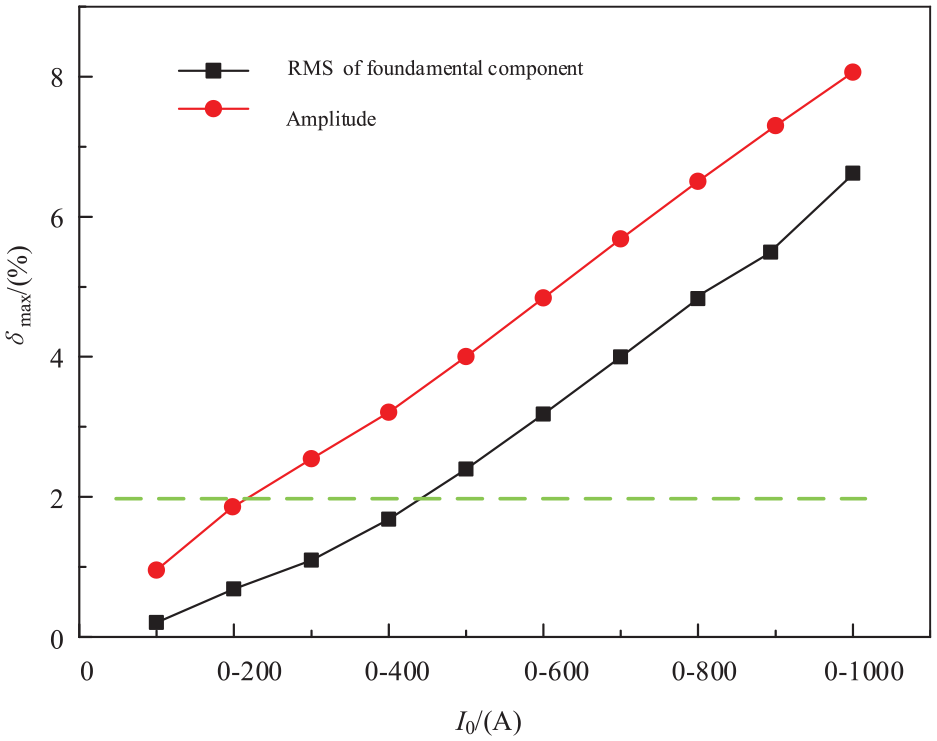
The maximum relative errors of fitting curves with different DC current ranges.
Measuring range
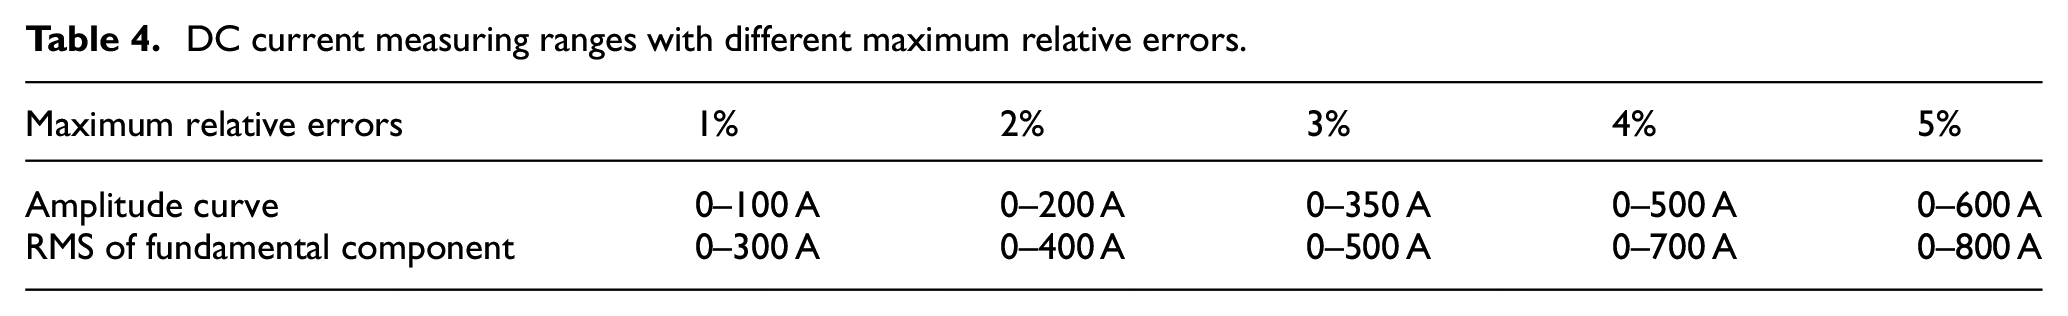
From Figure 10, the maximum relative errors increase, with the expansion of the DC current ranges. And in this theoretical work, the DC current measuring range can be obtained according to the maximum relative error. For example, with the Table 1 parameters of the DC current measuring device, if the the maximum relative error is required that can not be larger than 2%, the DC current measuring ranges of amplitude curve and RMS fundamental component are 0 to 200 A and 0 to 400 A, respectively. Table 4 shows the DC current measuring ranges with different maximum relative errors.
DC current measuring ranges with different maximum relative errors.
Sensitivity
Since the induced voltage contains a series of harmonics, the amplitudes of the voltages are picked out and the relationship between the DC currents and the amplitudes are analyzed firstly. DC currents with a range of 0 to 400 A and amplitudes of induced voltages are processed with the least square fitting model shown as equation (26), and the expression of the relationship between the two variables is obtained as

The relationship between the DC currents and the fundamental component RMS values of the voltages, given by

The two fitting curves are shown in Figure 11, the maximum relative error of the voltage amplitude curve (the blue curve) is about 3.30%, which is approximately twice of the one of fundamental component RMS value curve (the black curve).
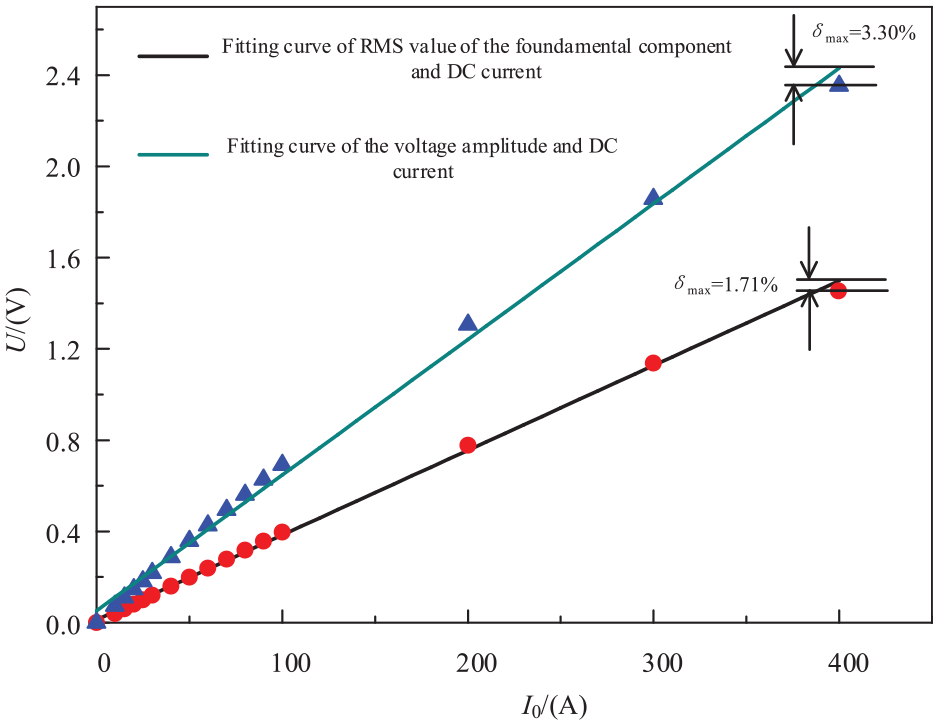
Fitting curves of voltage-DC current.
The sensitivity theoretical equation 15 and results are as follows:
According to equation (37), with a range of 0 to 400 A, the sensitivies of induced voltage amplitude and the fundamental component RMS value are 5.948 and 3.717 mΩ, respectively.
Conclusion
In this paper, the DC current measuring method based on magnetic fluids with an orthogonal magnetic field is systematically studied. Firstly, The induced voltage of measurement coil is derived and analyzed. The results show that the voltage contains a series of harmonics, and the amplitude of the foundamental component is much larger than that of other components. Afterwards, influence factors of the induced voltage are studied. The DC component of exciting current has a great influence on the induced voltage. With a DC component injection into the exciting current, the frequency of the voltage becomes a half of the one of the voltage without DC component. And if the DC component is less than the amplitude of the AC component, the induced voltage has a serious distortion. Once the DC component reaches or exceeds the amplitude of the AC component, the induced voltage almost has no distortion. In the end, the input-output characteristic of the measurement method is examined, the accuracy, measuring range and sensitivity are discussed, and as a result, the linearity of the foundamental component RMS value curve is better than the one of the voltage amplitude curve under the same DC current range. In the future work, experimental researches, like resolution and hysteresis features, need further investigation, and at the same time, proper signal modulate circuit need to be studied and designed to compensate errors caused by temperature, humidity and zero drift etc.
“Future suggestions”
Footnotes
Acknowledgements
We thank Dr Youchuang Chao for very helpful discussions.
Declaration of conflicting interests
The author(s) declared no potential conflicts of interest with respect to the research, authorship, and/or publication of this article.
Funding
The author(s) received no financial support for the research, authorship, and/or publication of this article.
Data availability statement
The data that support the findings of this study are available from the corresponding author upon reasonable request.