
Abstract
Moisture content is an important index to assess the grain quality and food processing conditions. A measurement system based on the traveling–standing microwave attenuation method is designed for a fast and nondestructive grain moisture content determination. The proposed system consists of a microwave cavity oscillator, microwave transmitting and receiving horn antennas, microwave detector, slide rail, sample container, weight sensor, temperature sensor, and controller. The traveling–standing wave caused by free space microwave multiple reflection is discussed. The moisture content calibration functions eliminated the interference of bulk density and temperature are proposed based on the attenuation of the maximum field strength of the transmission traveling–standing wave. The moisture content of rice, which ranges from 10.75% to 27.62%, is obtained with a standard error of prediction (SEP) of 0.586% and a coefficient of determination (R2) of 0.988, whereas the moisture content of corn, which ranges from 7.72% to 24.46%, is obtained with a SEP of 0.340% and R2 of 0.991. The main results might provide technical support for the development of accurate and intelligent grain quality detection equipment.
Introduction
Moisture content detection is important and essential in grain storage, trading, transportation, processing, and other processes.1,2 An excessive moisture content will lead to grain germination and mildew, which in turn lead to difficult storage. By contrast, a very low moisture content will destroy the physical structure of grains, thus reducing their nutritional value and making them easy to crush. Measuring the moisture of agricultural products requires a fast, efficient process to satisfy the requirements of high-precision and online nondestructive testing. 3 The methods for measuring grain moisture content can be divided into direct methods and indirect methods.4,5 Oven-drying technique is the most commonly used direct method. The relative moisture content are obtained by measuring the weight difference before and after drying. However, this method is destructive, discontinuous, and both time and energy consuming.
Indirect measurement methods of grain moisture include resistance, capacitance, spectrum and microwave method. The resistance moisture meter has the advantages of low cost and simple structure. 6 Because of the high electrical resistance of grains, it is usually necessary to crush the sample to increase sensitivity. For the capacitance moisture meter, the sample is placed between two capacitor plates, which can be used for on-line detection. 7 However, the measurement results are affected by the structure and density of materials, and the accuracy will be reduced when the moisture content is low. The spectral moisture meter is designed according to the principle that water absorbs the infrared radiation strongly in the corresponding band. 8 This method is fast and can realize non-contact measurement. Due to the limited penetrability, the measurement results are more sensitive to the moisture content in the surface layer rather than the whole sample. Microwave free-space techniques are known for their safe, non-destructive, and non-contact processes and their lack of special sample preparation requirements. 9 The development of miniaturization and low cost of microwave devices makes microwave moisture content measurement more competitive in industry and agriculture.10–12
At microwave frequencies, water molecules have strong polarization characteristics under the action of external electric field. The electric energy is strongly absorbed by water molecules. The energy storage and loss of water dipole are characterized by complex dielectric constant.13,14 The moisture content of materials can be measured indirectly by detecting the changes of relevant parameters caused by the interaction of microwave and water-containing materials.15,16 For granular materials, dielectric properties depend on moisture content, bulk density, frequency, and temperature.17–20 At constant frequency and temperature, moisture content can be determined using a density-independent function by measuring the attenuation and phase shift after microwave penetration of the tested sample. 21 The accuracy of the attenuation and phase shift measurements is the critical factor that affects the accuracy of moisture content measurements.
Measurement errors of microwave free-space attenuation method are mainly caused by the phase ambiguity and multiple reflection in microwave transmission. Phase ambiguity errors can be eliminated by multiple frequencies or certain material thicknesses. Microwave multiple reflections exist in the space between the antennas, inside the sample, and between the antennas and the sample boundary. 22 If the sample is thick enough to ensure an attenuation of more than 10 dB after microwave penetration, the microwave multiple reflections exist in the space between the antennas and inside the sample can be minimized, which is called the 10 dB attenuation criterion.23,24 In case of a low thickness or moisture content of the sample, using free-space microwave transmission cannot guarantee an accurate measurement of moisture content. Furthermore, the microwave multiple reflections between the antennas and the sample boundary always exist, which cannot be eliminated by changing the sample thickness. Microwave with the same frequency and opposite propagation direction will be combined into a traveling–standing wave.12,25 The uneven energy distribution in the direction of microwave propagation will reduce the measurement accuracy and limit the application of microwave moisture content measurement.
The standing wave method has been reported for measuring dielectric properties of materials.26,27 Normally a slotted line with movable probe or a movable short circuit and a fixed probe are used to determine the standing wave ratio of the standing wave induced by reflection at the specimen cell.28,29 Restricted to the structure of the measuring device, the sample needs to be placed in a specific waveguide cavity or in close contact with the measuring probe, which cannot be measured for granular stacking samples in free space.
In this study, a novel measurement system based on the free space traveling–standing wave attenuation method is designed to eliminate the interference of multiple reflections. This system is not limited by the 10 dB attenuation criterion. The moisture content calibration functions are proposed based on the measured attenuation of the maximum field strength of the transmission traveling–standing wave. The influence of bulk density and temperature is eliminated via the simultaneous acquisition of multiple parameters. The measurement system operates at a single microwave frequency, and does not need vector network analyzer equipment. Commercially available components design facilitate its use in agriculture -related industries.
Materials and methods
Sample preparation
Two samples (rice and corn) were used to validate the applicability of the proposed system. Grain samples were obtained from the Jiutai Grain Depot, Jilin Province in China. The samples were harvested in the autumn of 2019. Before the experiments, the grain reached water balance by natural drying. The moisture content of the sample was measured by oven drying method. Take 10 g of the sample into a forced-air oven and dry it at 130°C until the weight does not decrease any more. The process of sample sampling and drying is shown in Figure 1. The moisture content of the sample is then determined based on the weight reduction of the sample before and after drying. It should be noted that the sampling process should be uniform and random as far as possible, so that the measurement results can represent the average value of the overall moisture content of the sample. Moisture content was calculated as

where mt is the total mass, and md is the dry mass of the samples.
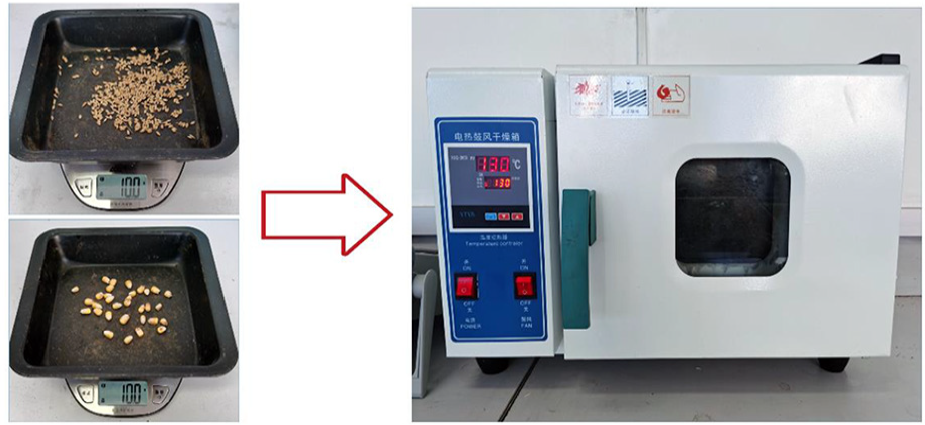
Sampling and drying of corn and rice samples.
The initial moisture contents of rice and corn were 10.73% and 7.65%, respectively. Then the moisture content of samples was controlled artificially by mixing proper amounts of water evenly. The moisture gradually increased in increments of approximately 4% by constant stirring. Finally, a total of 10 samples with different moisture content ranging from 10.73% to 27.84% for rice and from 7.65% to 24.07% for corn were obtained. Then each sample was sealed at 4°C for 3 days to give the water molecules enough time to reach the bond state.
Measurement system
The experimental setup consists of a microwave cavity oscillator, microwave transmitting and receiving horn antennas, microwave detector, slide rail, sample container, weight sensor, temperature sensor, and controller. The structure of the experimental setup is shown in Figure 2. The continuous microwave is generated by a Gunn diode installed in waveguide cavity. Microwave signals with a frequency of 10.5 GHz and a power of 20 mW were excited by 8 V DC voltage. The waveguide cavity model was WR90 with inside dimensions of 10.16 × 22.86 mm. Microwave was transmitted from conical horn antenna to the sample. The horn antenna had a port diameter of 100 mm and gain of 18 dBi at operating frequency. The horn antenna was fabricated by aluminum and was operated at linear polarization. The transmitting horn antenna was fixed by a sensor bracket and radiated perpendicular to the surface of sample container to reduce the diffraction and edge errors.
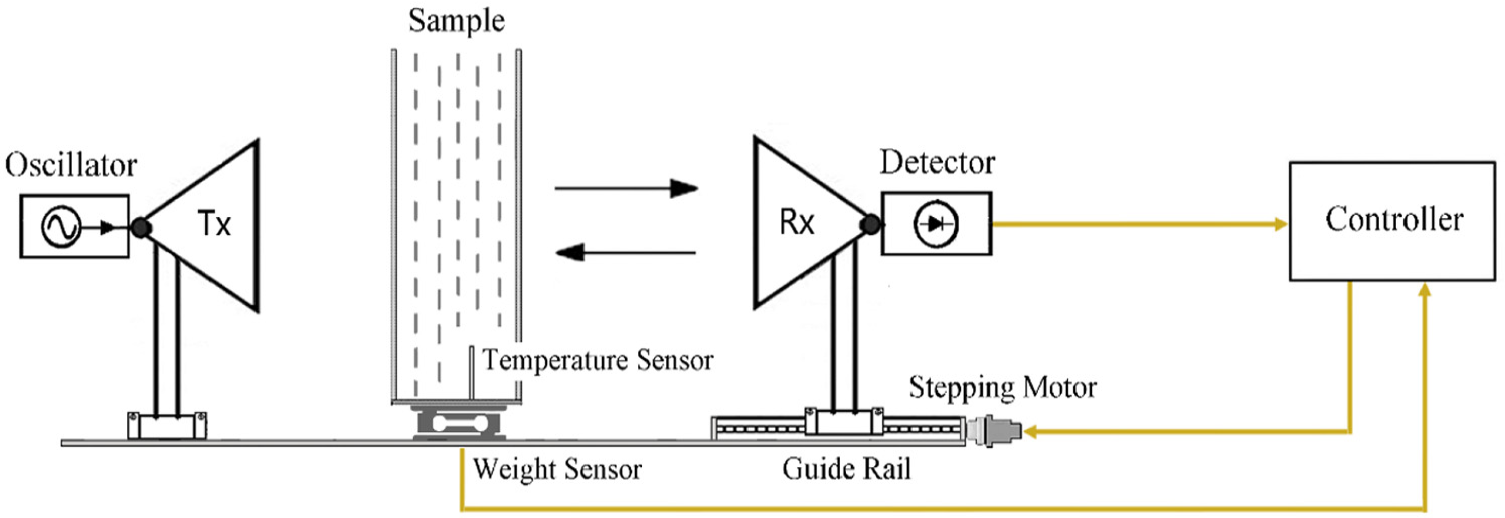
Schematic diagram of microwave measurement system.
The sample container was made of acrylic plates and placed in the space between the transmitting and receiving horn antennas. The internal dimensions of the container were 50 mm in thickness, 200 mm in width, and 200 mm in height. The thickness of acrylic plate was 3 mm. During the measurement, the sample container was evenly filled with rice or corn. The surface of the sample container was kept perpendicular to the direction of the microwave propagation. The temperature and weight of the sample are measured by a temperature sensor and a weight sensor located under the container.
The transmitted microwave was received by a microwave receiving antenna. The receiving antenna had the same structure and size as the transmitting antenna, and both of these antennas were located on the same microwave propagation axis to ensure that the strongest signal would be received. The amplitude of the transmitted microwave was detected by a Schottky detector diode. The receiving horn antenna was fixed on a guide rail. The guide rail can slide freely in the horizontal direction by the rotation of the stepping motor. The DC voltage signal with different positions was eventually detected by the controller. The controller is a circuit board with STM32F103 chip as the core, which also has the functions of stepping motor control, temperature, and weight acquisition.
Traveling–standing microwave measurement
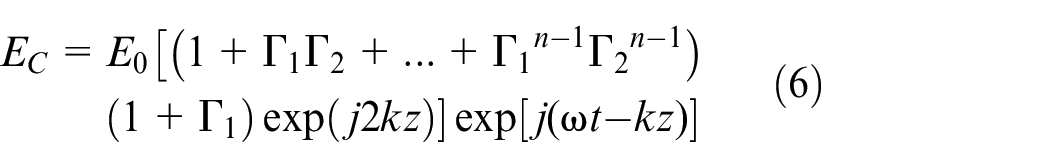
The schematic view of microwave signal transmission is shown in Figure 3(a). The incident microwave, which propagates in the +z direction, interacts with the sample. The transmitted microwave Ei can be expressed as

where E0 is the electric field of transmission microwave, ω is the microwave angular frequency, k is the wave number, and z is the microwave propagation distance. Ei is a traveling wave and change with time t periodically. Suppose that the antenna interface reflection coefficient is Γ1 and the sample interface reflection coefficient is Γ2. Multiple microwave reflections are observed in the space between the sample interface and receiving antenna. When the reflection number n is odd, the direction of the reflected microwave Ern is opposite to the transmitted microwave Ei, which can be expressed as
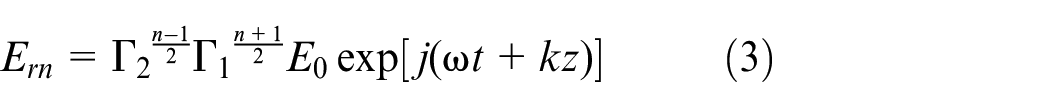
When the reflection number n is even, Ern has the same direction as Ei. The reflected microwave Ern can be expressed as

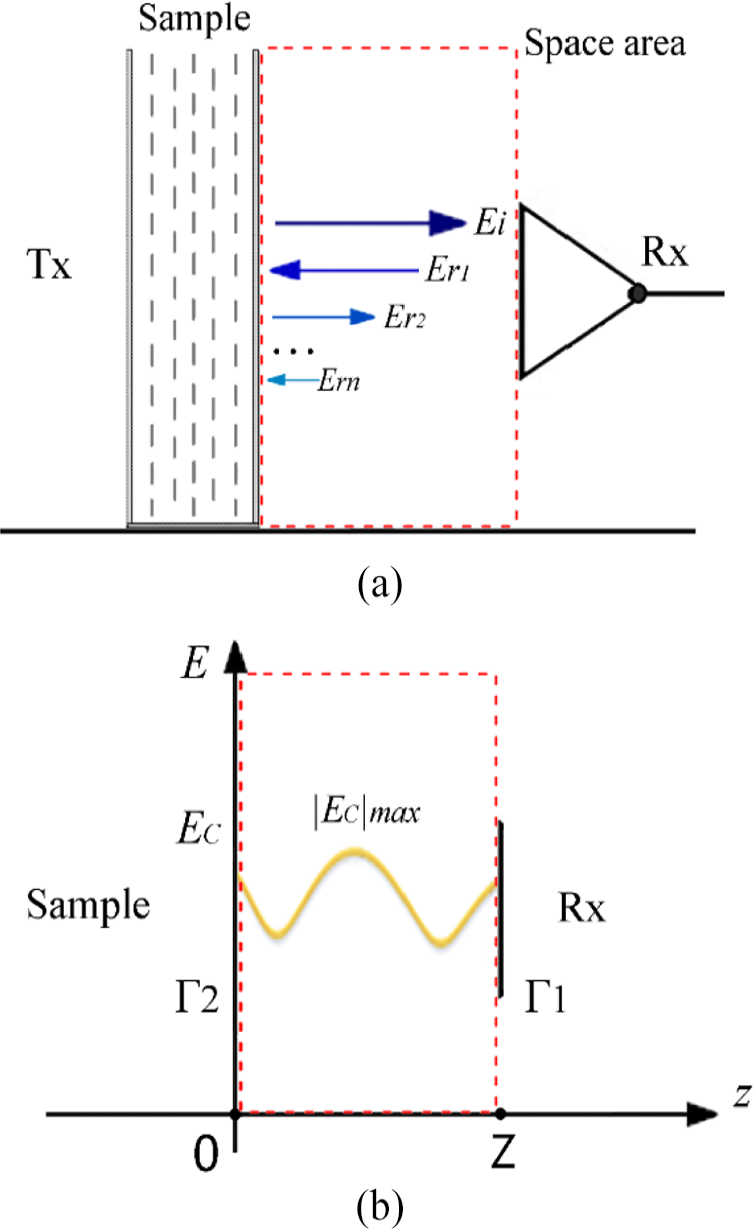
(a) The schematic view of microwave signal transmission, and (b) the electric field of traveling-standing wave.
The combined microwave EC between the sample and receiving antenna can be expressed as

EC can be calculated as follows by combining equations (3) and (4):
For lossy media like grain, Γ1<1 and Γ2<1. Therefore, the product Γ1Γ2<<1. The following equation can be obtained by simplifying equation (6) and considering the main components:

Equation (7) shows that the combined microwave EC can be described as a traveling–standing wave (Figure 3(b)), where
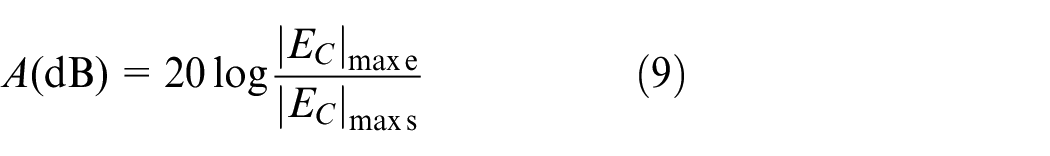
In this paper, a method to eliminate the interference of multiple reflections is proposed based on the attenuation of the maximum field strength of the traveling–standing wave. The electric field of the traveling–standing wave EC has the maximum value at the antinode (cos2kz = 1):

where the reflection coefficient Γ1 is a constant that is only related to the antenna structure, whereas E0 is the electric field of the transmission microwave Ei. E0 is related to microwave attenuation. The higher the moisture content of the sample, the greater the microwave attenuation. Set
The following simplified equation can be obtained
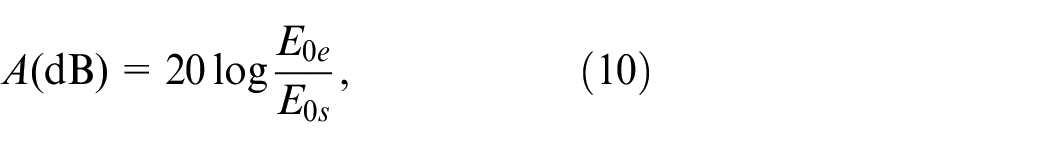
where E0e and E0s are the electric fields of the transmission microwave without and with the sample, respectively. Equation (10) shows that the attenuation of the maximum field of the traveling–standing wave is equal to the attenuation of the electric field of transmission microwave E0, which is independent of the measurement system and multiple reflections. In other words, the interference of multiple reflections can be eliminated by calculating the attenuation of the maximum field of the traveling–standing wave of different samples.
A photograph of the experimental setup is shown in Figure 4. The distance Z between the receiving antenna and the sample surface gradually increased during the measurement from 50 to 100 mm. The stepping motor of the slide rail rotated one full circle, and then the antenna moved by 1.25 mm. In the experiment, the stepping motor rotated at a speed of 10 revolutions per second, and the controller collected 40 data points per second. The voltage measured by the receiving antenna varied periodically along with antenna distance Z. To measure a complete period of traveling–standing wave, the moving distance of the receiving antenna should be greater than half wavelength (about 14.29 mm at 10.5 GHz). After completing the microwave measurement, the data of temperature sensor and weight sensor were collected synchronously by the controller. To reduce irregular scattering errors, the sample stacking was kept as uniform as possible to smoothen the boundary surface. During the measurement, only the grain samples in the container were changed to ensure a single variable.
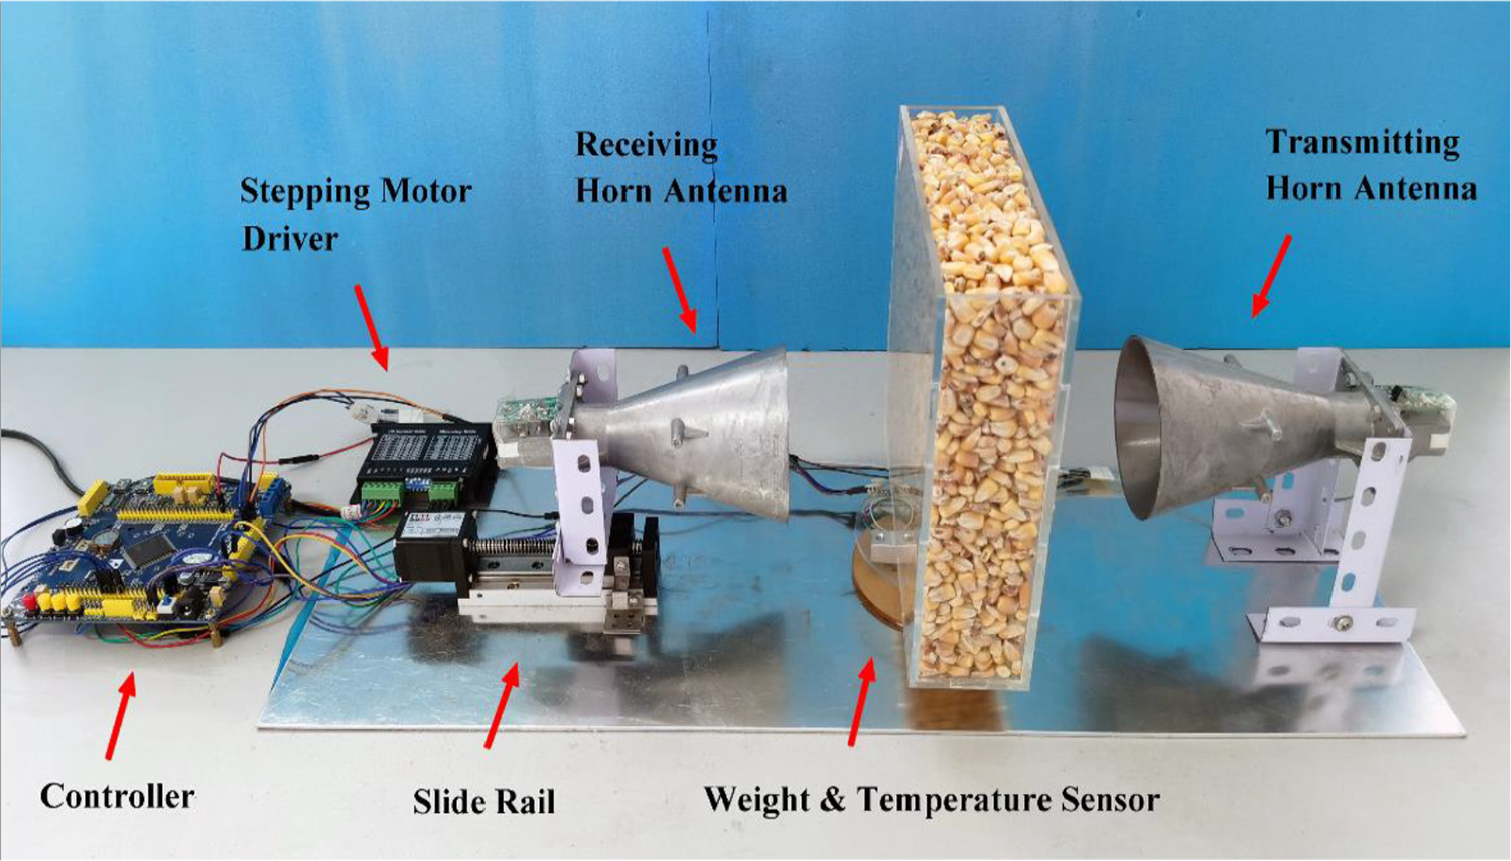
Photograph of the experimental setup.
Sample bulk density and temperature
The bulk density represents the average distribution of grain particles. The change in bulk density changes the number of particles interacting with microwave in unit space. The experiments were repeated at two different bulk densities ranging from loose to dense. A plastic plate was used to compress the sample inside the container evenly to change the volume and control the bulk density. Sample bulk density was calculated as follows

where vs is the volume of the sample read out by the volume scale, and mt is the net weight of the sample in the container as obtained by the weight sensor (i.e. by subtracting the constant weight of the container from its total weight).
At a constant frequency, temperature will change the complex dielectric properties of samples. The measurements were repeated at different temperatures during the experiment. Samples with different moisture contents were sealed in plastic bags and placed in a temperature-controlled chamber with temperature of 10°C, room temperature, 30°C, or 40°C for 24 h to reach the temperature balance. Each sample was then moved to room temperature for measurement. Since a short time of single measurement, the temperature of the sample did not vary more than 1°C before and after the measurement. The experiments were repeated thrice for each sample and the results were averaged. A total of 240 microwave independent measurements were carried out for samples with different moisture contents and bulk densities at four different temperatures.
Results and discussion
Moisture content and bulk density
The moisture content and bulk density distribution of rice and corn is shown in Figure 5. The moisture contents vary from 10.73% to 27.84% for rice and from 7.65% to 24.07% for corn, whereas the bulk densities vary from 0.540 to 0.671 g/cm3 for rice and from 0.658 to 0.803 g/cm3 for corn. With an increasing moisture content, the bulk density of rice and corn shows an opposite trend. The volume of corn kernels expands after absorbing water, thereby leading to an abnormal decrease in their bulk density along with an increasing moisture content. Restricted by rice husk, the volume of rice kernels does not change significantly after water absorption. Meanwhile, the bulk density of rice increases along with moisture content.
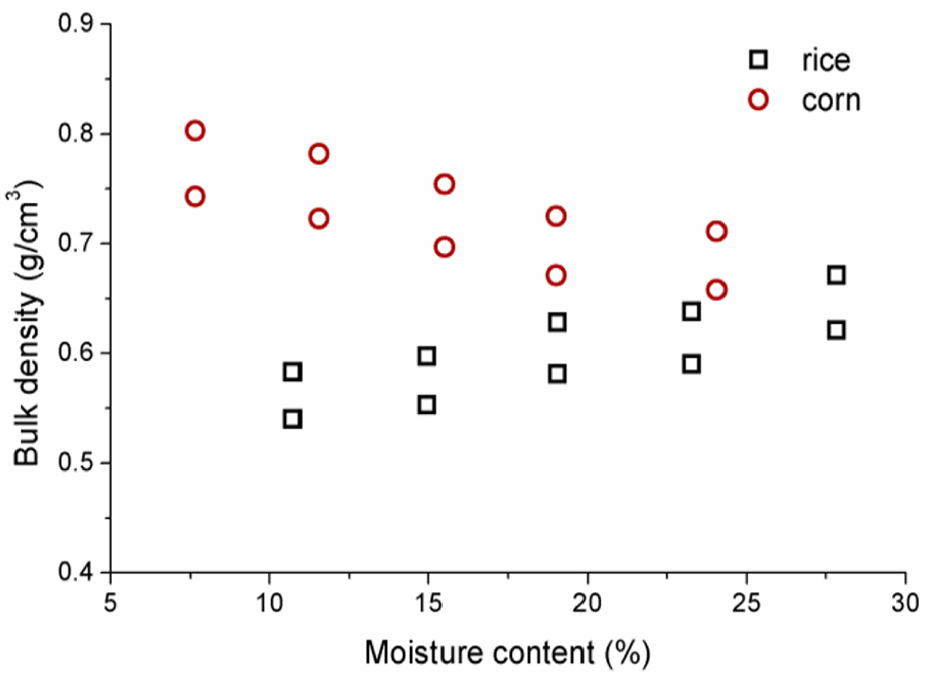
The moisture content and bulk density distribution of rice and corn.
Attenuation of the traveling–standing microwave
Rice and corn samples are measured by using the proposed measurement system. Driven by the motor, the receiving antenna moves horizontally on the slide rail. The variations in the detection signal of the receiving antenna of corn along with antenna moving distance are shown in Figure 6. The electric field in the space between the sample container interface and the radar receiving antenna has obvious characteristics of traveling-standing wave. The detection signal shows periodic changes as the antenna distance increased to approximately 14.3 mm (approximately equal to half the wavelength of microwave), and this finding is consistent with the conclusion of equation (7). In the process of grain measurement, the antenna needs to move more than 14.3 mm on the slide rail each time, and the maximum voltage value of traveling-standing wave in the first cycle can be obtained. A lower moisture content corresponds to a greater amplitude change in the detection signal. The maximum amplitude change is observed when the sample container is empty. The fluctuations in bulk density affect the transmission attenuation of microwave at the same moisture content. Typically, a greater bulk density corresponds to a stronger signal attenuation. For rice, the conclusions are similar to that of corn.
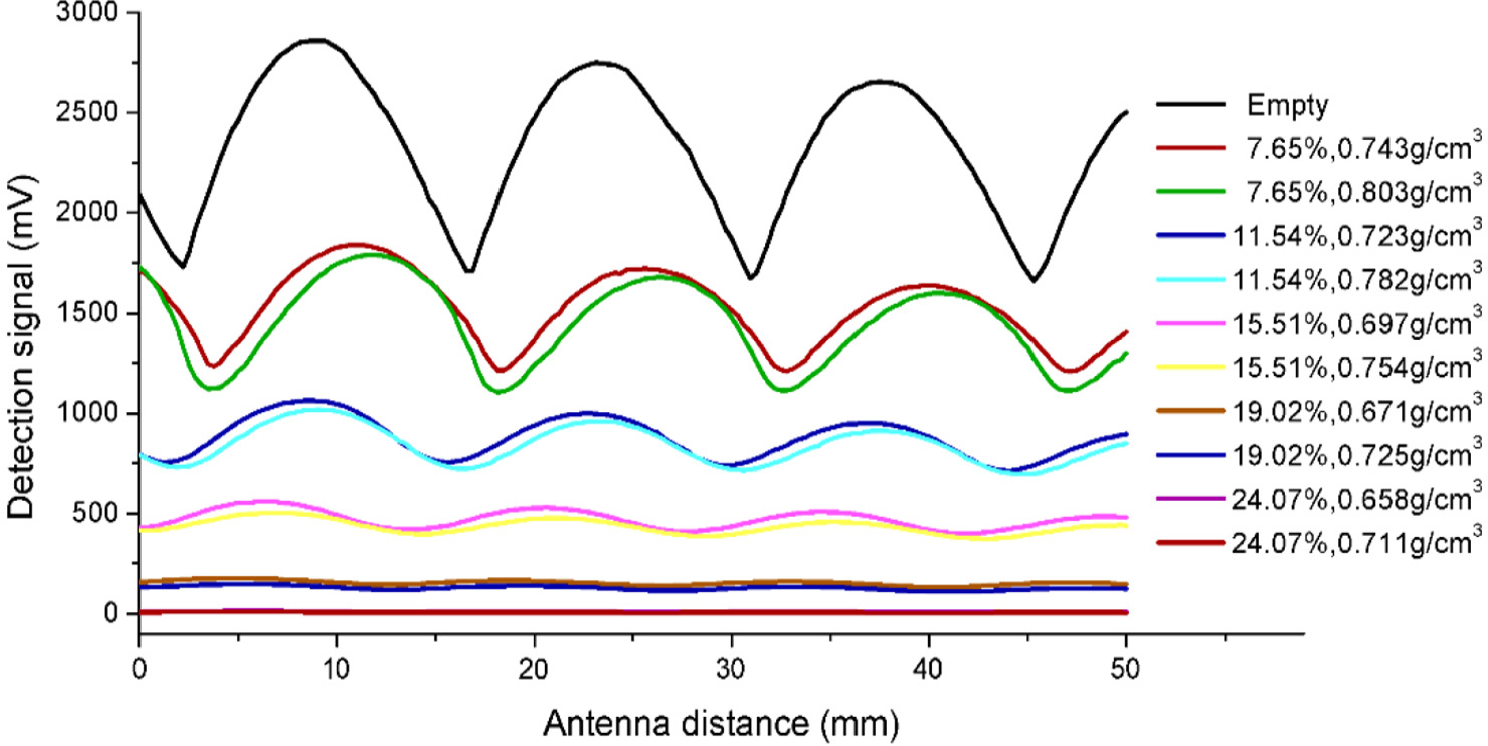
The variations in the detection signal of corn with antenna distance at 22°C.
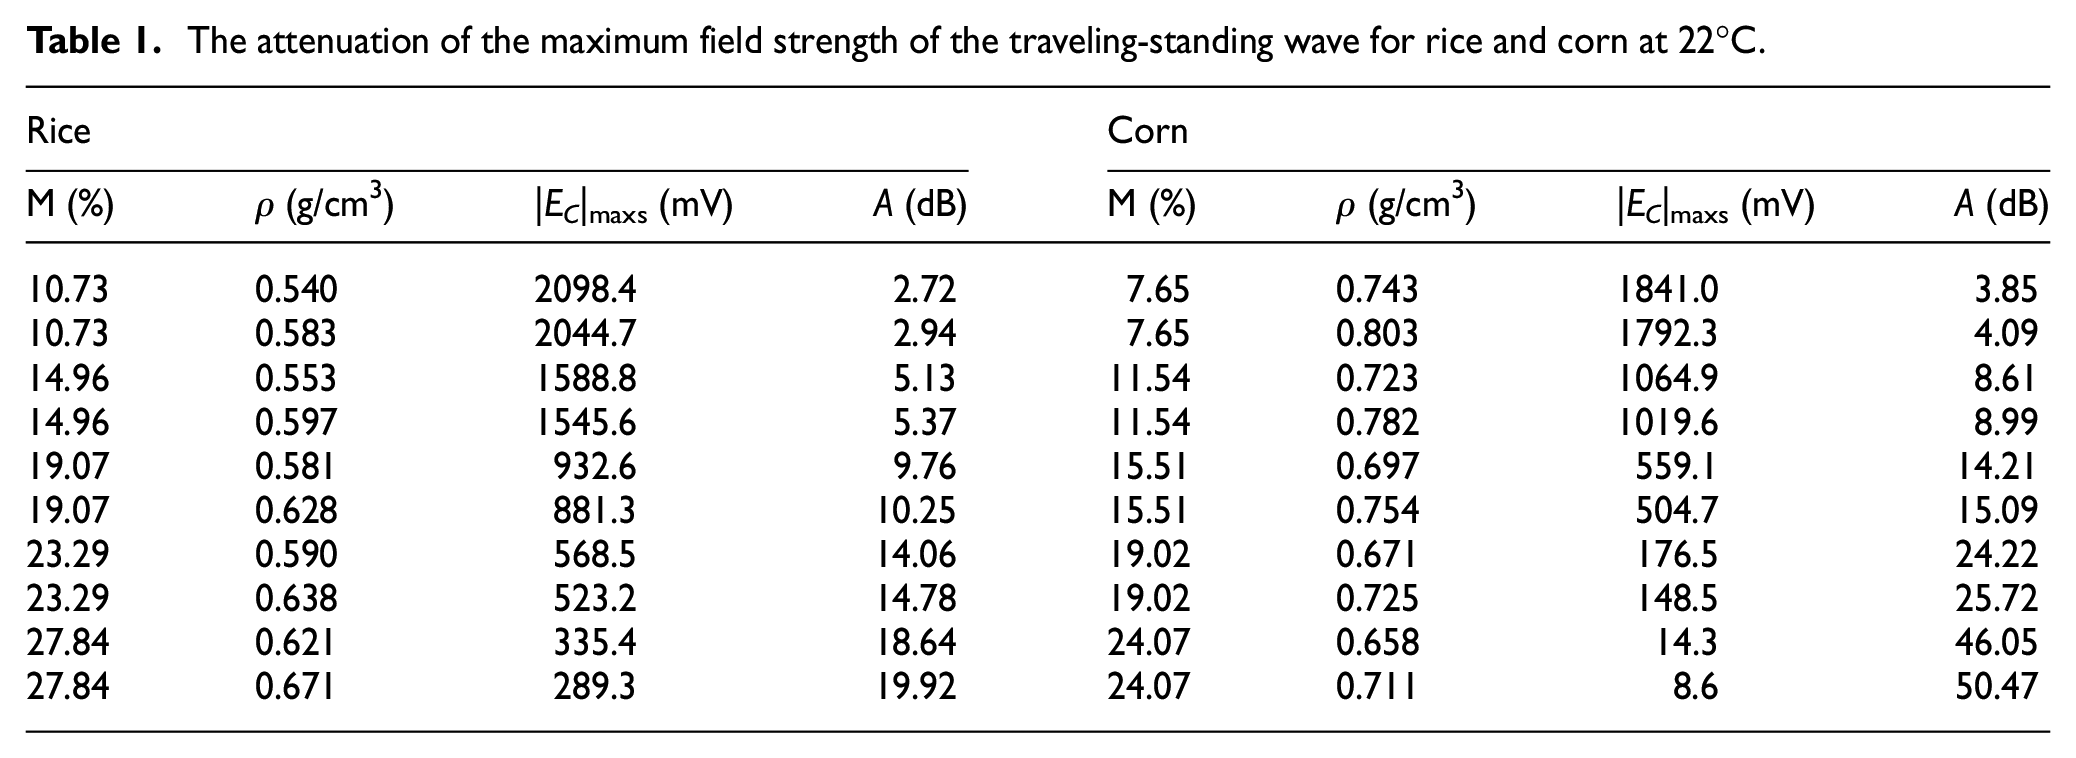
The maximum value of the traveling–standing wave is determined by comparison and sorting. Table 1 shows the ranges of the maximum value of the traveling–standing wave for rice and corn with different moisture contents and bulk densities at room temperature. The transmission wave rapidly decreases along with an increasing grain moisture content. The microwave attenuation of corn is greater than that of rice under similar moisture content. The attenuation A for different samples can be calculated by substituting |EC|maxs into equation (9). When the sample container is empty, |EC|maxe is 2869.2 mv. The moisture content of rice, which ranges from 10.73% to 27.84%, is obtained with an A ranging from 2.72 to 19.92 dB. Meanwhile, the moisture constant of corn, which ranges from 7.65% to 24.07%, is obtained with an A ranging from 3.85 to 50.47 dB. The attenuation rapidly increases with the grain moisture content and discrete with the change in bulk density. The accuracy of the grain moisture content measurements via traveling–standing wave attenuation is disturbed by bulk density.
The attenuation of the maximum field strength of the traveling-standing wave for rice and corn at 22°C.
Density-eliminated function
The variations in the attenuation of the traveling–standing wave along with bulk density of rice at 22°C are illustrated in Figure 7(a). For all samples, the attenuation linearly increases along with bulk density at the same moisture content. The bulk density represents the average distribution of grain particles. The change in bulk density does not change the moisture content of a single grain particle but changes the number of particles interacting with microwave in unit space. In other words, with the increase of bulk density, the content of water molecule in unit volume increases, which leads to the increase of microwave attenuation in proportion. Therefore, the interference of bulk density can be eliminated by dividing the bulk density from the attenuation measurement results.
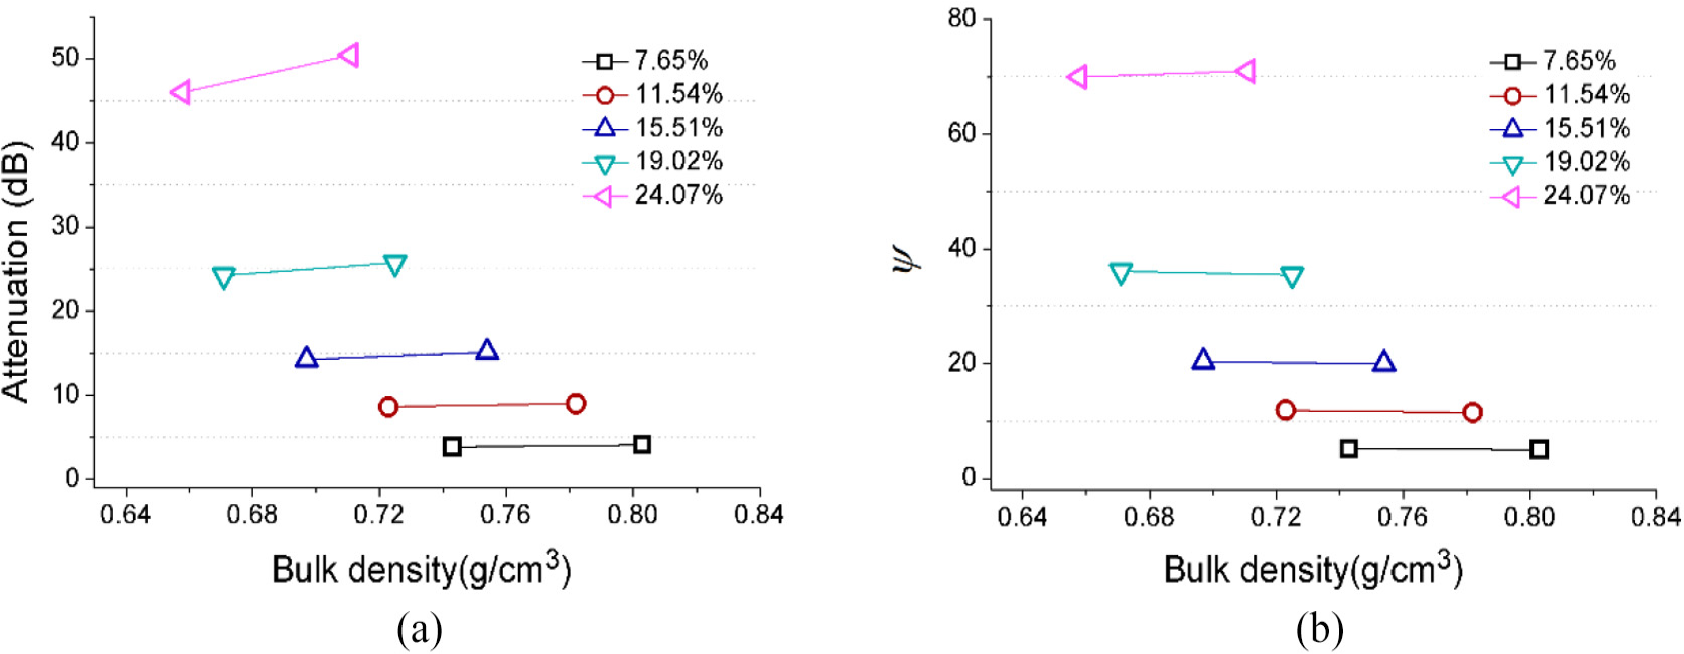
Density dependence of (a) attenuation, and (b) ψ of corn at 22°C, and indicated moisture contents.
A density-eliminated function ψ is defined as the ratio of attenuation of the traveling–standing wave A to the bulk density ρ

By substituting equations (9) and (11) into equation (12), the following expression is obtained for ψ:
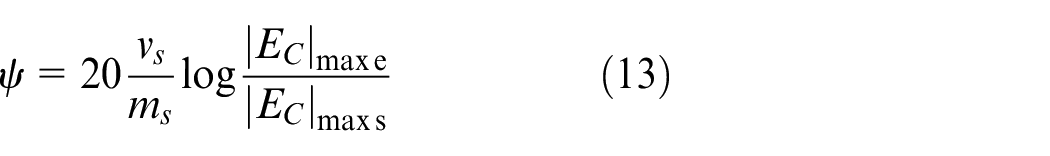
For a given sample container, the volume vs and weight mc are constant. The total weight mt is obtained by placing the weighing sensor at the bottom of the sample container. The sample weight ms can be calculated by ms = mt−mc. |EC|maxe denotes the electric field of the traveling-standing wave without sample. It is constant for a given sample container. For the measurement errors caused by the wear of sample containers after a long period of measurement, to calibrate the measuring device, only periodic no-load testing is required to modify the value of |EC|maxe. |EC|maxs denotes the electric field of the traveling-standing wave with the sample. In the utilized device, vs is 2000 cm3, |EC|maxe is 2869.2 mV. The density dependence of ψ for corn is shown in Figure 7(b). The straight lines with different moisture content are approximately parallel to the bulk density axis, thus illustrating that ψ is independent of bulk density.
The variations in the attenuation and the density-eliminated function ψ with moisture content of corn at 22°C are shown in Figure 8. The value of density-eliminated function ψ increases quadratically with sample moisture content. Variation of
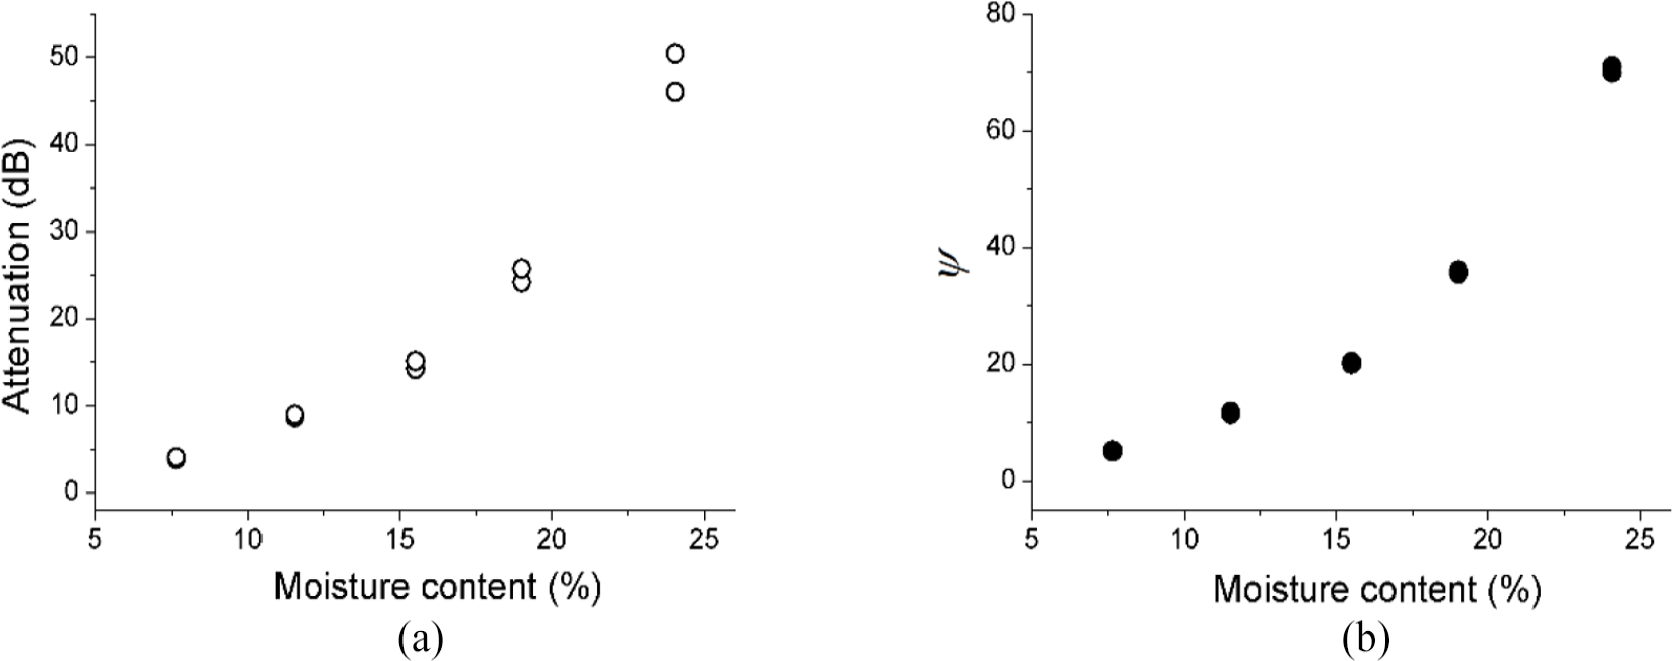
The variations in the (a) attenuation, and (b) ψ with moisture content of corn at 22°C.
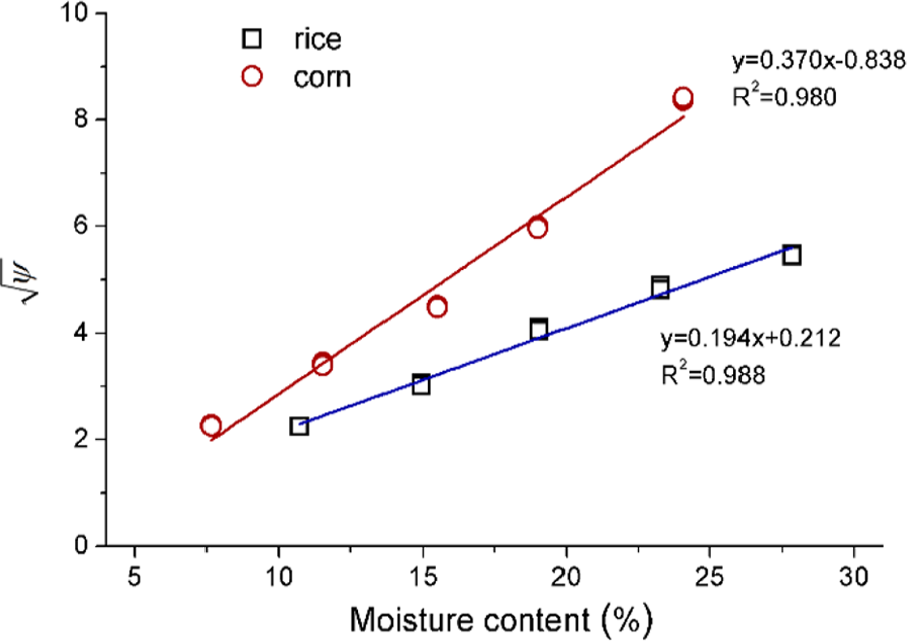
Square root of the density-eliminated function (ψ) versus moisture content for rice and corn at 22°C.
Multivariate relationships
The dielectric constant of materials is affected by temperature. The measurements are conducted at four temperatures (10°C, room temperature, 30°C, and 40°C). The square root of the density-eliminated function ψ increases linearly with temperature from 10°C to 40°C. For those samples with different temperatures, microwave attenuation increases along with bulk density at the same moisture content, which is similar to the trends observed at room temperature.
Figure 10 shows the 3D distribution in the

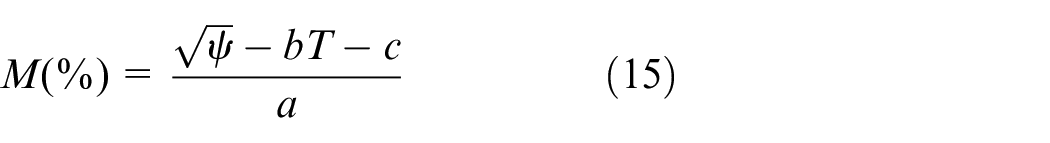
where a, b, and c are the regression constants, M is the moisture content, and T is the temperature. The moisture content M can be solved as follows:
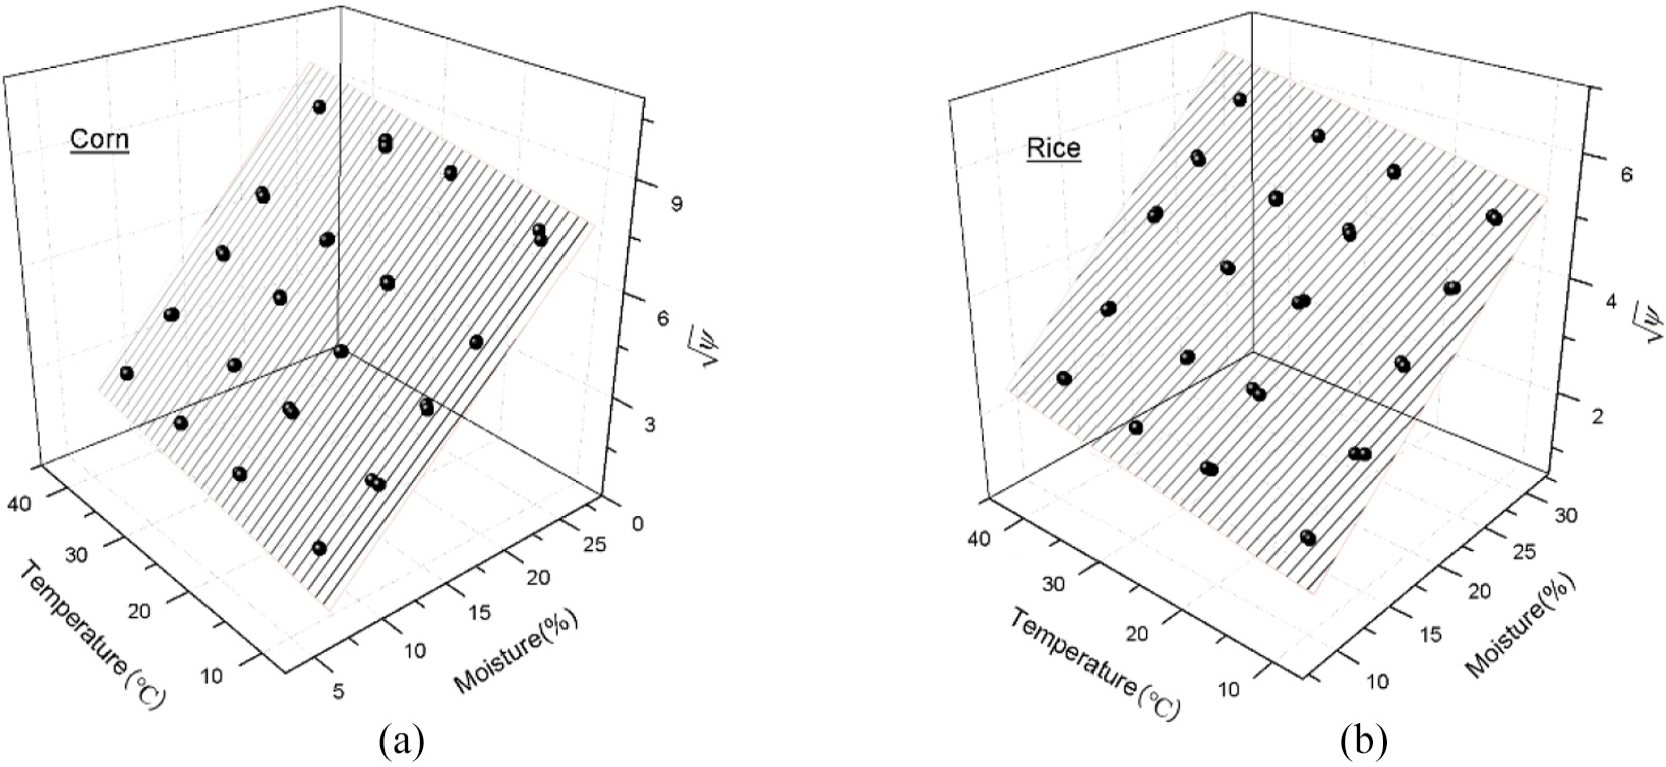
The three-dimensional variation of
The regression constants of the equation can be obtained by regression analysis of the experimental data of different samples. The results are listed in Table 2 and the regression fitting equations are obtained as follows:


Coefficients for calibration equations.
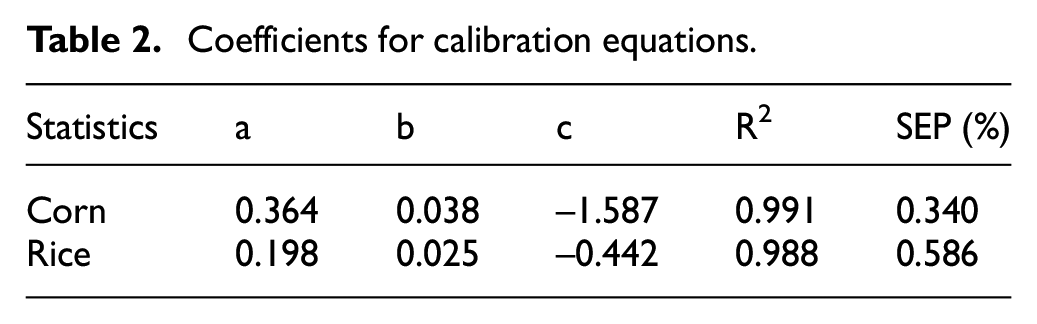
In practical applications, those equations are embedded into the measurement algorithm of the microwave meter. Moisture content is obtained according to the measurements of microwave traveling–standing wave attenuation, sample weight, and temperature.
For the error analysis of equations (16) and (17), independent experiments are carried out again. Under the same conditions, a validation set containing 240 data points are used to analyze the prediction validity of the calibration equation. The moisture contents of rice and corn vary from 10.75% to 27.62% and from 7.72% to 24.46%, respectively. The experiments are also repeated at two different bulk densities for each sample. The predicted moisture content calculated by equations (16) and (17) versus the oven moisture content for rice and corn are shown in Figure 11. The standard errors of performance (SEP) are calculated, and the values are reported in Table 2.
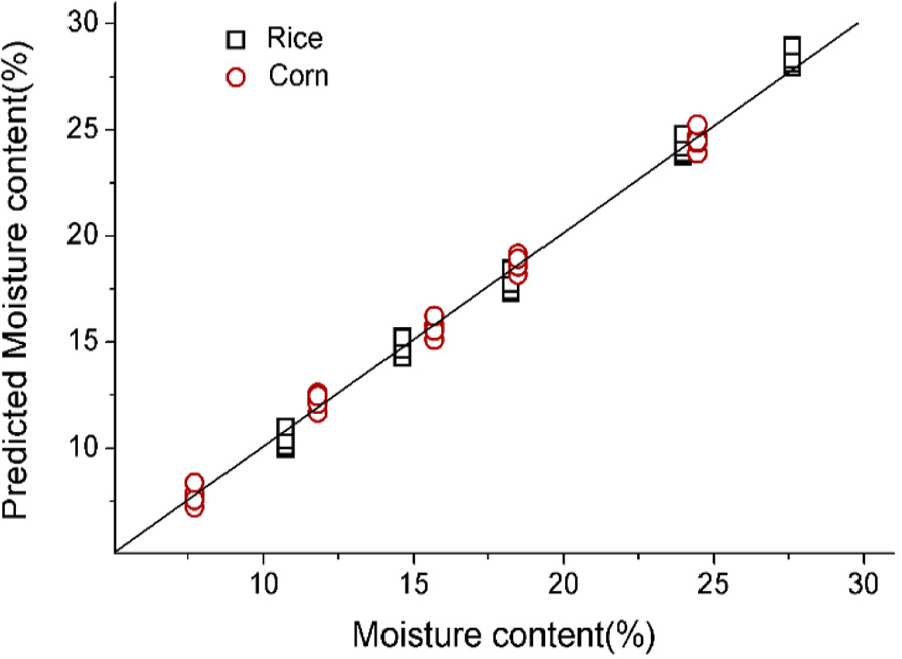
Predicted moisture content calculated by equations (16) and (17) versus the oven moisture content for rice and corn.
The errors in traveling–standing wave attenuation measurements are caused by the measurement system and sample preparation. The experimental system should be proper calibration and selection of the best matching conditions. In the sample preparation process, the sample moisture content and bulk density need to be determined accurately. However, the microwave scattering error is affected by the size, geometry, and distribution of the sample on the surface of the container, which is not easy to be directly estimated via calibration. The SEP values based on the experimental measurement results contain the influence of all types of errors, so the SEP values are used to evaluate the reliability of the calibration equations. The equations (16) and (17) predict the moisture content with an SEP of 0.586% and 0.340% for rice and corn, respectively. The microwave measurement results agree well with those of standard oven methods.
Conclusion
In this paper, a traveling–standing wave attenuation method is proposed for the rapid and nondestructive measurement of grain moisture content. Calibration models are proposed based on the attenuation of the maximum field of the transmission traveling–standing wave at 10.5 GHz. The square root of the density-eliminated function, grain moisture content, and temperature are distributed on a plane. The moisture content predicted by the calibration equation agree well with the standard method. The proposed measurement method has a simple structure, wide measuring range for moisture content, and sample thickness that is not limited by the 10 dB attenuation criterion. The device works in a single microwave frequency, and can complete the non-destructive measurement of moisture content in 5 s. This system can also be used for the rapid determination of moisture content for other particulate materials.
One of the next research directions is the dynamic measurement of moisture state of agricultural products, in order to meet the demand of automatic online measurement of food processing process. It should be noted that in the process of moisture content measurement by microwave free space method, the size of the sample, the regularity of the shape and other factors affect the microwave scattering. For agricultural products different from grain, such as fruits, vegetables and eggs, how to reduce the microwave measurement error and realize the rapid nondestructive detection of freshness is another problem that needs to be further studied.
Footnotes
Declaration of conflicting interests
The author(s) declared no potential conflicts of interest with respect to the research, authorship, and/or publication of this article.
Funding
The author(s) disclosed receipt of the following financial support for the research, authorship, and/or publication of this article: This work was supported by Jilin Scientific and Technological Development Program (20180520016JH), by the Scientific Research Foundation of Jilin Province Department of Education (JJKH20200327KJ), by Jilin Science and Technology Department International Exchange and Cooperation Project (20200801014GH).