
Abstract
Changes in soil electrical parameters can affect the distribution of earth potential in high-voltage direct-current (HVDC) ground electrodes when climatic conditions changes. This paper proposes a model to describe the relationship between surface-layer soil moisture and surface-layer soil resistivity under short-term climatic influence, by using image recognition technology. Based on the relatively stable resistivity of lower soil layers, a soil model more reflective of the actual operating conditions is established for soils near the ground electrode, and a finite element method is adopted to calculate the earth-surface potential (ESP). The experimental results indicate the following: (1) Compared with other measurement methods, image recognition of surface soil resistivity is a low-cost, real-time, online, and accurate method; and (2) changes in surface-layer soil moisture affect both ESP and step voltage. These effects are large in the case of high resistivity for the soil layer where the ground electrode is buried. This large fluctuation in step voltage particularly results in a potential safety hazards during ground electrode operation. Therefore, in order to ensure personal safety and obtain more accurate electrical parameters, it is necessary to consider the effect of natural climate on the soil surface resistivity. Finally, the value of the step voltage can be observed using image recognition, this also provides a new method for the safety monitoring of the DC ground electrode.
Introduction
The ground electrode in an HVDC transmission system plays an extremely important role in maintaining safe and stable operation of the entire system. Because the ground current can have a negative impact on nearby power and communication equipment,1–2 and the abnormal increase in step and touch voltages can cause personal injury and death,3–5 it is necessary to establish a surface-potential calculation and monitoring model for HVDC transmission systems. The existing models are mainly classified into ground grid and soil structure models. Given that the electrical structure of soil varies greatly with a large spatial scale, it is difficult to establish a unified soil structure model that is completely reflective of the real conditions. The extent to which the calculated and actual electrical parameters of ground electrodes are close to each other is directly affected by the soil structure model. Therefore, to provide more accurate data for the safe operation and fault maintenance of HVDC transmission systems, it is important to establish a more realistic soil structure model. At present, the Werner method6–7 and the magnetotelluric method (MT) 8 are widely used in the inversion of soil electrical structure. The MT method cannot accurately measure the earth resistivity of the shallow layer (in the range of 0–100 m), so the measurement of the earth resistivity of the shallow layer still needs to use the Werner method.
Liu et al. 9 established a three-dimensional soil structure model for soils near the ground electrode by partitioning the study region. In addition, Liu et al. 10 obtained earth potential distribution in a horizontal, vertical, and composite soil-structure models by using an equivalent complex image method, respectively. Ruan et al. 11 established a multi-layered soil-structure model by using measurement data, and showed that the on-site measured soil resistivity of the region where the ground electrode was buried could be used for more accurate calculation of the electrical parameters of the ground electrode. Li et al. 12 analyzed the effects of different soil-structure models on the earth-surface potential distribution, and proposed a criteria for soil model selection. Yang et al. 13 calculated the nearby earth potential of the ground electrode in different soil-structure models to analyze the effects of upper-layer and lower-layer soil resistivity on the earth potential. Sima et al. 14 modified the traditional soil models by considering vertical surface relief, hence establishing a more realistic soil model. Further, Ruan et al. 15 studied the effects of horizontal layered, vertical layered, and finite-volume soils on ground resistance, current distribution, earth-surface potential, and touch voltage. Eduardo et al. 16 proposed a method for calculating the electric field and current density generated by HVDC ground electrodes in homogeneous and heterogeneous soil structures. Mehrdad et al. 17 proposed a method that combines the electromagnetic and circuit approaches is proposed to determine the transient resistance of the grounding electrode system by incorporating the soil ionization effect of non-homogeneous soils.
In HVDC transmission systems, the most important electrical parameters are step voltage and earth-surface potential. Changes in surface-layer soil moisture (characterized by the water content) lead to changes in resistivity, which in turn have a certain degree of effect on the step voltage and earth potential, resulting in potential safety hazards in severe conditions. As shown in the existing literature, the soil models that are used to calculate the electrical parameters of a grounding system are based on fixed resistivity values; therefore, they fail to consider the fact that the surface-layer soil resistivity is prone to soil moisture changes. Moreover, the existing soil-moisture measurement methods are subject to some drawbacks when applied in the region near the ground electrode. The current methods for measuring soil moisture mainly include satellite remote sensing, 18 drying-weighing, 19 and time-domain reflectometry (TDR), 20 etc. Satellite remote sensing is suitable for a wide range of moisture surveys, but it is barely able to obtain remote sensing data in the region near the ground electrode. Drying-weighing has a high accuracy, but it is inapplicable to on-line monitoring. Further, while TDR can be used for on-line monitoring, it is expensive in terms of instrumentation and difficult in terms of maintenance. Therefore, it is highly desirable to use a low-cost, high-precision, online soil-moisture identification technology.
In view of the aforementioned context, when establishing a soil model, the effects of short-term climate (short-term rainfall and high temperature) on surface-layer soil resistivity were considered for the first time, this study also proposes an identification model for surface-layer soil resistivity based on soil image. In addition, the depth range where in the soil resistivity is susceptible to climate is determined. Based on the relatively stable resistivity values of lower-layer soils, a complete soil-structure model is established for the soil near the HVDC ground electrode, considering the effects of soil moisture changes. In addition, a finite element method is employed to calculate the earth-surface potential and step voltage of the region near the ground electrode, and the effect pattern of surface-layer soil moisture changes on the earth-surface potential and step voltage is analyzed. The experimental results show that climatic conditions have a greater impact on the step voltage and potential distribution when the shallow-layer resistivity is larger, which cannot be taken into account by traditional soil models. At the same time, the method used in this paper to identify resistivity, it can provide accurate parameters for establishing a soil model, and identify the step voltage through the soil image.
Basic theory
Ground electric field and boundary conditions
Figure 1 presents a schematic of HVDC transmission in a monopolar ground return mode. Here, a large DC current overflows through the ground electrode to a wide range of soil areas, resulting in the aberration of earth potential.
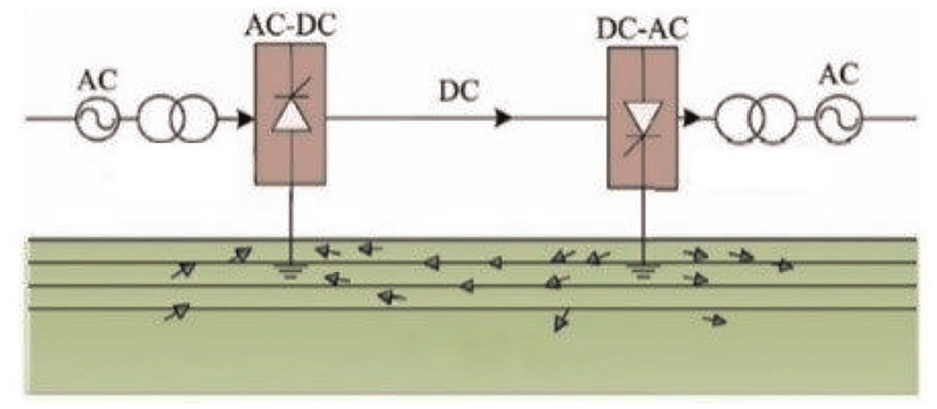
Schematic of HVDC transmission in a monopolar ground return mode.
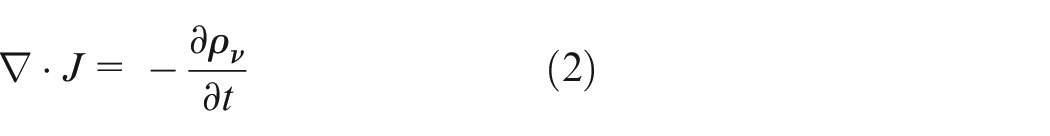
The electric field formed by the current distributed in the ground can be described as a constant current field wherein the potential satisfies the following basic equations:


In these equations,

In the three-dimensional Cartesian coordinate system, equation (4) can be written as:
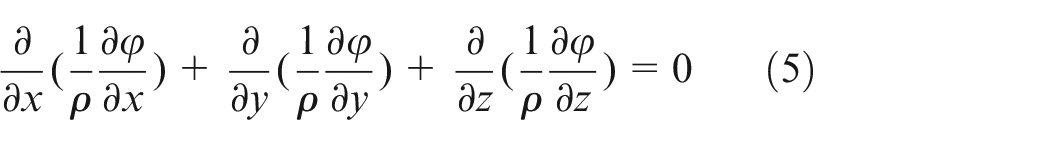
In equation (5),
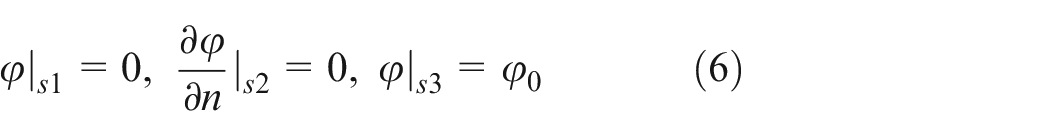
In equation (6),
Relationship between soil color and moisture
The measurement results of soil color reveal that the soil color can be considered as a function of climatic factors, and is significantly affected by soil moisture. 23 The image characteristics of soil are jointly affected by several complicated factors, such as soil organic matter, water content, and soil roughness. Provided other characteristics of the soil remain unchanged, the image characteristics are mainly affected by water content. Before soil moisture is fully saturated, the soil spectral reflectivity decreases with increasing water content, exhibiting a linear relationship 24 as described in equation (7):

where y denotes the soil reflectivity, x denotes the soil water content,
Relationship between soil moisture and resistivity
As shown in Figure 2, soils are a porous medium comprising of organic matter, minerals, and other components to form a soil skeleton, with air and moisture distributed in the soil pores. Soil conductivity is mainly attributed to the soil skeleton and pore fluid. Because the surface soil skeleton is in contact with the air for a long time, conductive substances such as metals are oxidized into insoluble substances; moreover, the soils are subjected to rainwater leaching, which results in a substantial loss of conductive salts from the surface soils. All these processes eventually result in poor electrical conductivity of the soil skeleton. 25 However, the conductivity of pore water is much higher than that of air; therefore, the conductivity of surface soils is dominated by soil moisture.
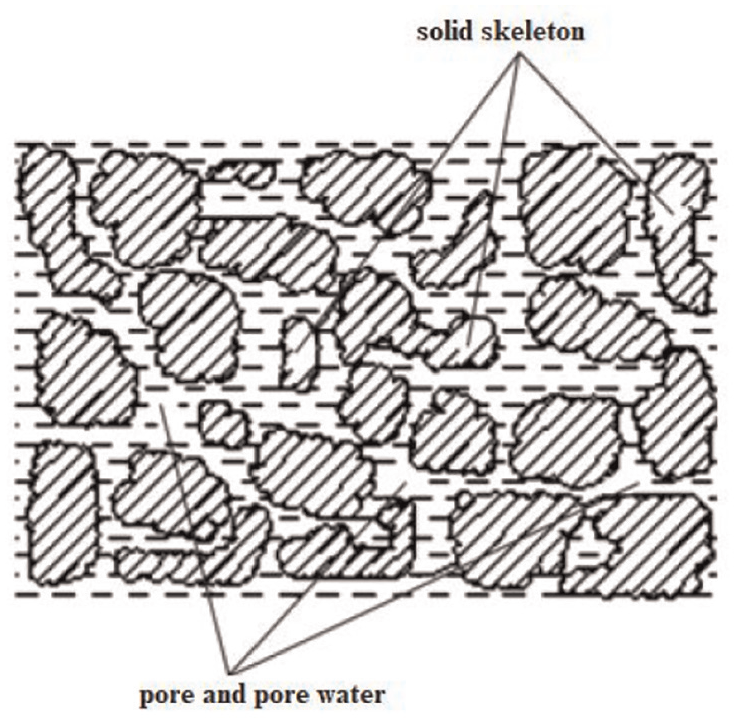
Soil structure.
According to their texture, soils can be classified into sand, silt, clay, and other types; however, these soil types exhibit a similar trend in terms of the relationship between their resistivity and moisture. This means the resistivity decreases gradually with increasing soil moisture. 26 Many researchers have researched the relationship between soil resistivity and soil moisture. The results show that soil resistivity and moisture are inversely proportional, and the fitting models for the relationship are mainly linear model 27 and exponential model 28 and power function model, 29 etc. In addition, a relevant study 30 showed that a highly significant functional relationship exists between the soil moisture and resistivity:

In equation (8),
Modeling methods
Soil-resistivity identification model based on image gray-scale values
The two ground electrodes of the HVDC transmission system are far apart, because of which the ground current causes a wide range of potential distribution. If a soil model that describes the effects of surface-layer soil moisture on soil resistivity is to be established, then the traditional measurement method cannot be used because it is expensive and involves complicated engineering processes. Therefore, an alternative is to install high-resolution cameras in selected sites of the ground electrode region to acquire surface soil images. Image gray-scale values are calculated by using an image processing technology. The calculated gray-scale values are then compared with the sensor-measured soil moisture and resistivity data to establish a functional image gray-scale values and resistivity values of the surface soil in the ground electrode region. Figure 3 shows the process of establishing the relationship between soil color and resistivity. Thus, the image gray-scale values can be used to achieve real-time estimation of surface-layer soil resistivity changes caused by the climatic factors such as rainfall.
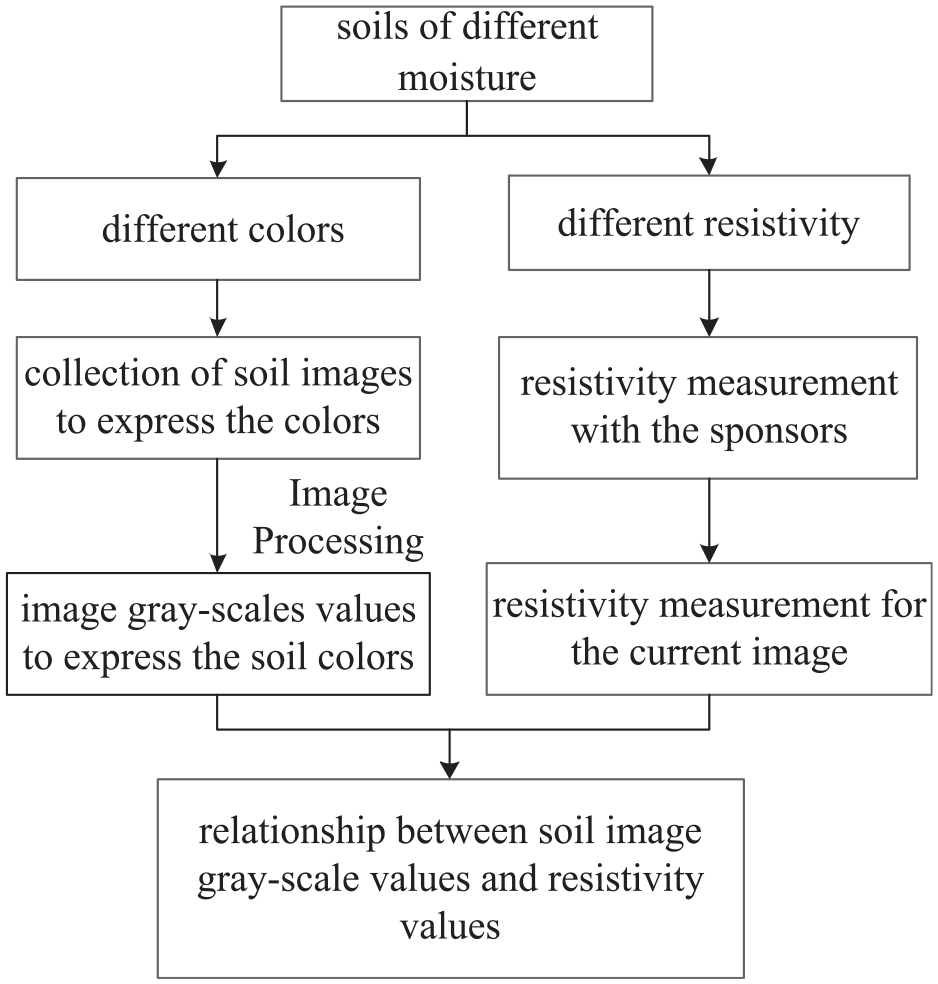
Relationship between soil color and resistivity.
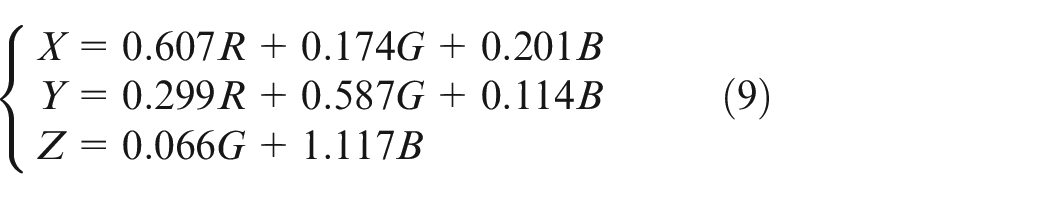
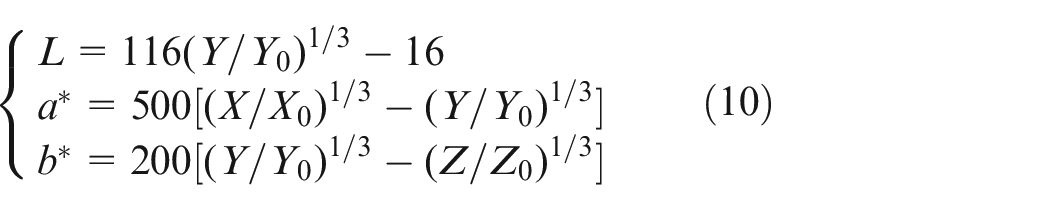
Image preprocessing and color space conversion
Because a varying degree of interference effects may arise during the image acquisition process, the soil images are subjected to a preprocessing step called smoothing that is based on median filtering with a window size of 3×3. This process effectively removes the noise and preserves the original information of the images. In addition, because RGB images are subjected to illumination intensity, it is necessary to convert the RGB mode into the
Filtering of image interference area
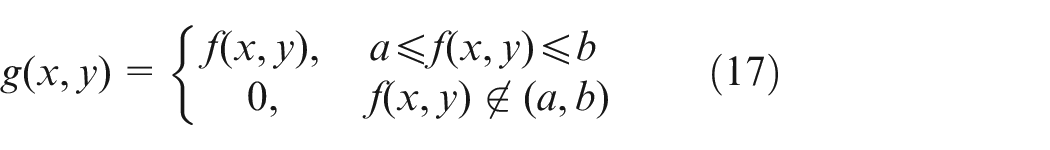
In soil image data, the pixel brightness is affected by the soil-reflected light, vegetation-reflected light, and light reflected by the other non-soil materials. Cracks may form in surface soils and be covered with seed vegetation under natural conditions. In these areas, the reflected light will have a large interference with the image features; therefore, these areas should be identified and filtered out of the images. The gray-scale values of the non-interference areas are set to be distributed in the range
where
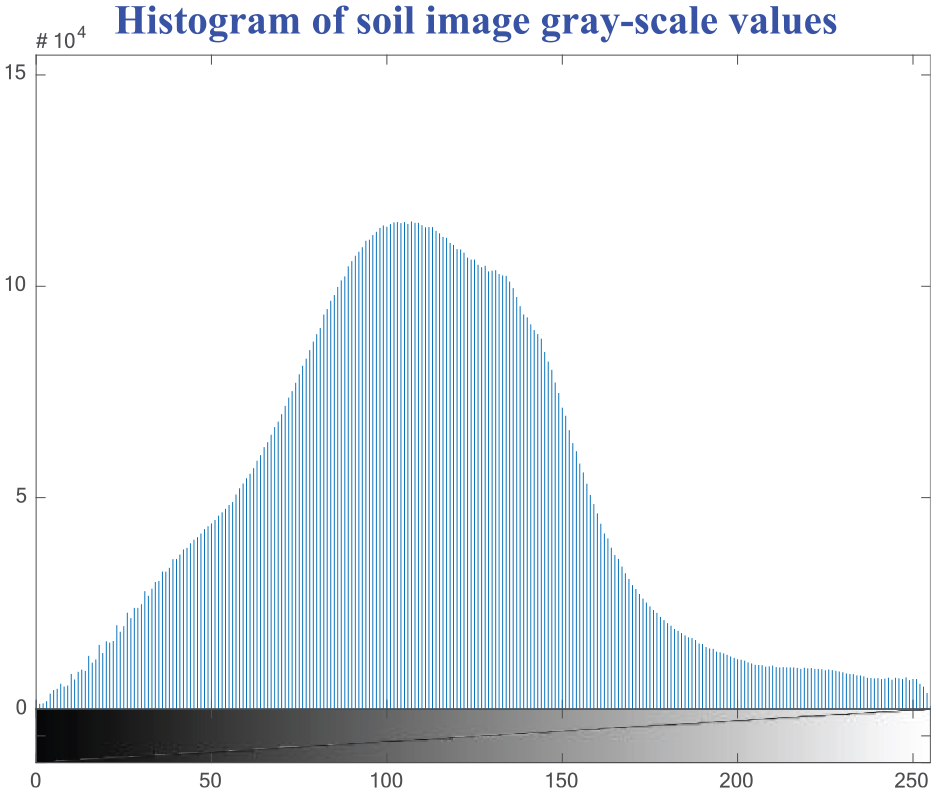
Histogram of soil image gray-scale values.
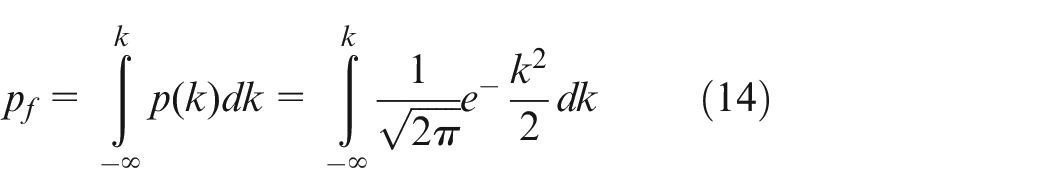
By normalizing equation (12) and using a new variable k, a new probability density function can be obtained as shown in the following:
In equation (13),
When


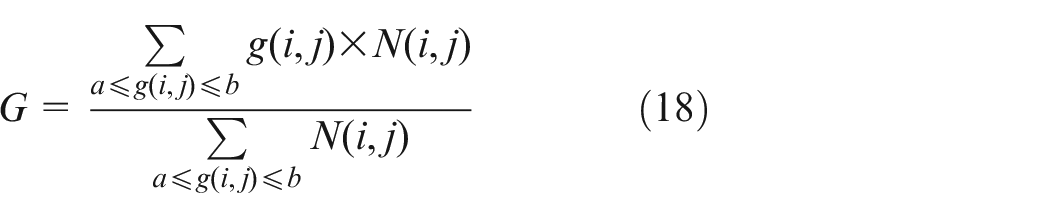
Calculation of the average gray-scale value of surface-layer soil image
Based on the determined threshold, the original image areas with gray-scale values outside the range
Relationship between the gray-scale values of soil images and the soil resistivity values
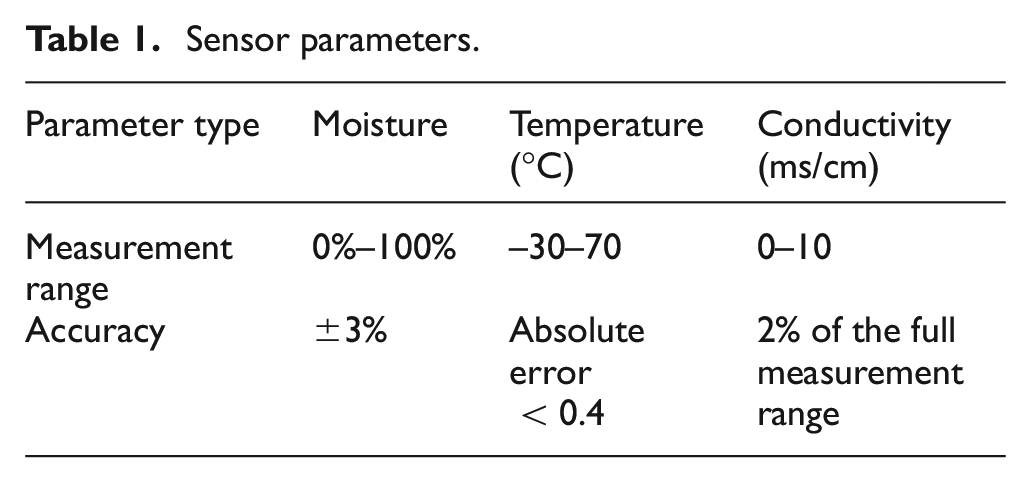
In this experiment, a loam layer (15 cm thick) was used as the sample. DC ground electrode are often located in uncovered, relatively flat soil areas. The change in soil moisture is mainly affected by rainfall and evaporation, therefore, in order to better simulate the effect of rainfall on moisture, tap water was used as experimental water. A certain amount of tap water was added to the sample surface and was allowed to diffuse through the soil pores until an even soil color was obtained; consequently, the soil water content was measured to be approximately 30%. Next, the soil sample was placed in a dry and ventilated environment to evaporate the water naturally, and the soil images were acquired at equal time intervals. As the soil water evaporation proceeded, soil images at different levels of soil moisture were obtained. Meanwhile, a multifunctional sensor was employed to measure the soil temperature, moisture, and conductivity; here, the sensor probe was placed at the center of the experimental soil. The relationship of the gray-scale values with the soil moisture and conductivity values was determined by using computer-aided image processing. The major measurement parameters of the sensor (model SMET-3-V3) are shown in Table 1:
Sensor parameters.
A total of 12 images were selected for analysis. Their gray-scale values were first calculated in the order of image acquisition, and then the corresponding values of temperature, moisture, and conductivity were measured; here, the measured conductivity was converted into resistivity. The experimental results are presented in Table 2, and the soil images in the order of increasing soil moisture are shown in Figure 5.
Measurement results.
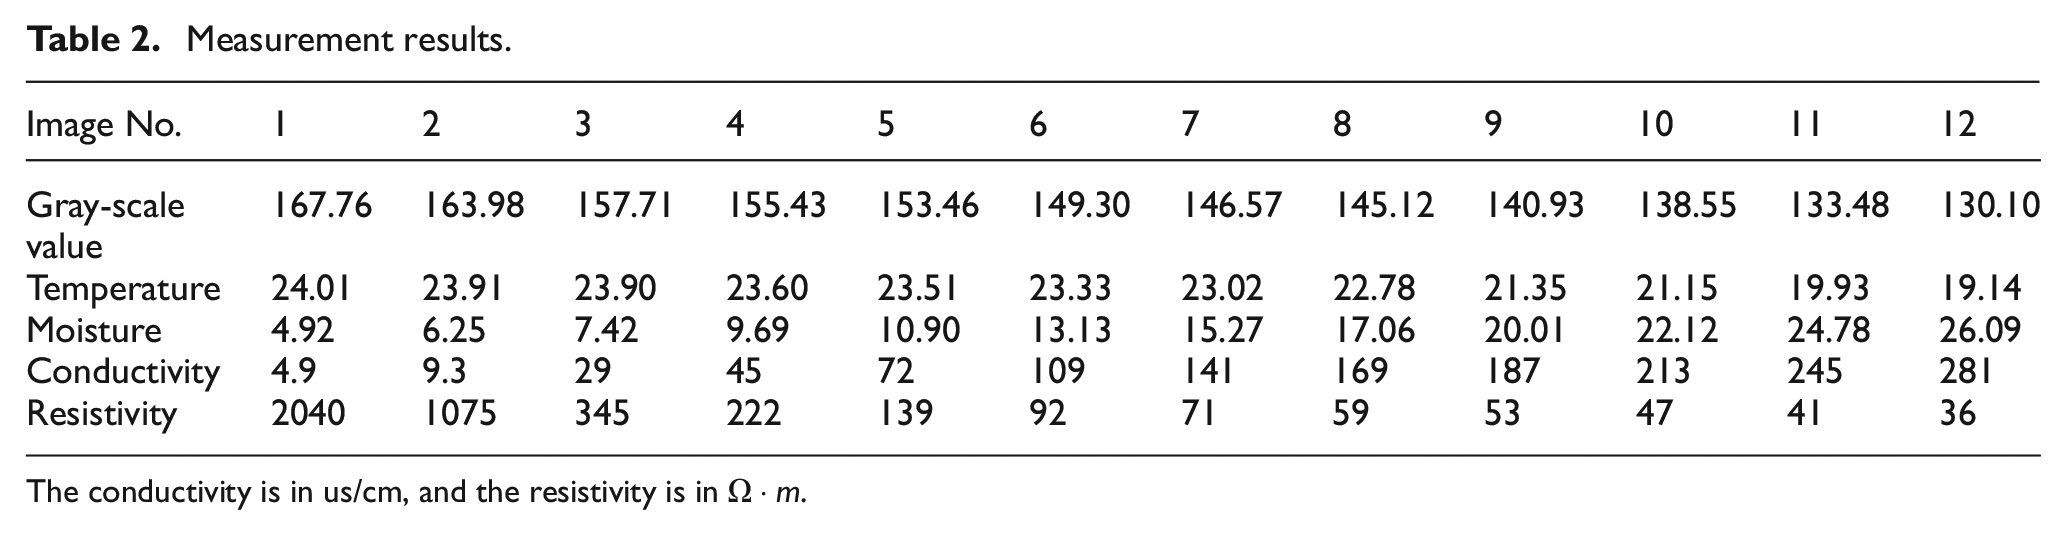
The conductivity is in us/cm, and the resistivity is in
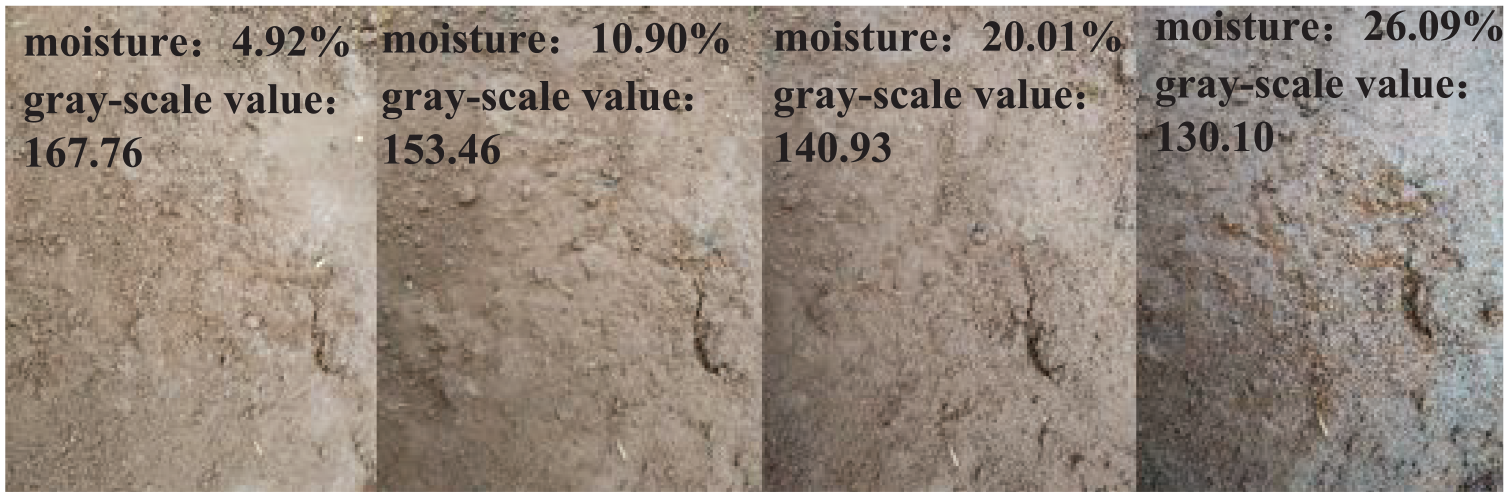
Soil images of varying moisture.
As shown in Figure 6, the soil reflectivity of natural light decreases gradually with increasing soil water content; this in turn decreases the image gray-scale values linearly. This observation is consistent with the aforementioned mathematical model. As shown in Figure 7, there is an exponential relationship between the soil image gray-scale values and soil resistivity values, meaning the resistivity values increase with increasing gray-scale values. Moreover, the increase rate is high at the beginning, but flattens out after a certain point. The functional relationship between the soil image gray-scale values

where the coefficient of determination
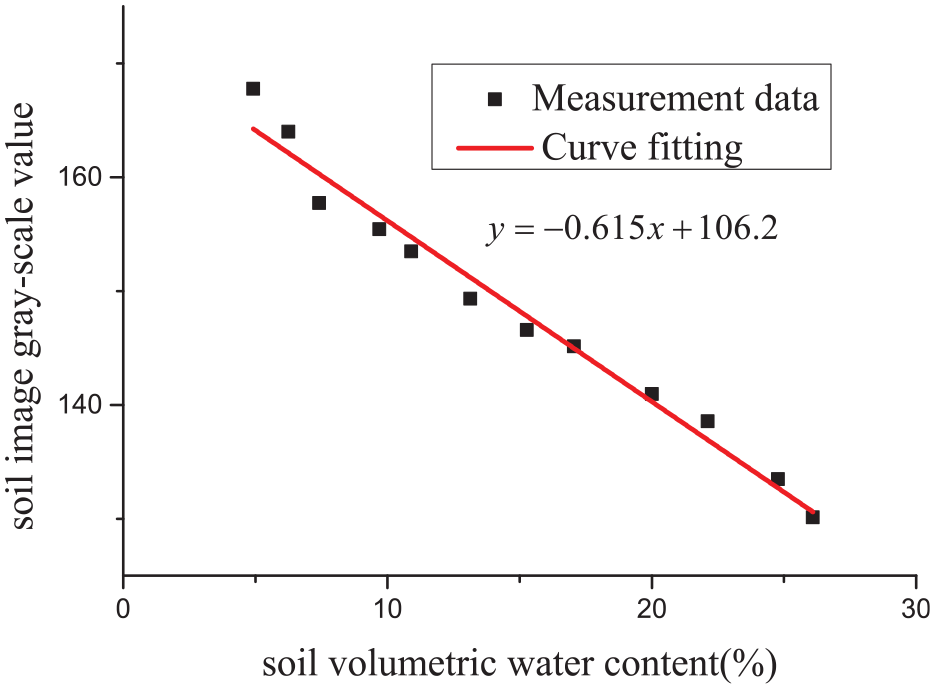
Fitting curve between the soil moisture values and soil image gray-scale values.
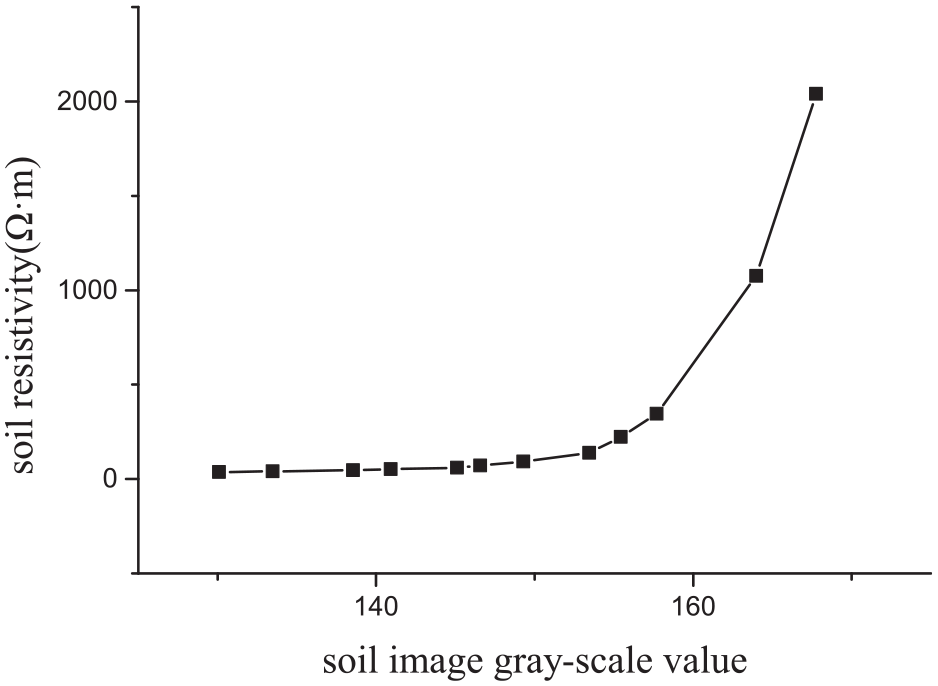
Relationship between the soil image gray-scale values and soil resistivity values.
Calculation model for earth potential
As shown in Figure 8, the ground can be divided into a number of uniform horizontal structures based on the geophysical properties; here,
(1) Yuan et al. 33 measured the soil moisture at depths of 20, 40, and 60 cm. Under low-intensity rainfall, the soil moisture increased rapidly at a depth of 20 cm, and increased slightly at a depth of 40 cm; however, it did not change at a depth of 60 cm. Moreover, when the weather was clear, large changes in moisture were observed at the depth of 20 cm;
(2) Guo et al. 34 monitored the resistivity of different soil layers, and observed that under high-temperature conditions without rainfall, the soil resistivity at the depth of 20 cm increased by 1.76 times the original value. Further, the soil resistivity at depths of 40 and 60 cm increased to 1.14 and 1.12 times the original values, respectively; however, deeper soil layers did not exhibit any changes in resistivity. Under rainfall, the resistivity changed greatly at the depth of 20 cm and slightly at the depth of 40 cm; however, it did not change at increased depths.
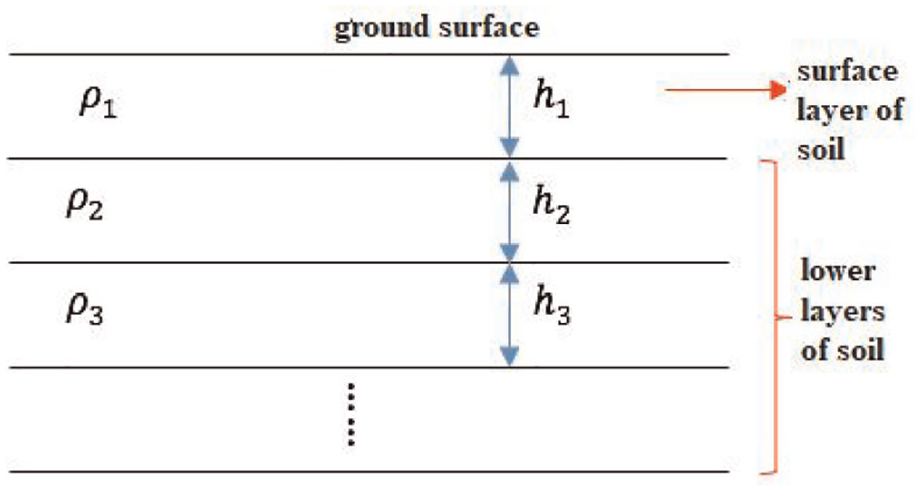
A horizontal layered soil-structure model.
Based on the aforementioned reports, to consider the position of the probe and the downward infiltration of water during the measurement comprehensively, the maximum soil depth above which the soil moisture changes greatly with the climatic conditions is considered 0.3 m. When measuring the resistivity with the Winner method, it is necessary to change the electrode distance for multiple measurements, and to process the data to obtain the apparent soil resistivity. Therefore, for this shallow layer affected by the environment, the resistivity changes greatly in a short time, using the image method, the resistivity can be quickly and accurately identified, this measurement method can measure and transmit the current soil resistivity in real time, which is more convenient than the Winner method in obtaining data. This is consistent with the soil depth range that soil images can identify. Moreover, because a large geographical range is under the influence of rainfall and temperature increases, the studied areas near the ground electrode can be considered to be under uniform influence of climatic conditions.
Although soil texture varies from region to region and accordingly, and soil resistivity changes with soil moisture to a varying extent, it is possible to conduct an online calibration of the functional relationship between the soil resistivity values and soil image gray-scale values in the soil region to be measured in engineering practice. Thus, the first-layer soil resistivity in the soil structure model can be estimated online using the aforementioned image method. For the lower-layer soil, moisture is less likely to be lost under non-extreme weather conditions; however, there may be a slight variation. The resistivity of lower-layer soil can be obtained by using the following two methods: (1) Field measurement by engineering equipment, such as the commonly used Werner four-electrode method or magnetotelluric method; (2) Soil structure stratification and soil resistivity allocation according to the local geological and historical field survey data. A lower-layer soil structure model established by using the aforementioned two methods will be consistent with the actual soil structure in the local environment, and this soil structure will not change in a short period of time. Although the Werner four-electrode method and the magnetotelluric method can accurately invert the soil structure, the surface soil resistivity is time-varying due to the influence of short-term climate, it is complicated, and the cost of equipment and maintenance is relatively expensive. Therefore, this paper uses soil images to identify the surface resistivity. Therefore, by combining the surface soil of labile resistivity with the underlying soil of relatively stable resistivity, a complete soil-structure model is established considering the changes in surface-layer soil moisture. By using a finite method and ANSYS simulation, the potential equation mentioned in Section 1.1 can be solved numerically to obtain the potential at any point in the field under the boundary conditions as specified in Section 1.1.
Case analysis
To explore the influence of surface soil-moisture changes on the earth potential distribution, a four-layer soil model was established for experimentation. The distribution of earth-surface potential is most affected by the soil parameters of the soil layer where the ground electrode is buried, and very slightly affected by the other low-resistivity layers. 35 Therefore, this study addresses the effects of surface-layer soil moisture on earth potential distribution in two cases considering the impact of ground-electrode soil-layer resistivity on earth potential, as elaborated below.
Case 1: The ground-electrode soil-layer resistivity is small, and the second-layer soil resistivity is set to 20
Case 2: The ground-electrode soil-layer resistivity is large, and the second-layer soil resistivity is set to 400
Soil model.
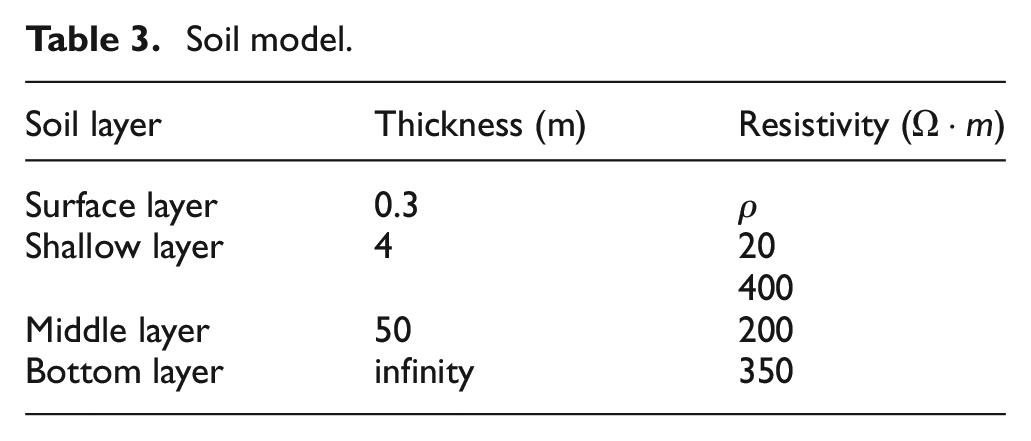
The first-layer soil resistivity (
Earth-surface potential calculation
The ground electrode is set to have a shape of single circular ring with a radius of 600 m, and is buried at a depth of 3 m. The cross section of coke is set to 0.7 × 0.7 m. When only the influence of the soil structure on the earth potential is to be considered, a voltage (1015 V in this study) is applied to the equipotential surface of the ground electrode. Because of the symmetry of the model, the finite element analysis is performed on two-dimensional axisymmetric elements to reduce the calculation time. Figure 9 shows the potential distribution in the soil profile for a shallow-layer resistivity of 400
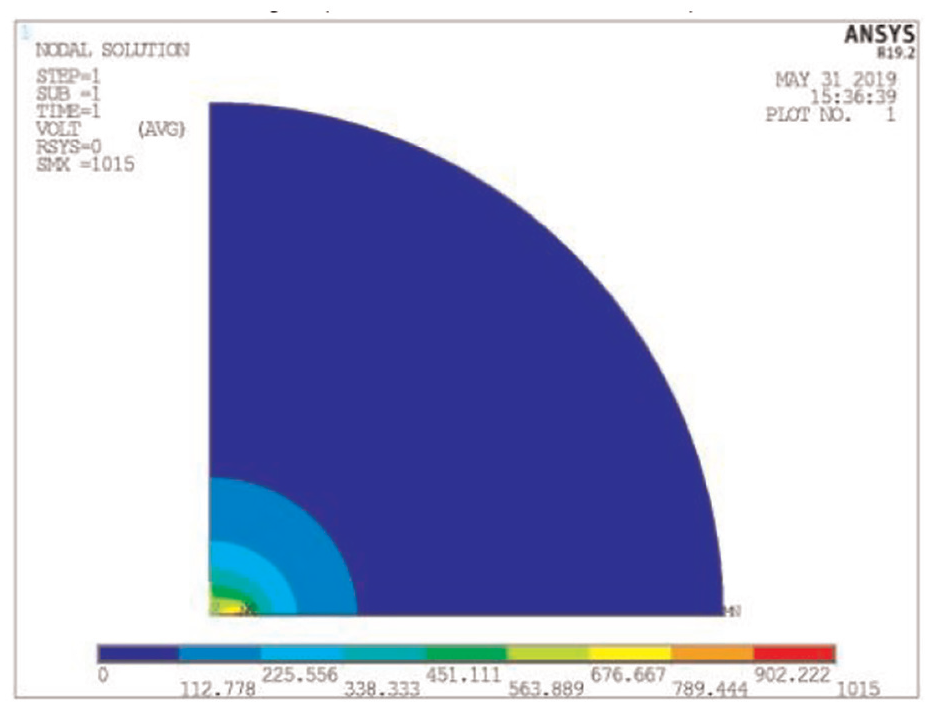
Earth potential distribution of the HVDC ground electrode.
As shown in Figure 10, the calculated earth-surface potential in the case of large shallow-layer resistivity differs significantly, that is by nearly 200 V, from that in the case of small shallow-layer resistivity. In addition, the earth potential drops quickly within the 2 km region of the ground electrode and slowly outside this region.
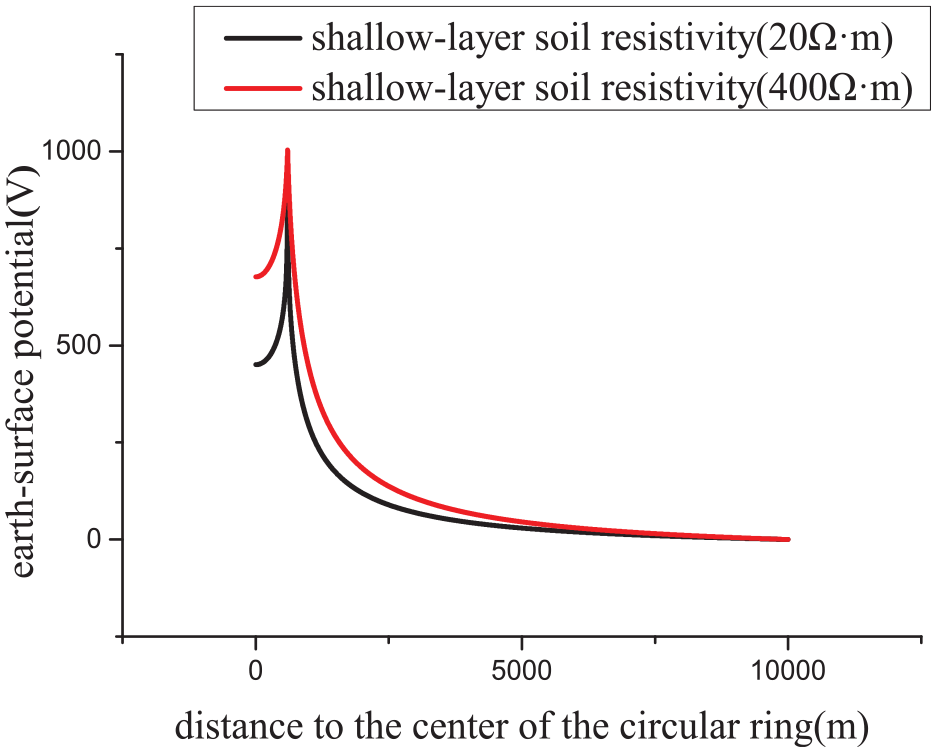
ESP distribution of the HVDC ground electrode.
The earth potential distribution is calculated for a variety of surface layer resistivity changes with moisture under the two conditions of shallow-layer resistivity, respectively. To address the effects of moisture-dependent surface soil resistivity on the earth potential under the two conditions of shallow-layer resistivity, the earth potential is selected within a certain geographical range for comparison, as shown in Figure 11.
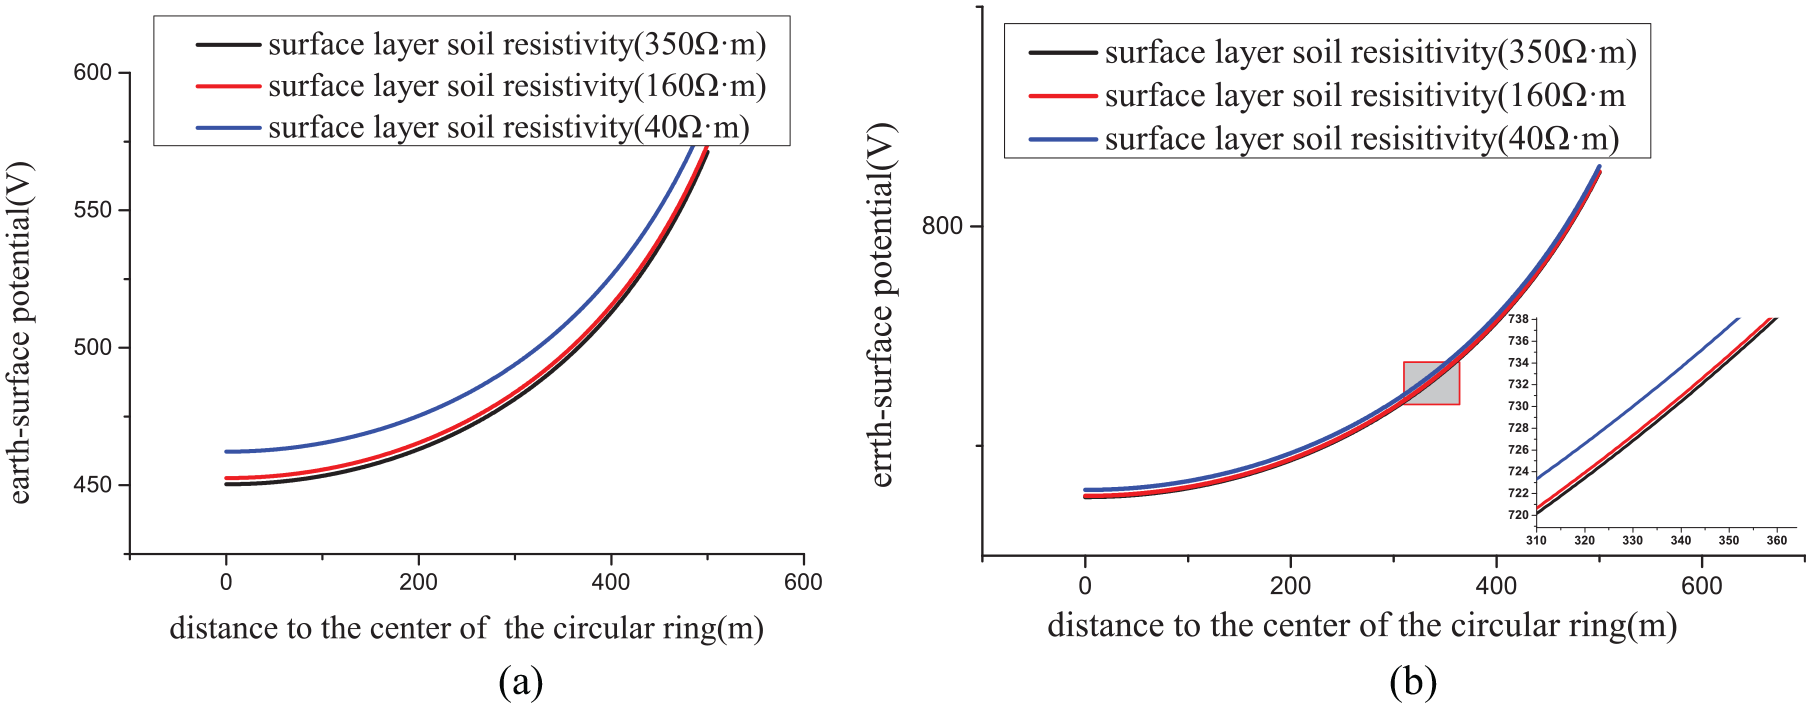
Earth-surface potential distribution. (a) Effects of surface-layer soil moisture on earth-surface potential when the shallow-layer resistivity is 400
As shown in the figure, in both cases of shallow-layer resistivity, the earth-surface potential is affected by the surface-layer soil moisture; it increases with the increase in moisture. When the shallow-layer resistivity is high (400
Step voltage calculation
The changes in surface-layer soil moisture have a certain degree of impact on the step voltage. Given that the maximum step voltage is distributed near the inner and outer sides of the circular ring, only the step voltage within a small distance of the inner and outer sides of the circular ring is calculated, as shown in Figure 13. The maximum step voltage for each soil parameter is shown in Table 4.
Maximum step voltage.
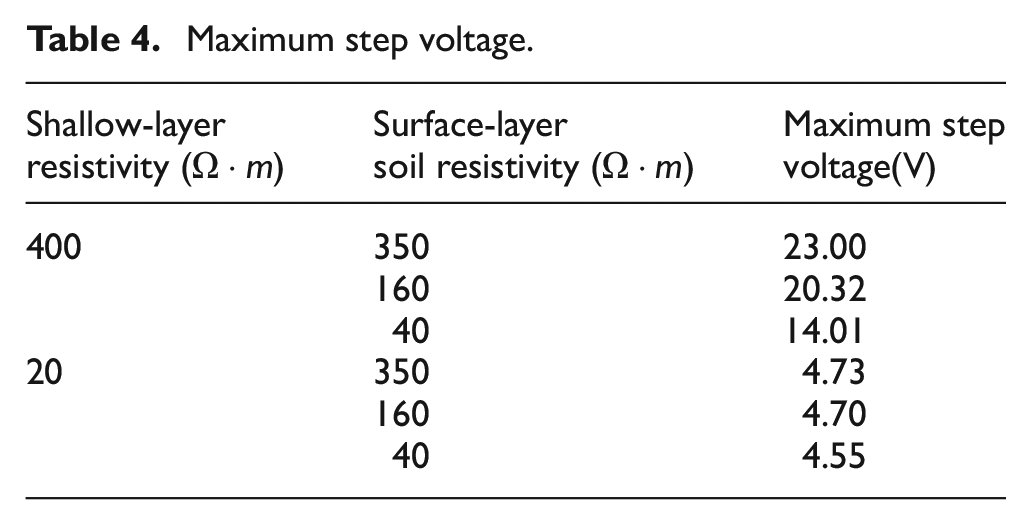
As shown in Figure 12, the peak step voltage is higher at the outer side of the circular ring than at the inner side. Considering only the shallow-layer resistivity, the maximum step voltage at the resistivity of 400
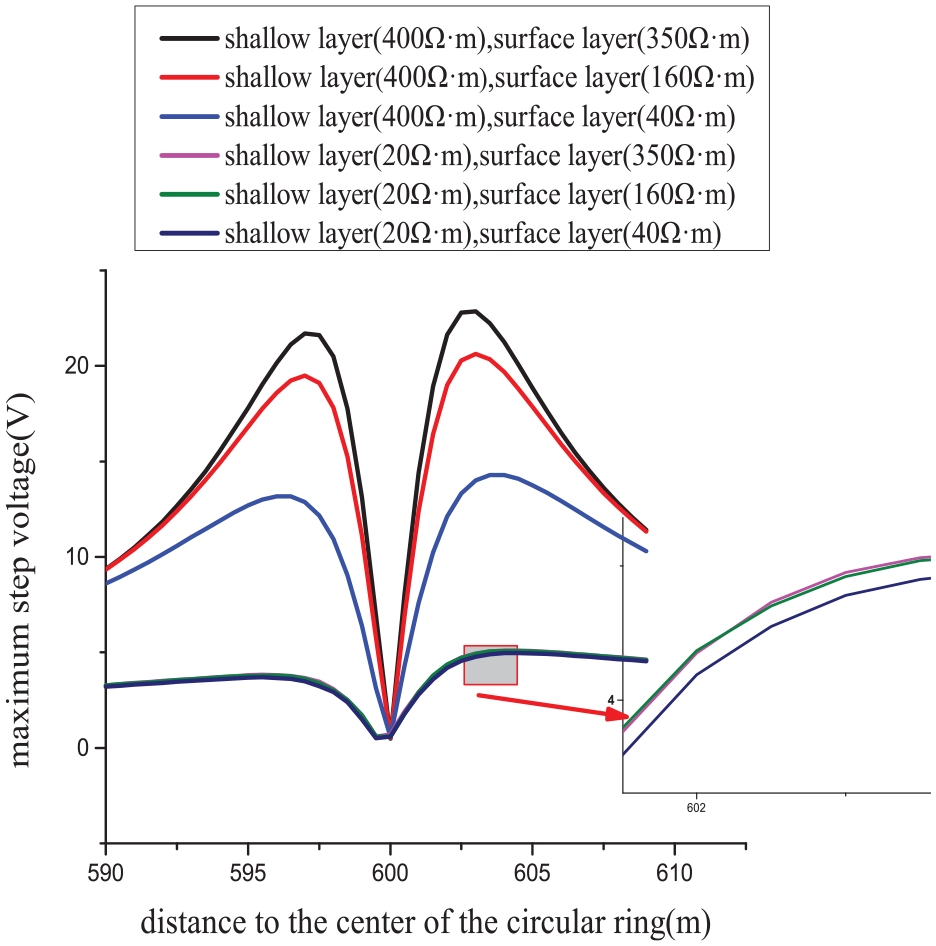
Distribution of step voltage.
To use the gray-scale values of soil images better and to reflect the moisture-induced changes in soil surface-layer soil resistivity and in turn step voltage, calculation is performed on step voltage by using surface-layer soil resistivity in the range (40, 2000) for the two cases of shallow-layer resistivity. Moreover, according to the aforementioned functional relationship between the soil resistivity values and soil image gray-scale values, the change pattern of the step voltage with respect to the gray-scale values of surface-layer soil images is obtained, as shown in Figure 13.
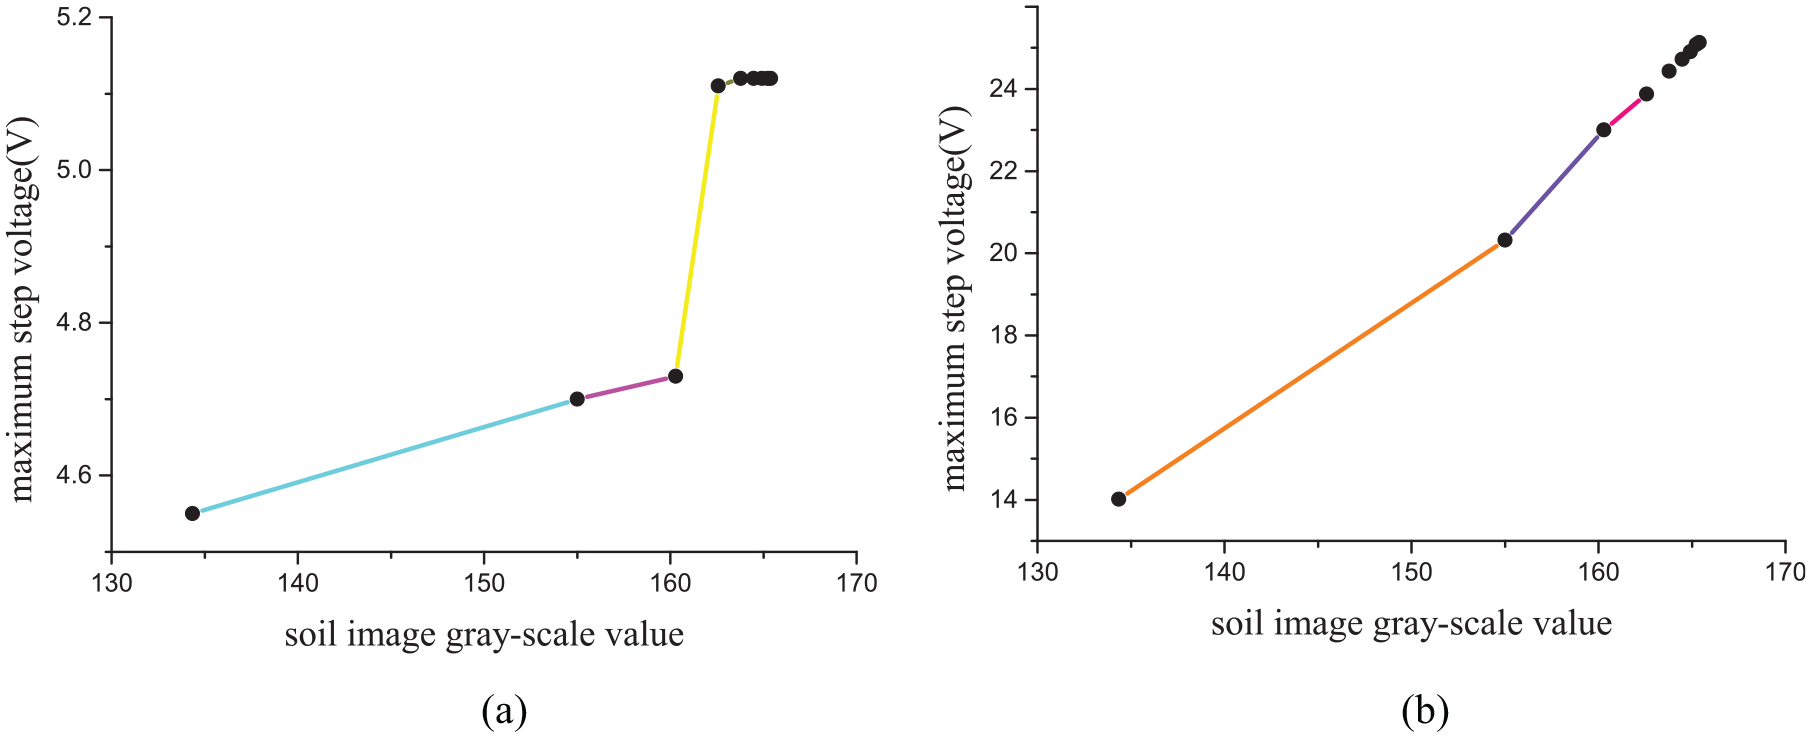
Relationship between soil image gray-scale values and step voltage values. (a) Shallow-layer resistivity of 20
As shown in Figure 13(a), when the shallow-layer resistivity is low (20
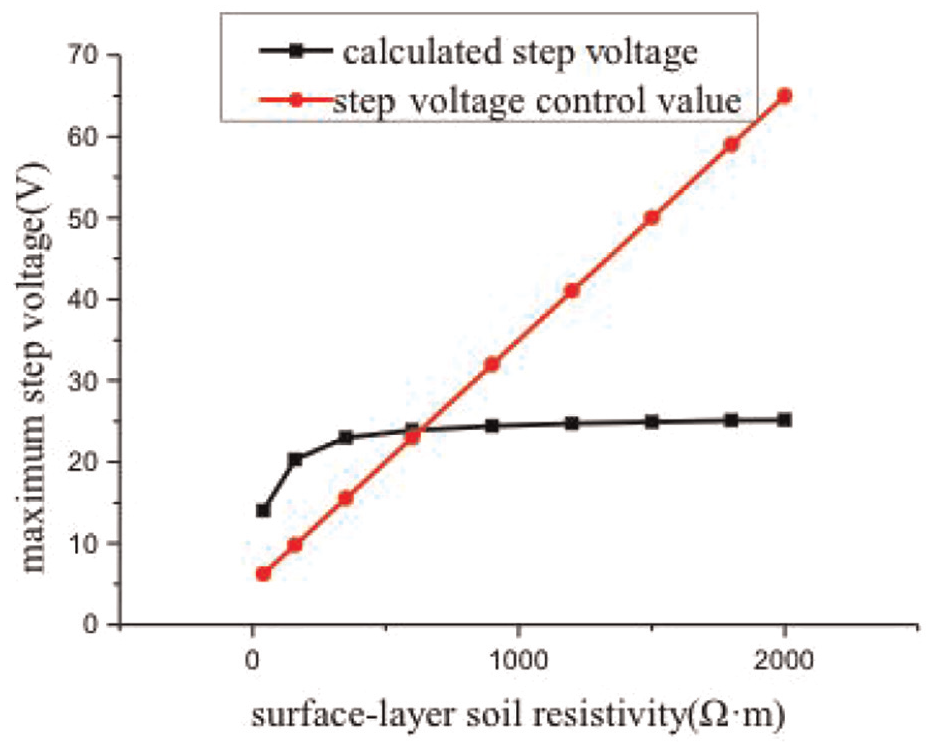
Changes in step voltage with surface-layer soil resistivity.
As aforementioned, the changes in surface-layer soil moisture affect the earth-surface potential and step voltage. A decrease in shallow-layer soil resistivity leads to a higher earth-surface potential and lower potential gradient, with the latter more preferred to the former in engineering practice with respect to personal safety. However, the earth-surface potential and step voltage are slightly affected by the surface-layer soil moisture. In the case of high shallow-layer soil resistivity, the step voltage and earth-surface potential are significantly affected by the surface-layer soil resistivity. The large changes in earth potential affect (to some extent) the solution-seeking process for the problems of other electrical parameters. The large fluctuation in step voltage poses a certain degree of potential safety hazard to nearby people. The comparison between the soil model and the traditional model in this paper shows that the traditional model cannot reflect the impact of short-term climate on the step voltage and ground potential. Therefore, in order to obtain more practical electrical parameters of the ground electrode, ensure personal safety and maintain the ground electrode operates safely, it is essential to establish a dynamic soil model that is affected by short-term climate.
Conclusion
(1) Compared with the widely used Winner method, the method proposed in this paper has certain advantages in identifying the surface resistivity under the influence of climate. The image measurement method can not only measure the resistivity in real time and easily, but also overcome the influence of the harsh environment, and reduce the investment of resources. Finally, this non-contact measurement method has better protection for the measurement equipment, and reduces equipment damage.
(2) According to the specific working conditions of the ground electrode, the image collected on the site is processed, the step voltage of the site is identified by the soil image gray value, and the extreme value of safe gray value is determined, which is the safety monitoring of the ground electrode determines an accurate data reference. High-definition probes are arranged at the ground monitoring site of the ground electrode, and the on-site environment is observed by images. The area with the lower gray value represents the greater the moisture, so the greater the potential danger. By grading these areas, different warning levels are obtained, the smaller the gray value, the higher the danger level. In this way, it is possible to intuitively monitor and identify dangerous areas by means of images, provide reliable troubleshooting solutions for workers, and reduce waste of time and human resources.
The traditional soil model remains unchanged after engineering measurement and is used to calculate relevant electrical parameters. In fact, the surface resistivity of the earth electrode is greatly affected by the environmental climate, which changes the entire soil structure and ultimately affects the distribution of earth potential. In this paper, the soil model is established by combining traditional measurement methods with the methods in this paper. The resistivity of the lower layer resistivity is not easy to change through the Werner four-electrode method or the magnetotelluric method to invert the soil structure, and the surface resistivity of the soil with time-varying characteristics is identified by images, so that not only can ensure the accuracy of the soil electrical structure, at the same time, it can also reduce the personnel and economic invested by traditional methods for repeated measurements. Therefore, a dynamic soil model considering the impact of climate is established in this paper, so that the parameters calculated by this soil model are closer to the actual situation.
Footnotes
Declaration of conflicting interests
The author(s) declared no potential conflicts of interest with respect to the research, authorship, and/or publication of this article.
Funding
The author(s) disclosed receipt of the following financial support for the research, authorship, and/or publication of this article: This work was supported in part by the National Natural Science Foundation of China (NSFC) (61763049) and the Science and Technology plan of Applied Basic Research Programs key Foundation of Yunnan province (2018FA032), the Science and Technology plan of Applied Basic Research Programs Youth Foundation of Yunnan province (2017FD067).