
Abstract
The objective of this study is to clarify the differences of tractive performances generated by the sandy loam-grouser system and the clay soil-grouser system. The tractive performances of the grouser/track shoes are widely researched by previous researchers. However, it is essential to illustrate the influences of the soil properties on the tractive performances of the grouser shoe. Sandy loam and clay soil were used as the test soils for investigating soil parameters in this study. Moisture contents of soil were from 7.5% to 27%, dry basis. Parameters of sandy loam were obtained through direct shear tests, penetration tests, bulk density, and moisture content measurements in laboratory. The grouser shoe was made of steel. Based on the prediction result of tractive performances, the clay soil will always be performed better than the sandy loam no matter which dimension was chosen for single grouser shoe. Based on the experimental results, the grouser height of the track should be 5 cm in order to provide enough traction force, if a tracked vehicle is operated on the environment of either clay soil or sandy loam.
Introduction
Soil properties are important for generating tractive force of track-soil system. 1 In 1969, Dr Bekker investigated the cone index of the terrain, and base on that to determine the terrain’s trafficability. As a pioneer and a founder of Terramechanics, Dr Bekker 2 also developed an approach named bevameter technique which needs soil properties. As followers, many researchers, such as R.N. Yong, J.Y. Wong, developed the research on this field and have achieved prominent achievements.
Traction as the force derived from the interaction between track (grouser shoe) and soil could be influenced by two kinds of factors: the soil conditions and the dimensions of grouser shoes. 3 In the past decades, in order to quantify the traction of track–soil interaction, methods classified as the analytical methods, the semi-empirical methods, and the empirical methods have been developed. 4 No matter what a kind of method is chosen for predicting traction, the soil parameters should be known initially. LO Garciano et al. 5 developed an instrumented portable device that measures soil sinkage, shear, and frictional parameters. The experimental results indicated that soil adhesion and soil–metal friction were functions of the intercept and the slope values of a cone torque versus a cone index plot. Moreover, soil cohesion was related to adhesion by the constrained adhesion relationship, and soil angle of internal friction was proportional to soil–metal friction. XL Wang et al. 6 conducted an experiment to investigate the characteristics of wheel–soil interaction with a model of lugged wheel and paddy soil. It was found that slip and sinkage of the lugged wheel showed a fluctuation with the rotate angle whose period equals the angular lug spacing. S Al-Milli et al. 7 reported a research on track–terrain modeling and traversability prediction for tracked vehicles on soft terrain. The validity of the modeling has been successfully verified by his study. R Roşca et al. 8 developed a semi-empirical traction prediction model for an agricultural tire, which is based on the ellipse shape of the contact surface. The traction of the tire was limited only by the soil shearing strength, and the soil maximum shear stress was calculated by the Mohr–Coulomb equation. The study showed that increasing the value of ellipse exponent results in increasing area of contact surface.
Traction is also influenced largely by the dimensions of running gears, 9 such as the grouser spacing, 10 the grouser thickness, 11 and the height of grouser. 12 The angle while a lug/grouser penetrates into land should also be considered as an important factor. Y Yang et al. 13 proposed a novel wheeled mechanism integrated with an actively actuated lug to dampen the fluctuations of drawbar pull when the wheel is moved forward on a rough terrain condition. During the experiment, length and angle of a single lug have been adjusted by the mechanism of planetary gear and sun gear. AL Fajardo et al. 14 reported a study that investigated forces and puddling characteristics of the tilling wheel of float-assisted tillers at different lug angles and shaft speeds. The effects of varying lug angles (0° and 13°) and shaft speeds (200, 250, and 300 r/min) on the force characteristics of the tilling wheel have been well investigated through this study.
Moreover, with the rapid advance in computer technology and computational techniques in decades, the computer-aided methods have become feasible to simulate the interaction between running gear and soil. 9 JY Wong and W Huang 15 have compared the tractive performances of wheeled and tracked vehicles based on the mechanics of vehicle–terrain interaction. For evaluating the thrust, two computer simulation models, one for wheeled vehicles which is known as Nepean Wheeled Vehicle Performance Model, and the other for tracked vehicles which is known as Nepean Tracked Vehicle Performance Model, were established. S Inaba and T Hiroma 16 utilized the finite element method (FEM) to analyze tractive performance of an agricultural tractor tire. It was found that the results of FEM agree well with the experimental results. Besides the FEM, the discrete element method (DEM) has also been used for simulating the interaction of running gearing–soil, and evaluating the tractive performance. H Nakashima and colleagues11,17–19 continuously focused on the implement of DEM and got a series of achievements, which is significant for researching and designing on agricultural vehicles and planetary rovers.
Based on the “Introduction” section, the tractive performances of the grouser/track shoes are widely researched. However, it is essential to illustrate the influences of the soil properties on the tractive performances. In this study, two kinds of soils, the sandy loam and the clay soil, have been investigated for their parameters. A steel grouser model was described for tractive performance prediction from the standpoint of the mechanics of grouser–soil interaction. The parameters of the sandy loam were acquired by soil tests and measurements in laboratory. The experimental process was described in detail in section “Experimental conditions.” The parameters of clay soil are determined as the experimental results reported by J Ge et al. 20 The tractive performances of single grouser shoe were investigated in two different soil conditions.
Preparation for the experiment
In this study, the tractive performance of single grouser shoe was predicted by semi-empirical method. When soil is shorn by a single grouser shoe, forces acted on the single grouser shoe could be analyzed and expressed with the two-dimensional cross-sectional view, as shown in Figure 1.

Forces acted on a single grouser shoe.
As a constant quantity, the vertical pressure W is an important factor for generating thrust, no matter in the situation of initial pass 9 or multi-pass.21,22 As shown in Figure 1, the vertical pressure is described by
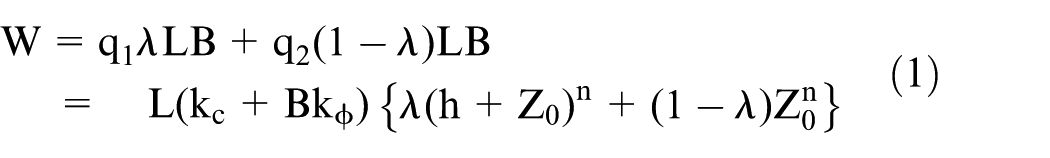
where q1 is the reaction of the soil at the tip surface of grouser, kPa; q2 is the reaction of soil at the bottom surface of spacing part, kPa; λ is the ratio of grouser thickness to shoe pitch; L is the shoe pitch, cm; B is width of the single grouser shoe, cm; h is the height of the grouser, cm; Z0 is the sinkage of the single grouser shoe, cm.
In order to quantitatively analyze the thrust generated by grouser–soil system, a three-dimensional shear model is introduced and shown in Figure 2. In this figure, the thrust was consisted of three parts: first of all, the F1 which is generated by the tip surface ABNM can be described as

where Ca is the soil adhesion to steel, kPa; δ is the external friction angle between soil and steel, °.

The 3D shear model of grouser–soil interaction.
Second, the F2 was the shearing force at the bottom surface BCON of the soil which was moved together with the track shoe. The F2 can be expressed as equation (3)

where C is the soil cohesion, kPa; q3 is the reaction by the soil on surface BCON, kPa; φ is the internal friction angle of the soil, °.
Thrust was also contributed by the shearing forces acted on both lateral sides such as the surface ACEH and MOVP. The forces of this part were denoted as F3, and it can be expressed by equations (4) and (5).
If the grouser’s sinkage is equal to or less than grouser spacing’s thickness which means

Otherwise, if

where γ is the bulk density of the test soil.
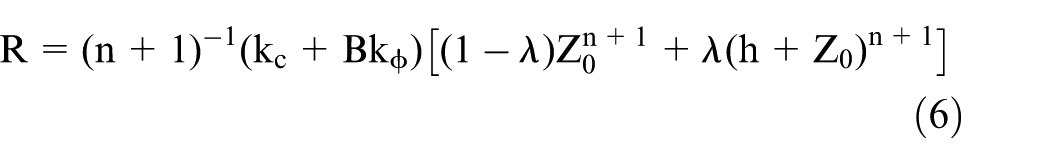
While the grouser is penetrated into the ground and the soil is compacted, the running resistance can be predicted using equation (6)
Therefore, the traction of the single grouser shoe can be known and the equation is expressed as equation (7)

Experimental conditions
Because tractive performances of the grouser shoe under different soil conditions were wanted to be predicted, the parameters of two soils should be investigated. The soil properties were changing with the various moisture contents, 23 and as a result, tractive performance of the track was also changed. 24 In this study, the moisture contents of the soils were in a range from 8.5% to 27%. As mentioned in section “Introduction,” the parameters of the clay soil utilized the experimental results reported by J Ge et al. 20 Meanwhile, the parameters of the sandy loam were obtained through the soil test and the measurement such as the direct shear test, the penetration test, the measurements of bulk density, and moisture content. Entire process of the experiment with the sandy loam is shown in Figure 3.

The flow chart of experimental process under the sandy loam condition.
As shown in Figure 3, the sandy loam is sun dried and sieved for the tests and the measurements to next step. When the soil was investigated completely for parameters at one level of moisture content, the soil was put water in for changing the moisture content. Then, repeat the processes of the tests and the measurements again. After soil parameters of four different moisture contents have been acquired, the tractive performances have predicted using the soil parameters and the three-dimensional shear model through mathematical prediction equations as shown in equations (2)–(7).
The direct shear test
The direct shear test is a wildly used method for measuring soil properties, such as internal and external friction angle, soil’s adhesion, and cohesion strength.2,25,26 In this study, the diagram and locale picture of the direct shear test’s instruments are shown in Figures 4 and 5, respectively.

The diagram of the direct shear test’s instruments.

The locale picture of the direct shear test’s instruments.
As shown in Figure 4, the shearing force and displacement are measured by a load cell and a displacement transducer, respectively. While the upper and the lower shearing box have been filled with the sandy loam, the internal friction angle and the cohesion strength of soil were investigated. The pressure acted on the cover of the shear box was changed with three different weights: 353, 498.5, and 705 g. The external friction angle and the adhesion strength were obtained through the test when the lower shearing box was laid a circular steel plate and the upper shearing box was filled with sandy loam. The changes of the weights were also 353, 498.5, and 705 g in this process.
The penetration test in laboratory
Soil bin test is widely used in laboratory soil tests.27–29 Because it is easy to change the moisture contents of the test soil, the penetration test was also carried out in the condition of soil bin. The diagram and locale picture of the penetration test’s instruments are shown in Figures 6 and 7, respectively.

The diagram of penetration test’s instruments.

The locale picture of the penetration test’s instruments.
As shown in Figure 6, the depth of penetration and the soil’s reaction on the test plate are detected by a displacement transducer and a load cell, respectively. Soil was put into the soil bin with exactly the same process to keep the uniform of the soil’s state every time when the test was repeated. The dimensions of two test plates are 1.9 cm × 19 cm × 30 cm and 1.9 cm × 25 cm × 30 cm.
Result and discussion
The tractive performance of single grouser shoe was predicted by the soil parameters and the three-dimensional shearing model which have been introduced in section “Preparation for the experiment.”
Experimental results of soil parameters
Experimental results of the sandy loam and the clay soil had been obtained when the moisture contents are in a range from 7.5% to 27%, and the differences of them have been compared as shown in Figures 8–15.

The adhesion strength.

The cohesion strength.

The internal friction angle.

The external friction angle.

The soil cohesion modulus.

The soil frictional modulus.

The sinkage exponent.

The bulk density.
Figures 8 and 9 show that the graphs of the relationships between the adhesion strength and the moisture contents, the cohesion strength and the moisture contents, respectively. In Figure 8, adhesion strength of the two soils has been figured out. A peak value around 2.15 kPa emerged at the moisture content 15% on the curve of the sandy loam. The adhesion strength of the sandy loam to steel nearly grew in direct proportion with the increase of the moisture content before 15%. After 15% of the moisture content, the adhesion strength was decreased with the increase of the moisture content, and the adhesion strength was around 0.4 kPa at the highest level of moisture content, 29%, dry basis. Compared to the sandy loam, the adhesion strength of the clay soil to steel was increased with the increase of the moisture content except the interval in a range from 8.5% to 14%, in which the adhesion strength had kept stable with the increase of the moisture content.
Figure 9 shows that the cohesion strength of the sandy loam and the clay soil have similar situations to the adhesion strength of the two soils when they changed with the increase of the moisture content, respectively. The cohesion strength of the clay soil was also increased with the increase of moisture content from lowest to highest level of the soil moisture content. Nevertheless, the cohesion strength of the sandy loam stayed at 0.7 kPa from 26% to 29% of moisture content. The maximum value of the cohesion strength of the clay soil was 1.85 kPa at 27% moisture content, and for the sandy loam, it was 2.1 kPa at 15% moisture content.
The relationships between the internal friction angles of two soils and the moisture content are graphed in Figure 10. The internal friction angles of the clay soil were greater than those of the sandy loam from the lowest to the highest level of the moisture content. These two curves have same trends to each other with the change of the moisture content. Both of them decreased with the increase of the moisture content. The internal friction angle of the clay soil had a maximum value of 46° at the 8% moisture content. At the same time, the maximum value of sandy loam was 20° which also emerged at the moisture content level of 8%. The internal friction angle of the clay soil kept almost two times to that of the sandy loam at each moisture content in a range from 8% to 29%.
Compared to the internal friction angles, the external friction angles of the two soils have different trends to each other as the moisture content changes. The external friction angle of the clay soil decreased from 23° to 18° when the moisture content was increased from 7% to 17%, and then, it stabilized around 18° as the increased moisture content. Different to the clay soil, the external friction angles of the sandy loam almost kept no changes with the increase of the moisture content. Meanwhile, the same with the internal friction angles of the soils, the external friction angles of the clay soil were greater than that of the sandy loam no matter which moisture content of the soils was.
The kc is a modulus concerned to the cohesion strength of soil. In Figure 12, the kc of the clay soil was directly proportional increased with the increase of the moisture content. It closed to 0 at lowest moisture content and 0.17 N/mn + 1 × 10–n – 2 at highest moisture content. Meanwhile, the kc of the sandy loam has a peak value around 0.06 N/mn+1 × 10–n – 2 at 22% moisture content. Before this moisture content level, it increased with the increase of the moisture content, and after that, it decreased with the increase of the moisture content. These two soil’s kc equaled to each other around 0.04 N/mn + 1 × 10–n – 2 at 14% moisture content. The kc of the sandy loam was greater than that of the clay soil when the moisture contents were less than 14%. However, the opposite situation could be known after 14% moisture content in this figure.
The kφ is a soil frictional modulus. As shown in Figure 13, both sandy loam’s and clay soil’s kφ decreased with the increase moisture content. The kφ of the clay soil was greater than that of sandy loam at the each level of the moisture content. Because a slight increasing was happened from 7% to 11% moisture content, the largest kφ of the clay soil, 0.2 N/mn+1 × 10–n – 3, emerged at 11% moisture content. At the same time, the smallest kφ of the clay soil, 0.05N/mn+1×10–n – 3, emerged at 27% of the moisture content. To the kφ of the sandy loam, the maximum value was 0.15 N/mn + 1 × 10–n – 3 at 8% moisture content; meanwhile, the minimum value was close to 0.03 N/mn + 1 × 10–n – 3 at the highest moisture content of soil.
The hardness of soil was indicated by the modulus of sinkage exponent. In Figure 14, the sinkage exponent of the clay soil decreased proportionally with the increase of the moisture content. The n of the clay soil was 0.8 at 8% moisture content and close to 0.5 at 27% moisture content. For the sandy loam, the sinkage exponent has complex trends with the increase of the moisture content. The n of the sandy loam has a peak value of 0.66 at 22% moisture content. Because the curve of sandy loam was similar to a parabolic curve, the n increased with the increase of the moisture content before 22% and the opposite situation happened after this moisture content. The n of the clay soil was always greater than that of the sandy loam except the moisture content intervals from 17% to 27%.
The bulk density is an important property for soil. Figure 15 shows that the bulk density of the clay soil kept slight change with the increase of the moisture content. It changed from 1000 kg/m3 at 8% moisture content to 825 kg/m3 at 27% moisture content. Different to the clay soil, the bulk density of the sandy loam increased rapidly with the increase of the moisture content except the interval from 8% to 12% during which the bulk density stabilized around 1100 kg/m3. The largest density of the sandy loam was 2100 kg/m3 at the highest level of moisture content in this experiment.
Experimental results of tractive performances
Based on the soil parameters described in section “Experimental results of soil parameters” and the three-dimensional shearing model introduced in section “Preparation for the experiment,” the tractive performance under the condition of two different soil types was predicted successfully. Figures 16–18 show that the thrust, the resistance, and the traction of the single grouser shoe changed with the change of the moisture content when the grouser heights are 1, 3, and 5 cm with the grouser thickness ratio λ = 0.1.
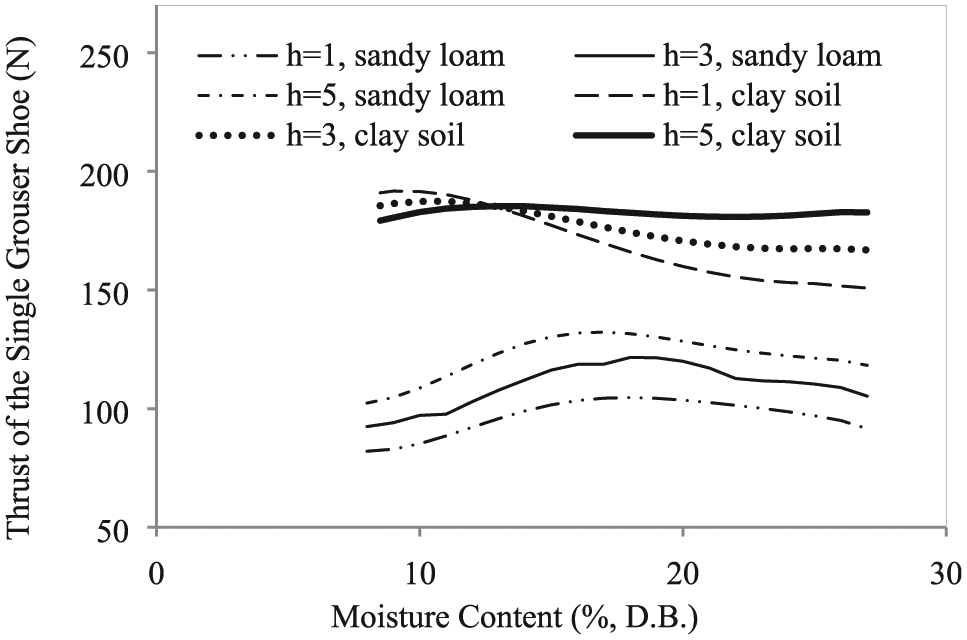
The thrusts of the single grouser shoes with grouser heights 1 cm, 3 cm, 5 cm, and λ = 0.1.

The running resistances of the single grouser shoes with grouser heights 1 cm, 3 cm, 5 cm, and λ = 0.1.

The tractions of the single grouser shoes with grouser heights 1 cm, 3 cm, 5 cm, and λ = 0.1.
Thrust is the general of shearing forces generated by the grouser–soil interaction system. Figure 16 shows that predicted thrusts changed with the moisture content under the conditions of different soil types and grouser heights. For the sandy loam, the thrust of the single grouser shoe with 1, 3, and 5 cm grouser heights were all increased with the increase of the moisture content until a peak value from lowest level, respectively. Then, the thrusts of single grouser shoes turned to decreasing with the increase of the moisture content until the highest moisture content. The thrusts of the grouser shoe with 5 cm grouser height performed better than the ones with 1 and 3 cm grouser height at each level of the moisture contents. Meanwhile, the thrusts of the clay soil were greater than those of the sandy loam no matter which grouser height was chosen in this experiment. For the clay soil, the thrusts of the grouser shoes with 1 and 3 cm grouser heights stabilized with the increase of the moisture content from the lowest level, and then, they turned to decreasing with the increase of the moisture content until 27% moisture content. Nevertheless, the thrust of the grouser shoe with 5 cm grouser height was slightly changed around 180 N with the increase of moisture content. In clay soil, 3 cm grouser height generated middle thrusts between the grouser heights of 1 and 5 cm. If the moisture content of soil less than 12%, 1 cm grouser height performed better than that of 5 cm one in thrust generation; otherwise, 5 cm grouser height performed better than that of others after 12% moisture content.
In Figure 17, the running resistance of same grouser shoe performed close to each other with two test soils at each level of moisture contents. They were all changed slightly with the increase of the moisture content from lowest level at first, and then, they increased rapidly with the increase of the moisture content. Depending on the traction definition, the smaller the resistance, the greater the traction. Therefore, 1 cm grouser height shoe performed best in both the clay soil and the sandy loam. When the moisture content was in a range from 8% to 19%, the resistances of 1 cm grouser height shoe in clay soil were smaller than those in sandy loam. After that, the opposite situation could be known and they were both closed to 62 N at the highest level of the moisture content.
Traction is a significant quantitative parameter for tractive performance. Great generation of the traction means that the soil has a fine ability of mobility. As shown in Figure 18, the clay soil could provide greater tractions than sandy loam at each level of the moisture contents. The tractions of the grouser shoes with longer grouser heights have better performances than those of shorter ones in sandy loam from lowest to highest level of the moisture contents. In clay soil, tractions generated by the grouser shoes with shorter grouser heights were greater than those of the higher ones when the moisture contents were in a range from 8% to 17%. After 17%, as the same as the sandy loam, the higher grouser performed better. Above all, if a tracked vehicle is operated on a ground environment of the sandy loam with 8% to 27% moisture contents, a grouser shoe with a long grouser height is better for generating traction. Meanwhile, if a tracked vehicle is operated on a ground environment of the clay soil with 17% to 27% moisture contents, a long grouser height also could be a better choice. However, if the moisture contents are less than 17%, a grouser shoe with short grouser height could be used for generating greater traction. Moreover, if a tracked vehicle is operated on a ground environment of both the sandy loam and the clay soil, 5 cm grouser height could be a better choice. Figures 19–21 show the thrust, the resistance, and the traction changed with the change of the moisture content of soil when the grouser thickness ratios were 0.1, 0.2, and 0.3 with a grouser height of 3 cm.

The thrusts of the single grouser shoes with grouser thickness ratios λ = 0.1, 0.2, 0.3, and h = 3 cm.

The running resistances of the single grouser shoes with grouser thickness ratios λ = 0.1, 0.2, 0.3, and h = 3 cm.

The traction of the single grouser shoes with grouser thickness ratios λ = 0.1, 0.2, 0.3, and h = 3 cm.
In Figure 19, the greatest thrust of single grouser shoe was generated by the shoe with the λ of 0.1 at each moisture contents in clay soil. The thrust of λ = 0.1 shoe decreased with the increase of the moisture content. When the moisture contents were less than 11%, the thrusts of this track shoe were around 180 N. The thrusts were around 170 N at the highest level of the moisture content in this experiment. The thrusts of track shoes with 0.2 and 0.3 grouser thickness ratios were increased with the increase of the moisture content in clay soil. Based on this graph, the track shoe with a thinner grouser thickness performed better at thrust generation in clay soil. The thrusts of track shoes with different grouser thicknesses have similar changes with the change of the moisture content. At first, they increased with the increase of the moisture content until a pick value, respectively. Then, all of them turned decreasing with the increase of the moisture content. The same with the clay soil, track shoe with a thinner grouser thickness also performed better at thrust generation in sandy loam, and the maximum value of the thrust was 115 N at 19% moisture content.
As shown in Figure 20, the same grouser shoe generated closed resistance between the clay soil and the sandy loam. The resistances of track shoes with different grouser thickness ratios stabilized to the increasing of the moisture content at the beginning intervals, respectively. Nevertheless, after that the resistances increased rapidly with the increase of the moisture content, respectively. As mentioned above, a smaller resistance is better for tractive performance. Depending on Figure 20, the track shoe with 0.1 grouser thickness ratio has the smallest resistance at each moisture contents in both the clay soil and the sandy loam.
The tractions were the results of the thrusts minus the running resistances, as shown in Figure 21. In general, clay soil has a better performance for traction generation than sandy loam. Tractions of the track shoe with 0.1 and 0.2 grouser thickness ratios decreased with the increase of the moisture content from lowest to highest level in clay soil. Traction of the track shoe with 0.3 grouser thickness ratio increased with the increase of the moisture content at first, and then, it turned decreasing with the increase of the moisture content in clay soil. For the sandy loam, the tractions of the track shoes with the three different thickness ratios have same tendencies with the increase of the moisture content, and these tendencies were same with that of track shoe with 0.3 grouser thickness ratio in clay soil mentioned above. The greatest traction, about 170 N, was generated by 0.1 thickness ratio at the lowest moisture content level in clay soil; meanwhile, the largest traction of track shoe in sandy loam was also generated by 0.1 thickness ratio with the value of 80 N at 19% moisture content. Above all, it should be known that no matter the track operated on the environment of the sandy loam or the clay soil; the 0.1 grouser thickness ratio to shoe pitch could be a better choice for tractive performance.
Conclusion
In this study, the soil properties of the clay soil and the sandy loam have been investigated. With the acquired soil parameters and three-dimensional direct shearing model, the thrust, the running resistance, and the traction of the single grouser shoes with three different grouser heights and three different grouser thickness ratios have been predicted. Based on the discussions of the prediction results, several conclusions could be achieved as follows:
When the moisture contents of the soil were in a range from 7.5% to 27%, the clay soil always has a better tractive performance no matter which dimension was chosen for single grouser shoe. At the same time, a thinner grouser thickness generated a greater traction performance either for clay soil or sandy loam.
On the ground of clay soil, the optimum grouser height for tractive performance was decided by the moisture content of the soil: when the moisture content is less than 17%, the suitable grouser height is 1 cm; otherwise, 5 cm grouser height is a better choice. In the condition of sandy loam, 5 cm grouser height could generate ideal traction as when the moisture contents are in a range from 7.5% to 27%.
When a tracked vehicle operated on the environment of both clay soil and sandy loam, grouser height of the track should be 5 cm in order to produce a proper traction force.
Footnotes
Handling Editor: James Baldwin
Declaration of conflicting interests
The author(s) declared no potential conflicts of interest with respect to the research, authorship, and/or publication of this article.
Funding
The author(s) disclosed receipt of the following financial support for the research, authorship, and/or publication of this article: This work was supported in part by the Research Project of Anhui Natural Science Foundation (no. 1808085QE171), Anhui Agriculture University Foundation (no. 2017zd07), and the Scientific Research Foundation of Anhui Agriculture University (no. yj2017-22).