
Abstract
Titanium (Ti) and its alloys have gained immense popularity as biomaterials in recent years. Their excellent specific strength makes them outstanding materials for orthopaedic applications. However, in the orthopaedic application, precise micro-drilling (i.e. implants inserts) is required, which is very challenging for these materials. To overcome this issue, the present research proposes an experimental study corroborated with a multi-objective optimization by simulating the drilling under electric discharge machining of Ti-6Al-4V. Taguchi’s methodology–based L9 orthogonal array was used for the experimental study. Voltage, current, pulse on and pulse off were used as the input parameters for the experimental investigation. In order to achieve suitable precise drilling, the material removal rate and surface finish were used as response parameters. Here, by optimizing parameters of the precise drilling, it is possible to obtain high material removal rate and better surface finish simultaneously. The Grey relational analysis was adopted to analyse the output quality characteristics. The optimized results generated through the Grey relational analysis are highly accurate with respect to the experimental outcomes.
Keywords
Introduction
The high strength and low conductivity of Ti-6Al-4V alloys make them the preferred choice for the biomedical applications.1,2 These alloys are used in many biomedical applications such as artificial knee joints, bone plates, pacemakers and artificial hip joints. 3 The low conductivity of these alloys helps in the electrochemical oxidation of titanium which results in high resistance to corrosion by the formation of tiny inactive oxide layer. 4 But the machining of titanium-based materials, especially Ti-6Al-4V, leads to severe tool wear and poor surface finish (SR). 5 The low thermal conductivity and higher chemical reactivity place these materials in the category of delicate to machine. 6 The advanced industrial applications keenly focused on surface integrity and high production rate, which can be achieved with high machining rate. 7 However, drilling of these materials at high machining rate is quite problematic because of high tool wear, surface hardness and poor SR. The strain hardening effect and high toughness are generally observed during conventional machining of these materials. 8 To overcome these difficulties, unconventional machining methods like wire electric discharge machining and electric discharge machining are adopted by researchers to machine these materials. 9 The electrical discharge machining process is an unconventional machining process used to machining hard and brittle conductive materials. 10 The process starts when the thermal spark is initiated and melts the upper surface of the specimen and eliminates the substantial in the form of fragments. 11 The removal of material from specimen surface is actually performed by the heat energy caused by the number of sparks generated in a small interval of time. 12
Over time, several investigations have been concentrated on the optimisation of these types of unconventional machining processes. For that purpose, a number of different approaches like artificial neural networks (ANN), 13 adaptive neuro-fuzzy computing, 14 numerical simulation, 15 finite element modelling, 16 genetic algorithm, 17 and response surface methodology 18 were adopted by the researchers to perform single- and multi-response optimization. Each optimization technique has a viable effect on influencing machining performance of the process. The ANN follows a large number of artificial neurons and provides expected results, whereas response surface methodology is used for arduous study for a quadratic estimate. The optimal setting for single-response parameters is obtained by Taguchi’s method. 19
The enactment of the machining methods counts on an ideal amalgamation of input parameters. Deng 20 suggested a Grey assumption which assists in optimizing multi-response parameters effectually using Grey relational analysis (GRA). In this method, the rating of approximation amid categorization is evaluated by Grey relational grade (GRG). The GRA approach entices the investigational community to measure method proficiencies using the Grey approach in numerous machining methods. Singh et al. 21 optimized the piercing behaviour of Al6063/10%SiC metal matrix composite (MMC) using GRA methodology. Antil et al. 22 used Taguchi’s GRA to optimize the electrochemical discharge drilling (ECDD) process during micro-drilling in hybrid glass fibre–reinforced polymer matrix composites. Jung and Kwon. 23 optimized process parameters of electric discharge machining for multi-response characteristics using GRA methodology. Santhanakumar et al. 24 used Grey theory to obtain an optimal parametric strategy for response in water jet cutting of Al/SiC/Al2O3 MMC. Dao et al.25–27 used Taguchi-based GRA and utility concept for optimizing process parameters.
As stated earlier, the machining of Ti-6Al-4V alloys owns several challenges in terms of response characteristics. A convoluted interrelationship exists among input process parameters and response parameters in drilling of Ti-6Al-4V alloys as revealed in Figure 1. Consequently, simultaneous optimization for improved and well-organized processing of these alloys comes out to be a needful and essential step.
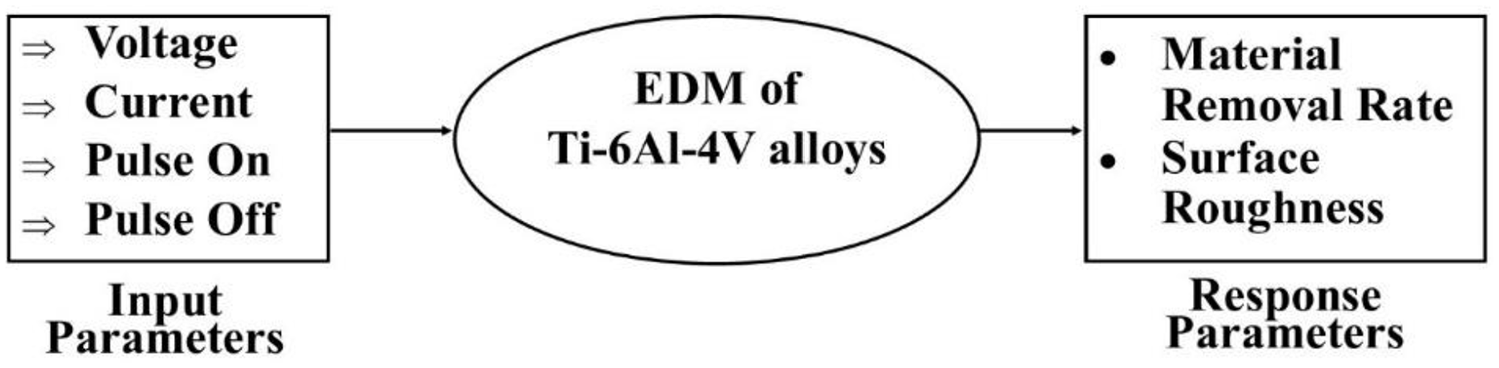
Relationship between input and output parameters.
Motivation for problem formulation
In recent years, the titanium-based alloys have gained an immense reputation as bioimplant materials. For that purpose, these materials require clear-cut machining for appropriate implant functions. The research presented in this paper allows optimizing the drilling parameters of Ti-6Al-4V alloys with maximum material removal rate (MRR) and better SR with respect to the input parameters. The levels of input parameters are listed in Table 1. The influence of these input parameters on response parameters was optimized by Grey theory.
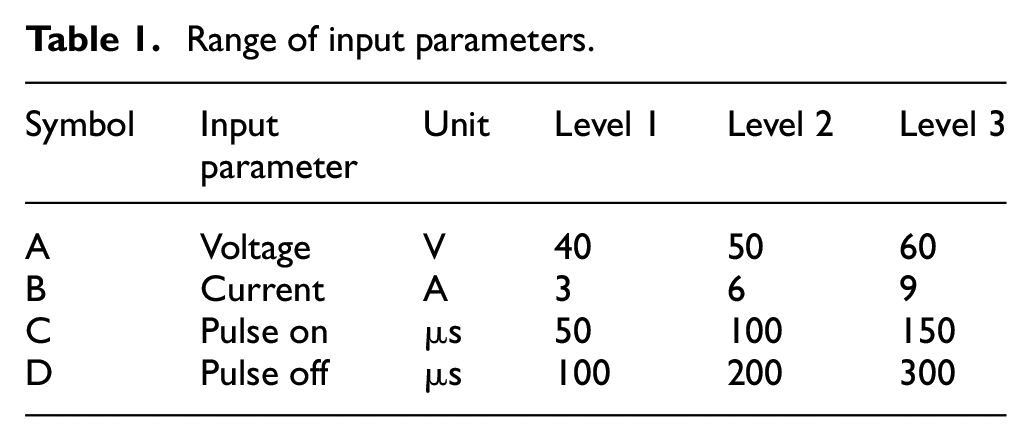
Range of input parameters.
Experimental planning and design
In present research work, Ti-6Al-4V alloy was considered as a test specimen for experimentation. The specimen was cast with the composition of Titanium (Ti), Aluminium (Al) and Vanadium (V) powder as raw material. The workpiece of size 30 mm × 30 mm ×10 mm was extracted from the alloy plate using the wire electric discharge machine. The test workpiece was then polished to remove any impurity of the foreign material from test surface. The drilling experiments were then performed on the electric discharge machine Elektra EMS 5535, as presented in Figure 2. The process parameters used for the drilling in Ti-6Al-4V alloy were categorized as input parameters. The levels of input parameters were used as voltage (40–60 V), current (3–9 A), pulse on (50–150 µs) and pulse off (100–300 µs). The hydrocarbon oil was used as a dielectric fluid for the entire experimentation. The MRR (mg/min) and surface roughness (μm) were used as response parameters. The MRR was calculated by measuring the weight of the workpiece before and after machining. The surface roughness was measured by measuring roughness depth (Rz) as well as the mean roughness value (Ra) in microns (μm) with a standard profilometer.
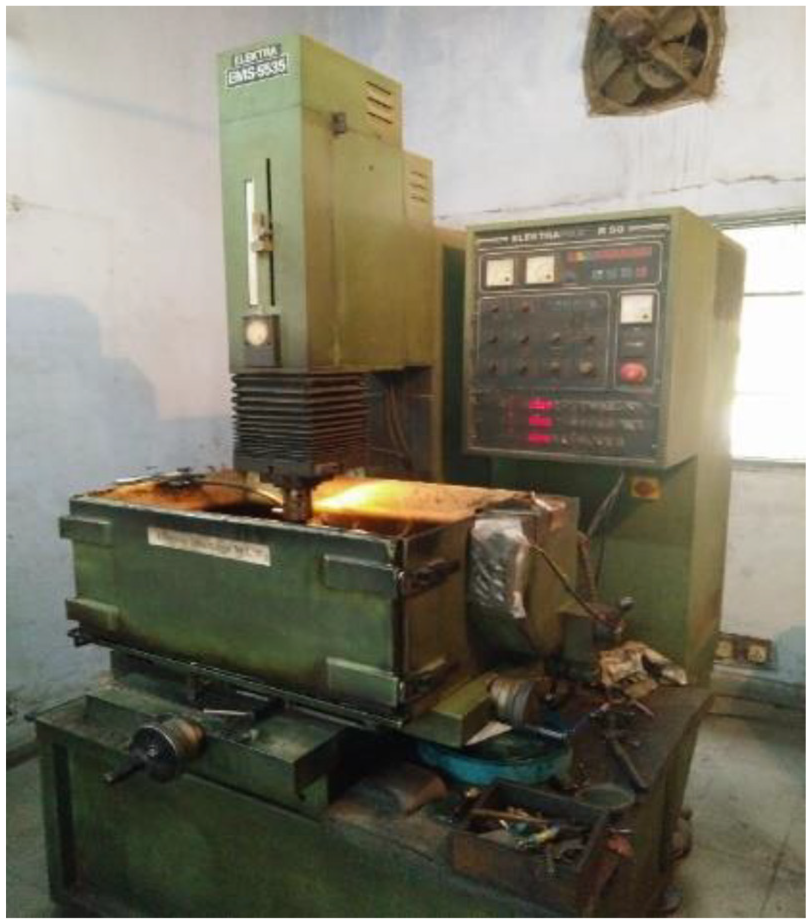
Electric discharge machine.
Optimization methodology
Taguchi’s methodology
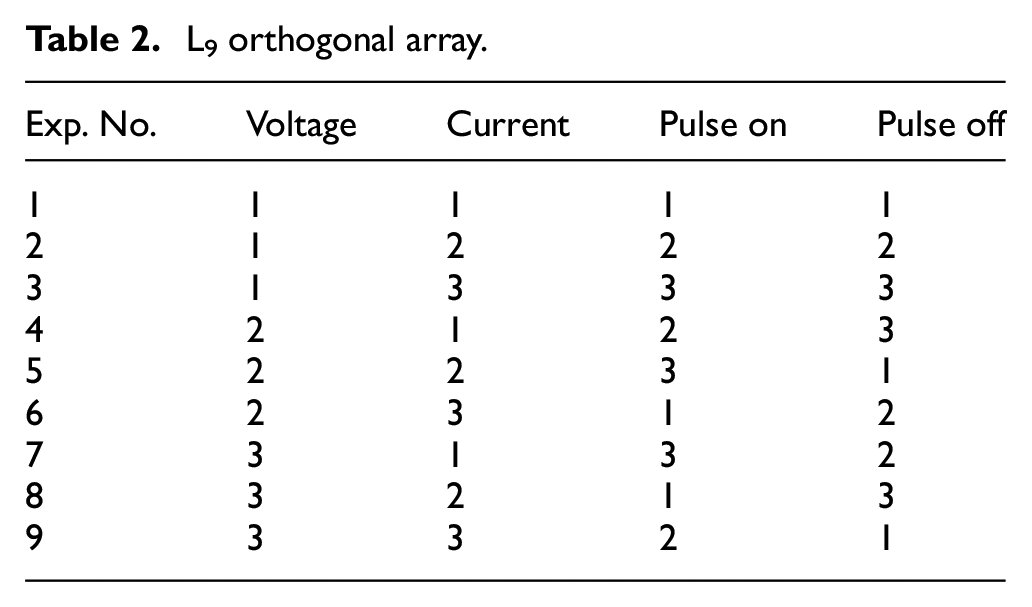
The experimental investigation was performed as per Taguchi’s design of experiments as presented in Table 2. The optimization for the single result was performed using Taguchi’s methodology in which the preliminary assignment is to transform the attained response features into S/N ratio, which will be used as a calculation key for responses. The experimental values for response parameters are shown in Table 3. Three replications were performed for each experiment in order to obtain statistically significant results. The corresponding average values are presented in Table 3 and Figure 3.
L9 orthogonal array.
Experimental values for response parameters.
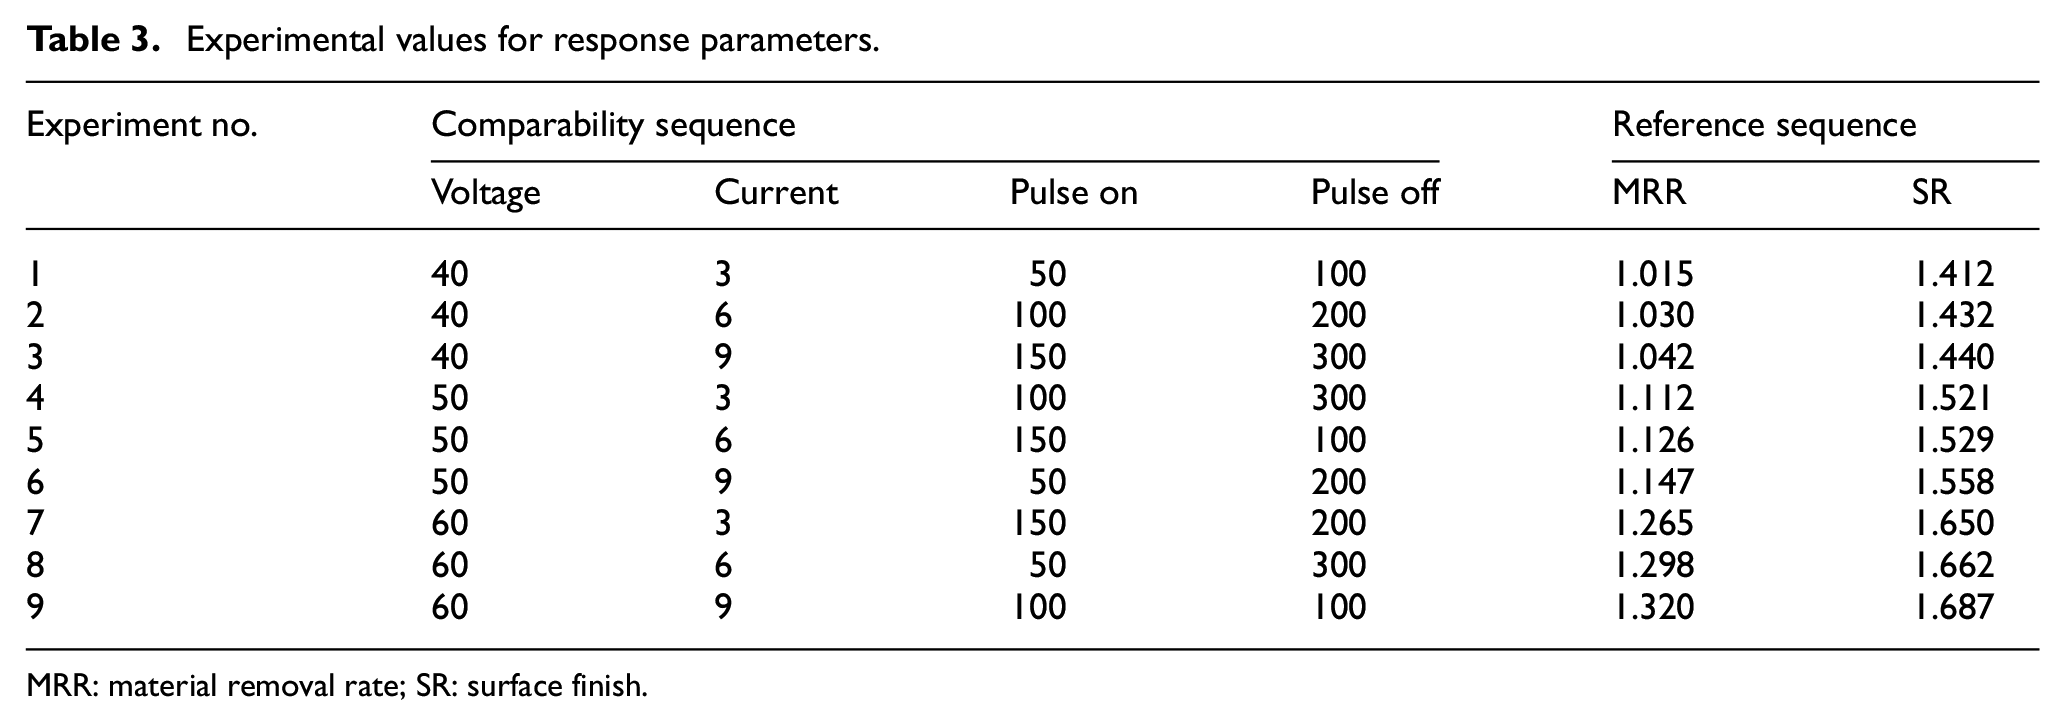
MRR: material removal rate; SR: surface finish.
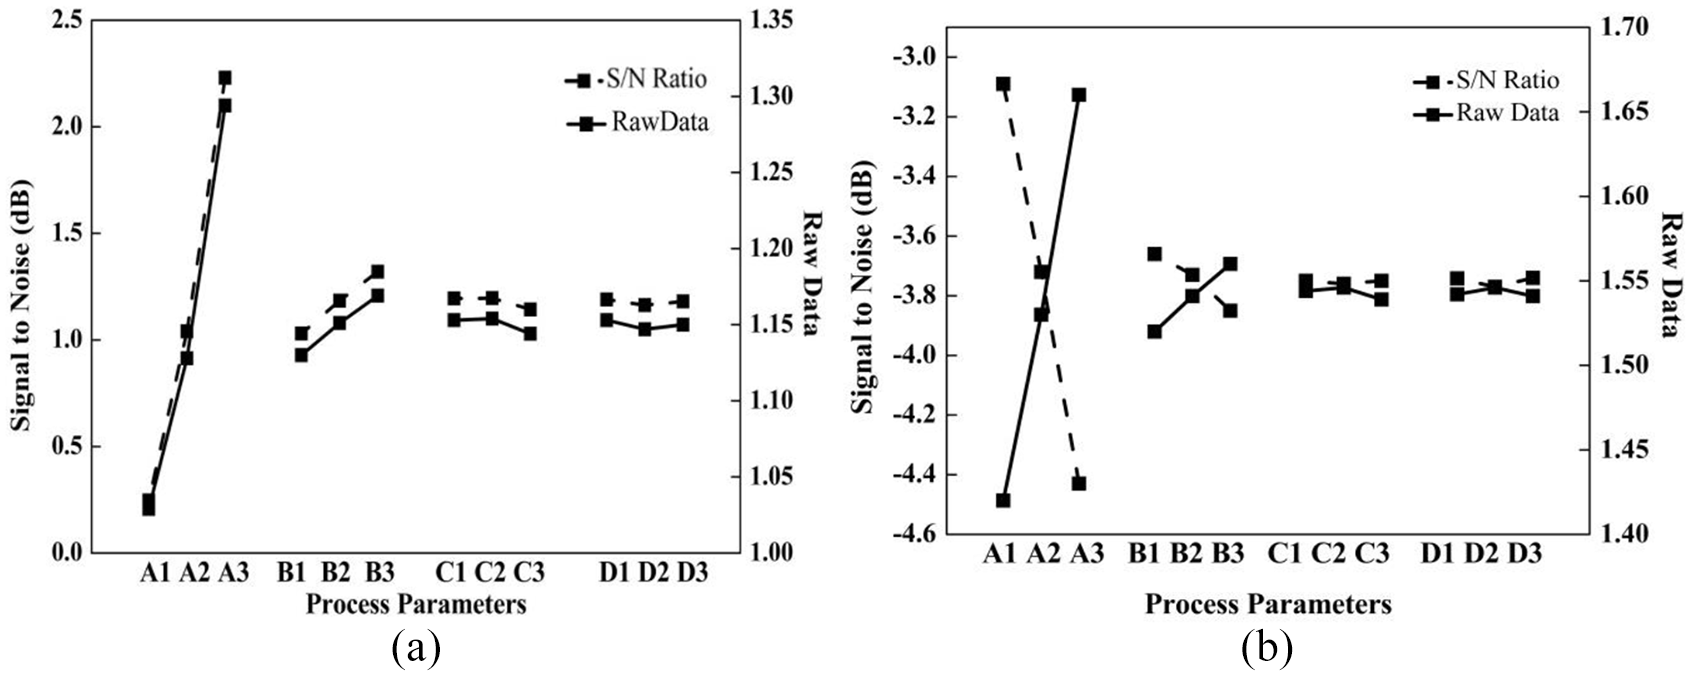
(a) S/N ratio for MRR and (b) S/N ratio for SR.
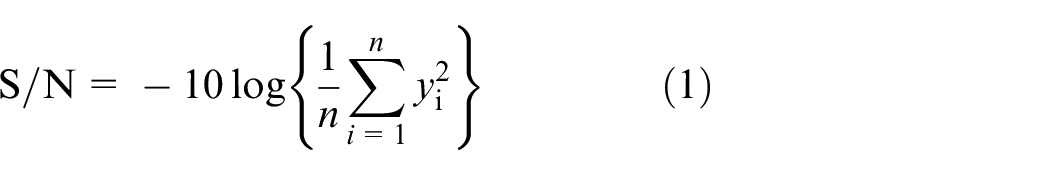
Based on the requirement, generally, three criteria for the signal-to-noise ratio are used by the researchers, which include greater is best, minimal is best and minor is best.28,29 In the present test, a minor is the best S/N ratio criteria are adopted for surface roughness. The corresponding S/N ratio can be determined as follows
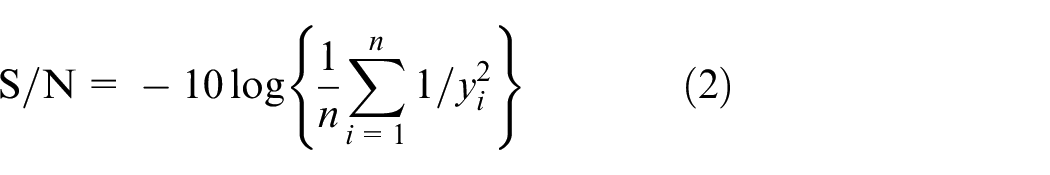
For the MRR, greater is the best S/N ratio criteria is adopted. Hence, the S/N ratio is computed as
Here,
The S/N ratio for MRR and surface roughness is plotted in Figure 3(a) and (b), respectively. The highest values in S/N ratio correspond to best-optimized values for the desired output. As per S/N ratio plot, the ideal parametric arrangement for maximum MRR is obtained as A3B3C1D3. The optimal setting of parameters is voltage (60 V), current (9 A), pulse on (50 µs) and pulse off (300 µs). Similarly, the ideal parametric arrangement for the better surface is obtained as A1B1C3D3. In actual value terms, the parametric value comes out to be a voltage (40 V), current (3 A), pulse on (150 µs) and pulse off (300 µs).
Analysis of variance
The analysis of variance (ANOVA) for the MRR and SR has been obtained through regression analysis and presented in Table 4. The tabulated results show that voltage comes out to be the most influential parameter for MRR. The generated model shows 97.89% as R2 value. The ANOVA for surface roughness showed voltage and current as most influential parameter for drilling in orthopaedic implants. The R2 value for the generated model was obtained at 99.58%.
ANOVA for MRR and SR.
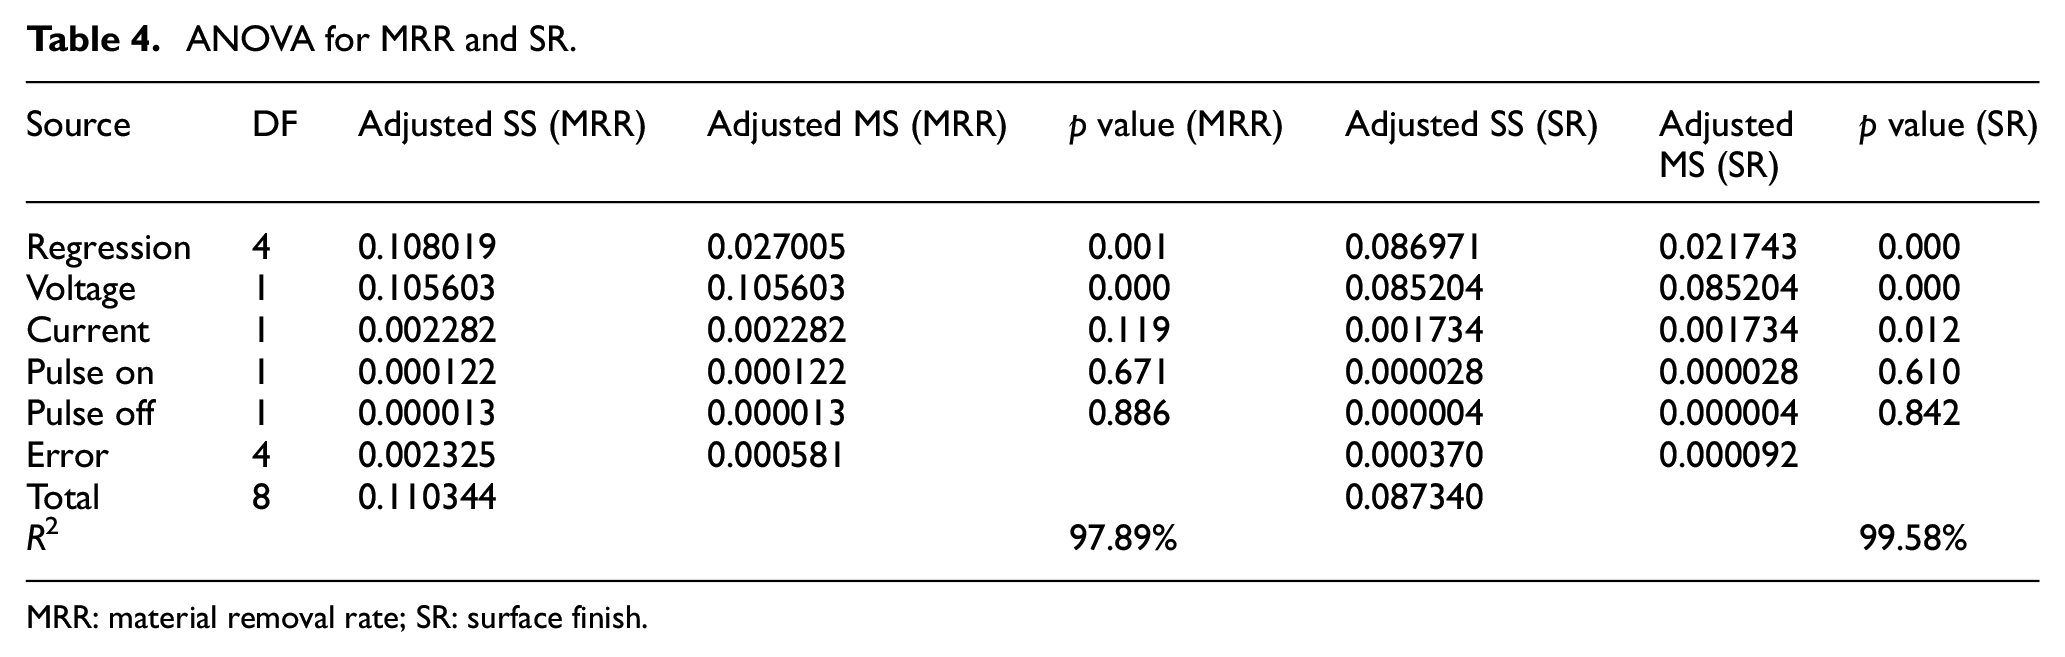
MRR: material removal rate; SR: surface finish.
Surface plots
The plotted graphs in Figure 4(a)–(c) show the effect of voltage on MRR with respect to current, pulse on and pulse off. The graphs depict that MRR increases with increase in voltage and current. The variation in current shows considerable increase in the MRR at higher level, whereas at higher pulse on the MRR decreases. The MRR decreases initially at higher pulse off but shows increasing trend at further increase in level. The surface roughness graph (see Figure 4(e)–(f)) increases for higher voltage and current. However, for pulse on, initially the SR increases slightly but, at higher pulse duration, it starts decreasing. For pulse off, the graphs show exactly opposite trend with respect to MRR.
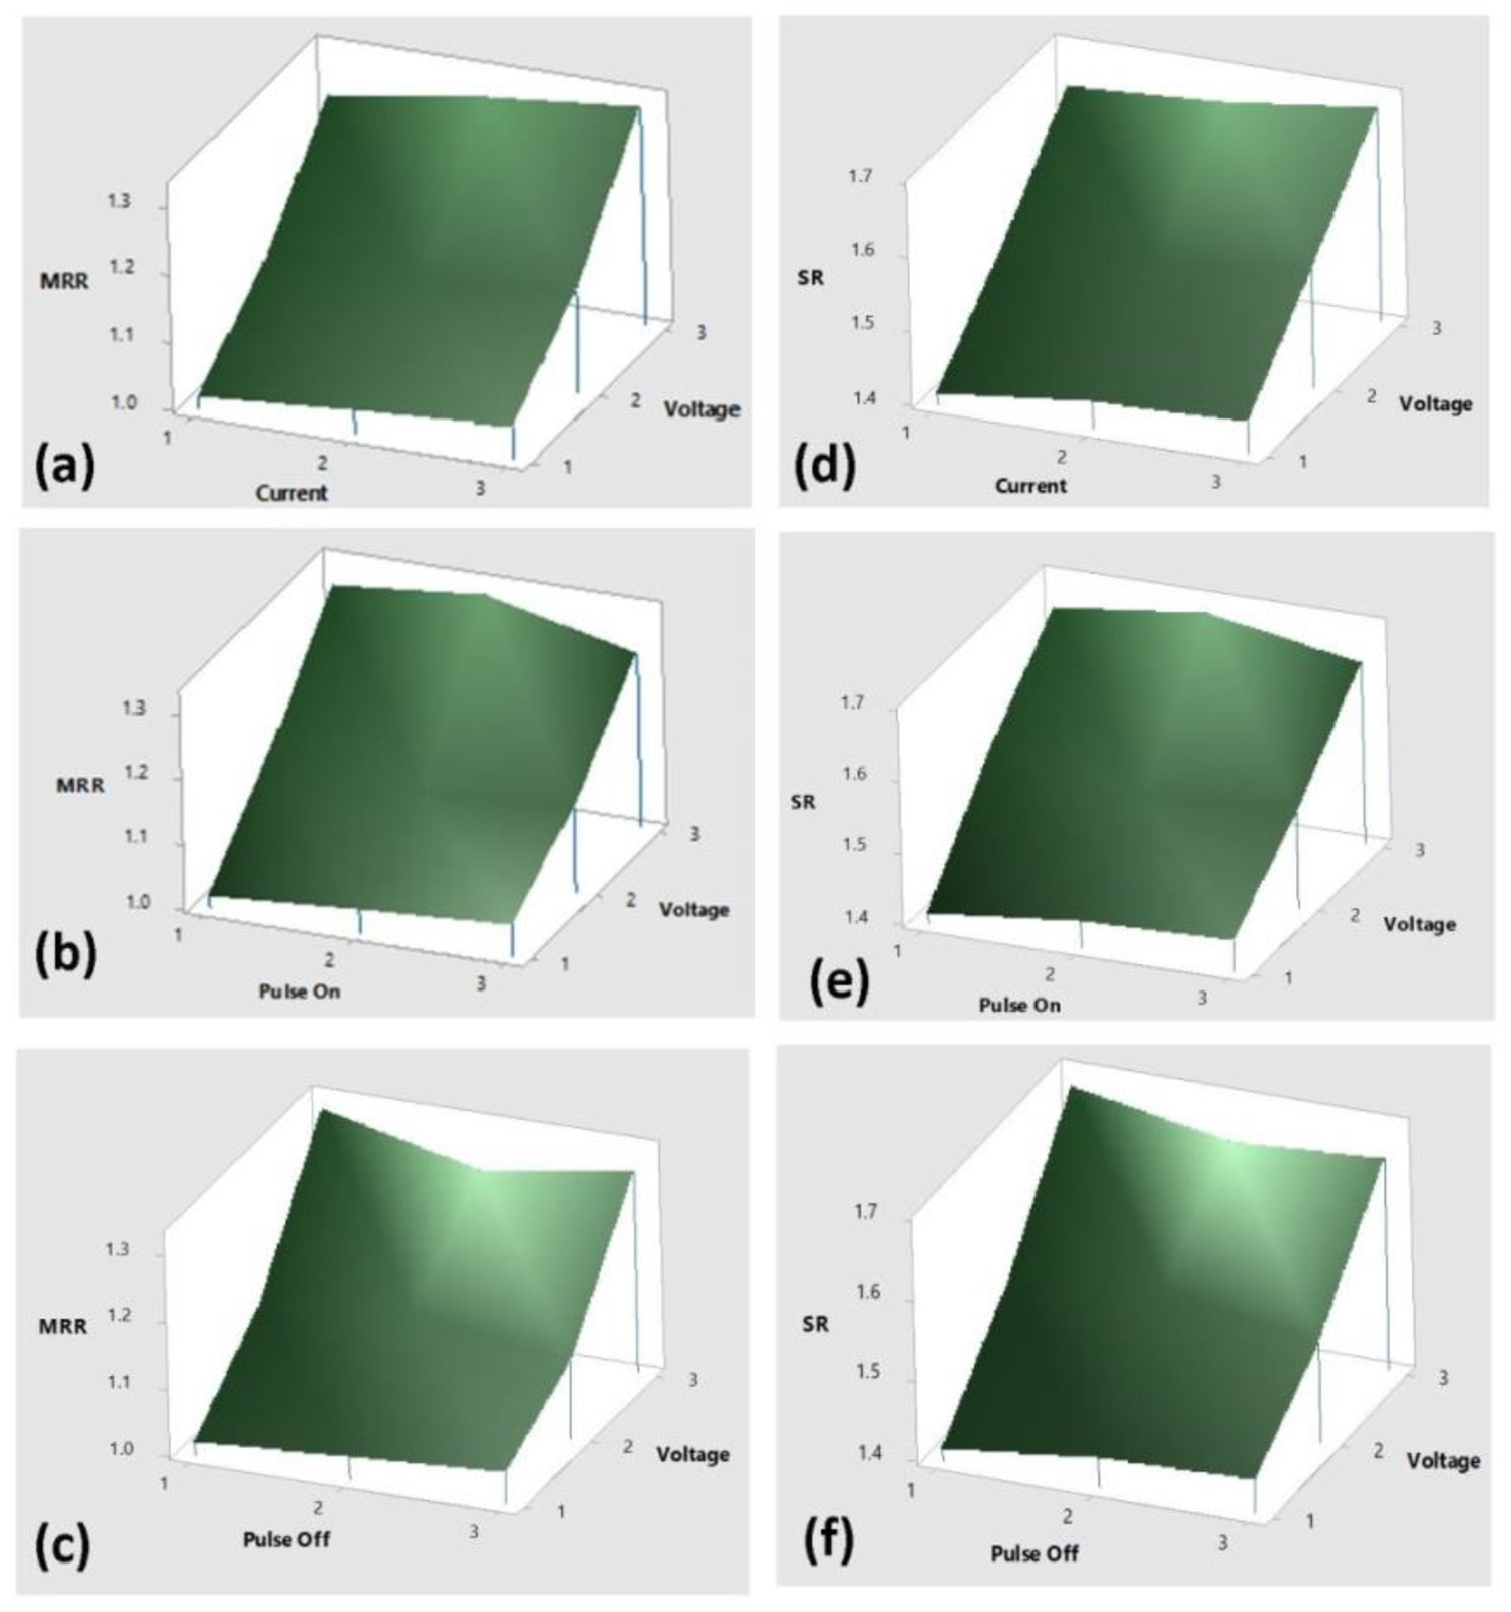
(a–c) Surface plots for MRR and (d–f) surface roughness.
GRA
The GRA is created based on Grey theory for multi-response optimization, which works on the principle of indication in which reflection can be either white or black, for example, impeccable evidence or no evidence. 22 Any representation which comes in between is termed as Grey. The order of implementation of the Grey relational approach is displayed as a process chart in Figure 5. The key steps in the GRA methodology are discussed in subsections.
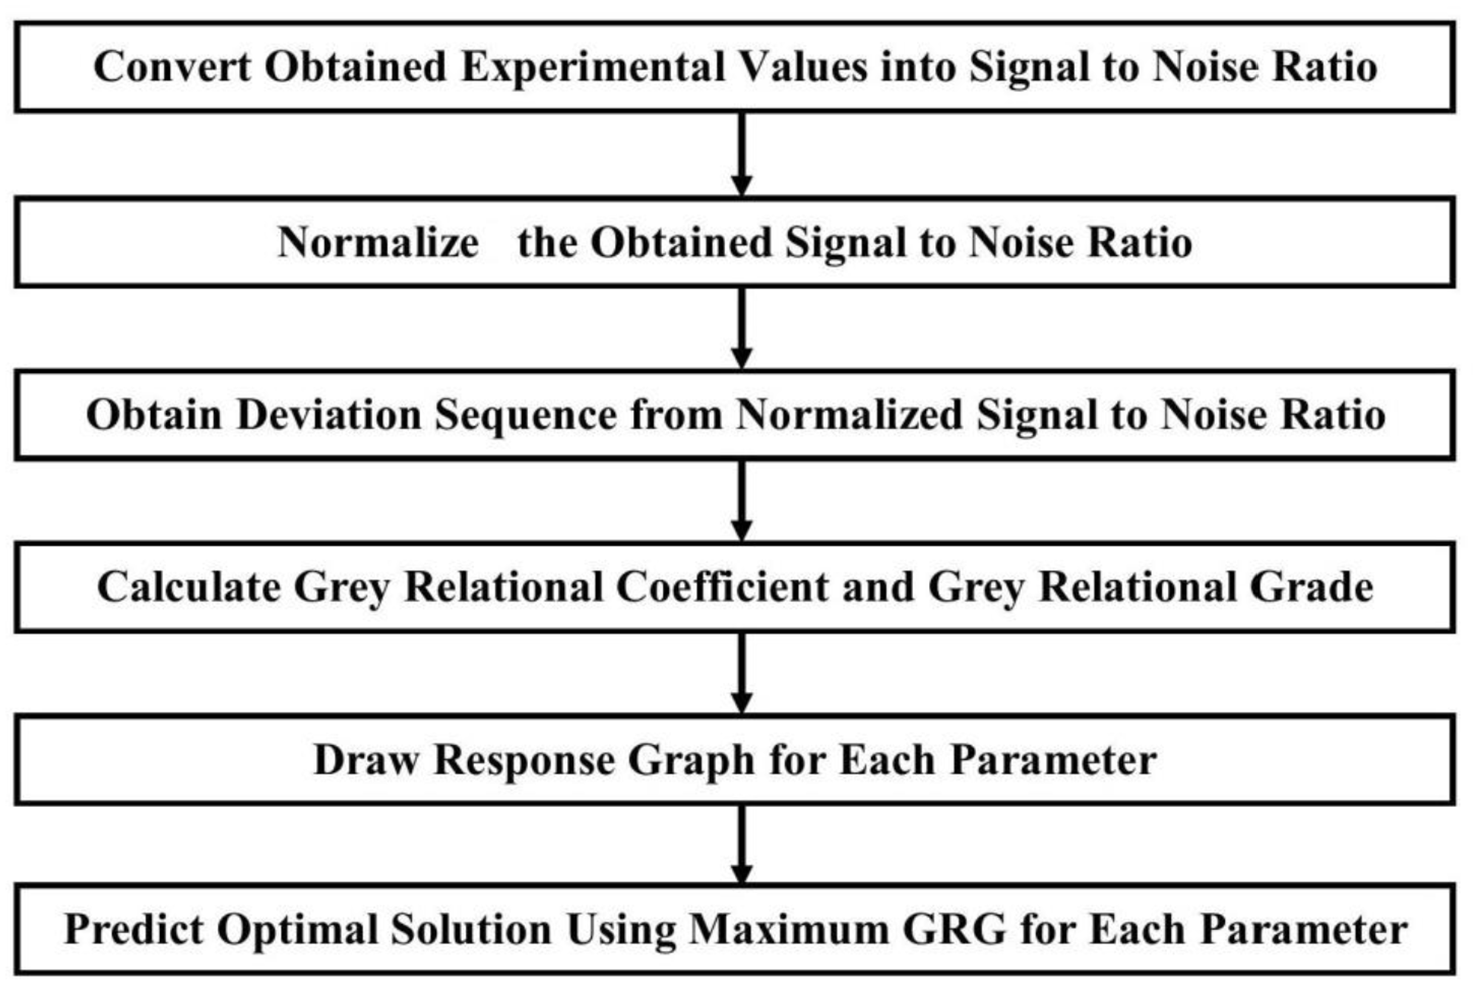
Process chart for Grey relational analysis.
Data pre-processing
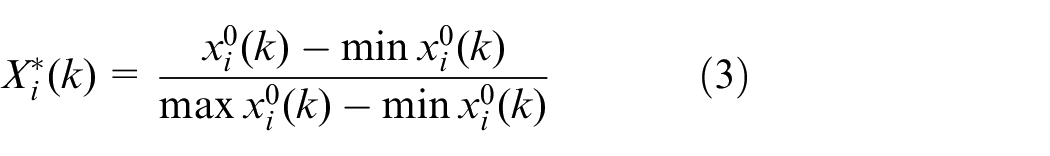
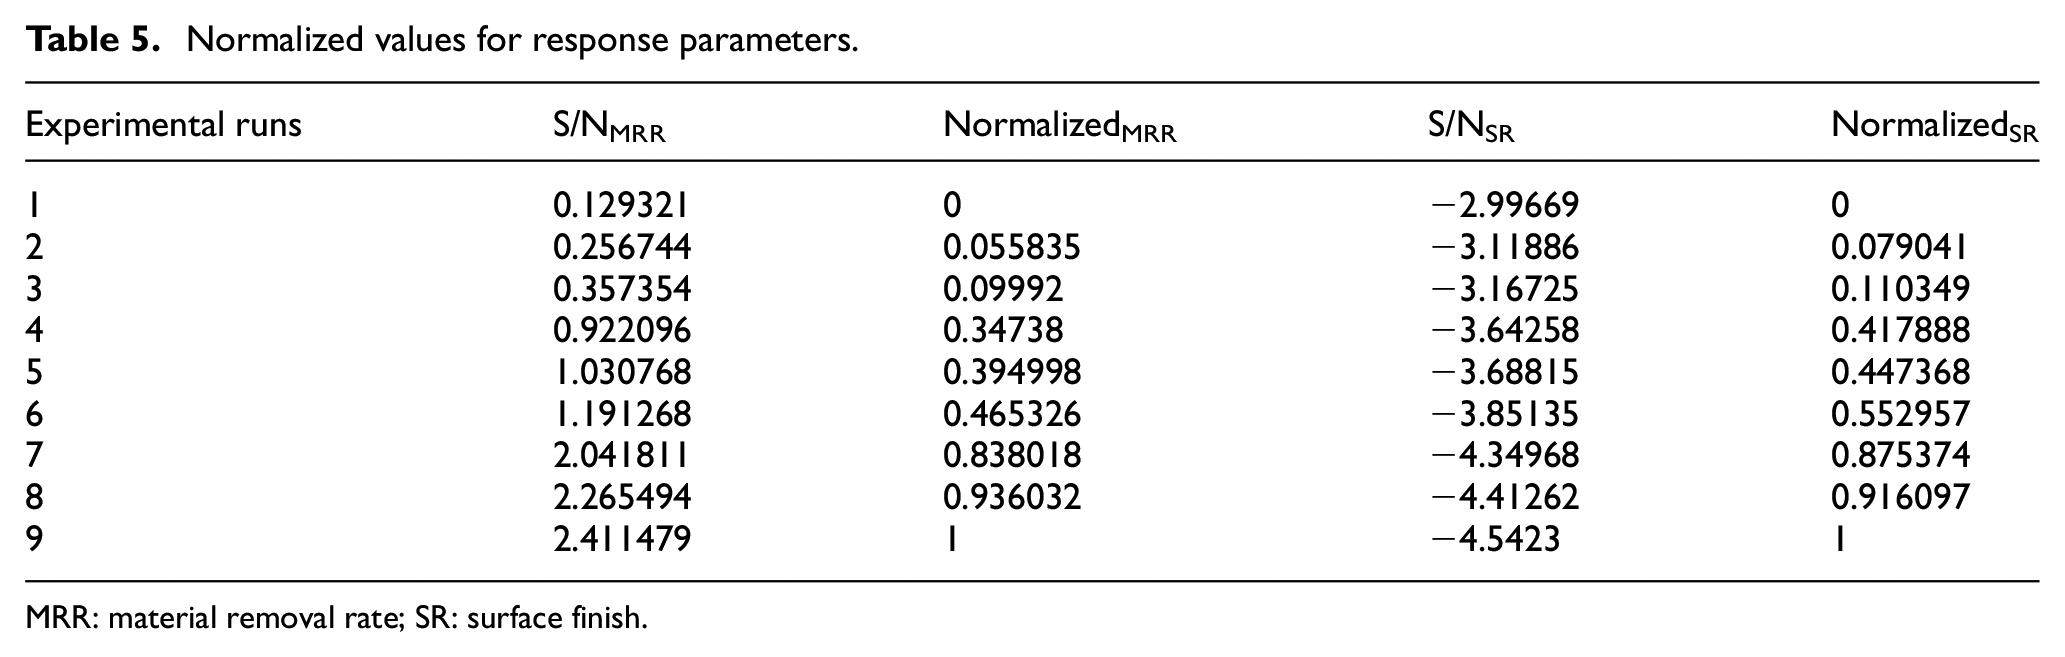
The first step in the GRA methodology is data pre-processing. In this step, the methodology reallocates a definite directive into the comparative directive. In this step, the signal-to-noise ratio achieved for response parameters is transformed into an array of 0 and 1. The principle for response parameters in current research work contains larger is better for MRR and smaller is better for surface roughness. For greater is best, the obtained S/N ratio can be normalized by using the following expression 21
where k denotes the two output quantities MRR and SR.
For the minor is best, the expression for normalizing the S/N ratio will be 22
here,
Normalized values for response parameters.
MRR: material removal rate; SR: surface finish.
GRC and GRG
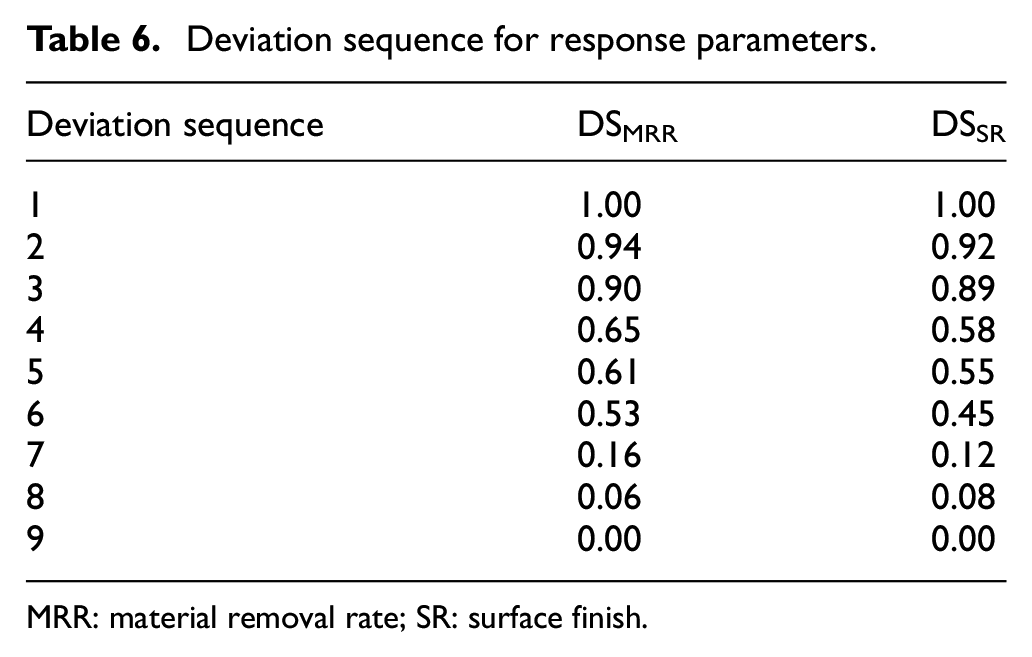
After completing the pre-processing phase, which includes normalization of S/N ratio, the next step is to compute the deviation sequence followed by Grey relational coefficients (GRCs). The value of deviation sequence can be attained as follows

here,
Deviation sequence for response parameters.
MRR: material removal rate; SR: surface finish.
where
The comprehensive performance assessment of the obtained response values is based on GRGs. The mathematical formula for GRG is as follows 22
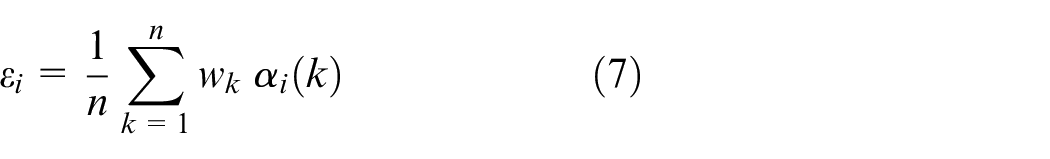
here,
Grey relational coefficient and Grey relational grade.
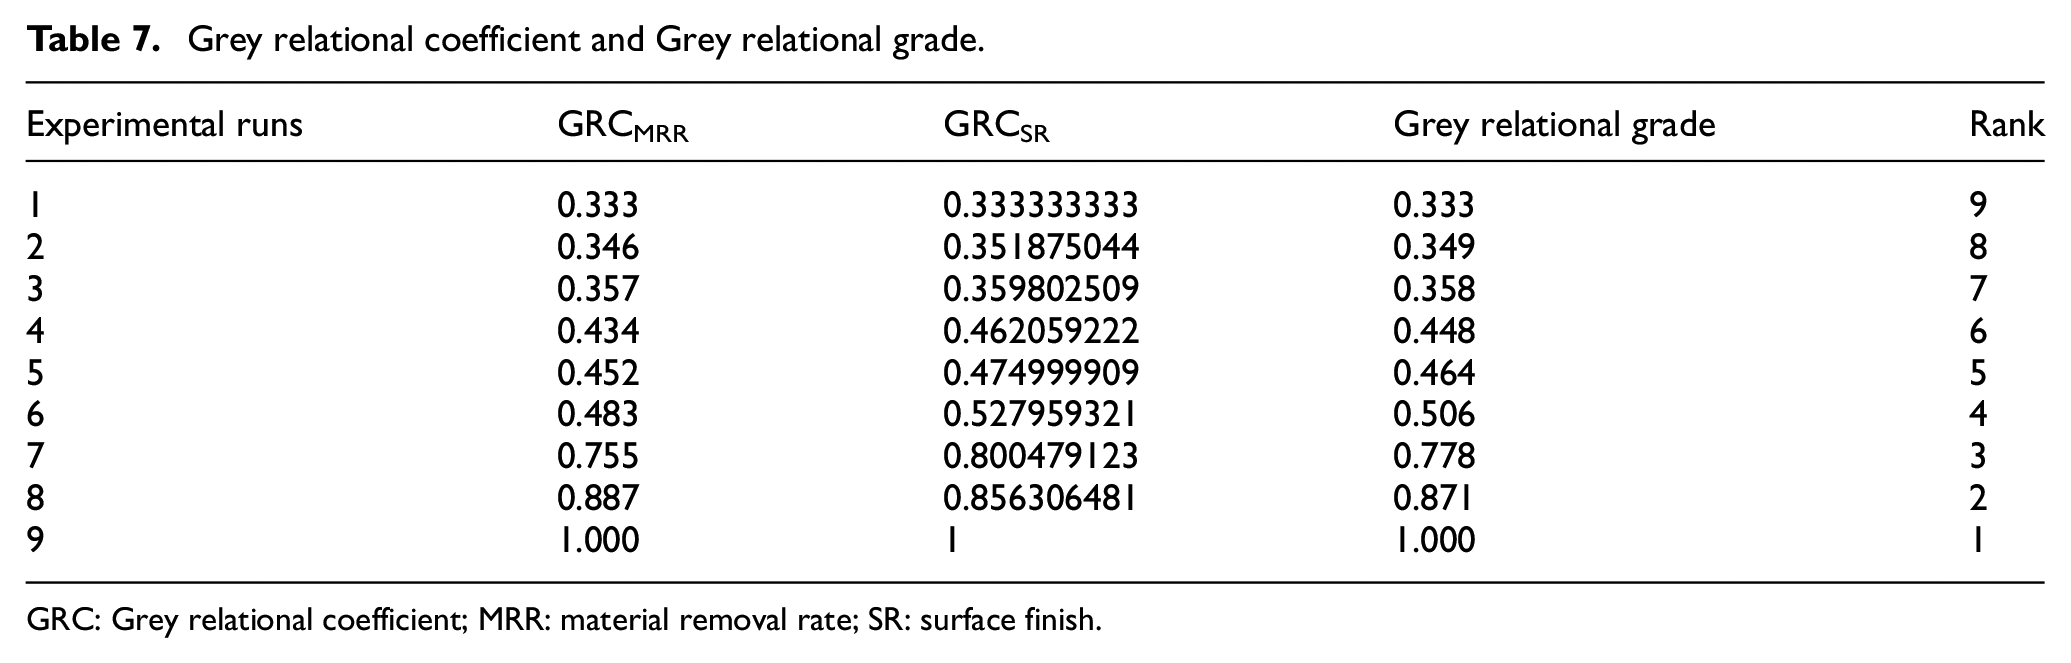
GRC: Grey relational coefficient; MRR: material removal rate; SR: surface finish.
Results and discussion
The decisive measure for optimal drilling procedure is lowest SR and highest MRR. The response parameters, for example, MRR and surface roughness, were analysed for data pre-processing centred upon ‘larger is better’ and ‘smaller is better’ S/N ratio criterion. For that purpose, equations (1) and (2) were involved. The results obtained from the normalization process are presented in Table 5. These results were processed with equation (5) to obtain a deviation sequence, as shown in Table 6. The GRCs for response values were generated by using the identification coefficient as
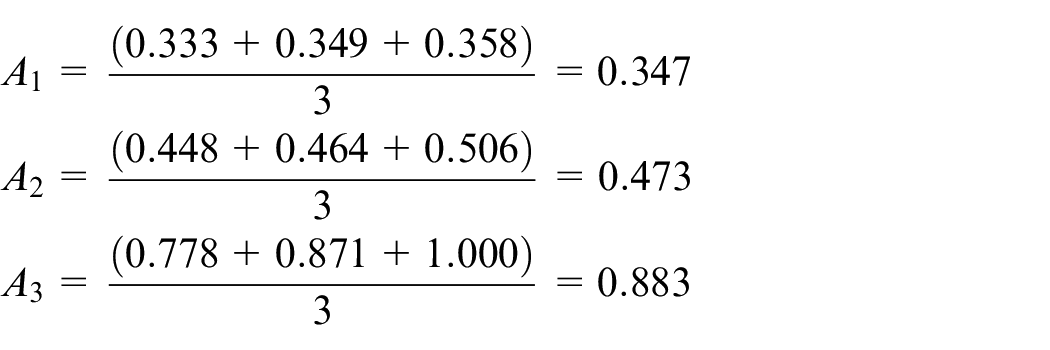
A similar methodology was adopted for calculating average GRG for each input parameter, as shown in Table 8. The maximum value of GRG indicates that input values of parameters have an enduring relationship with response parameters. 22
Average GRG for each parameter.
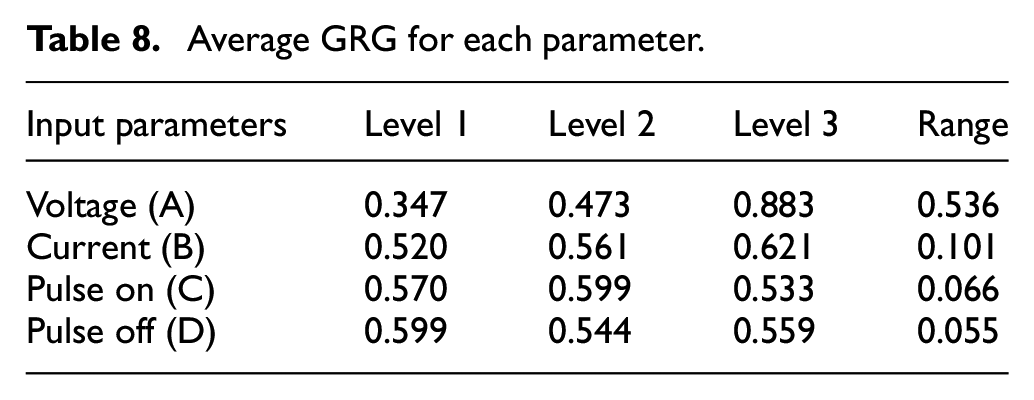
The relation can also be termed as the maximum value of GRG has a direct relation with improved response parameter. With this approach, the optimal set of parameters can be obtained by analysing the maximum value of the GRG. The plot for the mean GRG is plotted in Figure 6 for calculating the effect of each input parameters at variable levels. The obtained combination of parameters A3B3C2D1 gives the maximum value of GRG for each parameter. According to obtained combination, voltage (60 V), current (9 A), pulse on (100 µs) and pulse off (100 µs) yield maximum MRR and minimum surface roughness for drilling in Ti-6Al-4V alloy using EDM process. The difference in maximum to minimum values for average GRG values indicates that the parameter having the highest value of range controls the parameters more effectively. As per Table 7, a voltage with range of 0.536 controls the EDM process more significantly followed by current (0.101), pulse on (0.66) and pulse off (0.055), respectively.
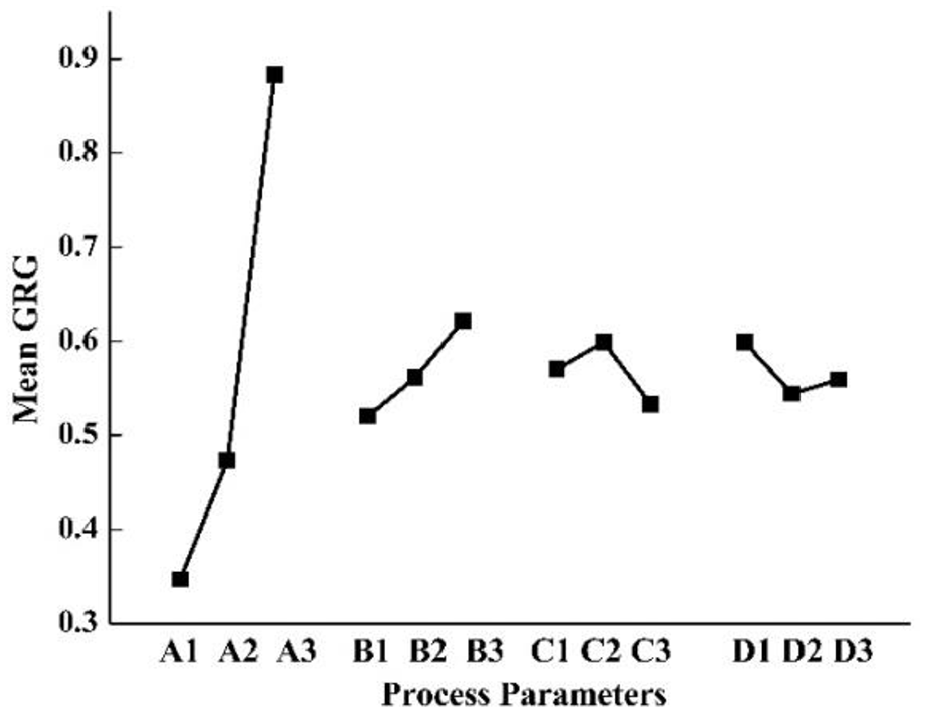
Mean Grey relational grade.
Confirmatory test
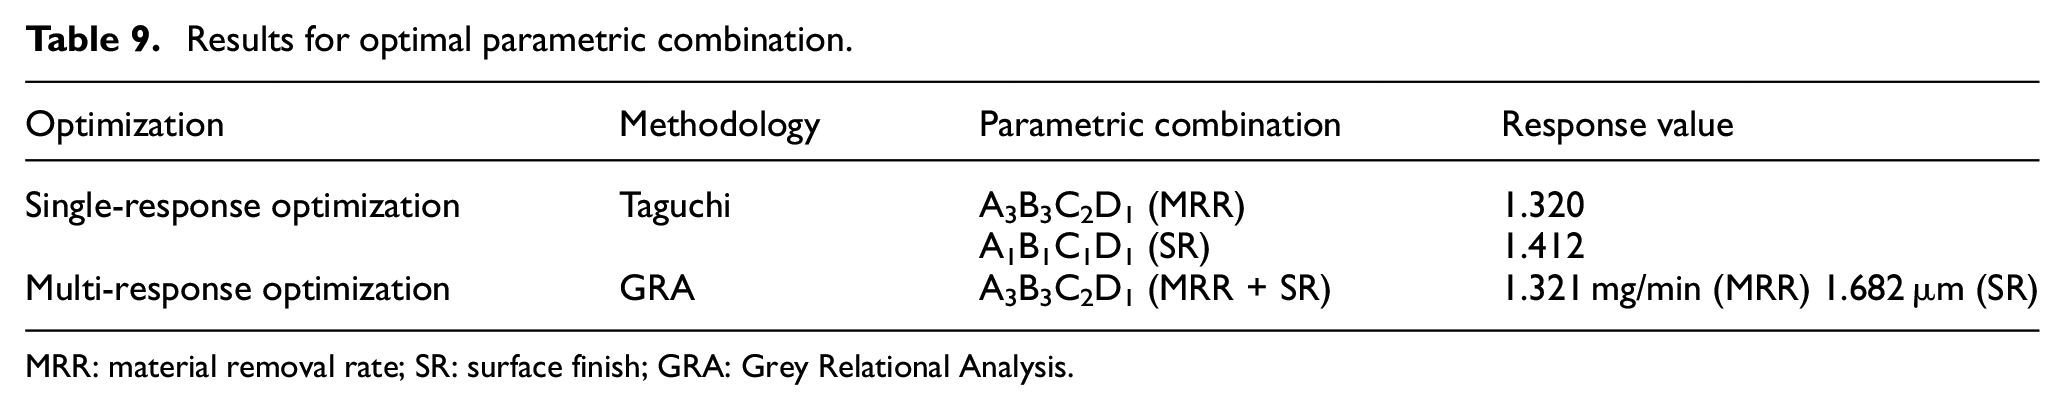
A confirmatory test was performed to authenticate the obtained outcomes from GRA concerning Taguchi’s methodology. The parameter values determined from GRA were selected for performing the confirmatory test. By setting voltage (60 V), current (9 A), pulse on (100 µs) and pulse off (100 µs), the MRR was obtained as 1.321 mg/min, and surface roughness was measured as 1.682 µm. The obtained results possess a good relation with the experimental results obtained as Taguchi’s experimental run 9. Table 9 compares the results obtained by Taguchi and GRA methodologies.
Results for optimal parametric combination.
MRR: material removal rate; SR: surface finish; GRA: Grey Relational Analysis.
Conclusion
The results gathered in this research demonstrated the need for optimizing critical aspects of manufacturing process. As a case study, here, we developed a multi-response optimization technique to find out the best drilling parameters for manufacturing by electric discharge machining of Ti-6Al-4V alloy. The MRR and surface roughness were selected as response. The following critical remarks were found from this research:
The response was individually optimized by Taguchi’s methodology, and optimal parametric combination for each response was observed as A3B3C2D1 for MRR and A1B1C1D1 for surface roughness.
The GRGs were used to obtain the multi-response optimal process parameters for the EDM of Ti-6Al-4V alloy. The optimal setting of input parameters for multi-response optimization was observed as A3B3C2D1 with the input parameters values as voltage (60 V), current (9 A), pulse on (100 µs) and pulse off (100 µs).
The multi-response optimization parameters applied for electric discharge machining of Ti-6Al-4V alloy that is most significant in this process are the voltage and current.
The research confirms that the Grey relational theory can be an effective tool for multi-response parameter optimization in the machining of orthopaedic implants (i.e. Ti-6Al-4V).
Footnotes
Declaration of conflicting interests
The author(s) declared no potential conflicts of interest with respect to the research, authorship and/or publication of this article.
Funding
The author(s) received no financial support for the research, authorship and/or publication of this article.